Rapid Chemical Enrichment by Intermittent Star Formation in GN-z11
Abstract
We interpret the peculiar super-solar nitrogen abundance recently reported by the James Webb Space Telescope observations for GN-z11 () using our state-of-the-art chemical evolution models. The observed CNO ratios can be successfully reproduced – independently of the adopted initial mass function, nucleosynthesis yields, and presence of supermassive (1000) stars – if the galaxy has undergone an intermittent star formation history with a quiescent phase lasting 100 Myr, separating two strong starbursts. Immediately after the second burst, Wolf–Rayet stars (up to ) become the dominant enrichment source, also temporarily (1 Myr) enhancing particular elements (N, F, Na, and Al) and isotopes (13C and 18O). Alternative explanations involving (i) single burst models, also including very massive stars and/or pair-instability supernovae, or (ii) pre-enrichment scenarios fail to match the data. Feedback-regulated, intermittent star formation might be common in early systems. Elemental abundances can be used to test this hypothesis and to get new insights on nuclear and stellar astrophysics.
1 Introduction
The James Webb Space Telescope (JWST) is expected to find the first galaxies – those that host or have hosted metal-free (known as Population III) stars. Surprisingly, though, one of the most distant galaxies detected, GN-z11 at redshift , showed strong metal lines (Bunker et al., 2023). Even more puzzlingly, GN-z11 shows an unusually high ( solar) N/O ratio. Super-massive stars have been suggested (e.g., Charbonnel et al., 2023; Senchyna et al., 2023; Nagele & Umeda, 2023) as the N source in GN-z11. Is such an unusual stellar population truly required, or would it be possible to reproduce the observations more simply with a varying star formation history?
At the end of the ‘dark ages’ of the Universe, the cosmic dawn was heralded by the birth of the first stars and galaxies. The first cosmic star formation is driven by inefficient cooling from hydrogen molecules. Thus, on general grounds, the first stars were expected to be massive, with masses (e.g., Abel et al., 2002; Bromm & Larson, 2004). However, the initial stellar mass depends on complex physical processes, such as gas fragmentation, ionization, accretion, and feedback from newborn stars. Once these processes are included in modern numerical simulations, it seems possible to form lower-mass stars (Greif et al., 2011; Hirano et al., 2014; Rossi et al., 2021), and even binaries (Stacy & Bromm 2013; see also Hartwig et al. 2023 for observational signatures).
The properties of the first stars, i.e., mass, rotation, multiplicity, and magnetic fields, are important for the reionization and chemical enrichment of intergalactic medium, seeding of super-massive black holes (BHs), and gravitational wave emission. However, a direct detection of Pop III stars is still lacking, i.e., no zero-metal star or galaxy has yet been found. Instead, the nature of the first stars has been studied using the second generation of stars born out of gas enriched by Pop III stars.
There is a consensus that second-generation stars can be found among extremely metal-poor (EMP, [Fe/H] ) stars in the Milky Way (Beers & Christlieb, 2005) and in dwarf spheroidals (Skúladóttir et al., 2021). From the analysis of the elemental abundances of EMP stars, it has been deduced that the first enrichment sources were likely to be – stars, which exploded as ‘faint’ supernovae (e.g., Umeda & Nomoto, 2003; Ishigaki et al., 2018). Similar results are obtained also for quasar absorption line systems, such as metal-poor damped Lyman- systems (DLAs), where accurate (barring uncertainties on dust depletion) elemental abundances are measured (Kobayashi et al., 2011; Saccardi et al., 2023).
Theoretically, stellar rotation becomes more important at low metallicities, because weaker stellar winds result in a smaller angular momentum loss than at solar metallicity. As a result, if massive stars are fast rotators, rotational mixing brings CNO cycle products into the convective He-burning layers, and the stellar envelope containing light elements such as C, N, and F may be ejected in stellar winds of Wolf–Rayet (WR) stars (Meynet & Maeder, 2002; Limongi & Chieffi, 2018); without them, the N abundance is a dex lower (see Fig. 9 of Kobayashi & Taylor 2023). WR stars can also explain the detection of highly enhanced HF (hydrogen fluoride) in NGP–190387 at , a dusty star-forming galaxy discovered by the Atacama Large Millimeter/submillimeter Array (ALMA; Franco et al., 2021).
In addition to NGP–190387, and rather unexpectedly, many high-redshift galaxies contain large () amounts of dust (e.g., Ferrara et al., 2022; Inami et al., 2022). Although supernovae are usually considered the main sources at high- (; Todini & Ferrara, 2001; Dayal et al., 2022; Witstok et al., 2023), dust can be produced also by WR stars (e.g., Lau et al., 2022).
The earliest JWST observations have revealed an unexpected abundance of super-early (), massive () galaxies at the bright end () of the ultraviolet luminosity function. These galaxies tend to have very blue spectral slopes (). Hence, the dust produced by massive stars associated with the observed stellar population must have been efficiently evacuated (or destroyed) along with most of the gas by powerful galactic outflows driven by the radiation pressure produced by their compact ( pc), young (20–30 Myr) stellar component (Ferrara et al., 2023; Ziparo et al., 2023; Fiore et al., 2023). Such feedback temporarily quenches star formation (Looser et al., 2023; Gelli et al., 2023) until the gas content of the galaxy is restored by efficient cosmological gas accretion, entailing a duty cycle of 50–100 Myr.
In this Letter, we aim to construct a scenario connecting these observations with galactic chemical evolution (GCE) models. As different chemical elements are produced by stars with different masses on different timescales, their abundance ratios can uniquely constrain the star formation and enrichment histories of galaxies.
| O/H | N/O | ||||||||||
|---|---|---|---|---|---|---|---|---|---|---|---|
| [Gyr] | [Gyr] | [Gyr] | [Gyr] | [Gyr] | [Myr] | [Myr] | [Gyr-1] | ||||
| Single starburst | - | - | 0.001 | 0.0002 | - | 0 | 4.2 | 3 | 22 | 7.787 | |
| Dual starburst (fiducial) | 0.1 | 0.2 | 0.001 | 0.2 | 0.0002 | 0 | 204 | 26 | 20 | 7.850 | 0.246 |
| Dual starburst | 0.05 | 0.1 | 0.001 | 0.2 | 0.0002 | 0 | 103 | 9 | 28 | 7.754 | |
| Dual starburst | 0.1 | 0.1 | 0.001 | 0.2 | 0.0002 | 0 | 103 | 11 | 38 | 7.754 | 0.047 |
| Dual starburst | 0.1 | 0.2 | 0.01 | 0.2 | 0.0002 | 0 | 204 | 34 | 41 | 7.769 | 0.208 |
| Dual starburst | 0.1 | 0.2 | 0.001 | 0.2 | 0.001 | 0 | 205 | 27 | 33 | 7.864 | |
| Pre-enrichment | - | - | 0.001 | 0.0002 | - | 0.3 | 2.8 | 2 | 58 | 7.768 | |
| GN-z11 |
2 Models
2.1 Galactic chemical evolution models
We use the GCE code from Kobayashi et al. (2000), implementing the so-called one-zone model, which integrates the following equation:
| (1) | |||||
where the mass fraction of each element in gas-phase ( denotes the gas fraction111Ratio of gas mass to the total mass provided by gas, stars in the galaxy, and the gas “reservoir”, i.e. , where is the initial gas fraction.) increases via element production (, and ); the other terms are star formation (), gas inflow , and outflow () rates, respectively. The model assumes instantaneous mixing of the elements but not instantaneous recycling. A complete description can be found in Kobayashi et al. (2000) and Kobayashi & Taylor (2023, hereafter KT23). The adopted parameters are summarized in Table 1.
The code includes the latest nucleosynthesis yields of asymptotic giant branch (AGB) stars, super-AGB stars, and core-collapse supernovae (including hypernovae and failed supernovae) from Kobayashi et al. (2020a, hereafter K20), as well as WR stars described in § 4.1. Type Ia supernovae are also included () using the model in Kobayashi & Nomoto (2009) and yields from Kobayashi et al. (2020b). However, their contribution becomes important only at [Fe/H] .
The compositions of the infalling gas () is set to be primordial (see § 2.2.1 of K20). All models presented in this Letter have no stars at the start. Our fiducial model assumes initial gas fraction , but we also present a pre-enriched model with and initial composition () deduced from another GCE model.
The initial mass function (IMF), taken from Kroupa (2008), is a broken power law in three mass ranges. Later in §4, we vary the massive-end slope , and lower and upper mass limits [] for the Population I/II and III stars, separately. These two IMFs are switched at the threshold (absolute) metallicity .
3 Results
3.1 Single burst models
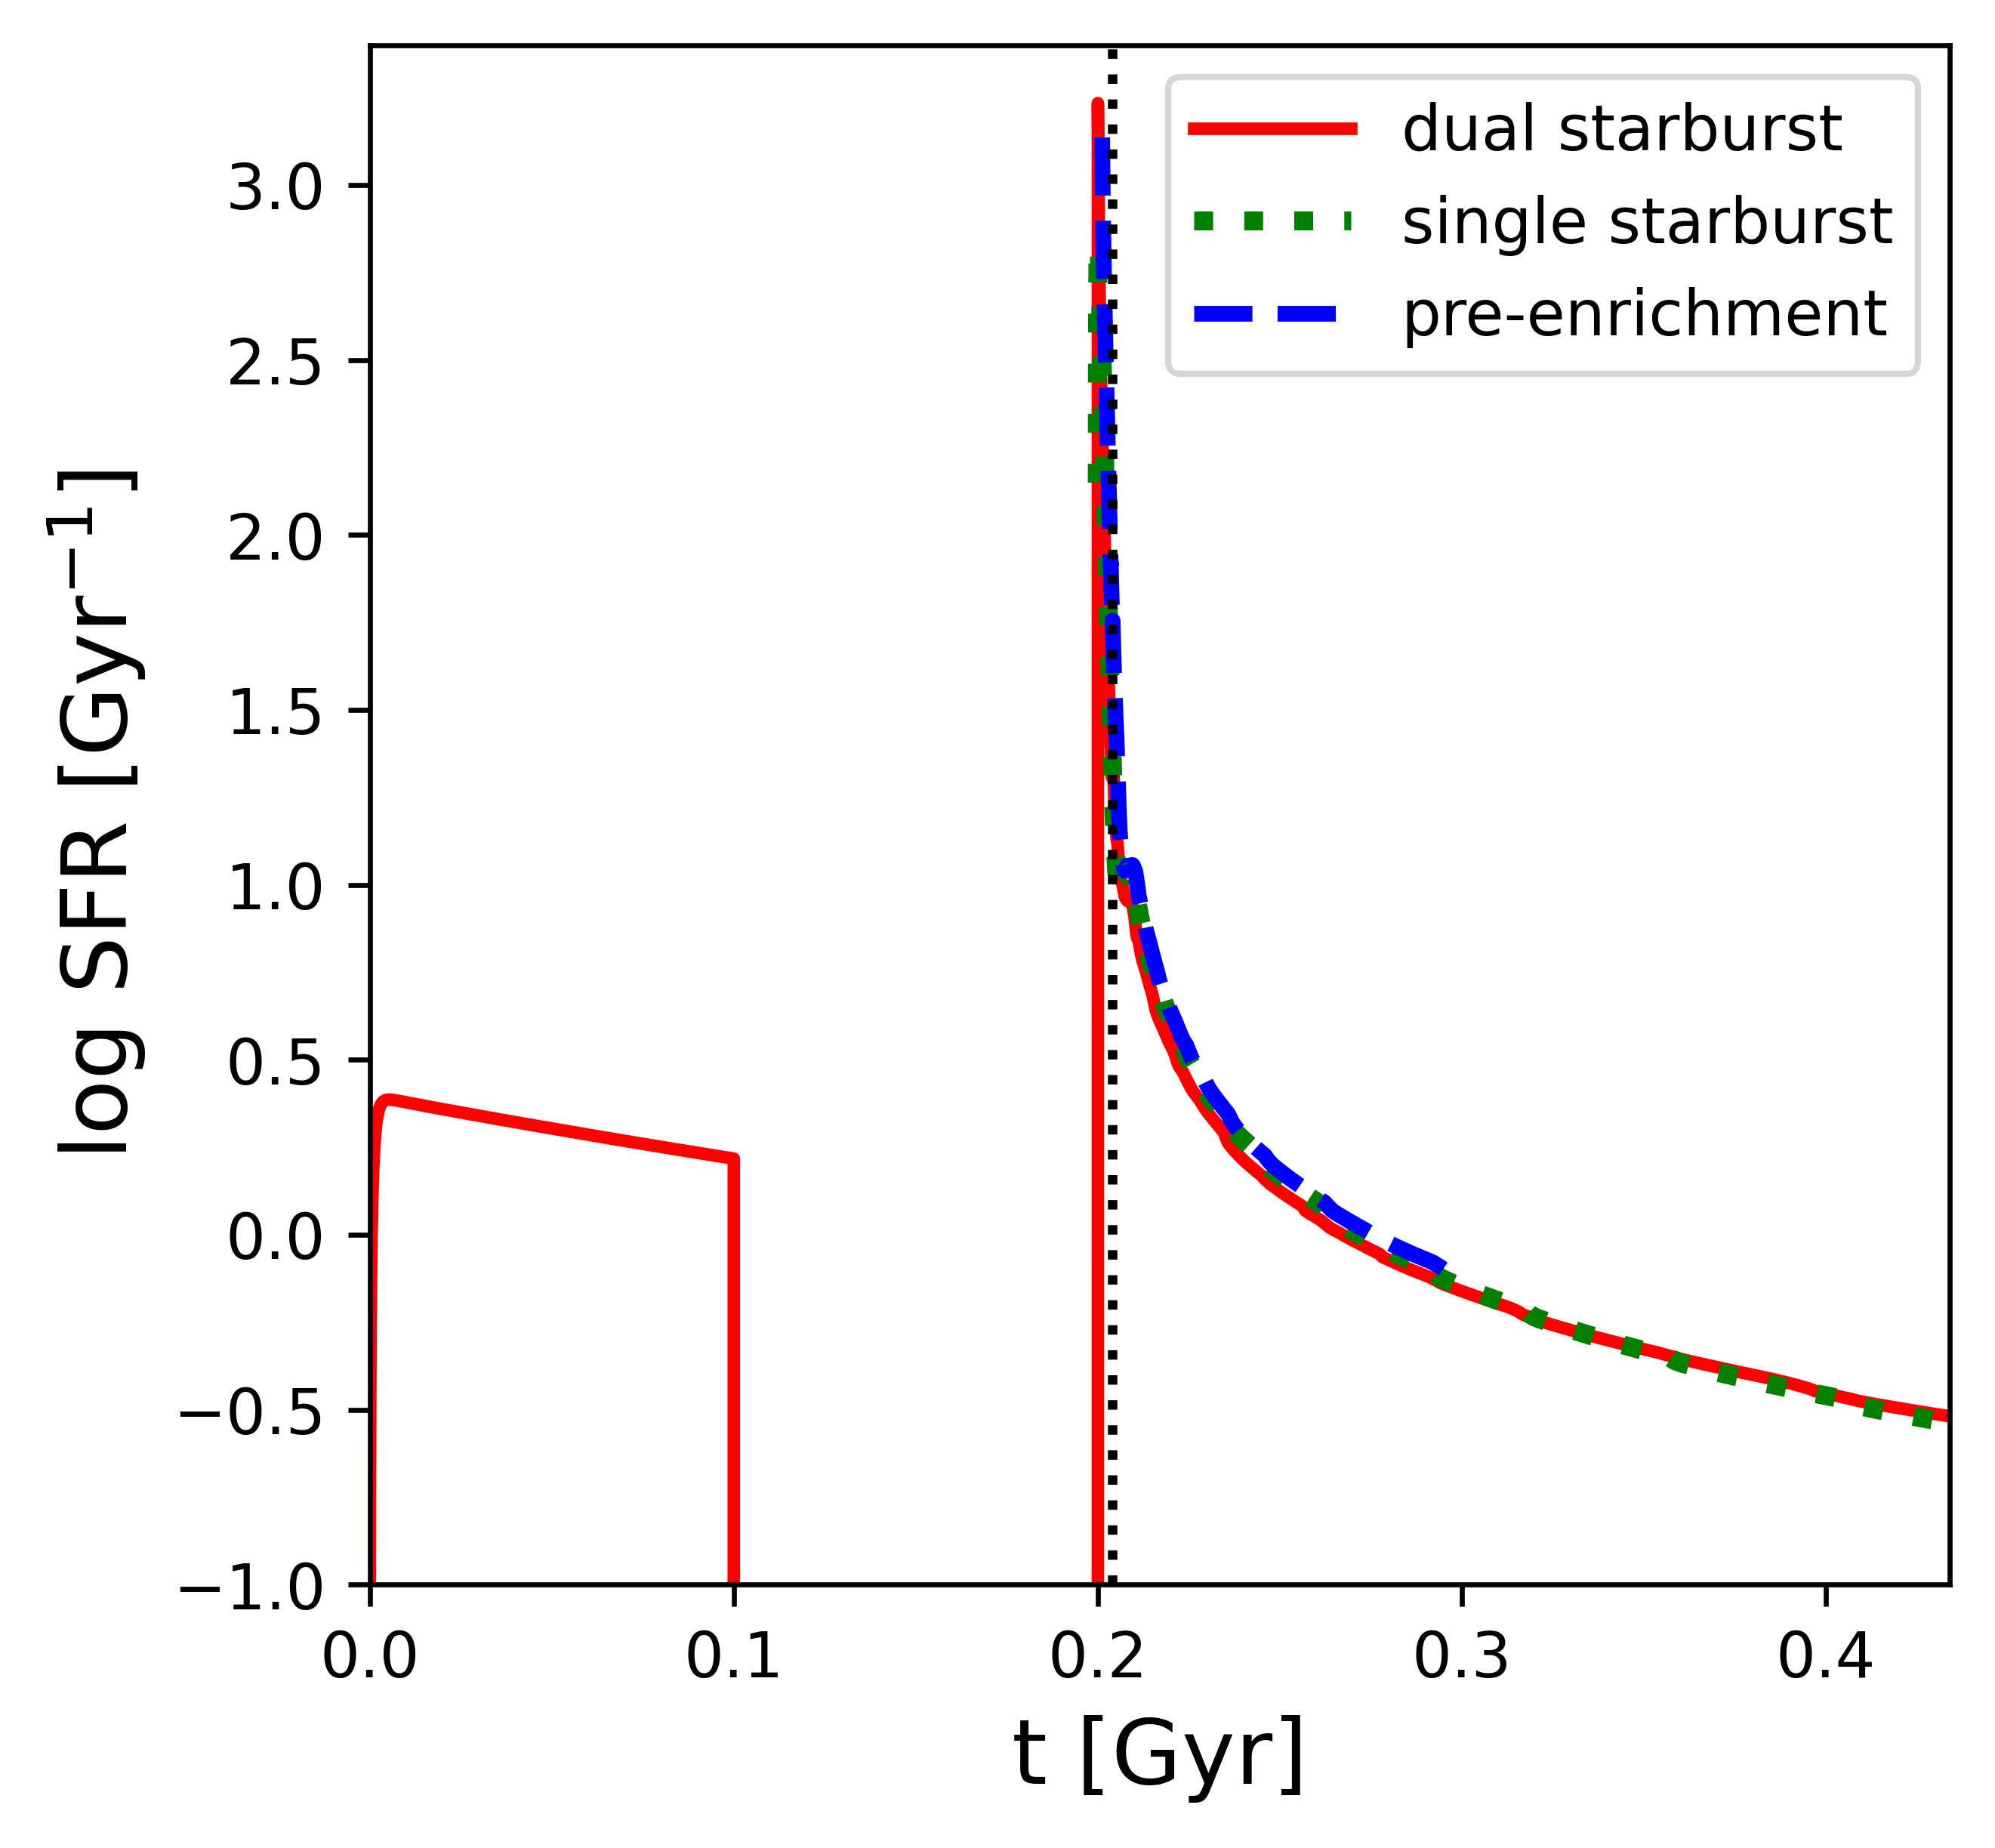
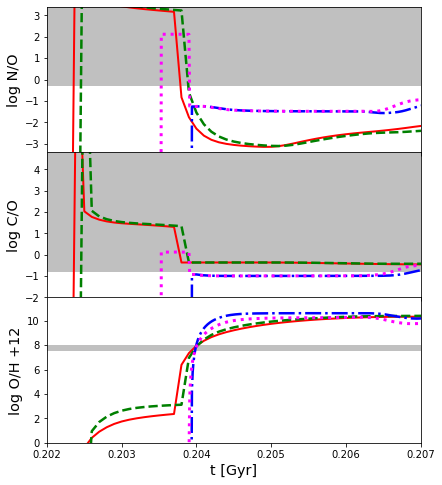
We first assume a single starburst starting 4 Myr before the observed epoch; this is because the estimated age of GN-z11 stellar populations is 10 Myr (Bunker et al., 2023). The corresponding star formation rate per unit mass is shown as a green short-dashed line in Figure 1.
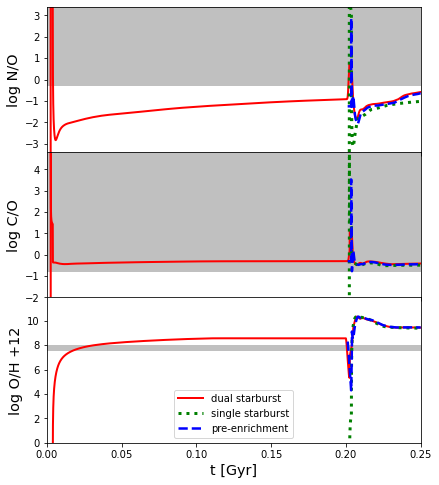
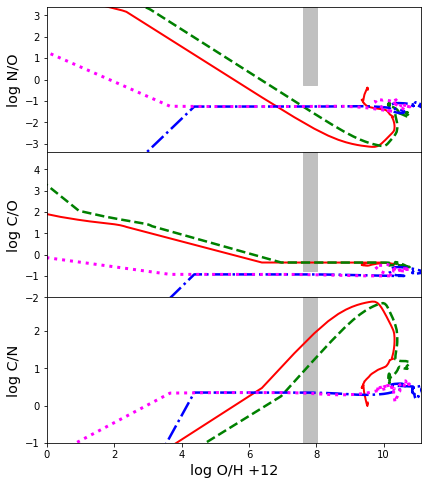
The left panels of Figure 2 show the elemental abundance ratios of the interstellar medium (ISM) predicted by the GCE models as a function of time, while the middle panels O/H , a commonly used proxy for metallicity222The solar oxygen abundance adopted in K20 is 8.76.. At low metallicities, WR stars produce very high (C,N)/O ratios, which quickly decrease due to the large O production from supernovae. The N/O ratio increases again at high metallicities because of ‘primary’ production of N from AGB stars, as well as ‘secondary’ production of N (from initially existing CNO) in massive stars. For the same reason, the initial C/N ratio increase is followed by a rapid drop at high metallicities.
In general, a shorter shifts the CNO tracks to the right in the middle panels. However, the adopted and values (Table 1) are very short, compared with those for present-day massive galaxies. Even shorter values do not affect the solution any further. The CNO tracks are insensitive to . In conclusion, although N/O can be high at very low or very high metallicities, with a single starburst it is not possible to reproduce the observed ratio of GN-z11 at the observed oxygen abundance (7.82; Cameron et al., 2023).
3.2 Dual burst models
We have seen that WR stars can potentially produce high (C,N)/O ratios, but only at metallicities much lower than observed. However, there is a way to overcome the problem, and this consists of assuming a dual starburst model. We now assume that star formation starts333Results are insensitive to the formation epoch, and thus pre-enrichment from Pop III stars formed at is included in this subsection. at and continues for 100 Myr (Fig. 1); the infall and star formation timescales are set to and Gyr, respectively444The allowed range is –1 Gyr, so that the ISM is sufficiently enriched by the initial star formation. Results are insensitive to ..
The results of this fiducial model (red curve) are shown in the left and middle panels of Figure 2. After the first burst the metallicity already reaches O/H , and the evolutionary tracks up to this point are similar to those for the single burst case.
Then, star formation is assumed to be completely quenched for 100 Myr555A marginally consistent, lower-quality fit can nevertheless be obtained also without a quiescent interval between the two bursts., possibly due to feedback associated with the onset of an outflow. At Gyr, the secondary infall ( Gyr) of primordial gas occurs, which initially causes dilution reducing the metallicity. As a more extreme, second starburst ( Myr)666The condition to reach the observed N/O is Myr. is triggered, WR stars quickly enhance (C,N)/O ratios until supernovae produce a large amount of O. The O abundance peaks at Gyr, which corresponds to the lifetime of stars, and gradually decreases until Gyr. This, along with secondary N production from metal-rich SNe and primary N production from AGB stars (lifetime 40–150 Myr), leads to a final N/O increase.
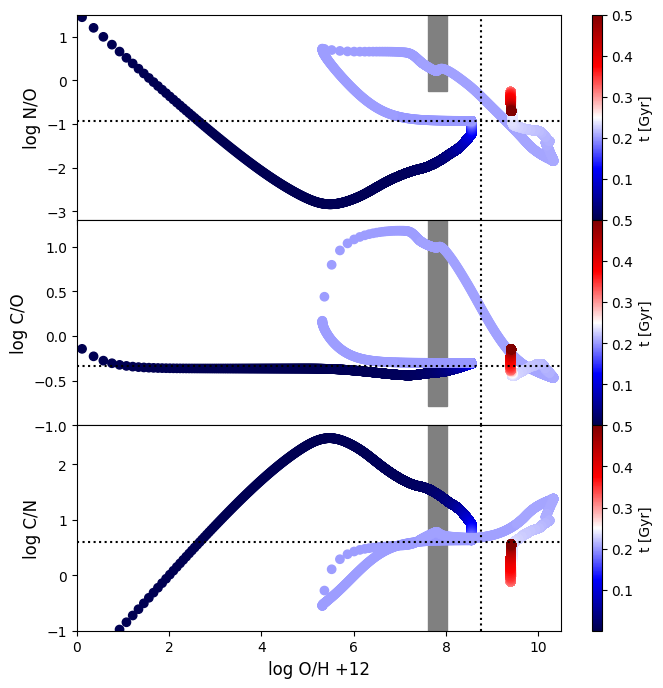
This N/O evolution predicted by the dual burst fiducial model crosses the observed range only once, at Gyr, i.e., 4 Myr after the onset of the second burst (the right panels of Figure 2). The time spent in the data box is very short (0.6 Myr). Hence, we conclude that N-enriched objects similar to GN-z11 might be rare. On the other hand, lower ratios than in GN-z11 (e.g., N/O at in Isobe et al. 2023) can be reproduced in our scenario with longer . In this case, the evolution is slower and these objects become more common.
At the observed epoch, the star formation rate in the fiducial model is 20 Gyr-1. This is in excellent agreement with the observed value 19 yr-1, provided the total stellar mass is . The amount of stars formed during the first burst is only 16% of the final stellar mass. The mass-weighted age is 26 Myr, which is comparable to the estimated value of 10 Myr. With shorter first bursts and/or shorter quiescence intervals, the mass-weighted age could be made as short as 10 Myr.
3.3 Pre-enrichment?
An alternative way to change the gas metallicity before the first starburst is by pre-enrichment from external galaxies. This model is shown in Figure 2, the left and middle panels (blue long-dashed curve), where it is also compared with the single and dual burst cases.
The pre-enriched model assumes the same and as in the single burst one (Table 1), but with a gas chemical composition, , taken from another (independent) GCE model with and Gyr. We set the initial gas fraction . These and values are very similar to those obtained for the dual starburst model during the interval after the first burst, i.e., at –0.2 Gyr. However, in this case, the initial stellar fraction is zero, which is the key difference from the dual burst model (red curve).
The pre-enrichment model starts at O/H . Due to the dilution with the infalling pristine gas, the metallicity (horizontally) decreases keeping the same CNO ratios. The (C,N)/O ratios quickly (vertically) increase due to enrichment from WR stars, and they return to their initial composition values. Hence, the triangle track does not cross the observed range. The above results are insensitive to the parameters of and . By changing the initial gas fraction and/or the initial composition , we cannot find any tracks that match the observed abundance range. We conclude that this simple pre-enrichment prescription cannot solve the problem at hand.
4 IMF dependence
4.1 Fate of massive stars
While the ultimate fate of stars depends on their initial mass777With the term initial mass we refer to single stars, as stars can lose their envelope also due to binary interactions., the final mass and nucleosynthesis yields are determined by stellar mass-loss (e.g., Vink et al., 2011) as well as convection treatment and nuclear reaction rates. We include nucleosynthesis yields covering a full mass range up to as follows.
10–50: These stars become core-collapse supernovae. Although Limongi & Chieffi (2018) provided yields including explosive nucleosynthesis, their yields do not match observations in the Milky Way, probably because of the lack of hypernovae and mixing fallback. Therefore, we combine their stellar wind yields (see below) with the explosive nucleosynthesis yields of CO cores from K20, which result in an excellent agreement with the observations of almost all elements888At , some stars in the range 13–40 may explode as ‘faint’ supernovae/hypernovae. These stars produce only a tiny amount of iron because of the relatively large remnant BH (5). Their contribution is negligible and is not included here.. Roughly half of stars with 20–50 are assumed to explode as hypernovae leaving a BH, probably due to rotation and/or binary interaction. The exact fraction of hypernovae can be determined from chemodynamical simulations of a Milky Way-type galaxy; Kobayashi & Nakasato (2011) find for . All stars with 13–20, and the rest of stars with 20–30, explode as normal core-collapse supernovae with erg of explosion energy, leaving a neutron star. The rest of stars with 30–50 are assumed to be ‘failed’ supernovae, which form a 10 BH. This is based on the unsuccessful explosion simulations of such massive stars (Janka, 2012; Burrows & Vartanyan, 2021) and the lack of massive progenitors expected at supernova locations in HST data (Smartt, 2009), but the threshold was determined from GCE models (Fig. 4 of K20).
60–140: Stars above 90 become pulsating pair-instability supernovae. Their evolution and nucleosynthesis are uncertain, but they will leave a 100 BH. Although this phase is not calculated, we use the stellar wind yields from Limongi & Chieffi (2018) for 13–120 with four different metallicities and three rotational velocities. With rotation, lower-mass stars become WR stars. We apply rotating models to a metallicity-dependent fraction (given above) of the stars; among these, 3% (97%) rotate at 300 (150) km s-1. The remaining fraction of stars are assumed to be non-rotating.
160–280: If the masses of the first stars are 160–280, they explode as pair-instability supernovae (PISNe; Barkat et al., 1967; Heger & Woosley, 2002; Nomoto et al., 2013; Takahashi et al., 2018) leaving no remnant. PISNe have a very distinct nucleosynthetic pattern. Although considerable effort has been made to detect such a characteristic pattern, no observational signature for the existence of PISNe has yet been convincingly found, neither in EMP stars (Cayrel et al., 2004; Aguado et al., 2023) nor in DLAs (Kobayashi et al., 2011; Saccardi et al., 2023). We apply a mix of non-magnetic, rotating and non-rotating models from Takahashi et al. (2018) at only, using described above.
300–1000: Very-massive stars (VMSs; 100) have been solidly identified in the Tarantula Nebula of the Large Magellanic Cloud (Schneider et al., 2018). Various stellar evolution models (e.g., Szécsi et al., 2022), and some nucleosynthesis yields (Yusof et al., 2013; Martinet et al., 2022; Volpato et al., 2023) exist, although the results significantly depend on the input physics. We take the nucleosynthesis yields of the ‘max’ mass-loss models from Volpato et al. (2023) for 300–1000 and 100–1000 at metallicity and , respectively. We also take the stellar wind yields of the V11 models from Higgins et al. (2023) for 100–500 at , assuming very strong winds from Vink et al. (2011). N production is seen as a result of the CNO cycle during core H-burning. These yields do not include explosive nucleosynthesis (i.e., stellar winds only).
We do not include super-massive stars (SMSs; 1000) in our GCE models, as their properties and yields are uncertain. SMSs are originally defined as those that collapse on the general relativistic instability before igniting H-burning (Fuller et al., 1986). Incomplete core H-burning of metal-enhanced stars with has been proposed as an explanation for the abundance anomaly (Denissenkov & Hartwick, 2014), and the so-called O–Na anti-correlation (Kraft et al., 1997) often seen in globular clusters of the Milky Way. These stars have been invoked also to account for the high N/O ratio measured in GN-z11 (Nagele & Umeda, 2023), although lower-mass stars survive until He-burning and enhance C and O. However, the structure and evolution depend not only on their initial masses and metallicities, but also their formation path (Woods et al., 2019). In a very narrow mass range, zero-metallicity stars may explode as general relativistic supernovae (Chen et al., 2014), which will have a significant effect and would be inconsistent with the observation of GN-z11.
4.2 CNO evolution
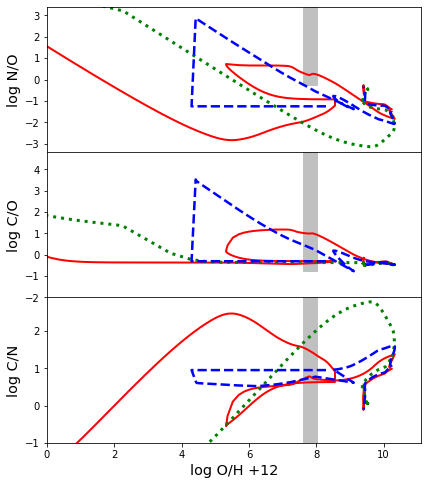
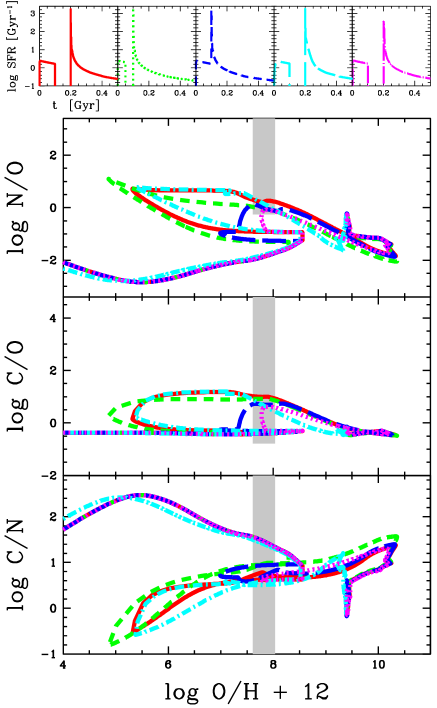
The IMF dependence on the CNO tracks are shown in Figure 3 as a function of time (left) and ISM oxygen abundance (right). In order to maximize the impact of VMSs, a top-heavy IMF is assumed for Pop III stars with a flat mass distribution (). At low metallicities, compared to the standard IMF (red solid lines), a top-heavy999We adopt for Pop III to minimize O production from core-collapse supernovae. Pop III IMF up to (green short-dashed) can produce up to dex systematic increase of N/O. If the Pop III IMF is extended up to (blue long-dashed), PISNe produce a large amount of Fe and also O, and the initial (C,N)/O ratios become very low. Finally, if the Pop III IMF is extended up to (magenta dotted), the initial (C,N)/O ratios can become high again due to the VMS contribution (§4.1).
In the last two models with , while PISNe are assumed to occur only from Pop III stars, VMSs produce some metals via winds also at higher metallicities. This causes a dex increase of N at intermediate metallicities ( O/H ) which is however insufficient to match the observed range of GN-z11. Larger values do not increase the N/O ratio further because of the Pop I/II IMF slope of . The VMS contribution is washed out once AGB stars start producing N at high metallicities. Also note that VMSs decrease C (as it is transformed into N), and these two models do not reproduce the observed C/O ratio either.
5 Conclusions
We have presented, for the first time, a chemical evolution model that naturally explains the “anomalous” elemental abundance ratios of GN-z11. Without changing the IMF or the nucleosynthesis yields, the observed data can be reproduced if this galaxy has experienced a star formation history featuring a quiescent phase, lasting 100 Myr, separating two strong starbursts. Importantly, the observed ratios cannot be explained by single burst models with VMSs and/or PISNe. Essentially, this is because VMSs do not increase N/O sufficiently, while PISNe rather decrease N/O ratios.
In our successful models, prior to the observed epoch (), the galaxy has been chemically enriched. This pre-enrichment is likely caused by internal, rather than external, sources. For a brief period after the second burst, WR stars (up to ) become the dominant enrichment source, which explains the high (C,N)/O ratios at the observed metallicity of GN-z11. WR stars also enhance particular elements (N, F, Na, and Al; see Appendix) and isotopes (13C and 18O); the prediction of high fluorine abundance can be tested with ALMA (e.g., Franco et al., 2021).
Our results strongly suggest that super-early galaxies undergo a feedback-regulated, stochastic (Pallottini & Ferrara, 2023), or even intermittent (Cole et al., 2023), star formation history. In spite of this, detecting the chemical anomalies (e.g. high N/O) produced by multiple bursts might not be easy as the chemical evolution proceeds quite rapidly, thus erasing this signature on short time scales ( Myr). This scenario is also consistent with the presence of strong radiation-driven outflows (Carniani et al., 2023), which are necessary to clear the dust produced by the observed stars in super-early galaxies like GN-z11 (Ferrara et al., 2023; Ziparo et al., 2023; Fiore et al., 2023). At lower redshifts (), dust instead may accumulate inside galaxies, which might correspond to dusty galaxies observed by ALMA (e.g., Dayal et al., 2022).
Our findings highlight the potential of chemical evolution models and data on elemental abundances (and isotopic ratios), not only to investigate the physics and evolution of the most distant galaxies but also to provide new constraints on nuclear and stellar astrophysics.
Data Availability
The data underlying this article will be shared on reasonable request to the corresponding author.
Our conclusions are based on the following parameter study. The left panels of Figure 4 show a variety of dual burst models that can reproduce the observations, compared to the fiducial model (red solid line); the differences are small depending on the details of the dual burst models. (i) If the duration of the first burst and/or interval between the two bursts are short ( Gyr; green short-dashed), similar CNO tracks are obtained, with a slightly lower peak N/O ratio. (ii) If no interval ( Gyr; blue long-dashed) is assumed, the peak N/O ratio is only marginally consistent with data, since the metallicity decrease due to dilution after the secondary gas inflow is weaker. (iii) Similar CNO tracks are also obtained with longer inflow timescales ( Gyr), which also result in a higher star formation rate at the observed epoch. (iv) Finally, with a weaker second burst ( Gyr), the N/O ratio becomes lower, and the condition to reach the observed N/O is Myr.
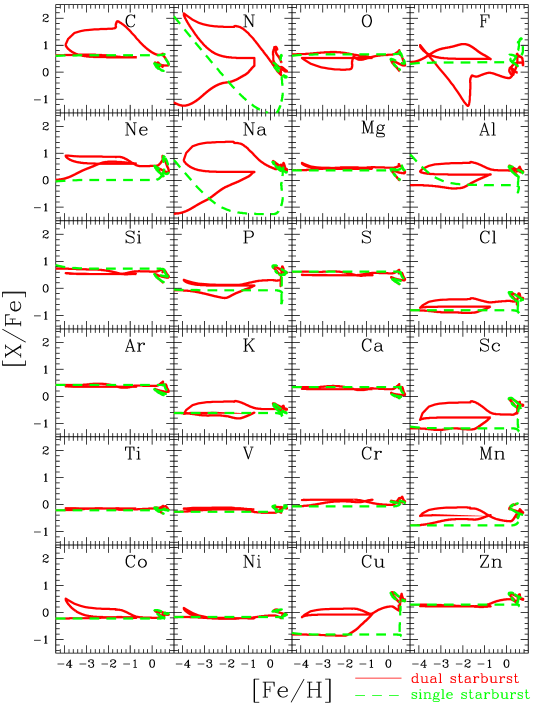
Our GCE models can predict elemental abundances and isotopic ratios, self-consistently. The right panels of Figure 4 shows the [X/Fe]–[Fe/H] relations of all stable elements from C to Zn, for our fiducial, dual burst model (red solid line) and a single burst model (green dashed). For GN-z11, it would be difficult to measure the abundances of elements other than CNO. Nevertheless, these predictions can be compared with peculiar stars in the Milky Way to study its formation process.
References
- Abel et al. (2002) Abel, T., Bryan, G. L., & Norman, M. L. 2002, Science, 295, 93, doi: 10.1126/science.295.5552.93
- Aguado et al. (2023) Aguado, D. S., Salvadori, S., Skúladóttir, Á., et al. 2023, MNRAS, 520, 866, doi: 10.1093/mnras/stad164
- Barkat et al. (1967) Barkat, Z., Rakavy, G., & Sack, N. 1967, Phys. Rev. Lett., 18, 379, doi: 10.1103/PhysRevLett.18.379
- Beers & Christlieb (2005) Beers, T. C., & Christlieb, N. 2005, ARA&A, 43, 531, doi: 10.1146/annurev.astro.42.053102.134057
- Bekki & Tsujimoto (2023) Bekki, K., & Tsujimoto, T. 2023, MNRAS, 526, L26, doi: 10.1093/mnrasl/slad108
- Bromm & Larson (2004) Bromm, V., & Larson, R. B. 2004, ARA&A, 42, 79, doi: 10.1146/annurev.astro.42.053102.134034
- Bunker et al. (2023) Bunker, A. J., Saxena, A., Cameron, A. J., et al. 2023, A&A, 677, A88, doi: 10.1051/0004-6361/202346159
- Burrows & Vartanyan (2021) Burrows, A., & Vartanyan, D. 2021, Nature, 589, 29, doi: 10.1038/s41586-020-03059-w
- Cameron et al. (2023) Cameron, A. J., Katz, H., Rey, M. P., & Saxena, A. 2023, MNRAS, 523, 3516, doi: 10.1093/mnras/stad1579
- Carniani et al. (2023) Carniani, S., Venturi, G., Parlanti, E., et al. 2023, arXiv e-prints, arXiv:2306.11801, doi: 10.48550/arXiv.2306.11801
- Cayrel et al. (2004) Cayrel, R., Depagne, E., Spite, M., et al. 2004, A&A, 416, 1117, doi: 10.1051/0004-6361:20034074
- Charbonnel et al. (2023) Charbonnel, C., Schaerer, D., Prantzos, N., et al. 2023, A&A, 673, L7, doi: 10.1051/0004-6361/202346410
- Chen et al. (2014) Chen, K.-J., Heger, A., Woosley, S., et al. 2014, ApJ, 790, 162, doi: 10.1088/0004-637X/790/2/162
- Cole et al. (2023) Cole, J. W., Papovich, C., Finkelstein, S. L., et al. 2023, arXiv e-prints, arXiv:2312.10152, doi: 10.48550/arXiv.2312.10152
- Dayal et al. (2022) Dayal, P., Ferrara, A., Sommovigo, L., et al. 2022, MNRAS, 512, 989, doi: 10.1093/mnras/stac537
- Denissenkov & Hartwick (2014) Denissenkov, P. A., & Hartwick, F. D. A. 2014, MNRAS, 437, L21, doi: 10.1093/mnrasl/slt133
- Ferrara et al. (2023) Ferrara, A., Pallottini, A., & Dayal, P. 2023, MNRAS, 522, 3986, doi: 10.1093/mnras/stad1095
- Ferrara et al. (2022) Ferrara, A., Sommovigo, L., Dayal, P., et al. 2022, MNRAS, 512, 58, doi: 10.1093/mnras/stac460
- Fiore et al. (2023) Fiore, F., Ferrara, A., Bischetti, M., Feruglio, C., & Travascio, A. 2023, ApJ, 943, L27, doi: 10.3847/2041-8213/acb5f2
- Franco et al. (2021) Franco, M., Coppin, K. E. K., Geach, J. E., et al. 2021, Nature Astronomy, 5, 1240, doi: 10.1038/s41550-021-01515-9
- Fuller et al. (1986) Fuller, G. M., Woosley, S. E., & Weaver, T. A. 1986, ApJ, 307, 675, doi: 10.1086/164452
- Gelli et al. (2023) Gelli, V., Salvadori, S., Ferrara, A., Pallottini, A., & Carniani, S. 2023, Quiescent Low-mass Galaxies Observed by JWST in the Epoch of Reionization, doi: 10.3847/2041-8213/acee80
- Greif et al. (2011) Greif, T. H., Springel, V., White, S. D. M., et al. 2011, ApJ, 737, 75, doi: 10.1088/0004-637X/737/2/75
- Hartwig et al. (2023) Hartwig, T., Ishigaki, M. N., Kobayashi, C., Tominaga, N., & Nomoto, K. 2023, ApJ, 946, 20, doi: 10.3847/1538-4357/acbcc6
- Heger & Woosley (2002) Heger, A., & Woosley, S. E. 2002, ApJ, 567, 532, doi: 10.1086/338487
- Higgins et al. (2023) Higgins, E. R., Vink, J. S., Hirschi, R., Laird, A. M., & Sabhahit, G. N. 2023, MNRAS, 526, 534, doi: 10.1093/mnras/stad2537
- Hirano et al. (2014) Hirano, S., Hosokawa, T., Yoshida, N., et al. 2014, ApJ, 781, 60, doi: 10.1088/0004-637X/781/2/60
- Inami et al. (2022) Inami, H., Algera, H., Schouws, S., et al. 2022, MNRAS, doi: 10.1093/mnras/stac1779
- Ishigaki et al. (2018) Ishigaki, M. N., Tominaga, N., Kobayashi, C., & Nomoto, K. 2018, ApJ, 857, 46, doi: 10.3847/1538-4357/aab3de
- Isobe et al. (2023) Isobe, Y., Ouchi, M., Tominaga, N., et al. 2023, ApJ, 959, 100, doi: 10.3847/1538-4357/ad09be
- Janka (2012) Janka, H.-T. 2012, Annual Review of Nuclear and Particle Science, 62, 407, doi: 10.1146/annurev-nucl-102711-094901
- Kobayashi et al. (2020a) Kobayashi, C., Karakas, A. I., & Lugaro, M. 2020a, ApJ, 900, 179, doi: 10.3847/1538-4357/abae65
- Kobayashi et al. (2020b) Kobayashi, C., Leung, S.-C., & Nomoto, K. 2020b, ApJ, 895, 138, doi: 10.3847/1538-4357/ab8e44
- Kobayashi & Nakasato (2011) Kobayashi, C., & Nakasato, N. 2011, ApJ, 729, 16, doi: 10.1088/0004-637X/729/1/16
- Kobayashi & Nomoto (2009) Kobayashi, C., & Nomoto, K. 2009, ApJ, 707, 1466, doi: 10.1088/0004-637X/707/2/1466
- Kobayashi & Taylor (2023) Kobayashi, C., & Taylor, P. 2023, arXiv e-prints, arXiv:2302.07255, doi: 10.48550/arXiv.2302.07255
- Kobayashi et al. (2011) Kobayashi, C., Tominaga, N., & Nomoto, K. 2011, ApJ, 730, L14, doi: 10.1088/2041-8205/730/2/L14
- Kobayashi et al. (2000) Kobayashi, C., Tsujimoto, T., & Nomoto, K. 2000, ApJ, 539, 26, doi: 10.1086/309195
- Kraft et al. (1997) Kraft, R. P., Sneden, C., Smith, G. H., et al. 1997, AJ, 113, 279, doi: 10.1086/118251
- Kroupa (2008) Kroupa, P. 2008, in Astronomical Society of the Pacific Conference Series, Vol. 390, Pathways Through an Eclectic Universe, ed. J. H. Knapen, T. J. Mahoney, & A. Vazdekis, 3. https://arxiv.org/abs/0708.1164
- Lau et al. (2022) Lau, R. M., Hankins, M. J., Han, Y., et al. 2022, Nature Astronomy, 6, 1308, doi: 10.1038/s41550-022-01812-x
- Limongi & Chieffi (2018) Limongi, M., & Chieffi, A. 2018, ApJS, 237, 13, doi: 10.3847/1538-4365/aacb24
- Looser et al. (2023) Looser, T. J., D’Eugenio, F., Maiolino, R., et al. 2023, arXiv e-prints, arXiv:2302.14155. https://arxiv.org/abs/2302.14155
- Marques-Chaves et al. (2024) Marques-Chaves, R., Schaerer, D., Kuruvanthodi, A., et al. 2024, A&A, 681, A30, doi: 10.1051/0004-6361/202347411
- Martinet et al. (2022) Martinet, S., Meynet, G., Nandal, D., et al. 2022, A&A, 664, A181, doi: 10.1051/0004-6361/202243474
- Meynet & Maeder (2002) Meynet, G., & Maeder, A. 2002, A&A, 390, 561, doi: 10.1051/0004-6361:20020755
- Nagele & Umeda (2023) Nagele, C., & Umeda, H. 2023, ApJ, 949, L16, doi: 10.3847/2041-8213/acd550
- Nomoto et al. (2013) Nomoto, K., Kobayashi, C., & Tominaga, N. 2013, ARA&A, 51, 457, doi: 10.1146/annurev-astro-082812-140956
- Pallottini & Ferrara (2023) Pallottini, A., & Ferrara, A. 2023, A&A, 677, L4, doi: 10.1051/0004-6361/202347384
- Rossi et al. (2021) Rossi, M., Salvadori, S., & Skúladóttir, Á. 2021, MNRAS, 503, 6026, doi: 10.1093/mnras/stab821
- Saccardi et al. (2023) Saccardi, A., Salvadori, S., D’Odorico, V., et al. 2023, ApJ, 948, 35, doi: 10.3847/1538-4357/acc39f
- Schneider et al. (2018) Schneider, F. R. N., Sana, H., Evans, C. J., et al. 2018, Science, 359, 69, doi: 10.1126/science.aan0106
- Senchyna et al. (2023) Senchyna, P., Plat, A., Stark, D. P., & Rudie, G. C. 2023, arXiv e-prints, arXiv:2303.04179, doi: 10.48550/arXiv.2303.04179
- Skúladóttir et al. (2021) Skúladóttir, Á., Salvadori, S., Amarsi, A. M., et al. 2021, ApJ, 915, L30, doi: 10.3847/2041-8213/ac0dc2
- Smartt (2009) Smartt, S. J. 2009, ARA&A, 47, 63, doi: 10.1146/annurev-astro-082708-101737
- Stacy & Bromm (2013) Stacy, A., & Bromm, V. 2013, MNRAS, 433, 1094, doi: 10.1093/mnras/stt789
- Szécsi et al. (2022) Szécsi, D., Agrawal, P., Wünsch, R., & Langer, N. 2022, A&A, 658, A125, doi: 10.1051/0004-6361/202141536
- Takahashi et al. (2018) Takahashi, K., Yoshida, T., & Umeda, H. 2018, ApJ, 857, 111, doi: 10.3847/1538-4357/aab95f
- Todini & Ferrara (2001) Todini, P., & Ferrara, A. 2001, MNRAS, 325, 726, doi: 10.1046/j.1365-8711.2001.04486.x
- Umeda & Nomoto (2003) Umeda, H., & Nomoto, K. 2003, Nature, 422, 871, doi: 10.1038/nature01571
- Vink et al. (2011) Vink, J. S., Muijres, L. E., Anthonisse, B., et al. 2011, A&A, 531, A132, doi: 10.1051/0004-6361/201116614
- Volpato et al. (2023) Volpato, G., Marigo, P., Costa, G., et al. 2023, ApJ, 944, 40, doi: 10.3847/1538-4357/acac91
- Witstok et al. (2023) Witstok, J., Shivaei, I., Smit, R., et al. 2023, arXiv e-prints, arXiv:2302.05468, doi: 10.48550/arXiv.2302.05468
- Woods et al. (2019) Woods, T. E., Agarwal, B., Bromm, V., et al. 2019, PASA, 36, e027, doi: 10.1017/pasa.2019.14
- Yusof et al. (2013) Yusof, N., Hirschi, R., Meynet, G., et al. 2013, MNRAS, 433, 1114, doi: 10.1093/mnras/stt794
- Ziparo et al. (2023) Ziparo, F., Ferrara, A., Sommovigo, L., & Kohandel, M. 2023, MNRAS, 520, 2445, doi: 10.1093/mnras/stad125