Fundamental charge noise in electro-optic photonic integrated circuits
Understanding thermodynamical measurement noise is of central importance for electrical and optical precision measurements from mass-fabricated semiconductor sensors, where the Brownian motion of charge carriers poses limits[1, 2], to optical reference cavities for atomic clocks or gravitational wave detection, which are limited by thermorefractive and thermoelastic noise due to the transduction of temperature fluctuations to the refractive index and length fluctuations[3, 4, 5]. Here, we discover that unexpectedly charge carrier density fluctuations give rise to a novel noise process in recently emerged electro-optic photonic integrated circuits. We show that Lithium Niobate and Lithium Tantalate photonic integrated microresonators exhibit an unexpected Flicker type (i.e. ) scaling in their noise properties, significantly deviating from the well-established thermorefractive noise theory[3, 6, 7]. We show that this noise is consistent with thermodynamical charge noise[8, 9], which leads to electrical field fluctuations that are transduced via the strong Pockels effects of electro-optic materials. Our results establish electrical Johnson-Nyquist noise as the fundamental limitation for Pockels integrated photonics, crucial for determining performance limits for both classical and quantum devices, ranging from ultra-fast tunable and low-noise lasers, Pockels soliton microcombs, to quantum transduction, squeezed light or entangled photon-pair generation[10, 11, 12, 13, 14, 15, 16, 17, 18]. Equally, this observation offers optical methods to probe mesoscopic charge fluctuations with exceptional precision.
Thermal noise plays a crucial role in various fields, ranging from the electronics [1, 2, 19] and semiconductor industry [20, 21, 22, 23], to photonics and metrology, i.e. reference cavities for atomic clocks and gravitational wave detection [24, 6, 25, 7, 3, 4]. For optical interferometer or cavity-based measurement as used in gravitational wave detection, two key noise contributions have been established, i.e. the thermo-refractive noise and the thermo-elastic noise, which transduce stochastic temperature fluctuation via the thermo-optic or thermo-elastic coefficient to frequency fluctuations, thereby limiting precision measurements[3, 5, 26]. Indeed, in integrated photonics resonators, such thermo-refractive noise has been identified to limit the precision of optomechanical displacement measurements [27] and also been observed to limit the linewidth of self-injection locked lasers based on low-loss photonic integrated circuits [28, 29]. In the electrical domain, it is well-established that the Brownian motion of charge carriers induces a voltage noise at the terminals of a resistor, i.e., Johnson-Nyquist noise[1, 2] Over the past few decades, there has been significant focus on the investigation of charge-carrier noise beyond Johnson’s model, particularly the noise, often referred to as Flicker noise. This noise commonly features a frequency scaling represented by , with ranging from 0.5 to 1.5 [21, 22, 23]. Despite Flicker-type noise having been studied extensively in condensed matter physics[21, 22, 23, 30], and having found to limit the coherence of superconducting quantum circuits[31], NV-centers[32], Rydberg atoms [33], such type charge noise has no counterpart in optics, i.e., has never been observed in photonics or optical measurements to the best of our knowledge. Recently, thermal-charge-carrier-refractive noise (TCCR) noise [8, 9] was theoretically investigated in mirrors for gravitational wave detectors, yet the magnitude of the refractive index change via the free-carrier dispersion effect in silicon was found too small for experimental observation.
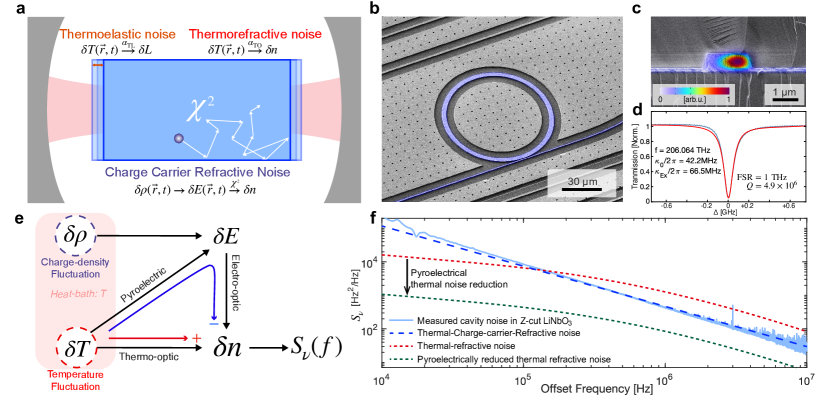
Here we report the discovery that charge noise plays a key role in electro-optic integrated photonics. Electro-optic photonic integrated circuits[34], based on ferroelectric materials such as Lithium Niobate[35, 34], Lithium Tantalate[36], or Barium Titanate[37], have widespread applications ranging from quantum optics to broadband optical communication such as ultrafast tunable lasers, optical comb generation, squeezed light generation and quantum transduction[10, 11, 12, 13, 14, 15, 16, 17, 18] due to their strong Pockels effect and tight optical confinement that have led to a two order-of-magnitude increase in the electro-optical conversion efficiency compared with bulk devices[10] while retaining ultra-low optical loss [38, 39]. Thus far, their intrinsic thermodynamical noises, which establish the ultimate performance threshold for those applications, have not been examined. In the following, we show that ferroelectric microresonators exhibit an unusual noise, which scales with , with across the whole measurement frequency range from 10 kHz to 10 MHz and which significantly deviates from the conventional prediction based on thermo-refractive noise theory. This noise is shown to agree with charge density fluctuations caused by the finite conductivity and transduced via the Pockels effect to refractive index fluctuations (Figure 1(a)). Moreover, we show that the thermo-refractive noise, which is the conventionally acknowledged cavity frequency noise limit in dielectrics and semiconductors[4, 5, 25, 26, 6, 7], is coherently canceled due to the effective thermo-optic response caused by the combination of pyroelectric and electro-optic nonlinearities (PyroEO), making charge noise the predominant noise (Figure 1(f)) .
Pyroelectric Coherent Thermorefractive Noise Cancellation
We studied the cavity noise in ferroelectric optical microresonators fabricated in X-cut and Z-cut and X-cut optical microresonators using a diamond-like-carbon (DLC) based hardmask etching process [39, 36] with free spectral range (FSR) between 80 GHz and 1 THz (see Figure 1 (b,c)) and intrinsic optical linewidth as low as 42.2 MHz shown in Figure 1(d). The resonators with high (quality factor/effective volume) ratios enable accurate detection of intrinsic refractive index noise. Ferroelectric materials possess inherent dipole moments that can be modulated by external electric fields , changing the refractive index through the Pockels effect: , where is the Pockels coefficient in the specific polarization. Temperature can also affect these materials’ dipole moments, creating internal electric fields known as the pyroelectric effect [40]. This field can modify the refractive index through the electro-optic response [41], introducing a thermo-optic nonlinearity that can compensate the conventional thermo-optic response (cf. Figure 1(e)) and thermorefractive noise.
The total temperature induced refractive index change can be described as follows:
| (1) |
where refers to the conventional thermo-optic response, whereas denotes the effective thermo-optic response of the combination of pyroelectricity and the electro-optic effect. is the temperature fluctuations, is the thermorefractive coefficient. The PyroEO response is hence determined by the pyroelectric coefficient , the Pockels coefficient , the refractive index , and the relative permittivity . Coherent cancellation of the thermo-optic response is possible if the strength of the PyroEO and the thermo-optic effects match closely, which is the case for the TE-mode in z-Cut waveguides (cf. supplementary materials). We compare the properties of ferroelectric optical microresoantors to microresonators with FSRs from 10 GHz to 200 GHz fabricated using the photonic Damascene process [42] and featuring comparable optical linewidth and optical mode volume.
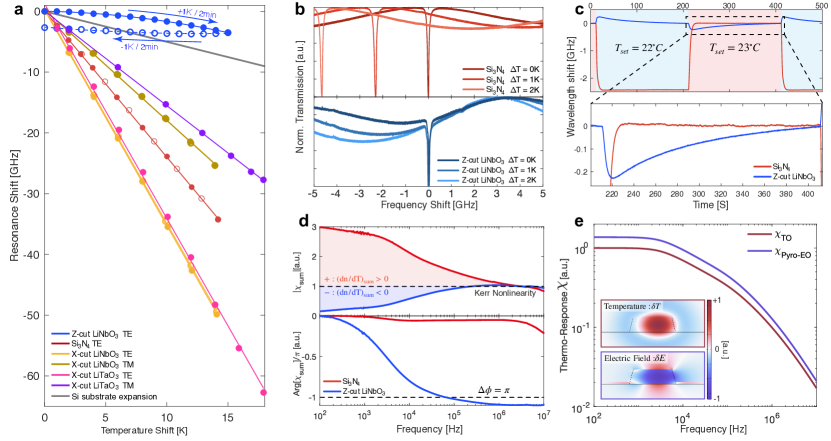
First, we studied the resonance shift directly caused by environment temperature change. Figure 2(a) presents a comparison of resonance shifts for different microresonators across a 15 K temperature range above the 294 K lab temperature with a ramp rate of 0.5 K/min. Z-cut (dark blue) is distinguished by its athermal behavior compensating the thermal expansion of the silicon substrate (solid black line) and its hysteresis, which indicates the presence of a slow-decaying pyroelectric process (for the detailed discussion see supplementary material). Figure 2(b) depicts laser frequency scans across the resonances of a Z-cut resonantor and a resonator for modest temperature changes of 1-2 K. While the resonantor drifts by 2.3 GHz/K, the drift of the Z-cut resonator is less than 100 MHz/K featuring a more than one order of magnitude reduction in thermal drift due to the PyroEO effect. Figure 2(c) plots the resonance shift in response to temperature switching between 22∘C and 23∘C with a period of 400 s. The immediate resonance shift that occurs at the commencement of the temperature change, is followed by a slower decay with a time constant of around s (cf. supplementary material). The modulation of pyroelectric charges is a result of an instantaneous polarization change following atomic scale relaxation [40], while the decay of these charges results from surface current and charge neutralization process that involves ions from the surroundings and is typically much slower [41]. Our observations for Z-cut substantiate that though the original thermo-optic coefficient for o-light in is positive (shown in the measurement of TM-mode in X-cut ), the PyroEO effect contributes to a net negative thermo-optic coefficient in Z-cut (cf. Equation 1). We attribute the absence of hysteresis during our measurement in X-cut to the much faster pyroelectric decay times due to leakage current at the ion beam etched surface.
Secondly, we conduct a coherently-driven optical intensity modulation response measurement, where the temperature changes are driven by the optical absorption in the resonator directly via the photothermal effect [43]. Figure 2(d) presents the nonlinear response[43] of two microresonators: the non-ferroelectric microresonator and the ferroelectric Z-cut microresonator. In the latter, the PyroEO effect induces a negative thermo-optic coefficient, which over-compensates the intrinsic positive thermo-optic coefficient, leading to a -phase shift in the response phase. More data measured at different temperatures are available in the supplementary material. We simulated the thermal response curve for the thermo-optic effect and the PyroEO effect and depict the result in Figure 2(f). Both thermo-optic response and PyroEO response show similar frequency scaling from 1 kHz to 10 MHz determined by heat diffusion. The panel insets illustrate the normalized profile of the photothermal induced temperature field at a frequency of 1 MHz and the corresponding electric field in Z-direction induced by the pyroelectric charge.
Fundamental Charge Refractive Noise via Pockels effect
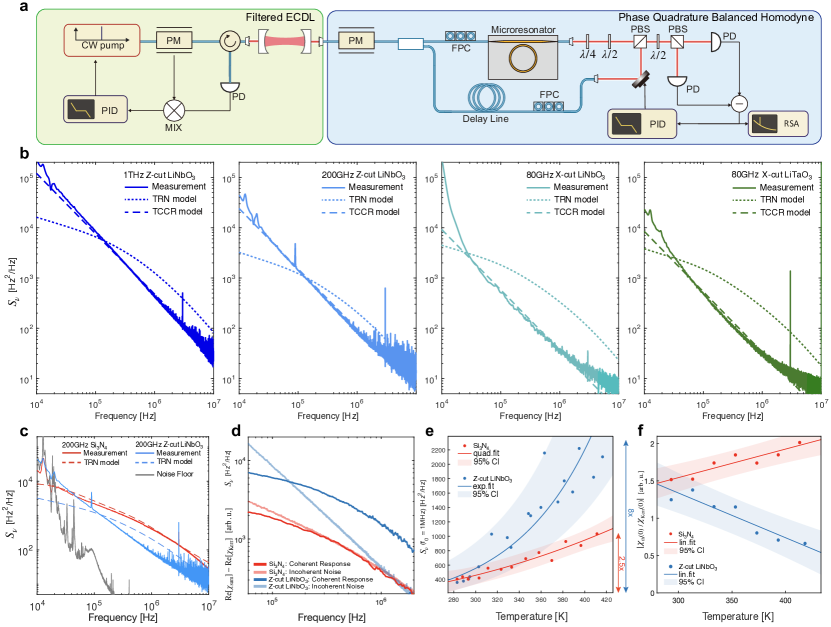
We employ a balanced homodyne interferometer (Figure 3(a)) to probe the intrinsic refractive fluctuations of the optical microresonator. Figure 3(b) depicts the intrinsic noise measurement result for Z-cut , X-cut , and X-cut with various Free Spectral Ranges (FSR) compared with the simulation results based on the thermorefractive noise (TRN) model and the thermal-charge-carrier-refractive noise (TCCR) model. The measurement range is limited by technical noise at low offset frequencies and by shot noise at high offset frequencies (see supplementary material). Figure 3(c) compares the intrinsic noise spectra in Z-cut and microresonators with 200 GHz FSR. Indeed, we find that the measured cavity frequency noise at high offset frequencies beyond 30 kHz in Z-cut, X-cut and X-cut are all significantly lower than in -based microresonators of the same size and the prediction from thermorefractive noise theory[6, 25, 4] due to the pyroelectric-electro-optic (PyroEO) effect. However, we also find large excess noise at low offset frequency , and a distinctive Flicker-like frequency dependency: across a large frequency range from 10 kHz to 10 MHz. The difference in frequency scaling of the spectra indicating a different underlying diffusion mechanism behind the noise with lower natural characteristic frequency[19].
We attribute this to a new and non-thermorefractive noise channel specific to electro-optic materials: the thermal-charge-carrier-refractive noise, analogous to the charge-carrier induced Flicker noise that is commonly observed in semiconductor devices due to charge diffusion and surface trapping effect with a frequency scaling and factor between 0.5 and 1.5 [21, 22, 23]. The Brownian motion of charge carriers gives rise to fluctuations in the charge carrier density that induce microscopic electric fields, which in electrical circuits is referred to as Johnson-Nyquist noise [1, 2].
Compared to earlier theoretical predictions of charge carrier noise in high-purity silicon used for mirrors in LIGO [8, 9], the strong Pockels effect and low mode volume of ferroelectric microresonators entails a dominating TCCR noise, which can be approximately described by:
wherein , with the dielectric relaxation time . in due to the low conductivity. Here, is the refractive index, is the Pockels coefficient for the specific polarization, is the Boltzmann constant, is the absolute temperature, is the effective optical mode volume, is the optical frequency, is the vacuum permittivity, is the relative permittivity and is the temperature- and frequency-dependent conductivity which is proportional to the charge-carrier diffusion coefficient. A detailed derivation of the noise power spectral density and microscopic theory of charge carrier density fluctuations is presented in the supplementary material. In semiconductors or insulators, due to quantum tunneling and barrier hopping, the conductivity has a frequency dependency , with [44, 45]. Equation Fundamental Charge Refractive Noise via Pockels effect predicts a frequency dependency of the TCCR of . This frequency dependence arises from a diffusion spectrum at frequencies significantly higher than the natural characteristic diffusion frequency, which scales as [19, 9, 8] and is corrected with the frequency dependency of the diffusion constant (conductivity). Specifically, Ref. [46] reports for Lithium Niobate at room temperature, resulting in in excellent agreement with our measurement result, as shown in Figure 3(b). It should be noted that due to different doping conditions and fabrication processes, the conductivity can vary by several orders of magnitude and we find quantitative agreement between our model and measurement (Figure 3(b)) assuming a conductivity of S/m at a frequency of 1 kHz as reported in Ref.[46]. The additional surface trapping effect and defects can also affect the charge-carrier diffusion process [23]. During the experiment, we ensure that the on-chip laser power is sufficiently low to prevent any unwanted thermal-locking and photorefractive effects. Data measured with different on-chip power are available in the supplementary material.
To further confirm that the Flicker-like cavity noise is not of thermal origin, we compare the incoherent cavity noise with the coherently driven response measurement in Figure 3(d). According to the fluctuation-dissipation theorem [47] (detailed explanation available in the supplementary materials), for the thermal process induced cavity noise, the incoherently measured cavity noise should follow the frequency scaling of the real-part of the coherently driven thermo-optic response , as the frequency scaling is determined by the same heat diffusion process:
Figure 3(d) plots that the cavity noise from the microresonator aligns well with the driven response, except for a minor deviation at low frequencies due to the amplified technical noise in homodyne measurements. Conversely, the cavity noise from the ferroelectric Z-cut microresonator exhibits a Flicker-like frequency scaling, substantially deviating from the driven response, indicating the measured noise is not related to heat diffusion. As a final test to prove the non-thermal origin of the residual noise, we examine the temperature scaling of the cavity noise and plot the values of the single-sided noise power spectral density at an offset of 1 MHz and temperatures ranging from 10°C to 140°C (Figure 3(e)). The temperature-dependent thermo-optic response is plotted in Figure 3(f). For pure thermorefractive noise, we expect a temperature scaling of . It is evident that the cavity noise of the microresonator adheres to the TRN theory. Because the conductivity of isolators increases exponentially with temperature[46], we expect and observe an exponential scaling of the noise amplitude in Z-cut .
Charge Noise Limited Integrated Pockels Laser
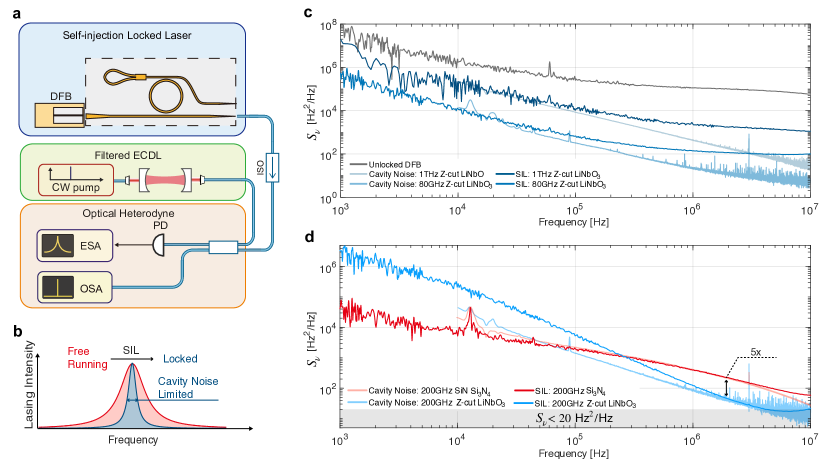
To demonstrate the technological importance of our discovery of TCCR in electro-optical photoni integrated circuits, we measured the frequency noise spectra of a self-injection locked lasers (Figure 4(a)), in which the frequency noise of the free-running diode is suppressed by a factor proportional to the square of the microresonator quality factor () until it hits the fundamental cavity noise limit (Figure 4(b)). Figure 4(c) plots the frequency noise spectra for the Z-cut hybrid laser in free-running and self-injection locked states, along with a comparison to the previously measured intrinsic cavity noise in the homodyne experiment. The linear characterization data for the resonances used in the self-injection-locked laser experiment is available in the supplementary material. Across all tested devices with FSRs ranging from 80 GHz to 1 THz, the laser frequency noise power spectral density is in quantitative agreement with the fundamental cavity noise limit at offsets up to 100 kHz. Additionally, Figure 4(d) plots a comparison of laser and cavity frequency noise spectra of a -based and a Z-cut -based hybrid integrated lasers, both with 200 GHz FSR. We find a substantial noise reduction of up to a factor of five due to the coherent cancellation of the thermorefractive and PyroEO effects at high-offset frequencies compared to the -based counterpart, thereby affirming the reduction of thermorefractive noise. The lowest intrinsic laser linewidth of is attained in a Z-cut microresonator with 200 GHz FSR at an offset frequency of 5 MHz.
Discussion and conclusion
In summary, we have discovered that the intrinsic cavity noise mechanisms in electro-optic materials can significantly differ from that in non-electro-optic materials. We demonstrate that the combination of pyroelectricity and electro-optic response contributes to a negative thermo-optic coefficient in Lithium Niobate and Lithium Tantalate, which not only alters the thermo-response but can also coherently reduces the thermo-refractive noise. While thermal-charge-carrier-refractive noise was deemed negligible in conventional dielectrics and semiconductors optics in the context of gravitational wave detection [8, 9], we find that thermal-charge-carrier-refractive noise, supersedes the reduced thermo-refractive noise and becomes the dominant refractive noise limit in integrated photonic devices. Equally important, the power spectral density of TCCR in ferroelectric photonics exhibits a very different Flicker-like frequency scaling compared to thermo-refractive noise which saturates at low frequencies. Broadly viewed, our measurements in high-Q and photonic integrated circuit-based microresonators carry substantial implications in terms of achievable performance and noise limitations for a variety of applications including quantum transduction [48], quantum electro-optic experiments [18], squeezing [15, 14], coherent communication, LiDAR [11] and sensing [49]. We expect this charge-carrier noise might also be a dominating noise in future low energy silicon[50, 51] and ferroelectric-based electro-optic integrated photonics [37] as these devices approach the Landauer limit for electro-optical conversion. We also highlight the technical relevance of TCCR noise in ferroelectric Pockels photonics already today by demonstrating that the noise performance and frequency drift of low noise self-injection locked Pockels lasers are limited by TCCR, in particular at low offset frequencies. Lastly, we want to point out that our results also provide a novel way to study charge fluctuations in mesoscopic, such as domain wall switching in ferroelectric materials using the exquisite sensitivity and speed of optical measurements, which may advance precision measurement of charge noise and mesoscopic fluctuations.
Methods
DC-shift and coherently-driven nonlinear response measurement. The setup follows the approach introduced in [43] and its diagram is available in supplementary material. In the DC-shift measurement, an external cavity diode laser (CW Pump, Toptica 1550) is PDH-locked to the resonance cavity under test and sent to a wavemeter (High-Fines WS6-600, with resolution 20 MHz) to continuously record the cavity resonance frequency. The laser power is reduced to less than 100 to avoid unwanted thermal nonlinearity and reduce photorefractive-induced drifting. The temperature is controlled by a thermoelectric cooler attached to the copper chip holder. In the coherently-driven nonlinear response measurement, the same pump laser with increased power (mW level, but still low enough to avoid thermal locking) is intensity-modulated by an intensity modulator to drive nonlinearity in the cavity. A probe external cavity diode laser is tuned to the side of the resonance. Note that the pump laser and probe laser were placed to different resonances and a tunable band-pass filter is used to extract the probe signal after cavity for lockin-in detection. Upon traversing the cavity, the pump laser’s intensity modulation generates a resonance shift that is subsequently transduced into transmission modulation for the probe laser on the side of resonance. This modulation is then detected by a fast photodiode (cut-off frequency at 125MHz). The drive input of the intensity modulator and the photodiode output are connected to a vector network analyzer (VNA) for the detection of the coherent response.
Balanced homodyne for intrinsic cavity frequency noise measurement. The setup follows the approach introduced in [6], the simplified diagram is shown in Figure 3(a) and a complete diagram is shown in the supplementary. An external cavity diode laser used in the previous experiment is PDH-locked to a high-finesse Fabry-Perot cavity with intrinsic linewidth kHz, and the notably low-phase noise filtered transmitted light is used to drive the balanced Mach–Zehnder interferometer. The resonance of the Fabry-Perot, under the control of an external piezo drive, is aligned with the resonance of the cavity under test. This alignment allows for maximum efficiency in transducing the cavity frequency noise into a phase fluctuation, detectable by the homodyne method. Before the interferometer, a phase modulator modulated with a known RF tone to provide an absolute calibration peak for this noise measurement. A piezo mirror is utilized in the path of the local oscillator to ensure the homodyne is locked at the phase quadrature. The noise floor is measured by replacing the cavity under-test with a 3m long fiber delay line.
Self-injection locked laser frequency noise measurement. A distributed-feedback laser (DFB) is self-injection locked to the microresonator under test and beat with the Fabry-Perot cavity filtered ECDL laser (the same filtering method as in previous homodyne measurement). The back-reflection phase of the self-injection locking system is controlled by changing the gap between the DFB laser and chip facet, to attain optimal locking conditions. For further integration, the reflection phase can also be tuned by an integrated electro-optic phase shifter. The heterodyne beat signal is then detected by a photodiode and the resulting RF signal is demodulated around the central beat note frequency to reconstruct the phase and quadrature diagram (IQ-diagram) for phase noise analysis.
Author Contributions
J.Z. designed the samples with assistance from J.R. and fabricated the samples with assistance from Z.L.. Experiments were carried out by J.Z.,G.L., and G.H.. The experimental data was analyzed by J.Z with the assistance of J.R. and G.H.. J.Z. and J.R. developed the theoretical and numerical models. T.J.K. supervised the work.
Funding Information
This work has received funding from the European Research Council (ERC) under the EU H2020 research and innovation programme, grant agreement No. 835329 (ExCOM-cCEO). This material is based upon work supported by the Air Force Office of Scientific Research under award number FA9550-19-1-0250. J.R acknowledges support from the Swiss National Science Foundation under grant agreement No. 201923.
Acknowledgements
We thank Nils J. Engelsen for the insightful discussion on cavity noise and Amirali Arabmoheghi for assistance with the balanced homodyne interferometer. We thank Anat Siddarth for supplying the reference laser noise data. The samples were fabricated in the EPFL Center of MicroNanoTechnology (CMi) and the Institute of Physics (IPHYS) cleanroom.
Competing interests
The authors declare no competing financial interests.
Data Availability Statement
The code and data used to produce the plots within this work will be released on the repository Zenodo upon publication of this preprint.
References
- [1] Johnson, J. B. Thermal Agitation of Electricity in Conductors. Phys. Rev. 32, 97–109 (1928).
- [2] Nyquist, H. Thermal Agitation of Electric Charge in Conductors. Phys. Rev. 32, 110–113 (1928).
- [3] Levin, Yu. Internal thermal noise in the LIGO test masses: A direct approach. Phys. Rev. D 57, 659–663 (1998).
- [4] Levin, Y. Fluctuation–dissipation theorem for thermo-refractive noise. Physics Letters A 372, 1941–1944 (2008).
- [5] Liu, Y. T. & Thorne, K. S. Thermoelastic noise and homogeneous thermal noise in finite sized gravitational-wave test masses. Phys. Rev. D 62, 122002 (2000).
- [6] Huang, G. et al. Thermorefractive noise in silicon-nitride microresonators. Phys. Rev. A 99, 061801 (2019).
- [7] Panuski, C., Englund, D. & Hamerly, R. Fundamental Thermal Noise Limits for Optical Microcavities. Phys. Rev. X 10, 041046 (2020).
- [8] Bruns, F. et al. Thermal charge carrier driven noise in transmissive semiconductor optics. Phys. Rev. D 102, 022006 (2020).
- [9] Siegel, H. & Levin, Y. Revisiting Thermal Charge Carrier Refractive Noise in Semiconductor Optics for Gravitational-Wave Interferometers. Phys. Rev. D 107, 022002 (2023). eprint 2209.09994.
- [10] Wang, C. et al. Integrated lithium niobate electro-optic modulators operating at CMOS-compatible voltages. Nature 562, 101–104 (2018).
- [11] Snigirev, V. et al. Ultrafast tunable lasers using lithium niobate integrated photonics. Nature 615, 411–417 (2023).
- [12] Li, M. et al. Integrated Pockels laser. Nat Commun 13, 5344 (2022).
- [13] He, Y. et al. Self-starting bi-chromatic LiNbO 3 soliton microcomb. Optica 6, 1138 (2019).
- [14] Nehra, R. et al. Few-cycle vacuum squeezing in nanophotonics (2022). eprint 2201.06768.
- [15] Stokowski, H. S. et al. Integrated quantum optical phase sensor in thin film lithium niobate. Nat Commun 14, 3355 (2023).
- [16] Sahu, R. et al. Entangling microwaves with light. Science 380, 718–721 (2023).
- [17] Zhao, J., Ma, C., Rüsing, M. & Mookherjea, S. High Quality Entangled Photon Pair Generation in Periodically Poled Thin-Film Lithium Niobate Waveguides. Phys. Rev. Lett. 124, 163603 (2020).
- [18] Xu, Y. et al. Bidirectional Interconversion of Microwave and Light with Thin-Film Lithium Niobate. Nat Commun 12, 4453 (2021).
- [19] Voss, R. F. & Clarke, J. Flicker ( 1 f ) noise: Equilibrium temperature and resistance fluctuations. Phys. Rev. B 13, 556–573 (1976).
- [20] Surya, C. & Hsiang, T. Y. Theory and experiment on the 1/ f noise in p -channel metal-oxide-semiconductor field-effect transistors at low drain bias. Phys. Rev. B 33, 4898–4905 (1986).
- [21] Hung, K., Ko, P., Hu, C. & Cheng, Y. A unified model for the flicker noise in metal-oxide-semiconductor field-effect transistors. IEEE Transactions on Electron Devices 37, 654–665 (1990).
- [22] Jimmin Chang, Abidi, A. & Viswanathan, C. Flicker noise in CMOS transistors from subthreshold to strong inversion at various temperatures. IEEE Trans. Electron Devices 41, 1965–1971 (Nov./1994).
- [23] Jayaraman, R. & Sodini, C. A 1/f noise technique to extract the oxide trap density near the conduction band edge of silicon. IEEE Transactions on Electron Devices 36, 1773–1782 (1989).
- [24] Ludlow, A. D. et al. Compact, thermal-noise-limited optical cavity for diode laser stabilization at 1 10- 15. Optics letters 32, 641–643 (2007).
- [25] Gorodetsky, M. L. & Grudinin, I. S. Fundamental thermal fluctuations in microspheres. J. Opt. Soc. Am. B 21, 697 (2004).
- [26] Matsko, A. B., Savchenkov, A. A., Yu, N. & Maleki, L. Whispering-gallery-mode resonators as frequency references I Fundamental limitations. J. Opt. Soc. Am. B 24, 1324 (2007).
- [27] Anetsberger, G. et al. Measuring nanomechanical motion with an imprecision below the standard quantum limit. Phys. Rev. A 82, 061804 (2010).
- [28] Jin, W. et al. Hertz-linewidth semiconductor lasers using CMOS-ready ultra-high-Q microresonators. Nat. Photonics 15, 346–353 (2021).
- [29] Kondratiev, N. M. et al. Self-injection locking of a laser diode to a high-Q WGM microresonator. Opt. Express 25, 28167 (2017).
- [30] Héritier, M. et al. Spatial Correlation between Fluctuating and Static Fields over Metal and Dielectric Substrates. Phys. Rev. Lett. 127, 216101 (2021).
- [31] Kuhlmann, A. V. et al. Charge noise and spin noise in a semiconductor quantum device. Nature Phys 9, 570–575 (2013).
- [32] Kim, M. et al. Decoherence of Near-Surface Nitrogen-Vacancy Centers Due to Electric Field Noise. Phys. Rev. Lett. 115, 087602 (2015).
- [33] Carter, J. D. & Martin, J. D. D. Coherent manipulation of cold Rydberg atoms near the surface of an atom chip. Phys. Rev. A 88, 043429 (2013).
- [34] Boes, A. et al. Lithium niobate photonics: Unlocking the electromagnetic spectrum. Science 379, eabj4396 (2023).
- [35] Zhu, D. et al. Integrated photonics on thin-film lithium niobate. Adv. Opt. Photon. 13, 242 (2021).
- [36] Wang, C. et al. Lithium tantalate electro-optical photonic integrated circuits for high volume manufacturing. arXiv preprint arXiv:2306.16492 (2023).
- [37] Abel, S. et al. Large Pockels effect in micro- and nanostructured barium titanate integrated on silicon. Nature Mater 18, 42–47 (2019).
- [38] Zhang, M., Wang, C., Cheng, R., Shams-Ansari, A. & Lončar, M. Monolithic ultra-high-q lithium niobate microring resonator. Optica 4, 1536–1537 (2017).
- [39] Li, Z. et al. Tightly confining lithium niobate photonic integrated circuits and lasers (2022). eprint 2208.05556.
- [40] Peng, Q. & Cohen, R. E. Origin of pyroelectricity in LiNbO 3. Phys. Rev. B 83, 220103 (2011).
- [41] Bulmer, C. H., Burns, W. K. & Hiser, S. C. Pyroelectric effects in LiNbO 3 channel-waveguide devices. Appl. Phys. Lett. 48, 1036–1038 (1986).
- [42] Liu, J. et al. High-yield, wafer-scale fabrication of ultralow-loss, dispersion-engineered silicon nitride photonic circuits. Nat Commun 12, 2236 (2021).
- [43] Gao, M. et al. Probing material absorption and optical nonlinearity of integrated photonic materials. Nat Commun 13, 3323 (2022).
- [44] Elliott, S. R. A theory of a.c. conduction in chalcogenide glasses. Philosophical Magazine 36, 1291–1304 (1977).
- [45] Mott, N. F. & Davis, E. A. Electronic process in non-crystalline materials, vol. 14 (Oxford University Press Oxford, 1971).
- [46] Mansingh, A. & Dhar, A. The AC conductivity and dielectric constant of lithium niobate single crystals. J. Phys. D: Appl. Phys. 18, 2059–2071 (1985).
- [47] Kubo, R. The fluctuation-dissipation theorem. Rep. Prog. Phys. 29, 255 (1966).
- [48] Sahu, R. et al. Quantum-enabled operation of a microwave-optical interface. Nat Commun 13, 1276 (2022).
- [49] Calero, V. et al. An ultra wideband-high spatial resolution-compact electric field sensor based on Lab-on-Fiber technology. Sci Rep 9, 8058 (2019).
- [50] Dong, P. et al. Low V_pp, ultralow-energy, compact, high-speed silicon electro-optic modulator. Opt. Express 17, 22484 (2009).
- [51] Xu, Q., Schmidt, B., Pradhan, S. & Lipson, M. Micrometre-scale silicon electro-optic modulator. Nature 435, 325–327 (2005).