- C
- Coverage
- HV
- Hypervolume
- IGD+
- Inverted Generational Distance Plus
- EP
- Epsilon
- pas
- performance antipattern
Introducing Interactions in Multi-Objective Optimization of Software Architectures
Abstract.
Software architecture optimization aims to enhance non-functional attributes like performance and reliability while meeting functional requirements. Multi-objective optimization employs metaheuristic search techniques, such as genetic algorithms, to explore feasible architectural changes and propose alternatives to designers. However, the resource-intensive process may not always align with practical constraints.
This study investigates the impact of designer interactions on multi-objective software architecture optimization. Designers can intervene at intermediate points in the fully automated optimization process, making choices that guide exploration towards more desirable solutions. We compare this interactive approach with the fully automated optimization process, which serves as the baseline. The findings demonstrate that designer interactions lead to a more focused solution space, resulting in improved architectural quality. By directing the search towards regions of interest, the interaction uncovers architectures that remain unexplored in the fully automated process.
1. Introduction
Multi-objective optimization is based on techniques that effectively search an exponentially large space to find Pareto front solutions (Nardi et al., 2019). In this class of optimization, it is assumed that the underlying optimization function is not analytically known and is not smooth, and well-known mathematical methods (like differentiation rules or Newton–Raphson method) cannot be adopted. Hence, space exploration techniques have to be used, but they are often applied as fully automated iterative processes which do not envisage human interactions. Indeed, such a process is configured with some parameters (e.g., number of iterations) and, in the case of evolutionary approaches, with rules for automatically re-combining intermediate solutions (i.e., crossover and mutation operators). Numerous software engineering (Ramírez et al., 2019; Mariani and Vergilio, 2017; Ouni et al., 2017b; Ray and Mohapatra, 2014; Bavota et al., 2014; Kessentini et al., 2012; Chen et al., 2021), computer systems (Alipourfard et al., 2017; Li et al., 2020; Jamshidi and Casale, 2016; Iqbal et al., 2022), and hyperparameters tuning (Snoek et al., 2012; Shahriari et al., 2015) problems have been successfully addressed by using multi-objective optimization strategies. Such problems frequently entail several metrics for quantifying non-functional properties that serve as optimization goals (Aleti et al., 2013; Martens et al., 2010; Aleti et al., 2009; Blum and Roli, 2003).
Evolutionary algorithms have often been used for tackling multi-objective optimization problems in the software architecture refactoring domain. These algorithms iteratively generate and combine architectural models with specified rules to explore the solution space, while taking into account user-defined constraints that prevent unfeasible solutions to be considered. Nevertheless, this process cannot guarantee that the obtained solutions will be satisfactory to the designer. The key reason is that the designer may have some preferences that are not well-understood at the beginning of the process, but they may be clarified by glimpsing at intermediate solutions. Indeed, it has been shown that the introduction of designer interactions in an optimization process might help to drive it towards more desirable solutions (Aljawawdeh et al., 2015). This is because expert domain knowledge, which can be hard to express as initial constraints for the optimization process, can be later conveyed in the process upon direct observation of intermediate solutions. For instance, the designer might observe that an intermediate solution induces an interesting tradeoff among the objectives, and then she can decide to re-start the process from that solution in order to focus the search in the solution proximity.
This paper focuses on software architecture refactoring aimed at optimizing non-functional properties, like performance and reliability. In this context, we pose the central hypothesis that the interaction of designers with an automated optimization engine can drive the space exploration towards candidate architectures which more likely induce desirable tradeoffs among such properties. In other words, this paper aims to show if enabling designers to interact with an architecture optimization process opens new possibilities for them to improve the process and the quality of solutions. Specifically, we performed several experiments in this context, where an evolutionary algorithm uses refactoring actions to automatically explore the space of software architectural models, and the designer can specify (in intermediate iterations) regions of interest where the exploration should focus on. This scenario contrasts with the traditional approach of a fully automated optimization.
Different forms of interactions have gained increasing attention in addressing some of the challenges in Search-Based Software Engineering (SBSE) studies, as highlighted by Ramirez et al. (2019), where several interactive modes have been identified. Here, we explored only the form of interaction that allows the designer to steer the search toward solutions inducing specific tradeoffs, such as low response time and high reliability. We leave the exploration of other types of interactions to future work.
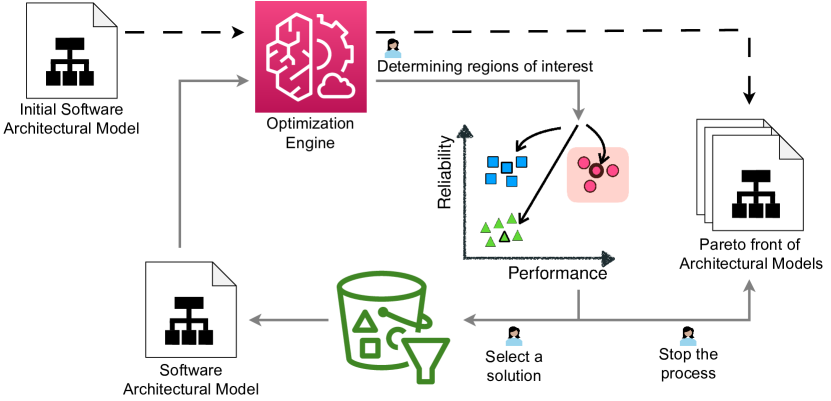
A schematic representation of an interactive optimization process is illustrated in Figure 1. The dashed black arrows in the figure represent the flow of a traditional fully automated process, whereas the filled gray arrows introduce interactivity in the process.
The process starts from an initial software architectural model that feeds the optimization engine. In a fully automated process, the engine produces, after several non-visible iterations, the final Pareto solutions, namely architectural models showing specific values for the optimization objectives. In the interactive process that we envisage in this paper, instead, the engine produces intermediate results visible to the designer after a certain number of iterations. The designer is thus enabled to identify the regions of interest from where solutions will be selected, and consequently to restart the optimization process. The designer can decide when to stop this process.
In this paper, the optimization objectives refer to: (i) performance and reliability as non-functional properties, and (ii) cost of refactoring and number of performance antipatterns as architectural properties.
In order to evaluate our central hypothesis, we designed experiments to answer the following research questions:
-
•
: To what extent can an interactive process affect the quality of solutions?
-
•
: How different are, in terms of architectural properties, the solutions generated through an interactive process with respect to the ones generated through a fully automated one?
-
•
: How does an interactive process impact on the coverage of solution space?
In our experimental setup, we rely on specific modeling languages for architectural model definition and evaluation. Specifically, we use some UML diagrams to represent architectural models, and stochastic notations (e.g., Layered Queueing Networks (LQNs) for performance analysis) to evaluate their non-functional properties.
Our experimentation provides evidence that designer’s interactions narrow down the explored solution space while leading to more desirable architectures in terms of quality properties. Moreover, by focusing on regions of interests for the designer, the interaction steers the search towards architectures that were not reached by the fully automated process.
This paper is structured as follows: Section 2 introduces the key concepts employed in the study, setting the foundation for the research; Section 3 outlines the study design, emphasizing the interactive process and presenting the research questions that guide our investigation; Section 4 comprehensively reports the study results, addressing the research questions and shedding light on the outcomes; in LABEL:sec:threats, we examine threats to validity; finally, in Section 6, we conclude the paper by summarizing the study outcomes and providing an overview of future research directions highlighted by this study.
2. Background
This section introduces the required background for this paper, covering model-based prediction of quality attributes (Section 2.1), search-based optimization of quality attributes (Section 2.2), and the Easier evolutionary model-based optimization approach (Section 2.3).
2.1. Model-based prediction of quality attributes
As software systems get complex, predicting their quality becomes challenging. For large software systems, it is often too late to assess their quality after the system has already been implemented, because problems are more difficult to fix. Therefore, quality prediction based on a system’s architectural model is a valuable approach to avoid costs and effort caused by a “fix-it-later approach”. Several approaches have been introduced in the last decades to ease the model-based prediction of quality attributes (Cortellessa et al., 2011; Reussner et al., 2016).
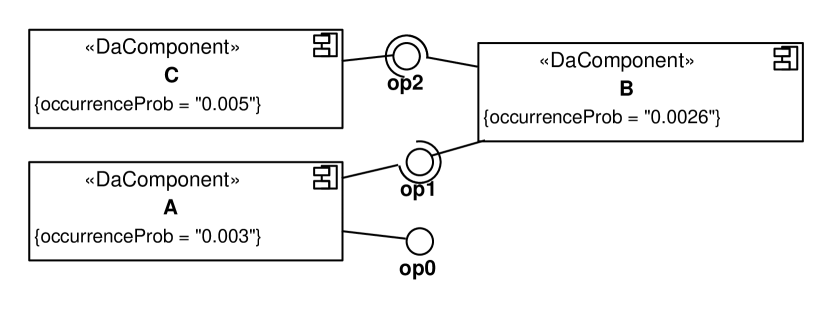
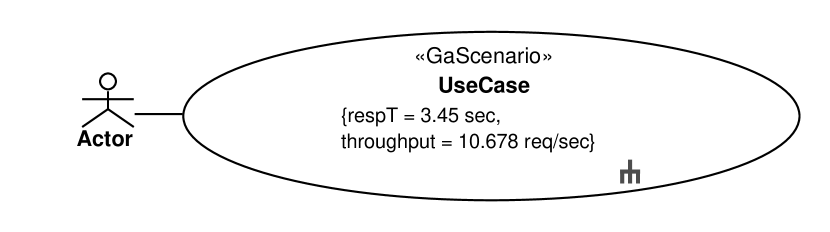
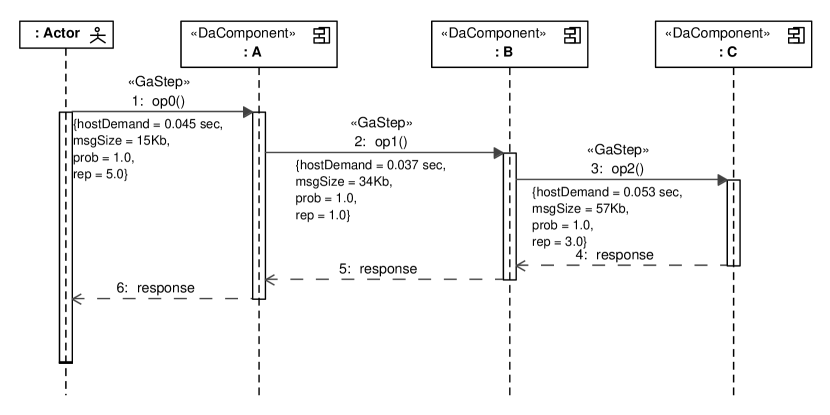
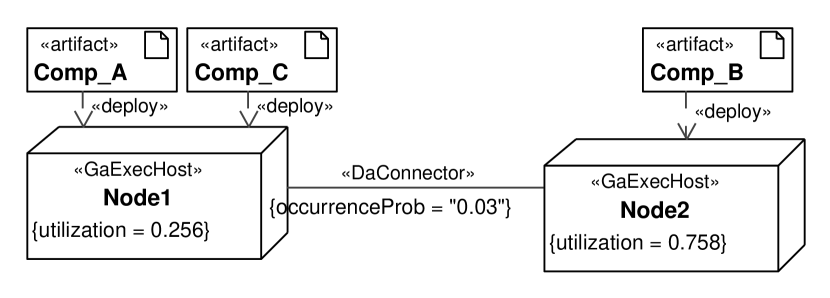
This paper is particularly interested in approaches that allow the modeling of quality attributes at an architectural level using design models. We focus on performance and reliability modeling using UML and respective profiles, namely MARTE (Group, 2008) and DAM (Bernardi et al., 2011). Figure 2 shows an example of using UML with the two profiles. The Use Case diagram (Figure 2(b)) defines a user scenario, which is detailed by a Sequence diagram (Figure 2(c)) that captures message exchange among lifelines. Lifelines represent the components involvement in user scenarios. The Deployment diagram (Figure 2(d)) models platform information and maps components to nodes through artifact manifestations. The DAM.DaConnector, and DAM.DaComponent stereotypes with their tagged values model inputs for the subsequent non-functional analysis, while the MARTE.GaStep, MARTE.GaScenario, and MARTE.GaExecHost stereotypes report non-functional analysis results. A complementing Component diagram (Figure 2(a)) allows designing and annotating static connections among components by means of interface realizations and their usages.
Often, a model-to-model (M2M) transformation is necessary to transform an architectural model into a quantitative one to assess its quality. For instance, Layered Queueing Networks (LQNs) are a common stochastic modeling formalism that allows predicting the performance of architectural models (Franks et al., 2009). Stochastic models, such as Petri nets and Markov chains, can be employed to quantify the reliability of architectural models (Cortellessa et al., 2020).
2.2. Search-based optimization of quality attributes
Several approaches and tools (Aleti et al., 2013) have been proposed to aid architects in the search-based quality optimization process, e.g., PerOpteryx (Martens et al., 2010), ArcheOpterix (Aleti et al., 2009), SQuAT (Rago et al., 2017), and Easier (Arcelli et al., 2018). All these approaches require (at least) two inputs: i) an initial software architecture model and ii) objectives that direct the optimization process. Furthermore, the approaches are equipped with architectural transformations that they can apply to improve the system’s quality attributes. Such architectural transformations comprise tactics (Bass et al., 2021) or refactorings (Arcelli et al., 2018). A tactic is a domain-specific rule aimed at improving a specific quality attribute, e.g., replicating bottleneck services to improve performance (Bass et al., 2021). A refactoring, instead, is an architectural transformation that changes the structure of the initial architecture while preserving its behavior, e.g., move an internal operation between two components to balance the load of the system (Cortellessa et al., 2023). Multi-objective optimization techniques search the solution space to identify the (near-)optimal region of non-dominated solutions, i.e., the Pareto front, in terms of objectives quantified by quality metrics (Aleti et al., 2013). We consider two classes of objectives: objectives concerning the system’s quality, e.g., performance or reliability, and objectives referring to the architecture, e.g., the number of performance antipattern (pas). The configuration of the search strategy not only determines the shape of the explored space, but it can also influence the speed and direction of the exploration of the solution space, e.g., by choosing a specific algorithm or population size (Zitzler and Thiele, 1999).
Optimizing multiple objectives is challenging (Aleti et al., 2013) because many refactoring actions improve one or more attributes of the solution space but at the same time they deteriorate other attributes (Bass et al., 2021), e.g., splitting a component improves maintainability, but it can also introduce a performance overhead. As a result, architects must accept trade-offs based on their preferences.
2.3. The evolutionary approach
The optimization process we envision in our study was illustrated in Figure 1. Such framework starts with an (initial) architecture model and a set of objectives, then, a multi-objective optimization engine is put in place to generate architecture model alternatives. A visualization environment is proposed for the designer to visually inspect the solution space. The designer can possibly select some specific regions of the space to focus on, or also change the configuration settings of the optimization engine.
The optimization engine is in charge of generating architecture model alternatives through generative operators, such as selection, mutation, and crossover. In our scenario, such operators apply a fixed number of refactoring actions. We use the four refactoring actions presented by Cortellessa et al. (2023) and briefly described in Table 1. The correctness of refactoring actions concatenation in sequences is guaranteed by a feasibility engine provided by Easier (Arcelli et al., 2018).
| Action | Description |
|---|---|
| ReDe | Redeploy an existing component on a new node. This action modifies the deployment view by redeploying a Component to a newly created Node. The new Node is connected with all other ones directly connected to the Node on which the target Component was originally deployed. |
| MO2C | Move an existing operation to an existing component. This action is in charge of selecting and transferring an operation to an arbitrary existing target component. The action consequently modifies each scenario in which the operation is involved. |
| Clon | Clone a node. This action is aimed at introducing a replica of a Node. Adding a replica means that every deployed artifact and every connection of the original Node has to be, in turn, cloned. |
| MO2N | Move an existing operation to a new component deployed on a new node. This action is in charge of selecting an operation and moving it to a new component. This action has to synchronize dynamic and deployment views. A lifeline for the newly created component is added in the dynamic view, and messages related to the moved operation are forwarded to it. In the deployment view, a new node, artifact, and related links are created instead. |
The four objectives are detailed in the following paragraphs.
Performance Quality Indicator (performance)
performance quantifies the performance improvement/detriment between two architectural models, and it is defined as follows:
Let be an architectural model resulting from a sequence of refactoring actions applied to the initial one. The performance of is measured using performance indices (). Each performance index is denoted as and represents values such as response time or throughput. Additionally, represents the value of the same index on the initial model.
The multiplying factor is used to indicate the objective for the -th index: i) When , the index is to be maximized, meaning higher values correspond to better performance (e.g., throughput). ii) When , the index is to be minimized, implying that smaller values indicate better performance (e.g., response time).
Finally, the global performance is computed as the average across the number of performance indices considered in the performance analysis.
Refactoring cost (cost)
The refactoring cost (Arcelli et al., 2018), denoted as cost in this study, refers to the effort required to transform the initial architectural model into a changed version by applying refactoring actions. The cost of each refactoring consists of two main components: the baseline refactoring factor (BRF) and the architectural weight (AW). The baseline refactoring factor (BRF) reflects the effort required to apply that specific action, based on our experience with manual refactoring. On the other hand, the architectural weight (AW) is associated with each architectural model element and is determined by the number of connections that element has with other elements in the model. Both BRF and AW can take only positive values, but zero is not allowed to ensure the optimizer considers a variety of actions.
It’s important to note that, in our optimization problem, the relative ratios of BRF values are more crucial than the specific values themselves. The effort needed to perform a refactoring action is quantified as the product of the baseline refactoring factor of the action and the architectural weight of the model element on which the action is applied. Finally, the total refactoring cost (cost) is obtained by summing the efforts of all refactoring actions contained in a sequence.
Performance Antipatterns (pas)
A performance antipattern describes bad design practices that might lead to performance degradation in a system. Smith and Williams have introduced the concepts of performance antipatterns in (Smith and Williams, 2001, 2003b). These textual descriptions were later translated into first-order logic (FOL) equations (Cortellessa et al., 2014). The evolutionary approach exploits the FOL equations to detect the occurrence of performance antipatterns in the model. Table 2 lists the performance antipatterns detectable by the optimization engine.
| Performance antipattern | Description |
|---|---|
| Pipe and Filter | Occurs when the slowest filter in a “pipe and filter” causes the system to have unacceptable throughput. |
| Blob | Occurs when a single component either i) performs the greatest part of the work of a software system or ii) holds the greatest part of the data of the software system. Either manifestation results in excessive message traffic that may degrade performance. |
| Concurrent Processing System | Occurs when processing cannot make use of available processors. |
| Extensive Processing | Occurs when extensive processing in general impedes overall response time. |
| Empty Semi-Truck | Occurs when an excessive number of requests is required to perform a task. It may be due to inefficient use of available bandwidth, an inefficient interface, or both. |
| The Tower of Babel | Occurs when processes use different data formats and spend too much time converting them to an internal format. |
Reliability model (reliability)
The reliability parameters are annotated on UML models by means of the MARTE-DAM profile. The probability of executing a scenario () is specified by annotating UML Use Cases with the GaScenario stereotype. This stereotype has a tag named root that is a reference to the first GaStep in a sequence. We use the GaScenario.root tag to point to the triggering UML Message of a Sequence Diagram and the GaStep.prob to set the execution probability. Failure probabilities of components () are defined by applying the DaComponent stereotype on each UML Component and by setting, in the failure tag, a DaFailure element with the failure probability specified in the occurrenceProb tag. Analogously, failure probabilities of links () are defined in the occurrenceProb tag of the DaConnector stereotype that we apply to UML CommunicationPath elements. Such elements represent the connection links between UML Nodes in a Deployment Diagram. Sequence Diagrams are traversed to obtain the number of invocations of a component in a scenario (denoted by in our reliability model), but also to compute the total size of messages passing over a link in a scenario (denoted by ). The size of a single UML Message is annotated using the GaStep.msgSize tag. The Java implementation of the reliability model is available online.111https://github.com/SEALABQualityGroup/uml-reliability
3. Study Design
This study investigates the impact of the designer’s interaction on the otherwise fully automated optimization of software architectures. To this extent, we designed a process in which a human can intervene at specific search points using the Easier optimization engine222http://sealabtools.di.univaq.it/EASIER/. We intend to provide a human-in-the-loop perspective (Vathsavayi et al., 2013) that enables designers to contribute to the optimization by expressing preferences about regions of interest within the solution space. We hypothesize whether the designer’s interactions avoid unnecessary search efforts, and, therefore, the extra budget could be spent searching relevant regions, eventually leading to identifying more desirable architectural designs.
3.1. Our Interactive Process
To support the designer’s interactions, the solutions are grouped into clusters (Xu and jie Tian, 2015), each capturing a different trade-off, and labels are automatically assigned to these clusters. To assign labels, we apply a 5-point discretization procedure and obtain an ordinal scale for the range of values of each objective. For instance, the reliability values can be converted to the ordinal scale [unreliable, minimally-reliable, average, reliable, very-reliable]333Note that the granularity of discretization for each objective e could be different and depends on the designer choice as a configuration in the process.. A similar procedure can be applied to the other objectives. Thus, the label associated with each solution is the combination of the scale values for each objective. Furthermore, the designer can get a summary of the solution space using prototypes for each cluster, that is, a solution (and its associated label) that best characterizes the instances belonging to a cluster.
In our study, we rely on aggregative clustering (Xu and jie Tian, 2015) to determine homogeneous instances in the solution space. An instance is a vector of objective values for a given architectural model. The similarity among instances is computed as the Euclidean distance between their corresponding vectors. The prototypes are the cluster centroids computed as the mean of the instances belonging to a cluster. The quality of the resulting clusters is assessed with the silhouette coefficient.
Among the possible types of user interaction, according to (Ramirez et al., 2019), our process supports the preference-based interactivity. This type refers to the human who guides the search to particular regions of the solution space. The selection of the cluster prototypes is an example of a trade-off preference for the solution space. Thus, the designer can select a prototype to be considered as the initial architecture for a subsequent optimization round.
On top of this interactive process, we devise a set of experiments to compare the interactive process to the automated one and assess the quality of the resulting solutions. This experimental procedure is outlined in Figure 3.
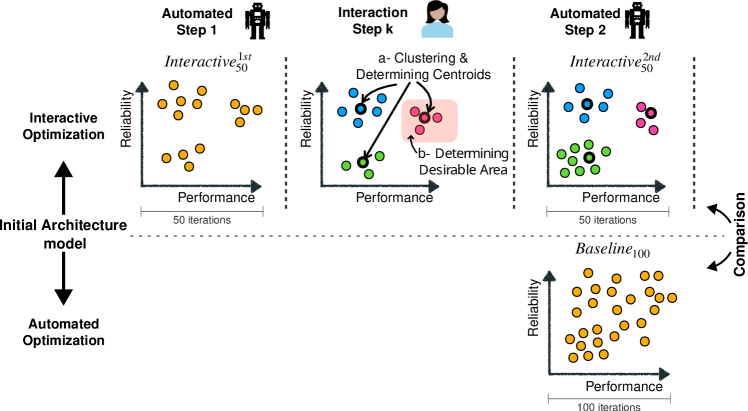
We define our baseline () as the automated optimization lasting evolutionary iterations. In the interactive process, we first run the experiments for iterations (), then let the designer pick a centroid, and finally, we continue the search for more iterations ()444Note that we could have chosen to let the optimization run for more than 100 iterations and let the designer interact with the optimization more than once. We determined these values based on whether the evolutionary algorithm converges to Pareto-optimal solutions for the system under test and the number of clusters appearing after 50 iterations. A larger number of interactions is desirable for a more complex system and a larger number of iterations.. Moreover, we also ran a search of evolutionary iterations () solely to build a reference Pareto front that is required to compute some quality indicators ( and , in our case).
3.2. Research Questions
On the basis of the interactive process described in the previous sections, we define the following research questions.
: To what extent can an interactive approach affect the quality of solutions?
To assess human interactions’ impact on the generated solutions, we compare the Pareto fronts obtained through the interactive experiments with those resulting from non-interactive runs. Estimating the quality of Pareto fronts is commonly carried out by exploiting quality indicators (Li and Yao, 2020). The purpose of such indicators is to quantify the difference between solution sets. Each indicator measures a specific aspect of the front compared to some reference point or set. Consequently, depending on the problem, several quality aspects can be of interest (Wu et al., 2022), and multiple quality indicators can and should be employed to assess them because a solution set can be superior to others in terms of one indicator (e.g., coverage) but inferior with respect to other indicators (e.g., diversity) (Li and Yao, 2020). Among the many quality indicators available, we selected Hypervolume (HV), Inverted Generational Distance Plus (IGD+), and Epsilon (EP) for our study:
-
•
Hypervolume (HV) (Zitzler and Thiele, 1998) is arguably the most commonly used quality indicator. The HV measures the volume of the search space covered by a front and does not require a reference front. It is usually computed against a reference point, but there is a lack of consensus on how to choose such a point for a given problem. Here, as a reference point, we use the nadir point, the worst point in the solution space that each objective can achieve. The HV captures especially the quality aspects of convergence (closeness to the reference point), spread (covered region), and cardinality (number of solutions in the set). High values of HV are preferable because they indicate that the front covers a larger volume.
-
•
Inverted Generational Distance (IGD+) (Ishibuchi et al., 2015) measures the inverted Euclidian distance of a given front from a reference front. Therefore, low values are preferable, and they suggest that the front has good convergence and spread. The accuracy of IGD+ largely depends on the chosen reference front. Since we do not have the optimal front for our problem, we use the front obtained by the longest run (i.e., the 1000 genetic evolutions), as suggested by Li et al. (Li et al., 2022). While we cannot guarantee that the chosen front is optimal, it represents the best front achievable in our settings.
-
•
Epsilon indicator (Zitzler et al., 2003) computes the maximum difference between two fronts. In our case, analogously to IGD+, we use Epsilon to compare a given front with the reference front of the longest run. Epsilon is to be minimized, and similarly to IGD+, it provides an estimate of the convergence and spread of a front with respect to the reference front.
While being helpful in establishing a quantifiable relation between fronts, quality indicators can be challenging to connect to a comprehensive view of the solutions. In our problem, in order to make the best out of the estimates provided by quality indicators, we associate them with the software attributes that a designer is trying to improve. Therefore, this research question investigates how quality indicators relate to the quality of solutions in terms of performance and reliability, which are critical quality attributes in our systems under test.
: How different are, in terms of architectural properties, the solutions generated through an interactive process with respect to the ones generated through a fully automated one?
We are interested here to study specific characteristics of solutions that concern their architectural aspects and go beyond their quality attribute metrics (i.e., performance and reliability).
At first glance, the architectural models can be analyzed in terms of cost of refactoring the initial reference architecture towards the selected target design (cost), and performance antipatterns present in the architecture (pas), as these metrics quantify the structural characteristics of the architectural models.
To better understand the possible variations of cost and pas, we partition the ranges of values for these objectives into five bins (or categories) and derive a 5-point ordinal scale for each objective. For instance, for cost, the scale goes from very-few (lowest, best value) to many (highest, worst value). A similar scale is applied to pas.
To analyze the models in more detail, we look at the refactoring actions contained in the solutions. In particular, we consider the types of refactoring actions and their arrangement into sequences, as they provide insights into the constructive patterns resulting from the optimization process. In other words, we use a given sequence as a proxy for the set of architectural models resulting from applying refactoring actions (with different parameters) on the initial architecture. To assess whether the sequences of refactoring actions from different experiments differ, we compute their intersection.
For a given experiment, we analyze the frequency of the action types used across the sequences. In particular, in a non-interactive process, the possible actions to appear in a sequence are unconstrained. However, when the designer selects an intermediate solution, this sets the initial actions for the sequences to be generated in a subsequent optimization run. We then assume that not all the refactoring actions are used evenly in the sequences. The frequent usage of certain action types in the sequences could correlate with particular architectural models.
: How does an interactive process impact on the coverage of solution space?
In this research question, we look at the whole four-dimensional solution space. The distribution of the objective values, or landscape, might spread differently or exhibit areas with a higher (or lower) concentration of solutions, depending on whether the designer’s interactions are considered.
To visually characterize the landscapes, we employ kernel density estimation (KDE) functions based on heatmaps. A KDE is a mathematical process for computing the probability density function of a random variable in order to create a smooth curve (or surface) for a finite data set (e.g., a scatter plot). The contribution of each point is smoothed out from a single point into a neighborhood. Since our landscapes are four-dimensional, we first apply a Principal Component Analysis (PCA) transformation of the objectives to a 2D space. PCA is a dimensionality reduction technique that projects the data (originally in a high-dimensional space) onto a set of orthogonal axes (in a lower-dimensional space) in such a way that most of the variance of the data is maintained. Although the 2D PCA projections are approximations, the KDE heatmaps allow us to qualitatively compare the landscapes resulting from each experiment.
In addition, we rely on an entropy-based metric (Farhang-Mehr and Azarm, 2004) to quantify the objective trade-offs over the landscape. Entropy is computed on a four-dimensional histogram of the space. The histogram bins represent tradeoff categories of solutions, and they are derived from the 5-point discretization scale mentioned in RQ2, while considering all possible combinations of the objectives. For example, the bin that contains the best optimization values (for performance, reliability, cost, and pas, respectively) is ¡very-fast, very-reliable, very-few, very-few¿. The histogram has, in principle, bins of possible trade-offs, but in an experiment not all of them might contain solutions. The entropy-based metric gets closer to if the space density is primarily flat and homogeneous (representing a non-informative landscape), and it tends to when the space includes peaks and becomes heterogeneous (representing informative landscape) that is the most interesting scenario for the designer.
For RQ3, we arrange all the sequences of refactoring actions of an experiment as a tree, in which the leaves correspond to architectural models and the inner nodes capture refactoring actions shared by the different sequences. The tree representation allows the designer to identify the order of actions applied to each specific architectural model and determine if the spaces explored from the two experiments have intersections (i.e., they share common subtrees). The designer can then use these insights to determine the specific regions of interest based on the quality of solutions. In particular, we build a reference tree for the and then map the trees resulting from the three experiments (the and the two interactive ones) to . The intersection of the trees is an estimation of how much of the search space (as represented by ) is covered by the interactive and non-interactive experiments. The coverage of any tree over is computed as the proportion of nodes in that also appear in .
3.3. Case Study Systems
We experimented with two software systems: Train Ticket Booking Service (TTBS) (Di Pompeo et al., 2019; Zhou et al., 2021) and CoCoME (Herold et al., 2008). The architectural specification, including component, deployment, and use case models (in UML format) and analytical models (LQN) associated with each system are provided to facilitate replications of the results555https://github.com/SEALABQualityGroup/uml2lqn-casestudies/.
Train Ticket Booking Service
Train Ticket Booking Service (TTBS) is a web-based booking application whose architecture is based on the microservices paradigm (Zhou et al., 2021). The system is made up of 40 microservices, each one deployed on a Docker container. Based on the system specification and requirement documents, we specified 11 UML Components in describing the static view, 11 UML Nodes for the deployment view, and 3 UML Use Cases (i.e., login, update user details, and rebook) for the dynamic view of the system.
CoCoME
CoCoME describes a trading system containing several stores. A store might have one or more cash desks for processing goodies. A cash desk is equipped with all the tools needed to serve a customer. Based on the system specification, we specified a static view with 13 UML Components, a deployment view with 8 UML Nodes, and a dynamic view with 3 UML Use Cases.
3.4. Experimental Setup
We report the Easier evolutionary algorithm configurations in Table 3. Since an exhaustive tuning of all the parameters and their combinations is not feasible, we used and , as suggested by Arcuri and Fraser (2011). For the operators, we used Single Point crossover, Binary Tournament selector, and Simple Mutation operators, as provided by the JMetal666https://github.com/jMetal/jMetal library. Furthermore, we set the Population size to 16 elements, and the length of the chromosome to 4 for the and runs, as reported by Di Pompeo and Tucci (2022); and length of 2 for the interactive runs. Each configuration was executed in both case studies 30 times (as suggested by Arcuri and Briand (2011)). Our experiments lasted the equivalent of 126 days on three Dell PowerEdge C6525 servers, each equipped with two AMD EPYC 7282 2.80GHz CPUs and 512 GiB of RAM.
Table 4 lists the cluster centroids selected by the interactions. The centroid attributes include its name (first column), the objectives, and their values (second and third column). The centroid label (second column) describes the trade-off of the corresponding cluster (third column). We released the datasets in our replication package777https://github.com/SpencerLabAQ/replication-package__interactive-search-based-software-performance.
| Configuration | Values |
|---|---|
| Number of genetic evolutions | 1000 (reference), 100 (baseline), 50 + 50 (interaction) |
| Population Size | 16 |
| Length | 4, 2 |
| Number of independent runs | 30 |
| Selection operator | Binary Tournament |
| 0.80 | |
| Crossover Operator | Single Point |
| 0.20 | |
| Mutation Operator | Simple Mutation |
| Centroid | Objective | Value |
| TTBS | ||
| c223 | performance | 0.205996 |
| reliability | 0.788695 | |
| cost | 2.9 | |
| pas | 2.0 | |
| label | fast / very-reliable / very-few / average | |
| c258 | performance | 0.208608 |
| reliability | 0.302645 | |
| cost | 3.28 | |
| pas | 0.0 | |
| label | fast / minimally-reliable / very-few / very-few | |
| CoCoME | ||
| c317 | performance | 0.216461 |
| reliability | 0.759612 | |
| cost | 3.28 | |
| pas | 10.0 | |
| label | fast / very-reliable / very-few / few | |
| c358 | performance | -0.014243 |
| reliability | 0.853851 | |
| cost | 3.28 | |
| pas | 8.0 | |
| label | slow / very-reliable / very-few / few | |
4. Results
4.1. Quality of solutions (RQ1)
Tables 4(a) and 4(b) report the values of the quality indicators computed for the TTBS and CoCoME case studies, respectively. Here, the represents the best we can achieve in our settings. In the case of and , the value reported for the is zero because these quality indicators are computed against itself, as explained in Section 3.2. represents the experiments without interaction, against which we intend to compare the interactive ones.
The first observation is that the cardinality of the Pareto fronts (NPS) — i.e., the number of solutions in the Pareto front — is noticeably reduced by the interaction in all cases. This suggests that the interaction might have the effect of narrowing down the search to specific areas of the solution space, therefore leading to a fewer number of non-dominated solutions. The rest of the quality indicators seem to agree more or less on how far the interactive experiments are from , and that itself achieved a Pareto front that is very close to the one obtained by (see difference in ).
For , in the TTBS case, the interactions covered roughly half of the volume of the , whereas, for CoCoME, the values obtained covered around 70% of the . A similar trend can be observed for and . This confirms that concerning the solution space, the interaction in CoCoME led to solutions being “closer” than TTBS to those in the . Such a result could be considered unexpected since the solution space of CoCoME is larger than that of TTBS, as reported by Cortellessa et al. (2023). Therefore, it should be easier for optimization to approach the in TTBS compared with CoCoME. On the contrary, it seems that the interaction can drive the search into a narrower space, at least in the CoCoME case, but one that contains better solutions and is faster to reach (with 100 genetic evolutions).
| Experiment | NPS | () | () | () |
|---|---|---|---|---|
| 24 | 0.664252 | 0.000000 | 0.000000 | |
| 14 | 0.658054 | 0.084825 | 0.166667 | |
| 2 | 0.353514 | 0.217479 | 0.464450 | |
| 2 | 0.320837 | 0.252510 | 0.447109 |
| Experiment | NPS | () | () | () |
|---|---|---|---|---|
| 89 | 0.893726 | 0.000000 | 0.000000 | |
| 89 | 0.896908 | 0.009903 | 0.034417 | |
| 13 | 0.660844 | 0.078024 | 0.247080 | |
| 30 | 0.622855 | 0.087717 | 0.282114 |
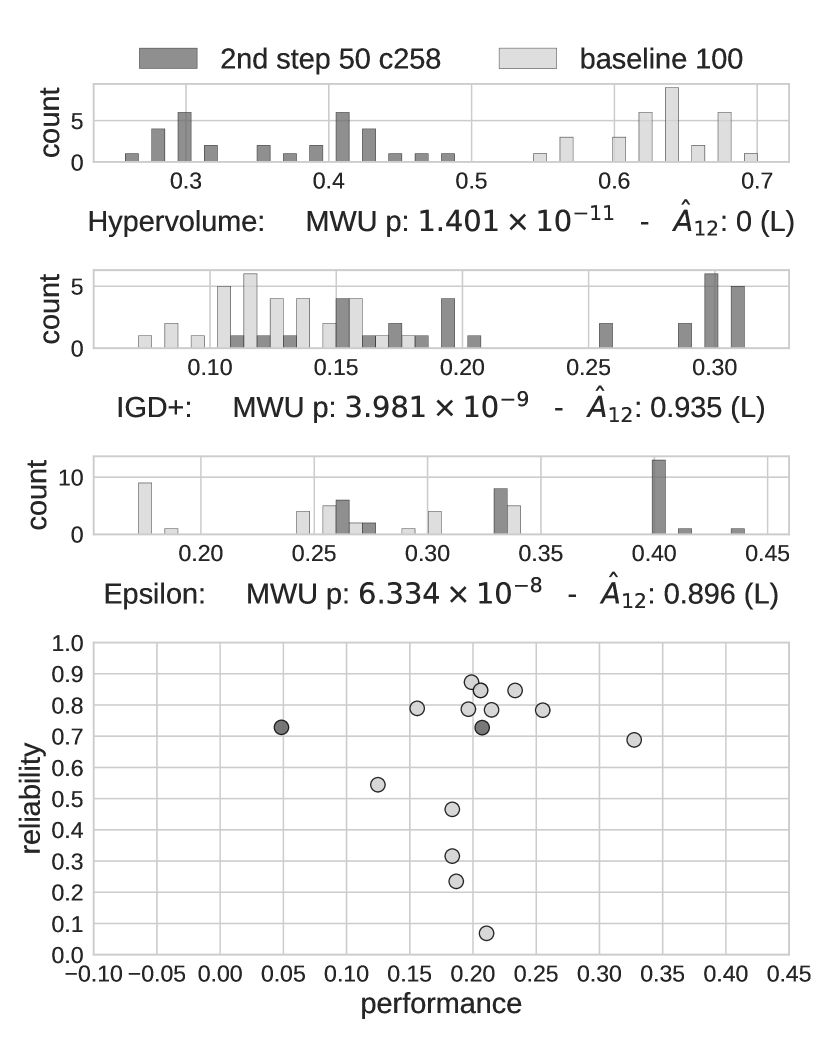
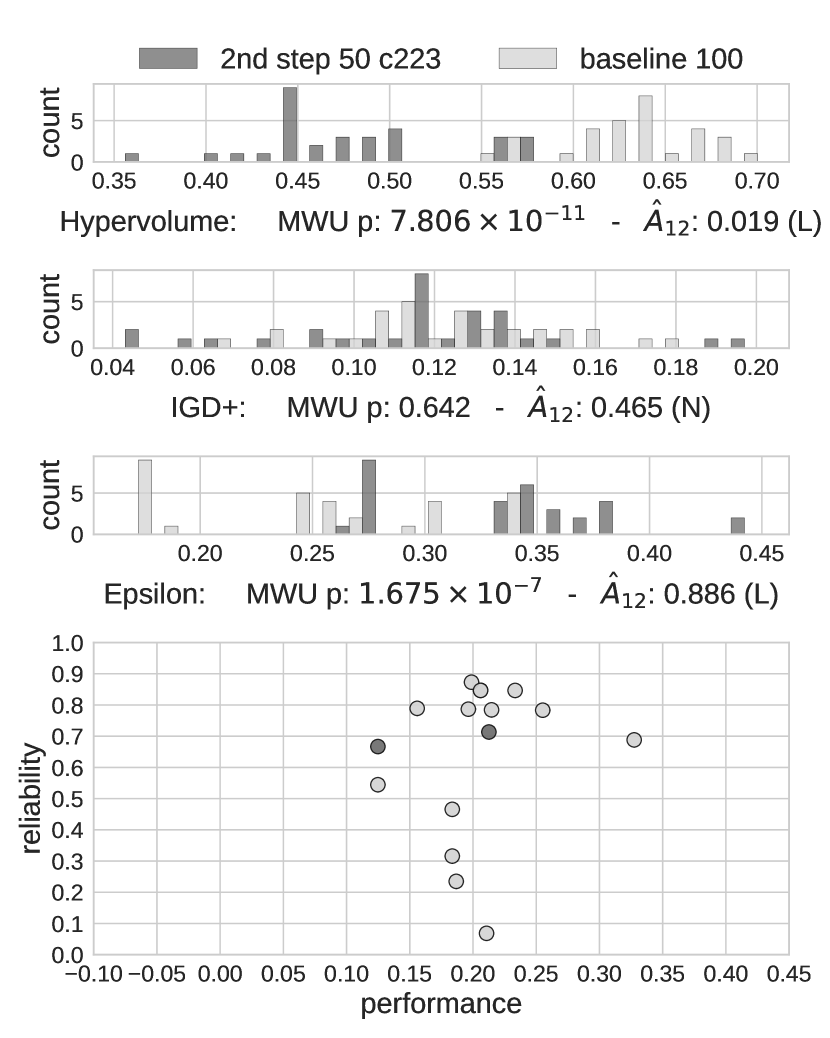
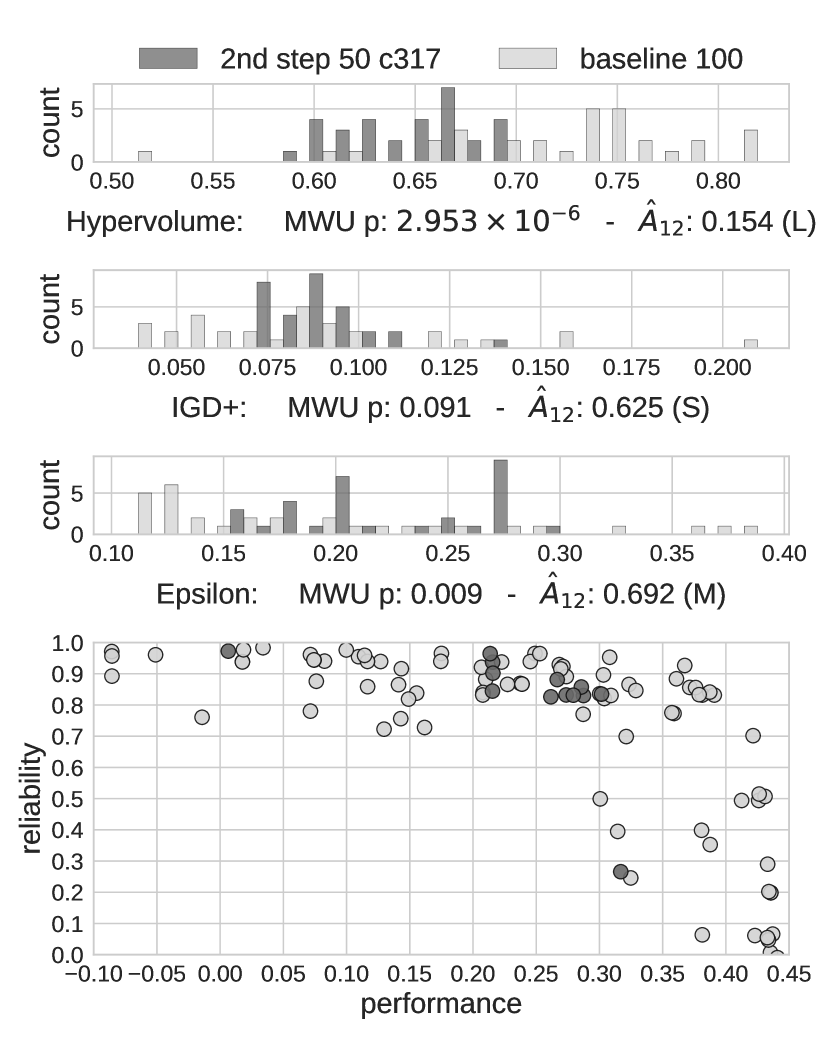
Next, we analyze the variability of quality indicators between runs and how they compare to the performance and reliability values. This analysis is summarized by the plots in Figures 5 and 6, which compare interactive experiments with . On the upper half of these plots, we report the distribution of the quality indicator values among the 30 runs performed for each experimental setting, both for a single interactive experiment and for . We applied the Mann–Whitney U non-parametric statistical test (Mann and Whitney, 1947) where the null hypothesis states that the experiments do not have a statistically significant difference. Two experiments are considered to be significantly different based on the values of a specific quality indicator when the test computes a p-value smaller than . To assess the magnitude of the difference, we used the Vargha–Delaney (Vargha and Delaney, 2000), a standardized non-parametric effect size measure. can take values between and , and a value of indicates that the two experiments are equivalent. The closer the value of gets to or , the larger the effect size. The interpretation of magnitudes as negligible, small, medium, and large is performed according to the thresholds , , and , respectively (Hess and Kromrey, 2004).
As it can be observed for TTBS in Figure 5, in all cases except for in the (Figure 5(b)), there is a significant difference between the interactive experiments and the with large effect size, despite some overlap of the distributions. For , such an overlap is more visible; for , the distributions overlap almost entirely. It can also be observed that the distribution yields a high variance, thus indicating a high variability in the explored space among the runs. Moreover, regardless of the chosen centroid, the Pareto front is confined to two solutions in both interactive cases. One of the interactions (around performance and reliability) has almost the same values of performance and reliability, while the other has a smaller value of performance. Interestingly, the two selected centroids led to excluding designs with low reliability. In both cases, the centroids had a relatively good value of performance, which was preserved (to some extent) in the very small front obtained from the interaction. The variation in performance, when comparing the two interactive fronts, might be caused by the number of performance antipatterns associated with the centroids. In fact, started without (detected) antipatterns, while had only two antipatterns. This most probably left the latter with more opportunities for refactoring that effectively shrinks the Pareto front toward better performance values.
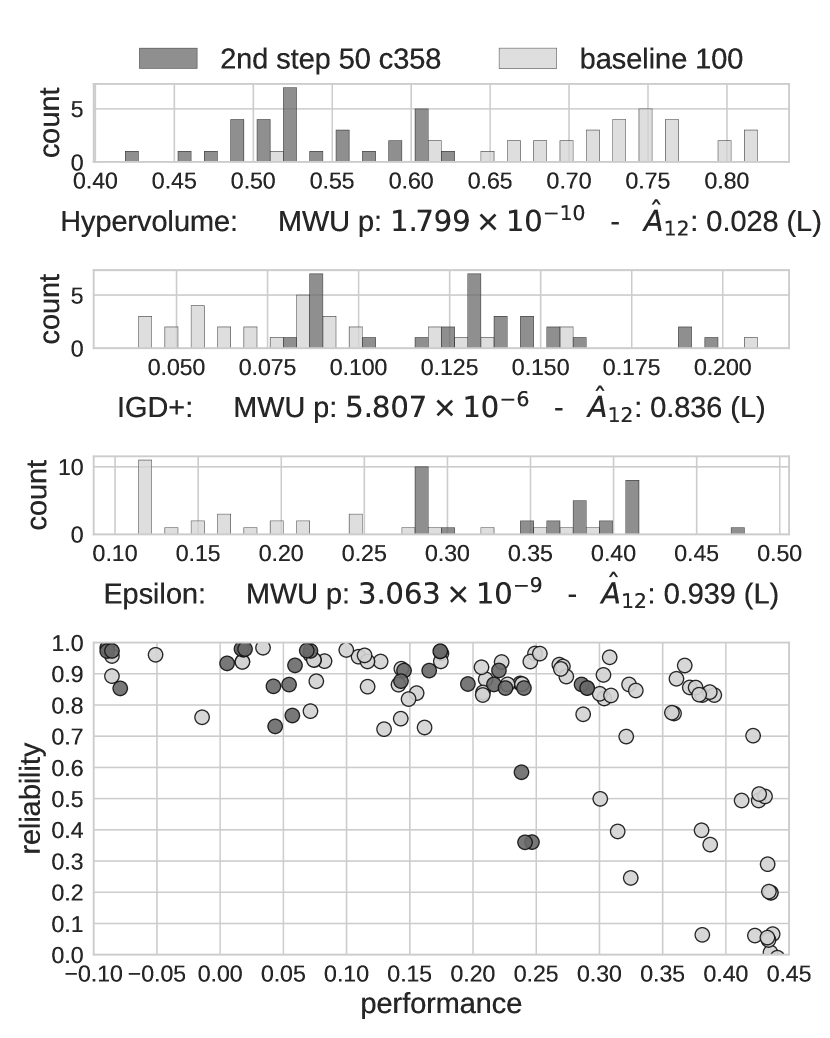
The situation appears different for CoCoME in Figure 6. First, the distributions of the quality indicators show considerably less variance. The experiment (Figure 6(a)) shows a mix of effect sizes, ranging from small to large. On the contrary, (Figure 6(b)) always reports a large effect size. In the first case, this means that depending on the specific quality indicator, we can be more or less sure of how distant the interactive front is from the , whereas, in the second case, the results are more consistent. This difference between the two interactive cases can also be found in the solution space. The interaction seems to have driven the search to the upper right corner toward better performance and reliability values since almost all the front solutions are concentrated in that corner. Conversely, in the front is more spread, providing more dissimilarity among the alternatives. However, in both cases, the fronts include very few solutions with a lower reliability than . The difference in the observed spread along the performance axis might be caused by the centroid selection during the interaction. The centroids for the experiments and slightly differ in reliability, but are on the opposite ends of the objective performance. had a very good starting value of performance, while had among the lowest performance we observed. This provided more room for to spread along the performance axis while looking for better solutions, leading to the spread observed in the final Pareto front.
4.2. Architectural differences (RQ2)
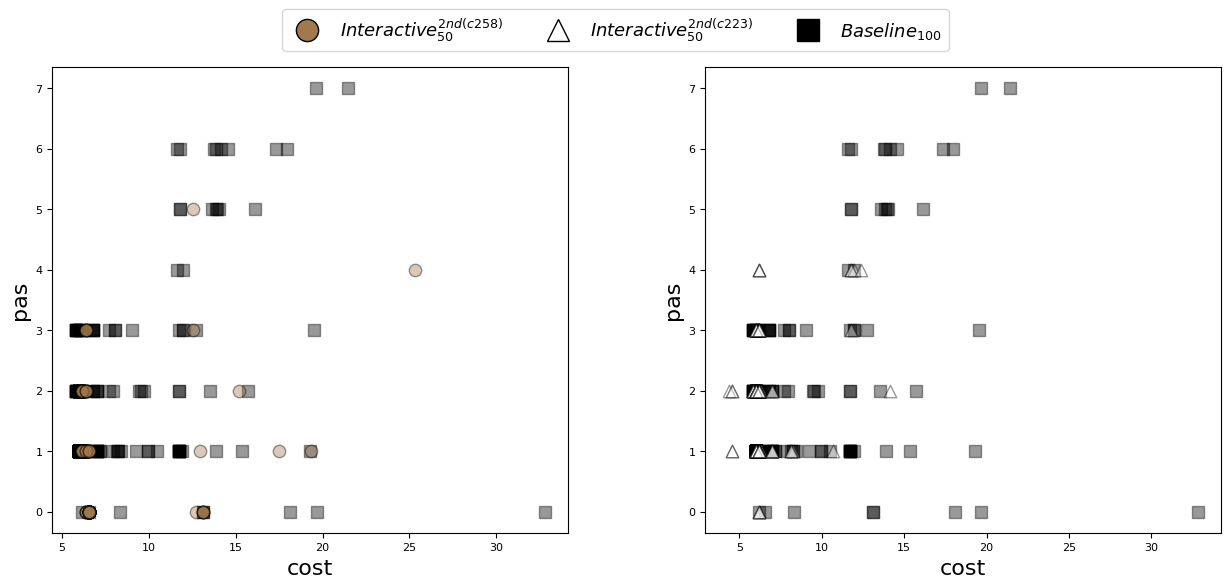
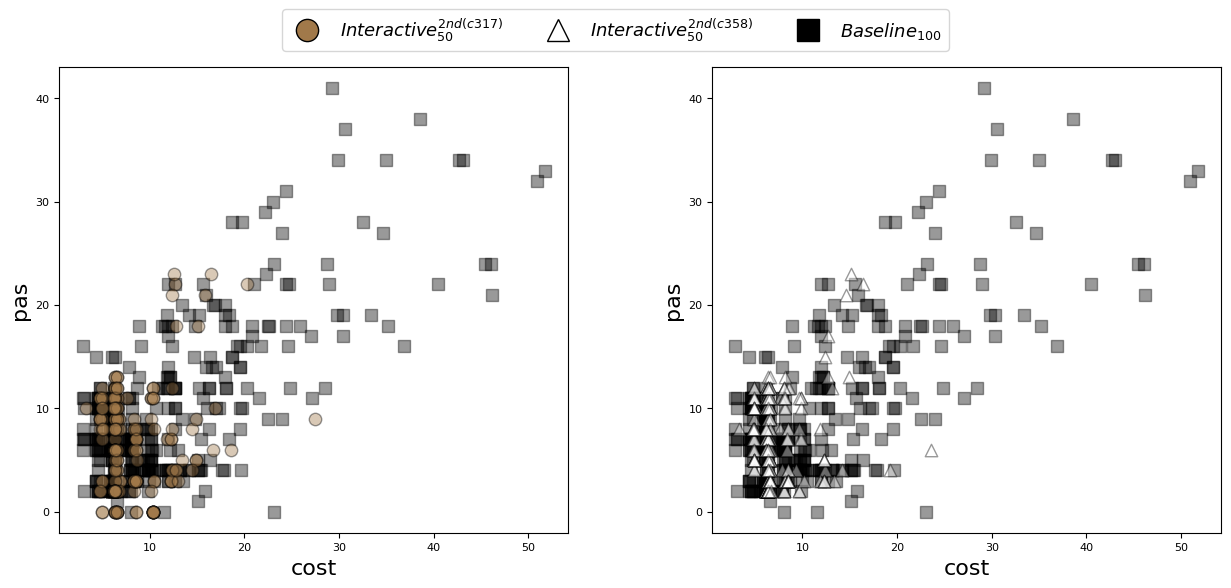
The scatter plots in Figure 7 show the solution spaces for the two case studies when considering cost and pas as high-level model characteristics. The symbols expose the differences between the (without interaction) and the interactive experiments. The latter covers a well-defined and narrower area (compared to the area explored by the baseline), suggesting that centroid choices led to less variety in the explored designs. In particular, in CoCoME these models are confined to the ranges and for cost and pas, respectively; while for TTBS the models are in the ranges and , respectively. This is an initial indicator of space differences attributed to the designer’s interaction, as reflected in RQ1.
Based on the 5-point Likert scales for cost and pas, we observed that the solutions resulting from the interactions focused on specific categories, while the provided solutions covering several of such categories – as hinted by the dispersion of the blue points in Figure 7. We argue that the categories of the solutions were conditioned by (or correlated with) the characteristics of the selected centroids. In CoCoME, both centroids had the same structural characteristics – (very-few, very-few) for cost and pas), and the resulting solutions mainly fell under that category. A similar pattern was observed for the solutions derived from the centroids chosen for TTBS. This means the models (after the interactions) are close to the initial architecture (regarding changes) and have very few antipatterns. Furthermore, the optimization algorithm that minimizes both architectural objectives drives the trend towards the (very-few, very-few) category for cost and pas.
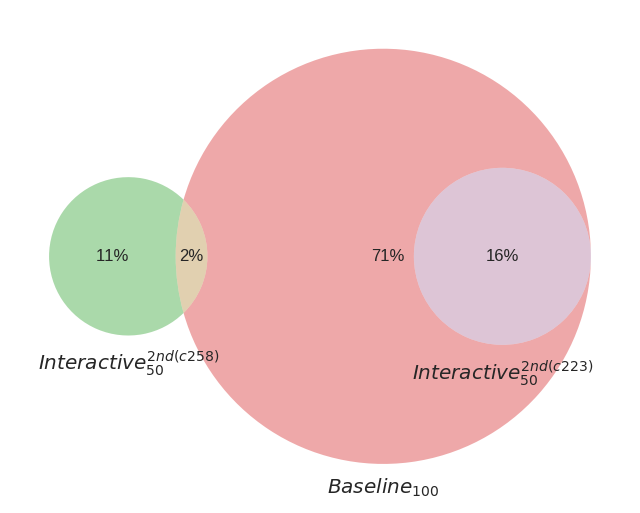
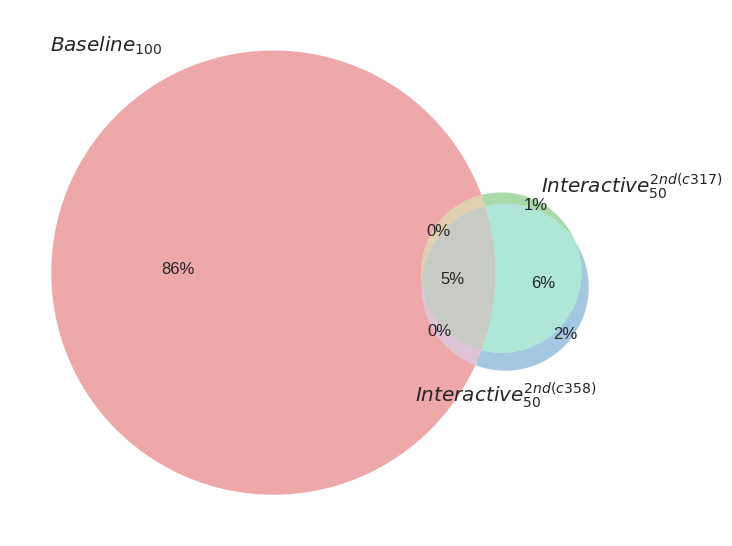
The intersections among the sequences of refactoring actions from the different experiments are shown in the Venn diagrams of Figure 8. In both case studies, the exhibited many more unique sequences than the sets resulting from interactive experiments. The higher the number of unique sequences, the more diversity in the corresponding models. However, the interactive approach’s lack of diversity in the designs explored is expected based on the experimental design. The form of interaction that we have set in this work nudges the optimization to explore particular regions, and therefore, such lack of diversity is a feature, not a bug. Similar results have been reported in preference-based optimization literature (Iqbal et al., 2020; Abdolshah et al., 2019). In addition, we noticed that the two sets of sequences resulting from the CoCoME interactive experiments were very similar between them (Figure 8(b)).
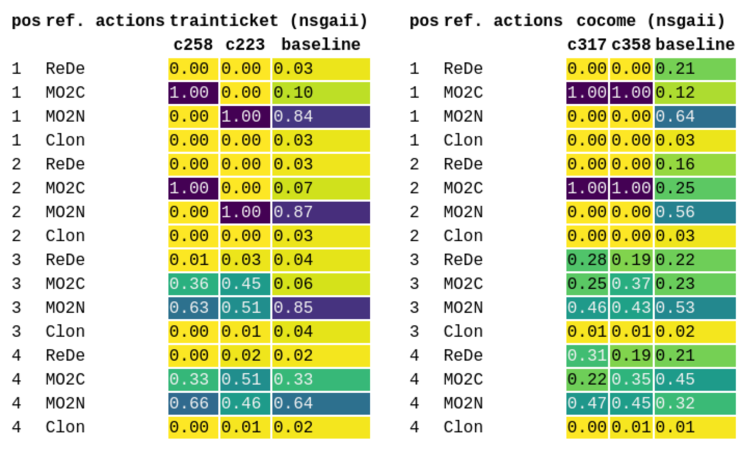
The tables of Figure 9 report the frequencies of the refactoring actions across the four positions of the sequences. Having a smaller number of unique sequences in the interactive experiments can be partial because the centroids “freeze” the two initial actions of the sequences. As highlighted in Figure 9 (dark values), actions MO2C and MO2N were selected for TTBS (columns c-258 and c-223), while MO2D was selected for CoCoME (columns c-317 and c-358), respectively.
Interestingly, the interactive experiments exhibited different frequency profiles than the in both case studies. The frequency variations are apparent in the third and fourth positions of the tables in Figure 9 (green values). For TTBS, MO2N was the most prevalent action in the three experiments, but it was less prevalent when picking the centroids in favor of MO2C. The was exclusively focused on using MO2N. For CoCoME, there were variations in the frequency values, with MO2N being the most prevalent action and some contributions of MO2C. Along this line, we argue that the designer’s interactions likely influence the composition of actions in the sequences. The only exception was in TTBS (column c-223), which has a similar profile as the baseline. This is correlated with Figure 8(a), in which the resulting sequences are all shared by the baseline.
5. Related work
Steering the search towards regions of the solution space that are of interest (or preferred) to the human architect is still a challenge (Aljawawdeh et al., 2015). The optimization might spend a considerable time looking for candidate solutions in some space regions that only contain a few relevant solutions (for the architect) and disregard other promising regions, which is not cost-effective. Human interaction can help to steer the search toward the direction desired by the architect, avoiding wasting resources on exploring areas that are not considered interesting (Ramirez et al., 2018).
There is a trend of adding interaction to architecture optimization by allowing human architects to participate at specific points of the search process (Vathsavayi et al., 2013) — also known as human-in-the-loop. For instance, the user can: (i) judge if specific solutions meet the quality-attribute goals, (ii) provide positive or negative feedback about particular trade-offs (in a multi-objective context), (iii) adjust parameters of the algorithms, (iv) or ask for a more detailed search (i.e., exploitation) of solutions following a predefined pattern, among others. Ramirez et al. (2019) investigate the state-of-the-art in interactive search-based software engineering and distinguish four categories of interactions. The preference-based interactivity comprises interactions the architect uses to express preferences during the search, e.g., selecting candidates. Using interactive reoptimization, the architect can redefine the search objectives, e.g., by removing an objective. Furthermore, in human-based evaluation, the architect (partially) inspects and evaluates the candidates, while his/her actions directly impact the generated candidates in a human-guided search. Although interactive mechanisms have been employed in search-based optimization tools for other domains, in a structured literature review investigating state of the art until 2019, Ramirez et al. (2019) do not report any approaches for software architecture optimization that use preference-based interactivity.
Among more recent works, we identified some that use similar techniques as our proposed framework and/or investigate the effects of human interactions on the results. The approach by Rebai et al. (2020) clusters solutions regarding quality and code locations before developers express their preferences for a few (representative) solutions. In their evaluation, they investigated the effect on the proposed solutions’ usefulness, execution times, recommended refactorings, and numbers of interactions and compared it to four other (non-)interactive approaches. In contrast to our work, they focus on the QMOOD (Bansiya and Davis, 2002) qualities (flexibility, reusability, understandability, effectiveness, functionality, extendibility) and conduct a user study that does not investigate the quality of Pareto fronts and architectural objectives.
The approach by Alizadeh et al. (2020) aims to maximize the QMOOD (Bansiya and Davis, 2002) qualities while minimizing the deviation from an initial solution. It allows users to approve, modify, and reject refactoring actions that lead to solutions and takes this feedback into account. The evaluation compares the approach against other (non-)interactive approaches regarding solution correctness, solution relevance, code-smell fixing capabilities, and achieved quality improvement.
The Nautilus framework for interactive search-based software engineering by Ferreira et al. (2020) allows humans to guide the search to solve various software engineering problems by categorizing solutions as preferred or not preferred. While Nautilus can be used to optimize software architectures, it does not provide specific support for this use case. Furthermore, its evaluation mainly focuses on usability rather than on solution quality.
Using the approach by Ramirez et al. (2018), users are presented with solutions obtained from a clustering process and have to reward or penalize aspects of the given solutions. The approach combines qualitative and quantitative evaluation criteria in the objective function, i.e., it considers the solution quality and architectural aspects. In their evaluation, the authors investigate the impact of the interactions on the solution based on questionnaires and log files. In particular, they investigate the participants’ use of the implemented architectural preferences.
Chen and Li (2022) conducted an empirical study to investigate whether and when performance aspirations (i.e., the information in performance requirements that makes it quantifiable) should be considered in configuration tuning. In contrast to our work, they do not consider interactions and focus solely on performance requirements.
Although our work does not investigate the use of visualization, there are works (Kudo and Yoshikawa, 2012; Schulz et al., 2018) on using visualization techniques to support human interaction in the optimization process. These tools allow users to inspect samples of the solution space (e.g., via a Pareto diagram) and adjust their search criteria accordingly. A representative example is the GATSE project (Procter and Wrage, 2019), a visual prototype for AADL (Architecture Analysis and Description Language) that displays quality-attribute analyses of architectural alternatives, enabling the architect to focus on regions of the quality-attribute space and narrow down the search — also referred to as “design by shopping.”
While several of the mentioned works include and investigate human interaction in search-based software engineering, our work is the first to investigate the effects of clustering-based candidate selection on the quality of Pareto fronts and architectural models. In particular, our work is the first that does this for the four quality attributes performance, reliability, cost, and pas.
6. Conclusion
In this work, we investigate if particular designers’ interactions in the middle of an architecture optimization process can influence the outputs of the process. To do so, we took two existing case studies from the literature and performed several experiments, where we analyzed differences between a fully automated process and an interactive one. We materialized the interactions as the choice of representative solutions (cluster centroids) from the space. We observed correlations between the interactions and the characteristics of the resulting solutions when compared to the solutions generated by a baseline optimization process (without interactions). According to our experiments, the interactions seem to focus the search on narrow areas of objective space, which have less variability in their ranges of values. As the search intensifies in those areas, the interactions can contribute to the discovery of new architectural models that might lead to new trade-offs regarding the objectives. Furthermore, the solutions obtained seem to be close to the chosen centroids, depending on the features of the space under consideration. Thus, a key research finding is that steering the optimization by anchoring specific solutions (for subsequent search rounds) can be beneficial in terms of solution diversity but it also can reduce the computational costs spent in the exploration.
A lesson learned from this work is about the challenge of assessing the quality of the solutions. Although several quality indicators for the objectives exist in the literature (used in RQ1), less attention has been paid to indicators for the quality of the architectural models resulting from the optimization process.
We envision two immediate future works: (i) extending the experimental design by incorporating additional interaction modes (Ramirez et al., 2019) and assessing their effects on the process; (ii) introducing indicators to assess the quality of architectural models, thus enabling clustering techniques that can help designers to get better insights into the characteristics of those models, and to make the search process more effective.
Acknowledgements.
Daniele Di Pompeo and Michele Tucci were supported by European Union — NextGenerationEU — National Recovery and Resilience Plan (Piano Nazionale di Ripresa e Resilienza, PNRR) — Project: “SoBigData.it — Strengthening the Italian RI for Social Mining and Big Data Analytics” — Prot. IR0000013 — Avviso n. 3264 del 28/12/2021. Sebastian Frank was supported by German Federal Ministry of Education and Research (BMBF), project: “dqualizer: Domain-centric Runtime Quality Analysis of Business-critical Application Systems”, grant number 01IS22007A/B.. The work of Pooyan Jamshidi has been supported, in part, by National Science Foundation (Awards 2007202, 2107463, and 2233873). J. Andres Diaz-Pace was supported by project PICT-2021-00757, Argentina.References
- (1)
- Abdolshah et al. (2019) Majid Abdolshah, Alistair Shilton, Santu Rana, Sunil Gupta, and Svetha Venkatesh. 2019. Multi-objective Bayesian optimisation with preferences over objectives. In Advances in Neural Information Processing Systems 32: Annual Conference on Neural Information Processing Systems 2019, NeurIPS 2019, December 8-14, 2019, Vancouver, BC, Canada, Hanna M. Wallach, Hugo Larochelle, Alina Beygelzimer, Florence d’Alché-Buc, Emily B. Fox, and Roman Garnett (Eds.). Curran Associates, Inc., Vancouver, BC, Canada, 12214–12224. https://proceedings.neurips.cc/paper/2019/hash/a7b7e4b27722574c611fe91476a50238-Abstract.html
- Aleti et al. (2009) Aldeida Aleti, Stefan Björnander, Lars Grunske, and Indika Meedeniya. 2009. ArcheOpterix: An extendable tool for architecture optimization of AADL models. In ICSE MOMPES Workshop. IEEE Computer Society, Washington, DC, USA, 61–71.
- Aleti et al. (2013) Aldeida Aleti, Barbora Buhnova, Lars Grunske, and Indika Meedeniya. 2013. Software Architecture Optimization Methods: A Systematic Literature Review. IEEE Trans. Software Eng. 39, 5 (2013), 658–683.
- Alipourfard et al. (2017) Omid Alipourfard, Hongqiang Harry Liu, Jianshu Chen, Shivaram Venkataraman, Minlan Yu, and Ming Zhang. 2017. CherryPick: Adaptively Unearthing the Best Cloud Configurations for Big Data Analytics. In 14th USENIX Symposium on Networked Systems Design and Implementation, NSDI 2017, Boston, MA, USA, March 27-29, 2017, Aditya Akella and Jon Howell (Eds.). USENIX Association, Boston, MA, USA, March 27-29, 2017, 469–482.
- Alizadeh et al. (2020) Vahid Alizadeh, Marouane Kessentini, Mohamed Wiem Mkaouer, Mel Ó Cinnéide, Ali Ouni, and Yuanfang Cai. 2020. An Interactive and Dynamic Search-Based Approach to Software Refactoring Recommendations. IEEE Transactions on Software Engineering 46, 9 (2020), 932–961. https://doi.org/10.1109/TSE.2018.2872711
- Aljawawdeh et al. (2015) Hamzeh J. Aljawawdeh, Christopher L. Simons, and Mohammed Odeh. 2015. Metaheuristic Design Pattern: Preference. In Genetic and Evolutionary Computation Conference, GECCO 2015, Madrid, Spain, July 11-15, 2015, Companion Material Proceedings, Sara Silva and Anna Isabel Esparcia-Alcázar (Eds.). ACM, Madrid, Spain, 1257–1260. https://doi.org/10.1145/2739482.2768498
- Arcelli et al. (2018) Davide Arcelli, Vittorio Cortellessa, Mattia D’Emidio, and Daniele Di Pompeo. 2018. EASIER: An Evolutionary Approach for Multi-objective Software ArchItecturE Refactoring. In IEEE International Conference on Software Architecture, ICSA 2018, Seattle, WA, USA, April 30 - May 4, 2018. IEEE Computer Society, Seattle, WA, USA, 105–114. https://doi.org/10.1109/ICSA.2018.00020
- Arcuri and Briand (2011) Andrea Arcuri and Lionel Briand. 2011. A practical guide for using statistical tests to assess randomized algorithms in software engineering. In Proceedings of the 33rd International Conference on Software Engineering (ICSE ’11). Association for Computing Machinery, New York, NY, USA, 1–10. https://doi.org/10.1145/1985793.1985795
- Arcuri and Fraser (2011) Andrea Arcuri and Gordon Fraser. 2011. On Parameter Tuning in Search Based Software Engineering. In Search Based Software Engineering - Third International Symposium, SSBSE 2011, Szeged, Hungary, September 10-12, 2011. Proceedings (Lecture Notes in Computer Science, Vol. 6956), Myra B. Cohen and Mel Ó Cinnéide (Eds.). Springer, Szeged, Hungary, 33–47. https://doi.org/10.1007/978-3-642-23716-4_6
- Bansiya and Davis (2002) J. Bansiya and C.G. Davis. 2002. A hierarchical model for object-oriented design quality assessment. IEEE Transactions on Software Engineering 28, 1 (2002), 4–17. https://doi.org/10.1109/32.979986
- Bass et al. (2021) Len Bass, Paul Clements, and Rick Kazman. 2021. Software Architecture in Practice (4 ed.). Addison-Wesley Longman Publishing Co., Inc., USA.
- Bavota et al. (2014) Gabriele Bavota, Massimiliano Di Penta, and Rocco Oliveto. 2014. Search Based Software Maintenance: Methods and Tools. In Evolving Software Systems, Tom Mens, Alexander Serebrenik, and Anthony Cleve (Eds.). Springer, 103–137. https://doi.org/10.1007/978-3-642-45398-4_4
- Bernardi et al. (2011) Simona Bernardi, José Merseguer, and Dorina C. Petriu. 2011. A dependability profile within MARTE. Softw. Syst. Model. 10, 3 (2011), 313–336. https://doi.org/10.1007/s10270-009-0128-1
- Blum and Roli (2003) Christian Blum and Andrea Roli. 2003. Metaheuristics in combinatorial optimization: Overview and conceptual comparison. ACM Comput. Surv. 35, 3 (2003), 268–308. https://doi.org/10.1145/937503.937505
- Chen et al. (2021) Junjie Chen, Ningxin Xu, Peiqi Chen, and Hongyu Zhang. 2021. Efficient Compiler Autotuning via Bayesian Optimization. In 43rd IEEE/ACM International Conference on Software Engineering, ICSE 2021, Madrid, Spain, 22-30 May 2021. IEEE, Madrid, Spain, 1198–1209. https://doi.org/10.1109/ICSE43902.2021.00110
- Chen and Li (2022) Tao Chen and Miqing Li. 2022. Do Performance Aspirations Matter for Guiding Software Configuration Tuning? An Empirical Investigation under Dual Performance Objectives. ACM Trans. Softw. Eng. Methodol. 32, 3, Article 68 (nov 2022), 41 pages. https://doi.org/10.1145/3571853
- Corne et al. (2001) David W. Corne, Nick R. Jerram, Joshua D. Knowles, and Martin J. Oates. 2001. PESA-II: Region-Based Selection in Evolutionary Multiobjective Optimization. In Proceedings of the 3rd Annual Conference on Genetic and Evolutionary Computation (GECCO’01). Morgan Kaufmann Publishers Inc., San Francisco, CA, USA, 283–290.
- Cortellessa et al. (2023) Vittorio Cortellessa, Daniele Di Pompeo, Vincenzo Stoico, and Michele Tucci. 2023. Many-objective optimization of non-functional attributes based on refactoring of software models. Information and Software Technology 157 (2023), 107159. https://doi.org/10.1016/j.infsof.2023.107159
- Cortellessa et al. (2020) Vittorio Cortellessa, Romina Eramo, and Michele Tucci. 2020. From software architecture to analysis models and back: Model-driven refactoring aimed at availability improvement. Information and Software Technology 127 (Nov 2020), 106362. https://doi.org/10.1016/j.infsof.2020.106362
- Cortellessa et al. (2011) Vittorio Cortellessa, Antinisca Di Marco, and Paola Inverardi. 2011. Model-Based Software Performance Analysis. Springer. https://doi.org/10.1007/978-3-642-13621-4
- Cortellessa et al. (2014) Vittorio Cortellessa, Antinisca Di Marco, and Catia Trubiani. 2014. An approach for modeling and detecting software performance antipatterns based on first-order logics. Softw. Syst. Model. 13, 1 (2014), 391–432. https://doi.org/10.1007/s10270-012-0246-z
- Di Pompeo and Tucci (2022) Daniele Di Pompeo and Michele Tucci. 2022. Search Budget in Multi-Objective Refactoring optimization: a Model-Based Empirical Study. In 2022 48th Euromicro Conference on Software Engineering and Advanced Applications (SEAA). IEEE, Gran Canaria, Spain, 406–413. https://doi.org/10.1109/SEAA56994.2022.00070
- Di Pompeo et al. (2019) Daniele Di Pompeo, Michele Tucci, Alessandro Celi, and Romina Eramo. 2019. A Microservice Reference Case Study for Design-Runtime Interaction in MDE. In STAF MDE@DeRun Workshop (CEUR Workshop Proceedings, Vol. 2405). CEUR-WS.org, Eindhoven, The Netherlands, 23–32. http://ceur-ws.org/Vol-2405/06_paper.pdf
- Farhang-Mehr and Azarm (2004) Ali Farhang-Mehr and Shapour Azarm. 2004. An Information-Theoretic Entropy Metric for Assessing Multi-Objective Optimization Solution Set Quality. Journal of Mechanical Design 125, 4 (01 2004), 655–663. https://doi.org/10.1115/1.1623186
- Ferreira et al. (2020) Thiago Ferreira, Silvia Regina Vergilio, and Marouane Kessentini. 2020. Nautilus: An Interactive Plug-and-Play Search-Based Software Engineering Framework. IEEE Software 38, 5 (2020), 73–82.
- Franks et al. (2009) Greg Franks, Tariq Al-Omari, Murray Woodside, Olivia Das, and Salem Derisavi. 2009. Enhanced Modeling and Solution of Layered Queueing Networks. IEEE Transactions on Software Engineering 35, 22 (Mar 2009), 148–161. https://doi.org/10.1109/TSE.2008.74
- Group (2008) Object Management Group. 2008. A UML profile for MARTE: modeling and analysis of real-time embedded systems. Object Management Group. http://www.omg.org/omgmarte/
- Guerrero et al. (2010) Jose L. Guerrero, Luis Marti, Antonio Berlanga, Jesus Garcia, and Jose M. Molina. 2010. Introducing a robust and efficient stopping criterion for MOEAs. In IEEE Congress on Evolutionary Computation. IEEE, Barcelona, Spain, 1–8. https://doi.org/10.1109/CEC.2010.5586265
- Herold et al. (2008) Sebastian Herold, Holger Klus, Yannick Welsch, Constanze Deiters, Andreas Rausch, Ralf Reussner, Klaus Krogmann, Heiko Koziolek, Raffaela Mirandola, Benjamin Hummel, Michael Meisinger, and Christian Pfaller. 2008. CoCoME - The Common Component Modeling Example. In The Common Component Modeling Example: Comparing Software Component Models (LNCS, Vol. 5153). Springer Berlin Heidelberg, Berlin, Heidelberg, 16–53. https://doi.org/10.1007/978-3-540-85289-6_3
- Hess and Kromrey (2004) Melinda R. Hess and Jeffrey D. Kromrey. 2004. Robust Confidence Intervals for Effect Sizes: A Comparative Study of Cohen’s d and Cliff’s Delta Under Non-normality and Heterogeneous Variances. In American Educational Research Association. 1–30. https://www.semanticscholar.org/paper/Robust-Confidence-Intervals-for-Effect-Sizes%3A-A-of-Hess-Kromrey/b042a70162663d0c1d9a335fb79c15bd1428321a
- Hiroyasu et al. (2005) Tomoyuki Hiroyasu, Seiichi Nakayama, and Mitsunori Miki. 2005. Comparison study of SPEA2+, SPEA2, and NSGA-II in diesel engine emissions and fuel economy problem. In Proceedings of the IEEE Congress on Evolutionary Computation, CEC 2005, 2-4 September 2005, Edinburgh, UK. IEEE, Edinburgh, UK, 236–242. https://doi.org/10.1109/CEC.2005.1554690
- Iqbal et al. (2022) Md Shahriar Iqbal, Rahul Krishna, Mohammad Ali Javidian, Baishakhi Ray, and Pooyan Jamshidi. 2022. Unicorn: reasoning about configurable system performance through the lens of causality. In EuroSys ’22: Seventeenth European Conference on Computer Systems, Rennes, France, April 5 - 8, 2022, Yérom-David Bromberg, Anne-Marie Kermarrec, and Christos Kozyrakis (Eds.). ACM, Rennes, France, 199–217. https://doi.org/10.1145/3492321.3519575
- Iqbal et al. (2020) Md Shahriar Iqbal, Jianhai Su, Lars Kotthoff, and Pooyan Jamshidi. 2020. FlexiBO: Cost-Aware Multi-Objective Optimization of Deep Neural Networks. CoRR abs/2001.06588 (2020), 1–37. arXiv:2001.06588 https://arxiv.org/abs/2001.06588
- Ishibuchi et al. (2015) Hisao Ishibuchi, Hiroyuki Masuda, Yuki Tanigaki, and Yusuke Nojima. 2015. Modified Distance Calculation in Generational Distance and Inverted Generational Distance. In Evolutionary Multi-Criterion Optimization (Lecture Notes in Computer Science, Vol. 9019), António Gaspar-Cunha, Carlos Henggeler Antunes, and Carlos Coello Coello (Eds.). Springer International Publishing, Cham, 110–125. https://doi.org/10.1007/978-3-319-15892-1_8
- Jamshidi and Casale (2016) Pooyan Jamshidi and Giuliano Casale. 2016. An Uncertainty-Aware Approach to Optimal Configuration of Stream Processing Systems. In 24th IEEE International Symposium on Modeling, Analysis and Simulation of Computer and Telecommunication Systems, MASCOTS 2016, London, United Kingdom, September 19-21, 2016. IEEE Computer Society, London, UK, 39–48. https://doi.org/10.1109/MASCOTS.2016.17
- Kebir et al. (2017) Salim Kebir, Isabelle Borne, and Djamel Meslati. 2017. A genetic algorithm-based approach for automated refactoring of component-based software. Information and Software Technology 88 (2017), 17–36. https://doi.org/10.1016/j.infsof.2017.03.009
- Kessentini et al. (2012) Marouane Kessentini, Houari A. Sahraoui, Mounir Boukadoum, and Omar Benomar. 2012. Search-based model transformation by example. Softw. Syst. Model. 11, 2 (2012), 209–226. https://doi.org/10.1007/s10270-010-0175-7
- Koziolek et al. (2011) Anne Koziolek, Heiko Koziolek, and Ralf Reussner. 2011. PerOpteryx: automated application of tactics in multi-objective software architecture optimization. In Proceedings of the joint ACM SIGSOFT conference – QoSA and ACM SIGSOFT symposium – ISARCS on Quality of software architectures – QoSA and architecting critical systems – ISARCS. ACM, Boulder Colorado USA, 33–42. https://doi.org/10.1145/2000259.2000267
- Kudo and Yoshikawa (2012) Fumiya Kudo and Tomohiro Yoshikawa. 2012. Knowledge extraction in multi-objective optimization problem based on visualization of Pareto solutions. In Proceedings of the IEEE Congress on Evolutionary Computation, CEC 2012, Brisbane, Australia, June 10-15, 2012. IEEE, Brisbane, Australia, 1–6. https://doi.org/10.1109/CEC.2012.6256449
- Li et al. (2020) Chi Li, Shu Wang, Henry Hoffmann, and Shan Lu. 2020. Statically inferring performance properties of software configurations. In EuroSys ’20: Fifteenth EuroSys Conference 2020, Heraklion, Greece, April 27-30, 2020, Angelos Bilas, Kostas Magoutis, Evangelos P. Markatos, Dejan Kostic, and Margo I. Seltzer (Eds.). ACM, Heraklion, Greece, 10:1–10:16. https://doi.org/10.1145/3342195.3387520
- Li et al. (2022) Miqing Li, Tao Chen, and Xin Yao. 2022. How to Evaluate Solutions in Pareto-Based Search-Based Software Engineering: A Critical Review and Methodological Guidance. IEEE Transactions on Software Engineering 48, 5 (May 2022), 1771–1799. https://doi.org/10.1109/TSE.2020.3036108
- Li and Yao (2020) Miqing Li and Xin Yao. 2020. Quality Evaluation of Solution Sets in Multiobjective Optimisation: A Survey. Comput. Surveys 52, 2 (Mar 2020), 1–38. https://doi.org/10.1145/3300148
- Mann and Whitney (1947) Henry B. Mann and Donald R. Whitney. 1947. On a Test of Whether one of Two Random Variables is Stochastically Larger than the Other. The Annals of Mathematical Statistics 18, 1 (Mar 1947), 50–60. https://doi.org/10.1214/aoms/1177730491
- Mariani and Vergilio (2017) Thainá Mariani and Silvia Regina Vergilio. 2017. A systematic review on search-based refactoring. Journal of Information and Software Technology 83 (March 2017), 14–34.
- Martens et al. (2010) Anne Martens, Heiko Koziolek, Steffen Becker, and Ralf H. Reussner. 2010. Automatically improve software architecture models for performance, reliability, and cost using evolutionary algorithms. In Proceedings of the first joint WOSP/SIPEW International Conference on Performance Engineering, San Jose, California, USA, January 28-30, 2010, Alan Adamson, Andre B. Bondi, Carlos Juiz, and Mark S. Squillante (Eds.). ACM, San Jose, California, USA, 105–116. https://doi.org/10.1145/1712605.1712624
- Marti et al. (2009) Luis Marti, Jesus Garcia, Antonio Berlanga, and Jose M. Molina. 2009. An approach to stopping criteria for multi-objective optimization evolutionary algorithms: The MGBM criterion. In 2009 IEEE Congress on Evolutionary Computation. IEEE, Trondheim, Norway, 1263–1270. https://doi.org/10.1109/CEC.2009.4983090
- Nardi et al. (2019) Luigi Nardi, David Koeplinger, and Kunle Olukotun. 2019. Practical Design Space Exploration. In 27th IEEE International Symposium on Modeling, Analysis, and Simulation of Computer and Telecommunication Systems, MASCOTS 2019, Rennes, France, October 21-25, 2019. IEEE Computer Society, Rennes, France, 347–358. https://doi.org/10.1109/MASCOTS.2019.00045
- Ouni et al. (2017a) Ali Ouni, Marouane Kessentini, Mel Ó Cinnéide, Houari A. Sahraoui, Kalyanmoy Deb, and Katsuro Inoue. 2017a. MORE: A multi-objective refactoring recommendation approach to introducing design patterns and fixing code smells. J. Softw. Evol. Process. 29, 5 (2017), e1843. https://doi.org/10.1002/smr.1843
- Ouni et al. (2017b) Ali Ouni, Marouane Kessentini, Katsuro Inoue, and Mel Ó Cinnéide. 2017b. Search-Based Web Service Antipatterns Detection. IEEE Trans. Serv. Comput. 10, 4 (2017), 603–617. https://doi.org/10.1109/TSC.2015.2502595
- Procter and Wrage (2019) Sam Procter and Lutz Wrage. 2019. Guided Architecture Trade Space Exploration: Fusing Model Based Engineering & Design by Shopping. In 22nd ACM/IEEE International Conference on Model Driven Engineering Languages and Systems, MODELS 2019, Munich, Germany, September 15-20, 2019, Marouane Kessentini, Tao Yue, Alexander Pretschner, Sebastian Voss, and Loli Burgueño (Eds.). IEEE, Munich, Germany, 117–127. https://doi.org/10.1109/MODELS.2019.000-9
- Rago et al. (2017) Alejandro Rago, Santiago A. Vidal, J. Andres Diaz-Pace, Sebastian Frank, and André van Hoorn. 2017. Distributed quality-attribute optimization of software architectures. In Proceedings of the 11th Brazilian Symposium on Software Components, Architectures and Reuse, SBCARS 2017, Fortaleza, CE, Brazil, September 18 - 19, 2017. ACM, Fortaleza, CE, Brazil, 7:1–7:10. https://doi.org/10.1145/3132498.3132509
- Ramirez et al. (2019) Aurora Ramirez, Jose Raul Romero, and Christopher L. Simons. 2019. A Systematic Review of Interaction in Search-Based Software Engineering. IEEE Trans. Software Eng. 45, 8 (Aug 2019), 760–781. https://doi.org/10.1109/TSE.2018.2803055
- Ramirez et al. (2018) Aurora Ramirez, José Raúl Romero, and Sebastian Ventura. 2018. Interactive multi-objective evolutionary optimization of software architectures. Information Sciences 463 (2018), 92–109.
- Ramírez et al. (2019) Aurora Ramírez, José Raúl Romero, and Sebastián Ventura. 2019. A survey of many-objective optimisation in search-based software engineering. Journal of Systems and Software 149 (2019), 382–395.
- Ray and Mohapatra (2014) Mitrabinda Ray and Durga Prasad Mohapatra. 2014. Multi-objective test prioritization via a genetic algorithm. Innov. Syst. Softw. Eng. 10, 4 (2014), 261–270.
- Rebai et al. (2020) Soumaya Rebai, Vahid Alizadeh, Marouane Kessentini, Houcem Fehri, and Rick Kazman. 2020. Enabling decision and objective space exploration for interactive multi-objective refactoring. IEEE Transactions on Software Engineering 48, 5 (2020), 1560–1578.
- Reussner et al. (2016) Ralf H. Reussner, Steffen Becker, Jens Happe, Robert Heinrich, Anne Koziolek, Heiko Koziolek, Max Kramer, and Klaus Krogmann. 2016. Modeling and Simulating Software Architectures: The Palladio Approach. The MIT Press.
- Schulz et al. (2018) Adriana Schulz, Harrison Wang, Eitan Grinspun, Justin Solomon, and Wojciech Matusik. 2018. Interactive Exploration of Design Trade-Offs. ACM Trans. Graph. 37, 4, Article 131 (jul 2018), 14 pages. https://doi.org/10.1145/3197517.3201385
- Shahriari et al. (2015) Bobak Shahriari, Kevin Swersky, Ziyu Wang, Ryan P Adams, and Nando De Freitas. 2015. Taking the human out of the loop: A review of Bayesian optimization. Proc. IEEE 104, 1 (2015), 148–175.
- Smith and Williams (2001) Connie U. Smith and Lloyd G. Williams. 2001. Software Performance AntiPatterns; Common Performance Problems and their Solutions. In 27th International Computer Measurement Group Conference, Anaheim, CA, USA, December 2-7, 2001. Computer Measurement Group, 797–806. http://www.cmg.org/?s2member_file_download=/proceedings/2001/1341.pdf
- Smith and Williams (2003a) Connie U Smith and Lloyd G Williams. 2003a. More New Software Performance Antipatterns: Even More Ways to Shoot Yourself in the Foot. In 29th International Computer Measurement Group Conference. 717–725.
- Smith and Williams (2003b) Connie U. Smith and Lloyd G. Williams. 2003b. Software Performance Engineering. In UML for Real - Design of Embedded Real-Time Systems, Luciano Lavagno, Grant Martin, and Bran Selic (Eds.). Kluwer, 343–365. https://doi.org/10.1007/0-306-48738-1_16
- Snoek et al. (2012) Jasper Snoek, Hugo Larochelle, and Ryan P. Adams. 2012. Practical Bayesian Optimization of Machine Learning Algorithms. In Advances in Neural Information Processing Systems 25: 26th Annual Conference on Neural Information Processing Systems 2012. Proceedings of a meeting held December 3-6, 2012, Lake Tahoe, Nevada, United States, Peter L. Bartlett, Fernando C. N. Pereira, Christopher J. C. Burges, Léon Bottou, and Kilian Q. Weinberger (Eds.). Lake Tahoe, Nevada, USA, 2960–2968. https://proceedings.neurips.cc/paper/2012/hash/05311655a15b75fab86956663e1819cd-Abstract.html
- Vargha and Delaney (2000) András Vargha and Harold D. Delaney. 2000. A Critique and Improvement of the CL Common Language Effect Size Statistics of McGraw and Wong. Journal of Educational and Behavioral Statistics 25, 2 (Jun 2000), 101–132. https://doi.org/10.3102/10769986025002101
- Vathsavayi et al. (2013) Sriharsha Vathsavayi, Hadaytullah Kundi, and Kai Koskimies. 2013. Interleaving human and search-based software architecture design. Proceedings of the Estonian Academy of Sciences 62 (01 2013), 16. https://doi.org/10.3176/proc.2013.1.03
- Wagner et al. (2009) Tobias Wagner, Heike Trautmann, and Boris Naujoks. 2009. OCD: Online Convergence Detection for Evolutionary Multi-Objective Algorithms Based on Statistical Testing. In Evolutionary Multi-Criterion Optimization, 5th International Conference (Lecture Notes in Computer Science, Vol. 5467), Matthias Ehrgott, Carlos M. Fonseca, Xavier Gandibleux, Jin-Kao Hao, and Marc Sevaux (Eds.). Springer Berlin Heidelberg, Berlin, Heidelberg, 198–215. https://doi.org/10.1007/978-3-642-01020-0_19
- Wohlin et al. (2012) Claes Wohlin, Per Runeson, Martin Höst, Magnus C. Ohlsson, and Björn Regnell. 2012. Experimentation in Software Engineering. Springer. https://doi.org/10.1007/978-3-642-29044-2
- Wu et al. (2022) Jiahui Wu, Paolo Arcaini, Tao Yue, Shaukat Ali, and Huihui Zhang. 2022. On the preferences of quality indicators for multi-objective search algorithms in search-based software engineering. Empirical Software Engineering 27, 6 (Nov 2022), 144. https://doi.org/10.1007/s10664-022-10127-4
- Xu and jie Tian (2015) Dongkuan Xu and Ying jie Tian. 2015. A Comprehensive Survey of Clustering Algorithms. Annals of Data Science 2 (2015), 165 – 193.
- Zhou et al. (2021) Xiang Zhou, Xin Peng, Tao Xie, Jun Sun, Chao Ji, Wenhai Li, and Dan Ding. 2021. Fault Analysis and Debugging of Microservice Systems: Industrial Survey, Benchmark System, and Empirical Study. IEEE Trans. Software Eng. 47, 2 (2021), 243–260. https://doi.org/10.1109/TSE.2018.2887384
- Zitzler and Thiele (1998) Eckart Zitzler and Lothar Thiele. 1998. Multiobjective Optimization Using Evolutionary Algorithms - A Comparative Case Study. In Parallel Problem Solving from Nature - PPSN V, 5th International Conference, Amsterdam, The Netherlands, September 27-30, 1998, Proceedings (Lecture Notes in Computer Science, Vol. 1498), A. E. Eiben, Thomas Bäck, Marc Schoenauer, and Hans-Paul Schwefel (Eds.). Springer, Amsterdam, The Netherlands, 292–304. https://doi.org/10.1007/BFb0056872
- Zitzler and Thiele (1999) Eckart Zitzler and Lothar Thiele. 1999. Multiobjective evolutionary algorithms: a comparative case study and the strength Pareto approach. IEEE transactions on Evolutionary Computation 3, 4 (1999), 257–271.
- Zitzler et al. (2003) E. Zitzler, L. Thiele, M. Laumanns, C.M. Fonseca, and V.G. da Fonseca. 2003. Performance assessment of multiobjective optimizers: an analysis and review. IEEE Transactions on Evolutionary Computation 7, 2 (Apr 2003), 117–132. https://doi.org/10.1109/TEVC.2003.810758