Structural and microscopic relaxations in a colloidal glass
Flavio Augusto de Melo Marques∗a, Roberta Angelini b,c, Emanuela Zaccarellic,d, Bela Faragoe, Beatrice Rutaf, Giancarlo Ruoccoa,c, Barbara Ruzickab,c
The aging dynamics of a colloidal glass has been studied by multiangle Dynamic Light Scattering, Neutron Spin Echo, X-ray Photon Correlation Spectroscopy and Molecular Dynamics simulations. The two relaxation processes, microscopic (fast) and structural (slow), have been investigated in an unprecedentedly wide range of time and length scales covering both ergodic and nonergodic regimes. The microscopic relaxation time remains diffusive at all length scales across the glass transition scaling with wavevector as . The length-scale dependence of structural relaxation time changes from diffusive, characterized by a -dependence in the early stages of aging, to -dependence in the full aging regime which marks a discontinuous hopping dynamics. Both regimes are associated with a stretched behaviour of the correlation functions. We expect these findings to provide a general description of both relaxations across the glass transition.
1 Introduction
The dynamical behaviour of glass-forming systems has long been the subject of intense research 1. One important feature of disordered systems is that the dynamics of density fluctuations is characterized by a two-step decay, which implies the presence of two main relaxation processes 2: a microscopic or fast relaxation, associated to the interactions between a particle and the cage of its nearest neighbors followed by a structural or slow relaxation process, related to the structural rearrangements of the particles. These two distinct processes have been observed in simple monatomic liquids 3, hydrogen bonded liquids 4, 5, structural glasses 6, 7, 8, colloids 9, 10, 11 and DNA nanostars 12. Furthermore Mode Coupling Theory (MCT) 13 has predicted the evolution of the two relaxations when a system goes from the liquid to the arrested state: this may happen e.g. by changing temperature, packing fraction or waiting time (aging). However, even if the supercooled liquid phase above in glass forming materials has been widely investigated with both DLS 7, 14 and neutron scattering techniques 15, 16, 17, 18, 19, it is still not clear how the two relaxation processes behave at the liquid-glass transition. While in a liquid the dynamics is known to be diffusive, a change in particle dynamics should occur, as found in numerical simulations 20, 21, from diffusive to activated in the glass. The signature of this change at different length scales can be revealed by investigating the wavevector dependence of the relaxation times. Several numerical studies on different systems such as water 22, ortho-terphenyl 23 and hard spheres 24 reported a subquadratic dependence of the structural relaxation time approaching the glass state. A recent theoretical work based on activated MCT has rationalised these findings providing a microscopic explanation for the change of dynamics across the glass transition 25. So far, there has been no clear experimental proof of this scenario due to technical difficulties. Moreover, a full description encompassing both relaxation processes and their behaviour at different length scales is missing. This is the aim of the present work where the aging investigation of a colloidal system makes possible a detailed study across the glass transition, in particular increasing waiting time in this system plays the same role as decreasing temperature in glass forming systems 26.
In this paper we study the aging dynamics of a colloidal glass, monitoring the waiting time and wavenumber dependence of both fast and slow relaxation times through a combination of multiangle Dynamic Light Scattering (DLS), Neutron Spin Echo (NSE), X-Ray Photon Correlation Spectroscopy (XPCS) and Molecular Dynamics (MD) simulations. In this way we access an unprecedentedly wide range of time and length scales and we find a different behaviour for the two relaxations across the glass transition. While the microscopic one remains unperturbed, indicating an unchanged, diffusive single particle dynamics at short times, the structural relaxation shows a clear change. Indeed, going from the liquid to the arrested state undergoes a transition from a to a behaviour. Pioneering works by Bonn and coworkers 27, 11 in aqueous Laponite dispersions reported a dependence for both microscopic and structural relaxation times in the ergodic DLS regime. Later on works on different systems e.g. colloids 28, 29, clays 30, 31, 32, 33, metallic glasses 34, polymers 35, 36, 37, supercooled liquids 38 reported a dependence of the structural relaxation time associated to an anomalous compressed exponential relaxation of the correlation functions attributed to a hyperdiffusive dynamics 39. Differently, in the present work the relaxation curves at long times are always described by a stretched exponential, which allow us to interpret the crossover from a to a across the glass transition as a signature of a change from diffusive dynamics to discontinuous hopping of caged particles, as predicted in 25.
2 Materials and Methods
We used a widely studied colloidal clay 40, 41, 42, 43, 44, 45, 46, Laponite RD dispersions, prepared using the same protocol described in Ref. 46. All measurements have been performed using (EURISO-TOP) of purity 99.9% as a solvent. As recently shown the isotopic substitution, required to gain contrast in neutron scattering measurements, does not qualitatively affect the aging behaviour of Laponite 47. The waiting time origin () is the time at which the dispersion is filtered (and sealed) directly in glass tubes with diameter of 10 mm for DLS and of 2 mm for XPCS and in quartz cells with dimensions of 30 mm 40 mm 4 mm for NSE measurements. All experiments were performed at the same molar concentration of a = 3.0 % sample in salt free water. At this weight concentration the system forms a Wigner glass 27, 48 due to repulsive electrostatic interactions. This is a glass occurring in a dilute system which shares the main features of denser glasses, including a two-step decay 49, 50, 51.
DLS measurements were performed with a multi-angle setup in the time range between s and 1 s. A solid state laser with wavelength of 642 nm and power of 100 mW and single mode collecting fibers at five different scattering angles are used. Time autocorrelation functions are therefore simultaneously acquired at wavenumbers , , , and Å-1 by calculating the intensity autocorrelation function as where denotes the temporal average over . DLS are used only when the system is ergodic in the early aging, also referred as cage forming, regime characterized by a structural relaxation time with a waiting time exponential dependence 42.
XPCS measurements were performed at the ID10 beamline at the European Synchrotron Radiation Facility (ESRF, Grenoble, France) in a -range between and Å-1 including the peak of the static structure factor occurring at Å-1 as in solvent 48. Using an incident partially coherent X-ray beam with energy fixed at 8 keV a series of scattering images were recorded by a charged coupled device (CCD) and the ensemble averaged intensity autocorrelation function was calculated by using a standard multi tau algorithm after having ensemble averaged over the detector pixels mapping onto a single Q value 52. XPCS can thus be used when the system is non ergodic in the full aging regime characterized by a waiting time power law dependence of the structural relaxation time with 1 42.
NSE measurements were performed at the spectrometer IN15 of the Institute Laue-Langevin (ILL, Grenoble, France) at larger wavevectors ( Å-1) and at shorter relaxation times (up to s) with respect to DLS and XPCS. We used wavelength of 10, 16 and 22.8 Å yielding time ranges (0.35 - 50) ns, (1.4 - 206) ns and (4.1 - 598) ns respectively. While DLS and XPCS measure the normalized intensity correlation function (Siegert relation), respectively through temporal averages (ergodic regime) and ensemble averages (non ergodic regime), NSE directly accesses the intermediate scattering function .
We complement the experimental measurements with MD simulations for a simple model of low-density glass-former, i.e. a non-crystallising binary mixture of Yukawa particles of equal screening length and different repulsion strength 50***Lengths and times are measured in units of and respectively, where is the mass of the particles and is the unit of energy. Temperature is measured in units of (i.e. =1 where is the Boltzmann constant).. The system was found 50 to undergo a Wigner glass transition upon decreasing temperature . To mimic the experimental situation, we performed a quench inside the glassy region at fixed number density . The system was equilibrated at high and then instantaneously quenched to , below the glass transition occurring at . The waiting time origin was the time of the quench. Self intermediate scattering functions have been calculated for different wave vectors as a function of waiting time, averaging over 20 independent quenches to improve statistics.
3 Results
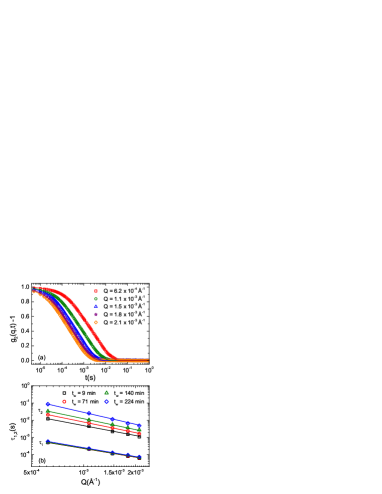
Figure 1(a) shows the normalized intensity correlation functions measured by DLS at initial waiting time ( min) for different -values (symbols) and the corresponding fits (full lines) obtained through a typical double exponential decay:
| (1) |
where the parameters and are the amplitudes of the two relaxation modes, is the coherence factor, is the fast relaxation time connected to the microscopic motion of particles, is the slow relaxation time related to the structural rearrangement, (here =1 11, 53) and measure the distribution widths of the two relaxations.
The -dependence of the fast and slow relaxation times is reported in Fig. 1(b) at different waiting times. While shows a moderate waiting time dependence, increases significantly with . Both times are well described by power law fits with (solid lines in Fig. 1(b)). Hence both microscopic and structural relaxation times display an almost quadratic wave vector dependence in the DLS (early aging) regime, which is the signature of diffusive dynamics for both relaxations at these early waiting times. These findings are in agreement with the works on Laponite water suspensions by the group of Bonn et al. 27, 11 and of Munch et al. 32, 33.
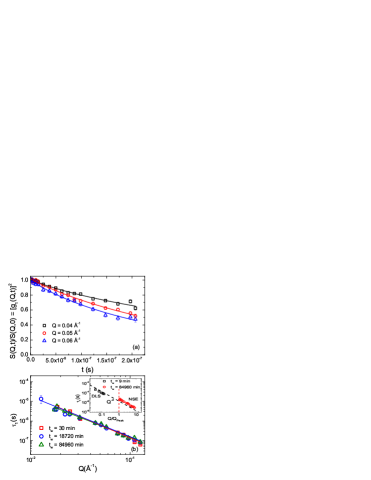
Fig. 2(a) shows the dynamic structure factors measured by NSE at different wavevectors (symbols) together with single stretched exponential fits (full lines). The corresponding fast relaxation times are shown in Fig. 2(b). We find that scales as during the whole experiment. As reported in the inset of Fig. 2(b) the estimate of obtained from the NSE fits is in good agreement with that obtained by DLS, taking into account the large difference in between these techniques. Since the studied sample experiences a sol to Wigner glass transition at 600 min, NSE results ensure that the microscopic relaxation time remarkably scales as both in the early aging and full aging regimes indicating that the short-time dynamics remains diffusive for all the investigated dynamical range even in the arrested state.
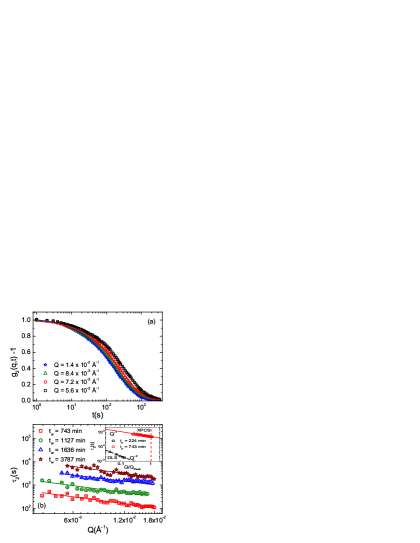
In Fig. 3(a) normalized intensity correlation functions probed by XPCS in the full aging regime are shown at different -values (symbols). At these long waiting times the fast relaxation time is out of the XPCS detection window. Hence only the slow relaxation time can be measured and only the second term of Eq. 1 is used to fit the data (full lines in Fig. 3(a)). We notice that in our case DLS measurements allow to probe relaxation times up to 10-1 s (higher limit in Fig. 1 (b)), reached for the sample in the ergodic region at waiting time =224 min, while XPCS measurements permit to access relaxation times above 102 s (lower limit in Fig 3b) achieved for the sample in the non ergodic region at waiting times =743 min. Figure 3(b) shows the -dependence of at different waiting times (symbols) and the associated power law fits (full lines) as . In this regime we find 1 ruling out diffusive dynamics. Therefore a crossover from the DLS early aging regime characterized by , to the XPCS full aging regime characterized by , with 1 is observed. In both cases the intensity correlation functions are described by stretched exponentials at variance with the 1 behaviour found in previous works 30, 31, 32, 33 and in rejuvenated samples 54, as fully discussed in Ref. 54.
The combination of three complementary experimental techniques has allowed us to show that the fast relaxation mode remains diffusive both in ergodic and non-ergodic conditions at all waiting times. On the other hand, we observe that the structural relaxation time is characterized by two distinct behaviours in the two different regimes. It remains to elucidate what happens in between the DLS and XPCS regimes, i.e. whether the change is discontinuous or not. Bhattacharyya et al. 25 have predicted a gradual change of the dynamics. To address this point we turn to MD simulations.
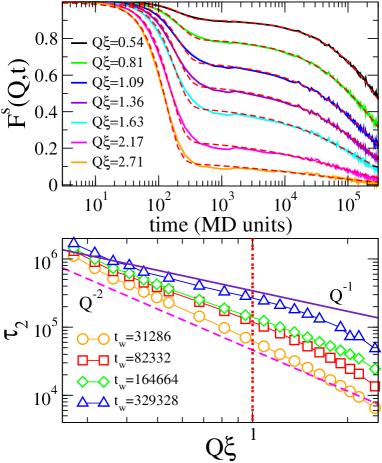
In Fig. 4(a) we report the MD self intermediate scattering functions (full lines) at fixed waiting time after a quench in the glassy state for several wavevectors. The microscopic dynamics is Newtonian, thereby the data are fitted by the double exponential decay within the square brackets of Eq. 1 fixing =2 and the corresponding is not relevant to describe the experimental (Brownian) fast relaxation. We discuss only wavevectors small enough that the second exponential in Eq. 1 is stretched (), excluding large values where the dynamics becomes again ballistic due to the underlying microscopic dynamics 55. In the early aging regime, the correlators do not display the typical two-step decay, similarly to what observed in out-of-equilibrium simulations of other glass formers 56. We thus focus on the regime occurring at larger waiting times, i.e. , where full aging starts and the double exponential describes the correlators, as shown by the fits in Fig. 4(a) (dashed lines). The corresponding is reported as a function of in Fig. 4(b) for different values of the waiting time. We find that initially displays a dependence at low and intermediate wave-vectors, in agreement with the DLS data of Fig. 1. Upon increasing , while at low (approaching the hydrodynamic regime) still tends to recover a diffusive behaviour (), at intermediate encompassing the main structure factor peak (see vertical line in Fig. 4b) a clear power-law dependence with the exponent lowering and approaching unity at large , is observed. At even larger the system becomes non-ergodic on the timescale of our simulations. Thus, in the full aging regime we observe a strongly non-diffusive dependence of , approaching a behaviour, in full agreement with the XPCS data in the same -window. Interestingly, decreases continuously with increasing in agreement with theoretical predictions 25.
4 Conclusions
In this work we have investigated the -dependence of both microscopic and structural relaxation times during the early aging and full aging regimes of a colloidal glass through multiangle DLS, NSE and XPCS techniques, covering a wide range of wavevectors and times. The experimental results have been complemented by MD simulations. We found that the microscopic relaxation time, , characteristic of the short-time diffusion of a particle in the suspending medium, scales as during both early aging and full aging regimes, depicting a diffusive nature of particles motion. On the contrary the slow relaxation time, , associated to the structural rearrangement of the system, shows a transition from a diffusive behaviour in the liquid (or early aging) regime to a activated dynamics in the glass (or full aging) regime associated with a stretched behaviour of the correlation functions, in full agreement with recent theoretical predictions 25. The reported experimental evidence is not specific to the studied system, but appears to have an intrinsic generality, occurring also in numerical studies on different glass-formers 22, 23, 24. Therefore our study of both relaxations in an aging colloidal system may provide a general description of the complex dynamics at fast and slow timescales of any glass-former.
5 Acknowledgments
We acknowledge ILL and ESRF for beamtime and Orsolya Czakkel for providing assistance during the XPCS measurements. RA and EZ acknowledge support from MIUR-PRIN. EZ acknowledges support from MIUR-FIRB ANISOFT (RBFR125H0M).
References
- Debenedetti and Stillinger 2001 P. G. Debenedetti and F. H. Stillinger, Nature 410, 259 (2001).
- Balucani and Zoppi 1994 U. Balucani and M. Zoppi, Dynamics of the Liquid State (Clarendon Press - Oxford, 1994).
- Scopigno et al. 2000 T. Scopigno, U. Balucani, G. Ruocco, and F. Sette, Phys. Rev. Lett. 85, 4076 (2000).
- Angelini et al. 2002 R. Angelini, P. Giura, G. Monaco, G. Ruocco, F. Sette, and R. Verbeni, Phys. Rev. Lett. 88, 255503 (2002).
- Monaco et al. 1999 G. Monaco, A. Cunsolo, G. Ruocco, and F. Sette, Phys. Rev. E 60, 5505 (1999).
- Mezei, Knaak and Farago 1987a F. Mezei, W. Knaak, and B. Farago, Phys. Rev. Lett. 58, 571 (1987a).
- Sidebottom et al. 1993 D. L. Sidebottom, R. Bergman, L. Borjesson, and L. M. Torell, Phys. Rev. Lett. 71, 2260 (1993).
- Zuriaga et al. 2009 M. Zuriaga, L. C. Pardo, P. Lunkenheimer, J. L. Tamarit, N. Veglio, M. Barrio, F. J. Bermejo, and A. Loidl, Phys. Rev. Lett. 103, 075701 (2009).
- Ren and Sorensen 1993 S. Z. Ren and C. M. Sorensen, Phys. Rev. Lett. 70, 1727 (1993).
- van Megen and Underwood 1993 W. van Megen and S. M. Underwood, Physical Review Letters 70, 2766 (1993).
- Abou et al. 2001 B. Abou, D. Bonn, and J. Meunier, Phys. Rev. E 64, 021510 (2001).
- Biffi et al. 2013 S. Biffi, R. Cerbino, F. Bomboi, E. Paraboschia, R. Asselta, F. Sciortino, and T. Bellini, PNAS 24, 15633 (2013).
- Götze 2008 W. Götze, Complex Dynamics of Glass-Forming Liquids: A Mode-Coupling Theory (Oxford Science Publications - Oxford, 2008).
- Sidebottom et al. 2007 D. L. Sidebottom, B. V. Rodenburg, and J. R. Changstrom, Phys. Rev. B 75, 132201 (2007).
- Mezei and Knaak 1987b F. Mezei and W. Knaak, Phys. Scripta T19, 363 (1987b).
- Tolle 2001 A. Tolle, Rep. Prog. Phys. 64, 1473 (2001).
- Arbe et al. 2002 A. Arbe, J. Colmenero, F. Alvarez, M. Monkenbusch, D. Richter, B. Farago, and B. Frick, Phys. Rev. Lett. 89, 245701 (2002).
- Farago et al. 2002 B. Farago, A. Arbe, J. Colmenero, R. Faust, U. Buchenau, and D. Richter, Phys. Rev. E 65, 051803 (2002).
- Colmenero et al. 2013 J. Colmenero, F. Alvarez, Y. Khairy, and A. Arbe, J. Chem. Phys. 139, 044906 (2013).
- L.Angelani et al. 2000 L.Angelani, R. DiLeonardo, G. Ruocco, A. Scala, and F. Sciortino, Phys. Rev. Lett. 85, 5356 (2000).
- Broderix et al. 2000 K. Broderix, K. K. Bhattacharya, A. Cavagna, A. Zippelius, and I. Giardina, Phys. Rev. Lett. 85, 5360 (2000).
- Sciortino et al. 1996 F. Sciortino, P. Gallo, P. Tartaglia, and S. H. Chen, Phys. Rev. E 54, 6331 (1996).
- Rinaldi et al. 2001 A. Rinaldi, F. Sciortino, and P. Tartaglia, Phys. Rev. E 63, 061210 (2001).
- Saltzman and Schweizer 2006 E. J. Saltzman and K. S. Schweizer, Phys. Rev. E 74, 061501 (2006).
- Bhattacharyya et al. 2010 S. M. Bhattacharyya, B. Bagchi, and P. G. Wolynes, J. Chem. Phys. 132, 104503 (2010).
- Sciortino et al. 2009 F. Sciortino, C. D. Michele, S. Corezzi, J. Russo, E. Zaccarelli, and P.Tartaglia, Soft Matter 5, 2571 (2009).
- Bonn et al. 1999 D. Bonn, H. Tanaka, G. Wegdam, H. Kellay, and J. Meunier, Europhys. Lett. 45, 52 (1999).
- Cipelletti et al. 2000 L. Cipelletti, S. Manley, R. C. Ball, and D. A. Weitz, Phys. Rev. Lett. 84, 2275 (2000).
- Duri et al. 2009 A. Duri, T. Autenrieth, L.-M. Stadler, O. Leupold, Y. Chushkin, G. Grubel, and C. Gutt, Phys. Rev. Lett. 102, 145701 (2009).
- Bellour et al. 2003 M. Bellour, A. Knaebel, J. L. Harden, F. Lequeux, and J. P. Munch, Phys. Rev. E 67, 031405 (2003).
- Bandyopadhyay et al. 2004 R. Bandyopadhyay, D. Liang, H. Yardimci, D. A. Sessoms, M. A. Borthwick, S. G. J. Mochrie, J. L. Harden, and R. L. Leheny, Phys. Rev. Lett. 93, 228302 (2004).
- Kaloun et al. 2005 S. Kaloun, R. Skouri, M. Skouri, J. P. Munch, and F. Schosseler, Phys. Rev. E 72, 011403 (2005).
- Schosseler et al. 2006 F. Schosseler, S. Kaloun, M. Skouri, and J. P. Munch, Phys. Rev. E 73, 021401 (2006).
- Ruta et al. 2012 B. Ruta, Y. Chushkin, G. Monaco, L. Cipelletti, E. Pineda, P. Bruna, V. M. Giordano, and M. Gonzalez-Silveira, Phys. Rev. Lett. 109, 165701 (2012).
- Falus et al. 2006 P. Falus, M. A. Borthwick, S. Narayanan, A. R. Sandy, and S. G. J. Mochrie, Phys. Rev. Lett. 97, 066102 (2006).
- Narayanan et al. 2007 S. Narayanan, D. R. Lee, A. Hagman, X. Li, and J. Wang, Phys. Rev. Lett. 98, 185506 (2007).
- Guo et al. 2009 H. Guo, G. Bourret, M. K. Corbierre, S. Rucareanu, R. B. Lennox, K. Laaziri, L. Piche, M. Sutton, J. L. Harden, and R. L. Leheny, Phys. Rev. Lett. 102, 075702 (2009).
- Caronna et al. 2008 C. Caronna, Y. Chushkin, A. Madsen, and A. Cupane, Phys. Rev. Lett. 100, 055702 (2008).
- Bouchaud and Pitard 2001 J.-P. Bouchaud and E. Pitard, Eur. Phys. J. E 6, 231 (2001).
- Mourchid et al. 1998 A. Mourchid, E. Lecolier, H. Van Damme, and P. Levitz, Langmuir 14, 4718 (1998).
- Mongondry et al. 2005 P. Mongondry, J. F. Tassin, and T. Nicolai, J. Colloid Interface Sci. 283, 397 (2005).
- Tanaka et al. 2005 H. Tanaka, S. Jabbari-Farouji, J. Meunier, and D. Bonn, Phys. Rev. E 71, 021402 (2005).
- Jabbari-Farouji et al. 2007 S. Jabbari-Farouji, G. H. Wegdam, and D. Bonn, Phys. Rev. Lett. 99, 065701 (2007).
- Cummins 2007 H. Z. Cummins, J. Non Cryst. Sol. 353, 3892 (2007).
- Shahin and Joshi 2010 A. Shahin and Y. M. Joshi, Langmuir 26, 4219 (2010).
- Ruzicka and Zaccarelli 2011 B. Ruzicka and E. Zaccarelli, Soft Matter 7, 1268 (2011).
- Tudisca et al. 2012 V. Tudisca, M. Ricci, R. Angelini, and B. Ruzicka, RSC Advances 2, 11111 (2012).
- Ruzicka et al. 2010 B. Ruzicka, L. Zulian, E. Zaccarelli, R. Angelini, M. Sztucki, A. Moussaïd, and G. Ruocco, Phys. Rev. Lett. 104, 085701 (2010).
- Beck et al. 1999 C. Beck, W. Härtl, and R. Hempelmann, J. Chem.Phys 111, 8209 (1999).
- Zaccarelli et al. 2008 E. Zaccarelli, S. Andreev, F. Sciortino, and D. R. Reichman, Phys. Rev. Lett. 100, 195701 (2008).
- Kang et al. 2013 H. Kang, T. R. Kirkpatrick, and D. Thirumalai, Phys. Rev. E 88, 042308 (2013).
- Madsen et al. 2010 A. Madsen, R. Leheny, H. Guo, M. Sprung, and O. Czakkel, New J. of Phys. 12, 055001 (2010).
- Ruzicka et al. 2004 B. Ruzicka, L. Zulian, and G. Ruocco, Phys. Rev. Lett. 93, 258301 (2004).
- Angelini et al. 2013 R. Angelini, L. Zulian, A. Fluerasu, A. Madsen, G. Ruocco, and B. Ruzicka, Soft Matter 9, 10955 (2013).
- Saw et al. 2009 S. Saw, N. L. Ellegaard, W. Kob, and S. Sastry, Physical Review Letters 103, 248305 (2009).
- El Masri et al. 2010 D. El Masri, L. Berthier, and L. Cipelletti, Phys. Rev. E 82, 031503 (2010).