Do Successful Researchers Reach the Self-Organized Critical Point?
Abstract
The index of success of the researchers is now mostly measured using the Hirsch index (). Our recent precise demonstration, that statistically , where and denote respectively the total number of publications and total citations for the researcher, suggests that average number of citations per paper (), and hence , are statistical numbers (Dunbar numbers) depending on the community or network to which the researcher belongs. We show here, extending our earlier observations, that the indications of success are not reflected by the total citations , rather by the inequalities among citations from publications to publications. Specifically, we show that for very successful authors, the yearly variations in the Gini index (, giving the average inequality of citations for the publications) and the Kolkata index (, giving the fraction of total citations received by the top fraction of publications; corresponds to Pareto’s 80/20 law) approach each other to , signaling a precursor for the arrival of (or departure from) the Self-Organized Critical (SOC) state of his/her publication statistics. Analyzing the citation statistics (from Google Scholar) of thirty successful scientists throughout their recorded publication history, we find that the and for very successful among them (mostly Nobel Laureates, highest rank Stanford Cite-Scorers, and a few others) reach and hover just above (and then) below that mark, while for others they remain below that mark. We also find that all the lower (than the SOC mark 0.82) values of and fit a linear relationship , with , as suggested by an approximate Landau-type expansion of the Lorenz function, and this also indicates for the (extrapolated) SOC precursor mark.
I Introduction
Inspiring researches in sociophysics (see e.g. 1Oliveira1999 ; 2Chakrabarti2006 ; 3Castelano2009 ; 4Helbing2010 ; 5Galam2012 ; 6Sen2014 ) have, in years, led to intense research activities in several statistical and statistical physical models and analysis of socio-dynamical problems. For example, the social opinion formation models of Galam (see e.g., 7Galam2008 ; 8Galam2020 ), of Biswas-Chatterjee-Sen (see e.g. 9Biswas2023 ; 10Filho2023 ), of Minority Games (see e.g. 11Challet2005 ), of Kolkata Paise Restaurant games (see e.g., 12Martin2019 ; 13Harlalka2023 ), etc. In view of the automatically encoded wide range of the citation data of the publications by the scientists and their easy availability in the internet, we have studied here the inequality statistics from Google Scholar data. The presence of ubiquitous inequalities allowed recently the studies of various scaling etc properties in their statistics (see e.g., 14Ghosh2022 ; 15Ghosh2023 ) of the Hirsch index 16Hirsch2005 , or the universal (or limiting) Self-Organized Critical (SOC) behavior (see e.g., 17Manna2022 ; 18Ghosh2021 ; 19Banerjee2023 ) and their citation inequality like the century-old Gini () 20Gini1921 and the recently introduced Kolkata () 21Ghosh2014 ; 22Banerjee2020 indices. It may be noted at this stage that while Gini () values measure the overall inequality in the distributions and the Kolkata index () gives the fraction of “mass” or of total citations coming from the fraction of avalanches or publications. These studies 17Manna2022 ; 18Ghosh2021 ; 19Banerjee2023 indicated that the inequalities in the avalanche size distributions, measured by and , just prior to the arrival of the SOC point in several standard physical models (like the sand-pile models of Bak–Tang–Wiesenfeld 23Bak1987 , Manna 24Manna1991 , and others), and in social contexts of citations from publications 18Ghosh2021 ; 19Banerjee2023 becomes equal (). It may also be noted that corresponds to Pareto’s 80/20 law (see e.g., 21Ghosh2014 ; 22Banerjee2020 ). This Pareto Principle asserts that 20% of the causes are responsible for 80% of the outcomes. In other words, the principle suggests that a small fraction of the factors contribute in causing a large fraction of major events, from economics to quality management and even in personal development. In business, it is often used to identify the most important areas for improvement. It may be mentioned here that our earlier studies of inequality indices and 17Manna2022 ; 18Ghosh2021 ; 19Banerjee2023 ; 20Gini1921 ; 21Ghosh2014 ; 22Banerjee2020 corresponded to the cumulative dynamics (as the sand-pile dynamics progresses and cluster distributions grow or the publications by the authors or from the institutions progresses over time and the citation size distributions grow since the start of the dynamics) as the system approach towards the respective SOC states. Our study here is for the same inequality indices, but for small time intervals along growth dynamical paths of individual researchers.
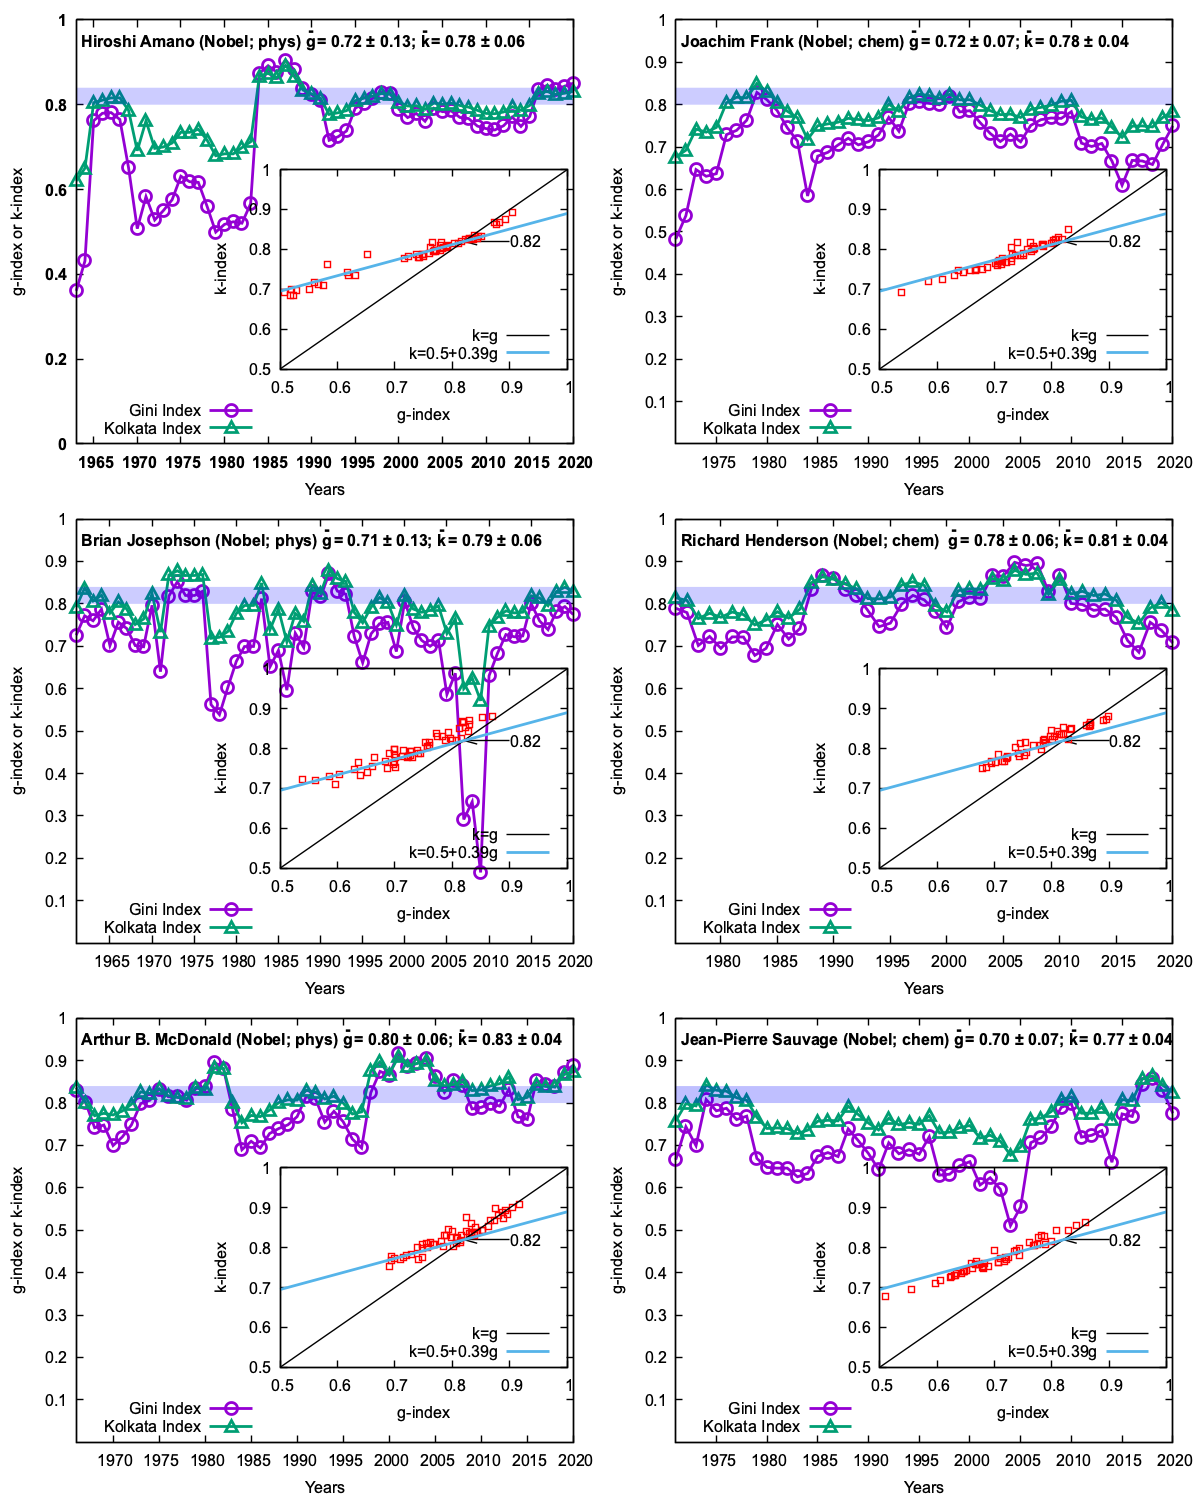
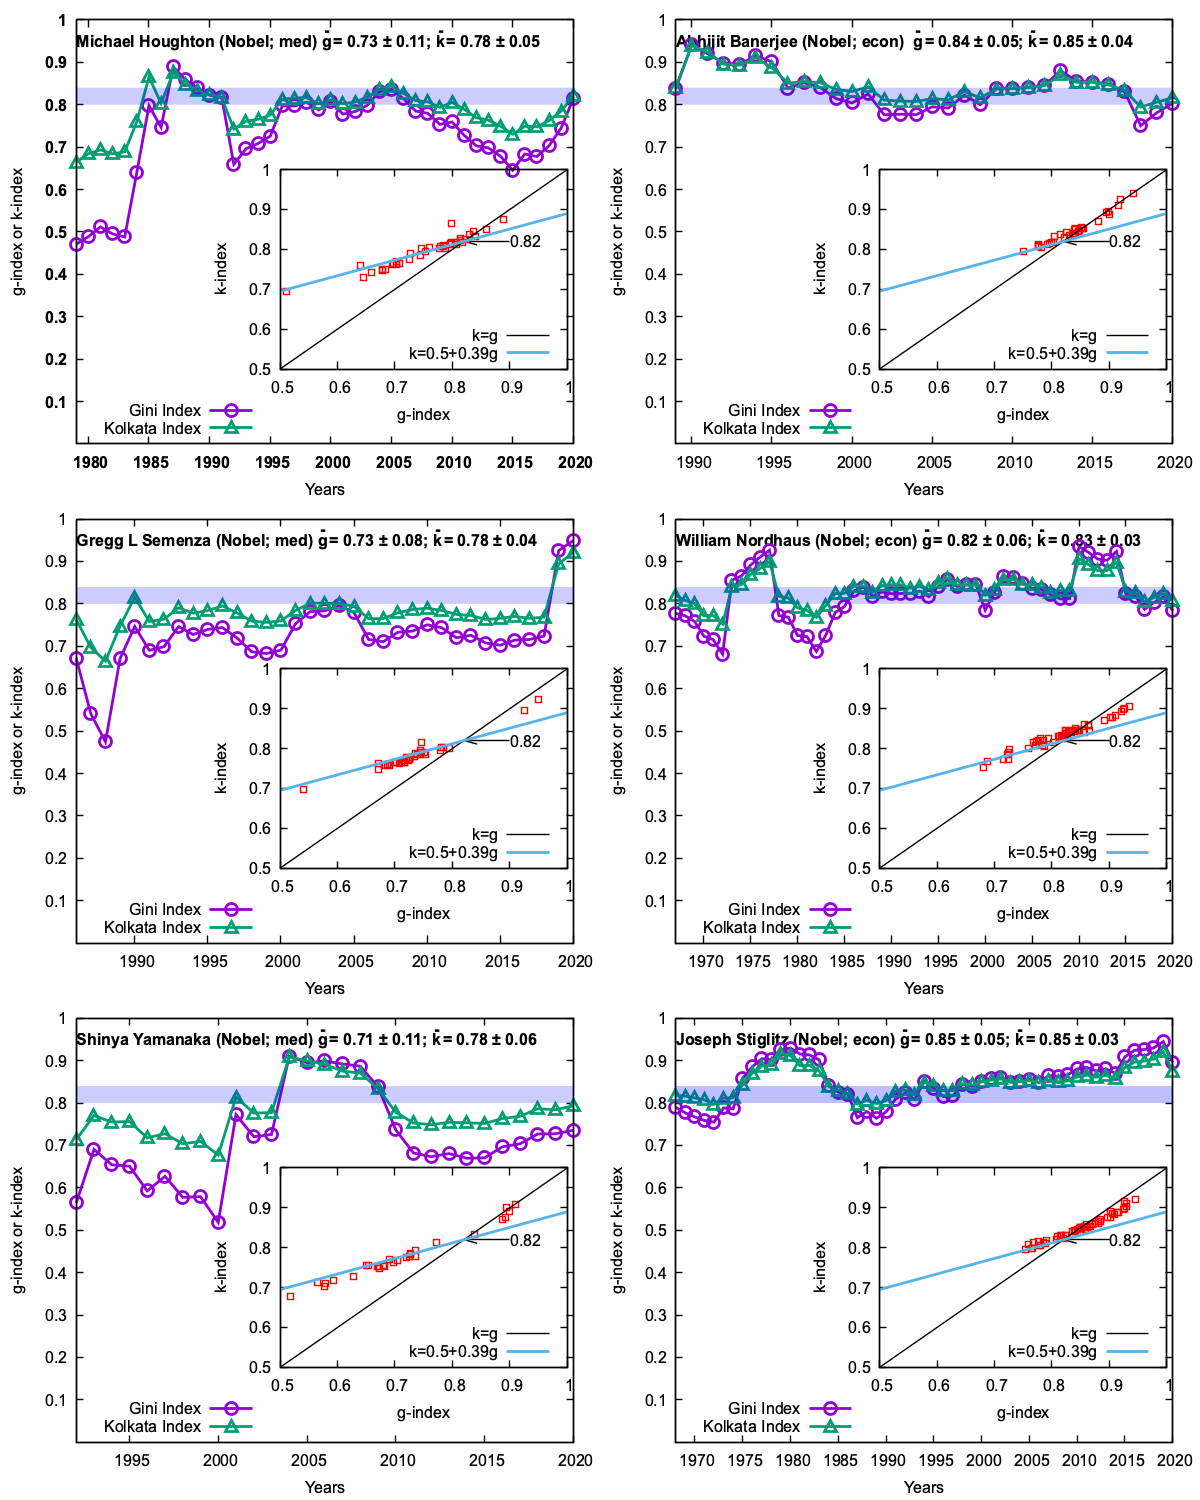
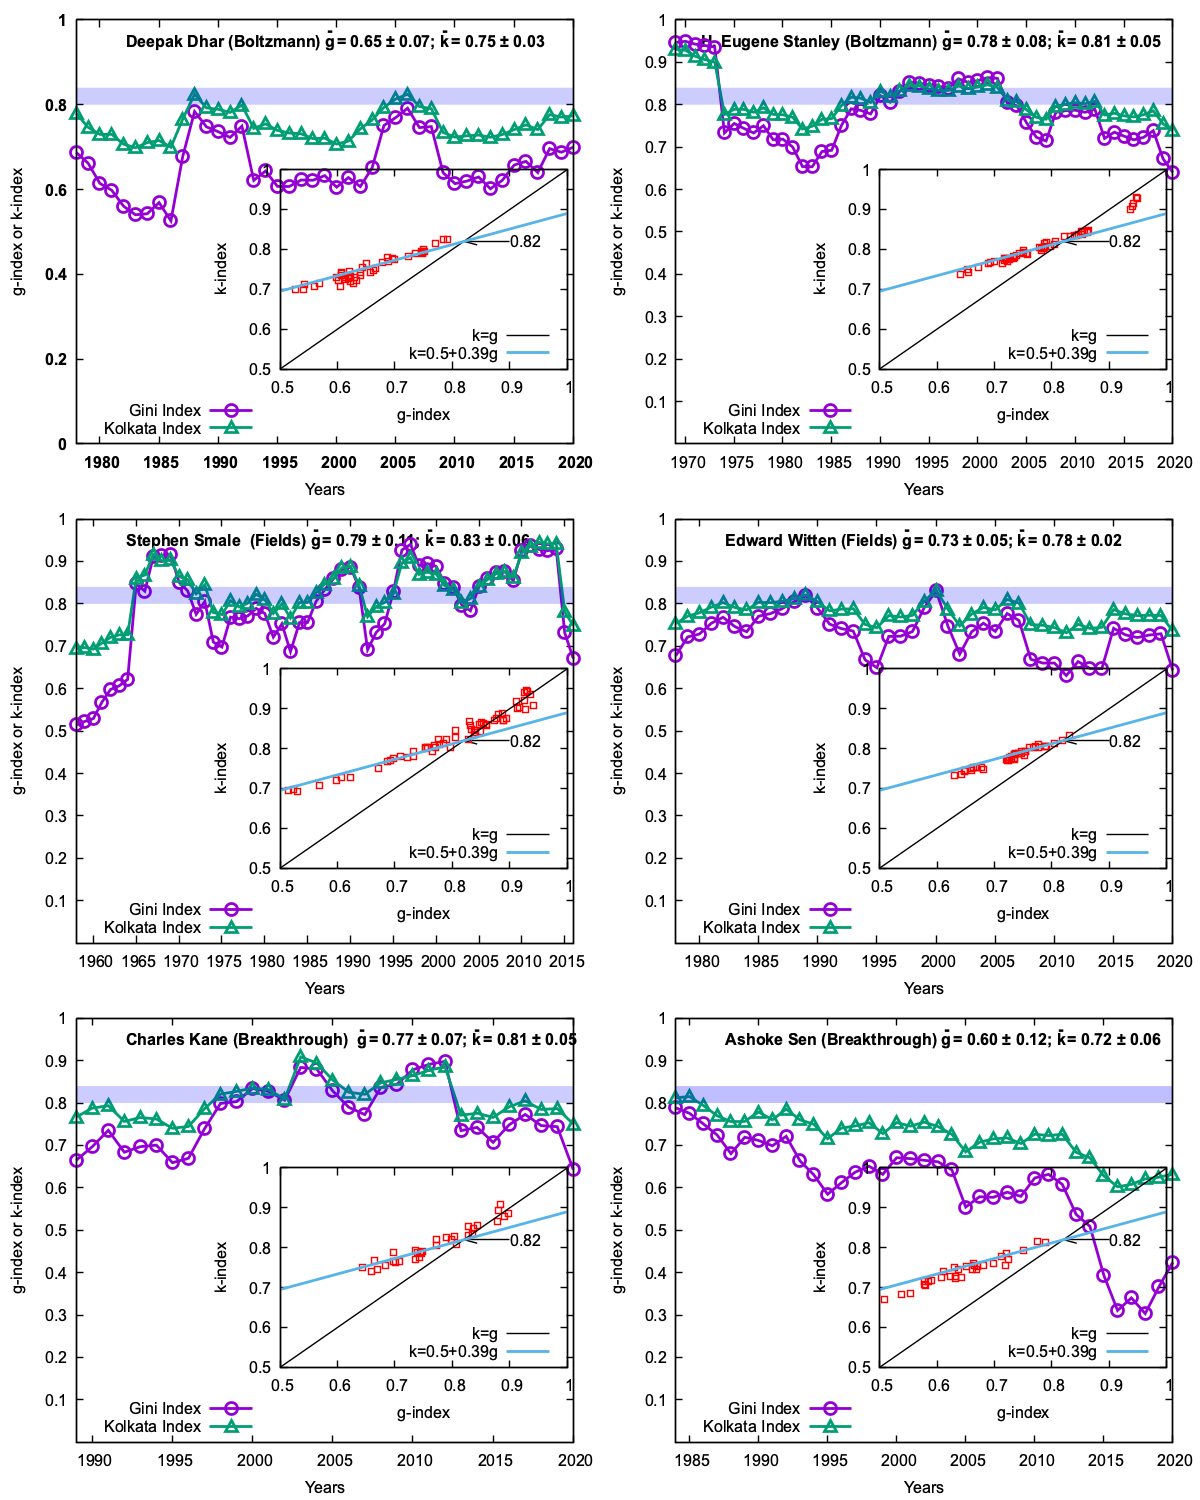
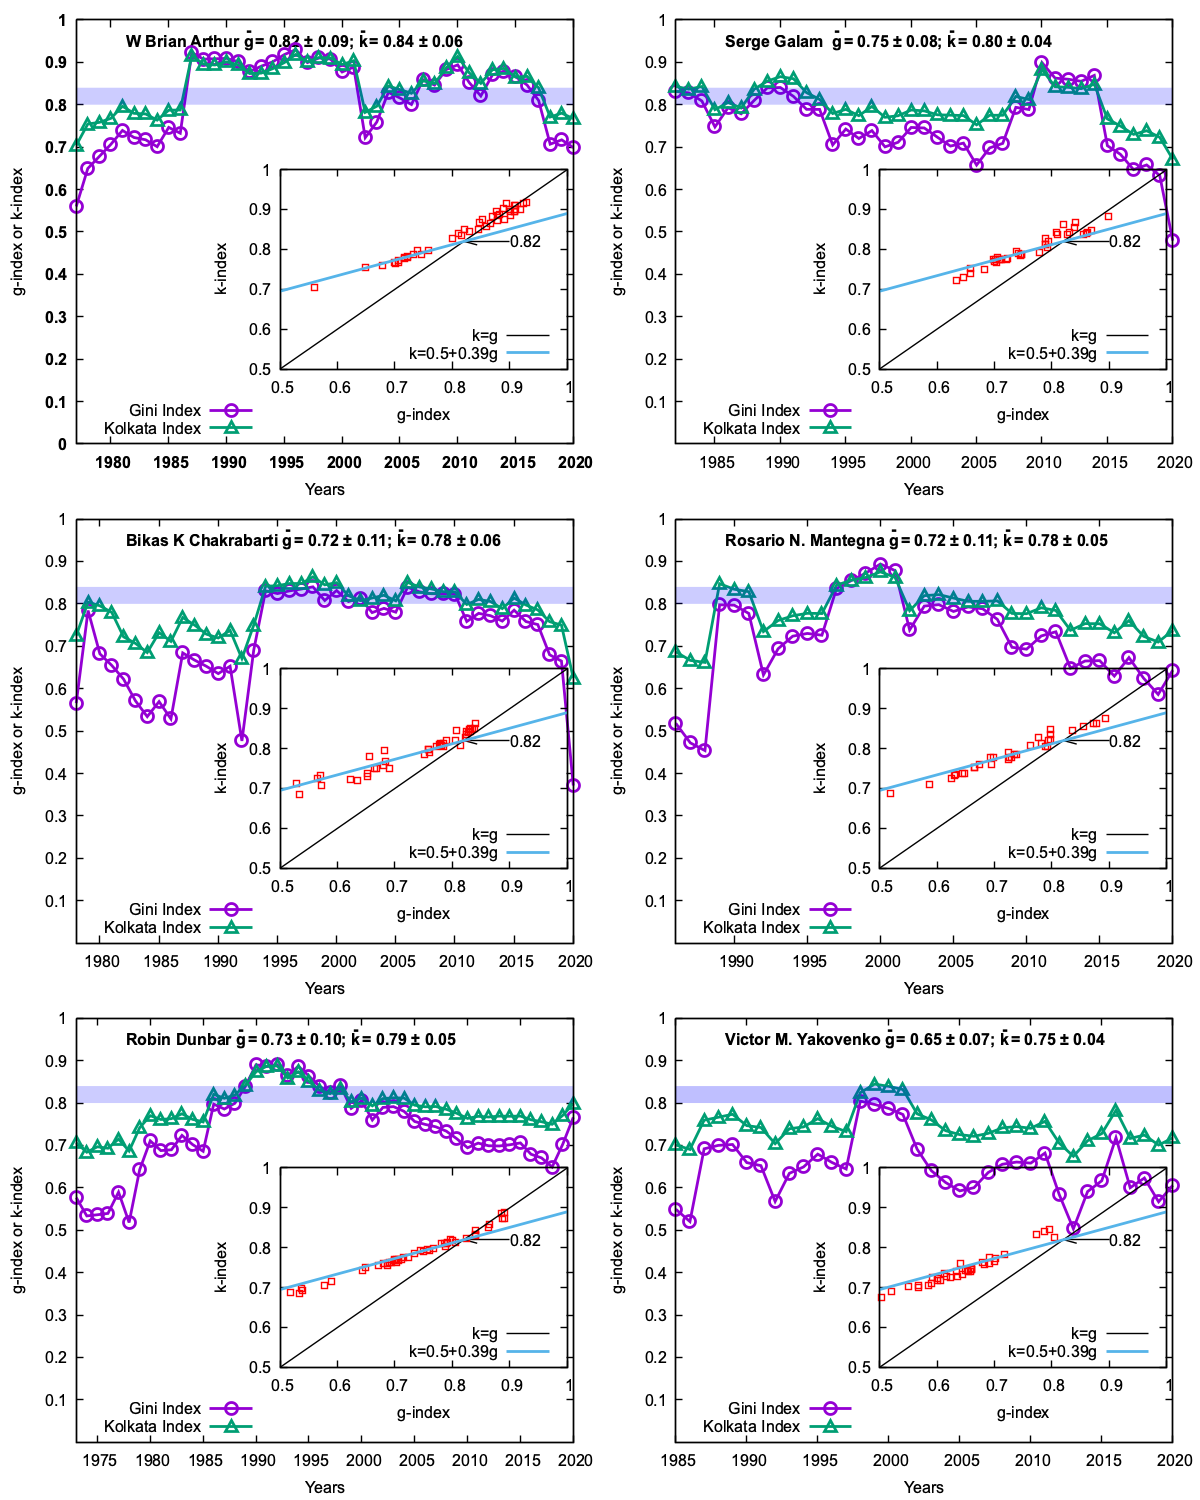
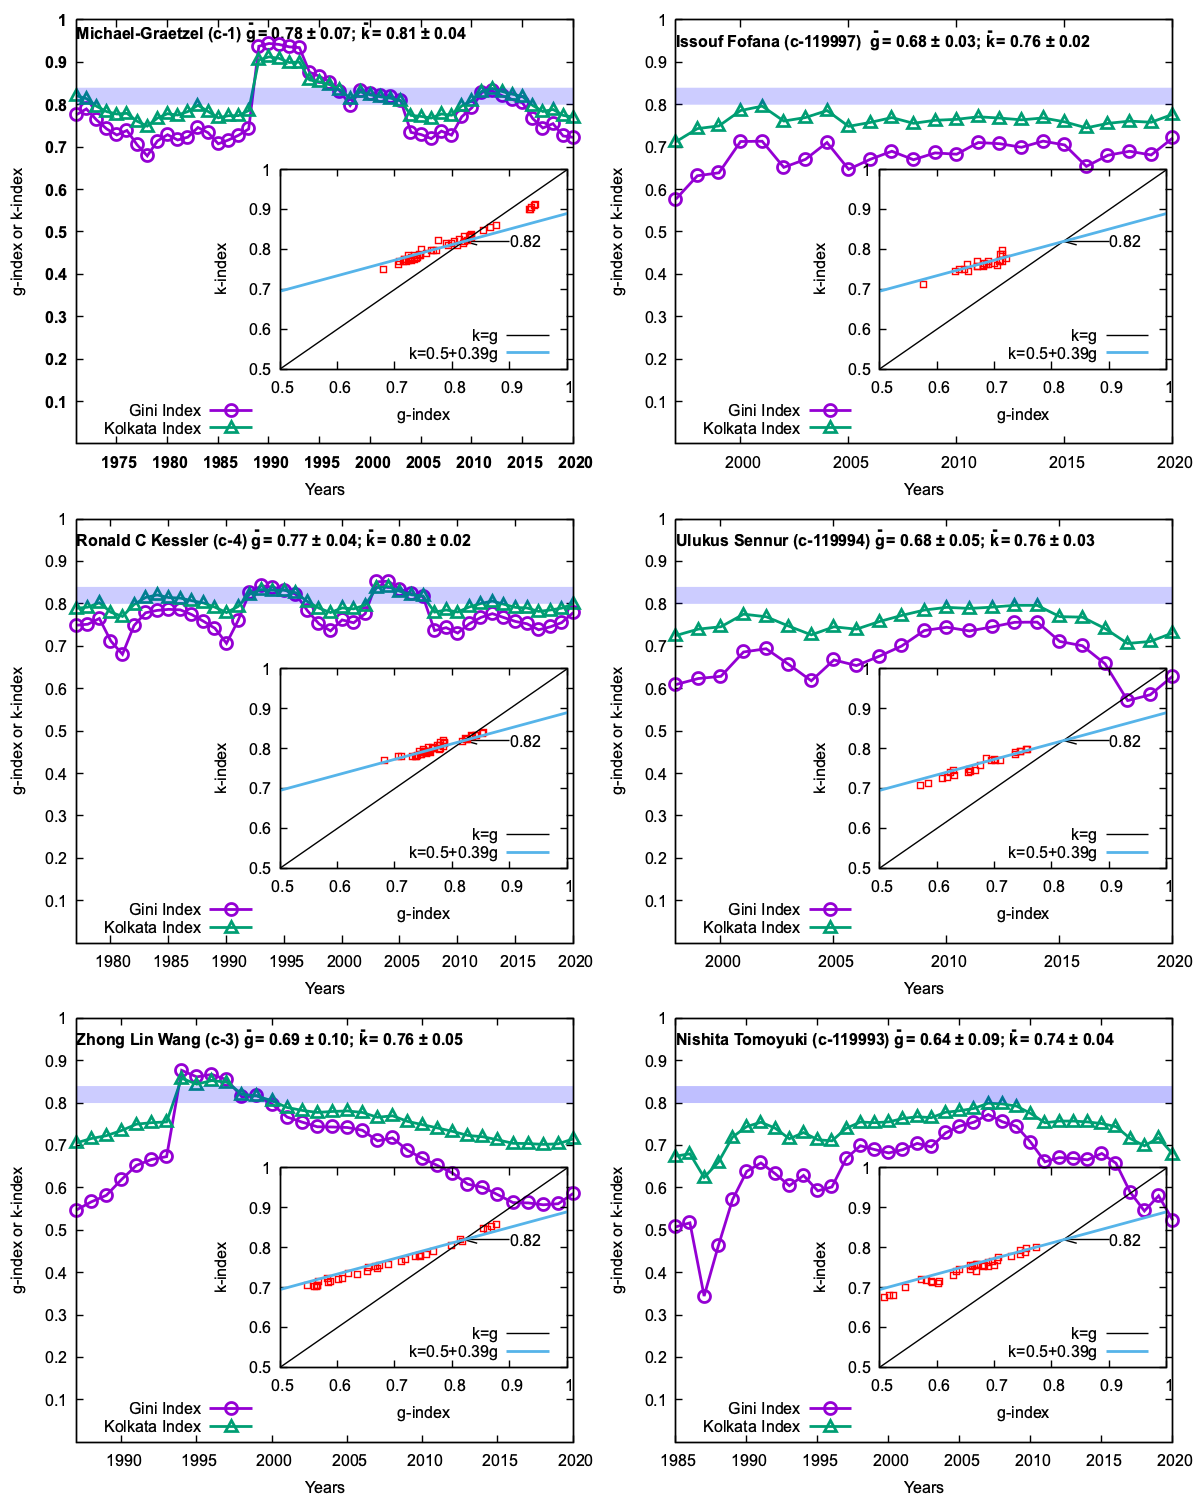
We intend to study here the inequality dynamics measured by the Gini () and Kolkata () indices of several successful researchers (mostly winners of international prizes, medals or awards like Nobel, Fields, Boltzmann, Breakthrough, highest level Stanford c-score achievers etc), some distinguished sociophysics researchers, along with those of a few high level (but not so high Stanford c-score, though within “Top 2%”) researchers, for data up to 2022, since their recorded first publication year. We collected their citation data of the publications (from online free Google Scholar, if an individual Google Scholar page exists). We calculate the and indices for each year, starting their first publication, by taking the citation statistics today (collected and analyzed in July-August 2023). We extracted the values for and for all the recorded publications of the scientist in each overlapping five-year windows (since the first publication), where the window continuously shift by one year till the year 2022 (corresponding to the last central year 2020 of the researcher) in the following figures for each researcher. The choice of five-year window size is found to give optimal stability in statistics (a smaller three-year window size did not give stability of the citation statistics for quite a few of the scientists.)
We find, the majority of the chosen scientists crossed the mark (which we interpret here as the precursor level of the SOC point 17Manna2022 ) early in their life and often they hover just above or below but around that level of inequality mark. Some others just touched the precursor mark () once or even multiple times and a few remained below that mark. For other well-known researchers considered here, the mark occurs marginally but does not cross ever. It is to be noted that this mark of reaching the SOC state (beyond the 0.82) level of inequality is for yearly statistics (within a 5-year window which slides yearly) and not for the overall success measuring indices (in their cumulative citation statistics) studied earlier for the citation statistics of some distinguished researchers (see e.g., 14Ghosh2022 ), where the SOC mark is observed to be a little higher (.
As mentioned earlier, the Hirsch index () 25Hirsch2005 , which gives the highest number of publications by a researcher, each of which has received equal or more than that number of citations, does not perhaps give an excellent measure 15Ghosh2023 ; 26Yong2014 of the success of individual researchers. It has now been clearly demonstrated 15Ghosh2023 (using the kinetic theoretical exchange model ideas), analyzing the Scopus citation data for the top 120,000 (within the “Top 2%”) Stanford cite score achievers that statistically , where and denote respectively the total number of citations and total number of publications by the researcher. This suggests convincingly that the average number of citations per paper (), and hence , are statistical numbers (given by the effective Dunbar number 28Dunbar1992 ; 29Dunbar2010 ) depending on the community or network in which the researcher belongs 15Ghosh2023 ; 18Ghosh2021 . We show here, extending our earlier observations (see e.g., 14Ghosh2022 ; 18Ghosh2021 ), that the indications of success are not reflected by the total citations , or for that matter by the Hirsch index , rather by the inequalities among the citations from publication to publication. Specifically, we show that for very successful authors, the yearly variations (given by the statistics with overlapping 5-year windows) in the Gini index (, given by the average inequality of the citations for the publications; ) and the Kolkata index (, giving the fraction of total citations received by the top fraction of publications, ). In particular, achieving signals a precursor to the Self-Organized Critical (SOC) state in the publication statistics. Analyzing the citation statistics (from the open-access Google Scholar) of 30 successful scientists throughout their recorded publication history, starting from their first recorded publication that the very successful among them (mostly Nobel Laureates, very high ranking Stanford c-scorers and a few others) reach and hover just above and below that mark, characteristic of the SOC state ( means 82% citations come from 18% publications). Others remain below that (SOC) level of extreme inequality in publication statistics.
II Socio-statistical Inequality and Its Measures
In 1905 American economist Lorenz 2Chakrabarti2006 ; 3Castelano2009 developed the Lorenz curve, a graphical representation of the distribution of wealth in a society. To construct this curve (illustrated by the red curve in Figure 1), one organizes the society’s population in ascending order of their wealth and then plots the cumulative fraction of wealth, denoted as , held by the poorest fraction of individuals. One can similarly plot the cumulative fraction of citations against the fraction of papers that attracted those many citations. As indicated in Fig. 1, the Gini index is calculated from the area between the equality line and the Lorenz curve, divided by the area (1/2) below the equality line for normalization. As such, signifies perfect equality and corresponds to extreme inequality. The Kolkata index is given by the fixed point of the Complementary Lorentz function . As such, gives the fraction of citations attracted by the top cited fraction of papers and means perfect equality, while extreme inequality corresponds to .
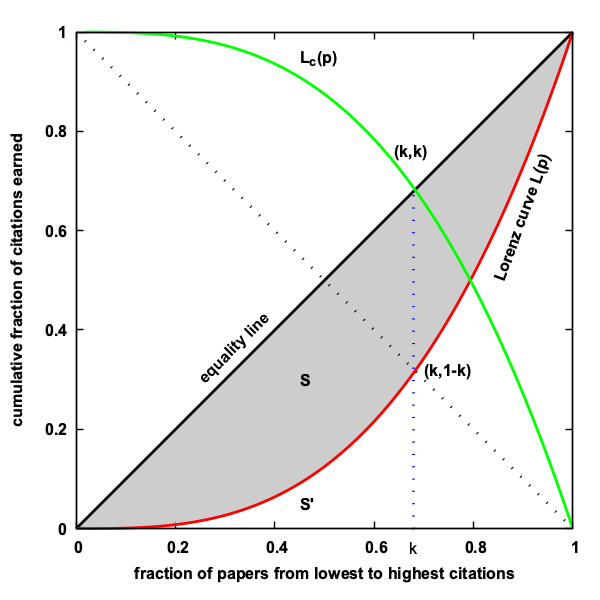
II.1 Landau-like expansion of and approximate relation
A minimal expansion 29Joseph2022 of the Lorenz function , employing a Landau-like expansion of free energy, suggests . This gives and (with = 0, the Lorenz function can represent only the equality line in Figure 1).
One can then calculate , giving and . Since , one can obtain a quadratic equation involving and . An approximate solution of it, in the limit gives
| (1) |
where 29Joseph2022 suggesting that will occur at the Pareto value . We will see here a little deviation in the value of the constant in the relation (1), for all the reported observations.
III Inequality data analysis from Google Scholar
We collect the citation data for all the recorded publications in each year since the first entry in the record for thirty successful researchers having individual Google Scholar page and having minimum and maximum number of total publications = 127 and 2954, minimum and maximum number of total citations = 5769 and 463382, minimum and maximum values of Hirsch index = 22 and 328, respectively for all those selected researchers. We considered three Nobel prize winners in each of the science subjects: Physics (H. Amano, B. Josephson, A. B. McDonald), Chemistry (R. Henderson, J. Frank, J.-P. Sauvage), Physiology & Medicine (M. Houghton, G. L. Semanza, S. Yamanka), and Economics (A. Banerjee, W. Nordhaus, J. Stiglitz). Two Fields medalists (Mathematics; S. Smalle, E. Witten), two Boltzmann award winners (Statistical Physics; D. Dhar, H. E. Stanley), two Breakthrough Prize winners (Physics; C. Kane, A. Sen), three of the top-most cite-scorers in the Stanford Scopus c-score list (M. Graetzel, R. C. Kessler and Z. L. Wang; considered for -index statistics in 15Ghosh2023 ), and six well-known contributors in Econophysics and Sociophysics: W. Brian Arthur (known for “El Farol Bar Problem” of minority choice, see e.g., 30Challet2005 ), B. K. Chakrabarti (one of the “Fathers of Econophysics” 31Jovanovic2017 ; 32Schinckus2018 ), R. I. M. Dunbar (known for Dunbar’s number of social connectivity, see e.g., 33wiki ), S. Galam (considered Pioneer of Sociophysics, see e.g., contributions in this Special Issue 34Galam70 ), R. Mantegna (one of the “Fathers of Econophysics” 31Jovanovic2017 ; 32Schinckus2018 ), V. M. Yakovenko (pioneer of kinetic exchange models of income/wealth distributions, see e.g., 35Yakovenko2009 ). We considered three of the highest-ranked Stanford Cite-Scorers for 2022 (M. Graetzel, R. C. Kessler and Z. L. Wang 36Ioannidis2022 ), and for comparison, we also considered three lower rank holders of the same “Top 2% Stanford Cite-Scores” (I. Fofana, U. Sennur and N. Tomoyuki 36Ioannidis2022 ).
For studying the growth of inequality in the citation-statistics of each of these researchers, we select a 5-year window, starting earliest publication, and note the present-day citations of each of these publications. We then construct the Lorenz function (see Fig. 1) and extract the and indices as described the last section. We associate the and values with the middle year of the respective 5-year window and by one and shift the window by one year and get the values of the inequality indices for each of the successive years up to 2020 (considering data up to 2022). These are shown in the following Figs. 2-6.
We can see from the Figs. 2-6, for all the above-mentioned 30 scientists that for many of them (mostly Nobel Prize winners and highest rank c-scorers), the Gini index value goes over the Kolkata index value in one (or multiple years) by crossing the line (see the corresponding insets). These crossings of the indices (at values above 0.80 value) clearly indicates large inequalities and entering in to the Self-Organized Critical (SOC) state of the citation statistics of these scientists 17Manna2022 .
| Inequality Indices: Hirsch (), Gini (), Kolkata () | line | ||||||||
| Researcher | Award/Prize | crossed | |||||||
| Name | /Known for | (overall) | (overall) | (Yearly Av.) | (Yearly-Av.) | near | |||
| H Amano | NP(P) | 2161 | 57281 | 106 | 0.84 | 0.83 | 0.720.13 | 0.780.06 | Yes |
| B Josephson | NP(P) | 127 | 11685 | 22 | 0.94 | 0.92 | 0.710.13 | 0.790.06 | No |
| AB McDonald | NP(P) | 437 | 25111 | 53 | 0.91 | 0.88 | 0.800.06 | 0.830.04 | Yes |
| J Frank | NP(C) | 686 | 50518 | 116 | 0.77 | 0.80 | 0.720.07 | 0.780.04 | No |
| R Henderson | NP(C) | 267 | 31822 | 65 | 0.85 | 0.84 | 0.780.06 | 0.810.04 | Yes |
| JP Sauvage | NP(C) | 655 | 61572 | 114 | 0.70 | 0.76 | 0.700.07 | 0.770.04 | Marginally |
| M Houghton | NP(M) | 529 | 59029 | 102 | 0.85 | 0.84 | 0.730.11 | 0.780.05 | Yes |
| GL Semenza | NP(M) | 682 | 192246 | 196 | 0.80 | 0.81 | 0.730.08 | 0.780.04 | Yes |
| S Yamanaka | NP(M) | 345 | 124106 | 125 | 0.85 | 0.84 | 0.710.11 | 0.780.06 | Yes |
| A Banerjee | NP(E) | 524 | 79076 | 106 | 0.86 | 0.86 | 0.840.05 | 0.850.04 | Yes |
| W Nordhaus | NP(E) | 647 | 101219 | 124 | 0.87 | 0.86 | 0.820.06 | 0.830.03 | Yes |
| J Stiglitz | NP(E) | 2408 | 364237 | 235 | 0.89 | 0.87 | 0.850.05 | 0.850.03 | Yes |
| D Dhar | BA | 209 | 8299 | 44 | 0.76 | 0.80 | 0.650.07 | 0.750.03 | No |
| HE Stanley | BA, FEP | 2070 | 225169 | 204 | 0.83 | 0.83 | 0.780.08 | 0.810.05 | Yes |
| S Smale | FM | 346 | 48084 | 85 | 0.87 | 0.85 | 0.790.11 | 0.830.06 | Yes |
| E Witten | FM, BP(P) | 620 | 242911 | 206 | 0.79 | 0.81 | 0.730.05 | 0.780.02 | Marginally |
| C Kane | BP(P) | 189 | 80714 | 75 | 0.88 | 0.87 | 0.770.07 | 0.810.05 | Yes |
| A Sen | BP(P) | 401 | 37065 | 103 | 0.69 | 0.76 | 0.600.12 | 0.720.06 | No |
| WB Arthur | EFBP | 196 | 52545 | 56 | 0.91 | 0.89 | 0.820.09 | 0.840.06 | Yes |
| BK Chakrabarti | FEP | 390 | 12596 | 47 | 0.81 | 0.82 | 0.720.11 | 0.780.06 | Marginally |
| RIM Dunbar | DN | 857 | 85486 | 141 | 0.79 | 0.81 | 0.730.10 | 0.790.05 | Yes |
| S Galam | FSP | 252 | 8828 | 42 | 0.81 | 0.83 | 0.750.08 | 0.800.04 | Yes |
| RN Mantegna | FEP | 259 | 28561 | 68 | 0.84 | 0.84 | 0.720.11 | 0.780.05 | Yes |
| VM Yakovenko | PKEM | 171 | 9076 | 44 | 0.73 | 0.78 | 0.650.07 | 0.750.04 | No |
| M Graetzel | SCS-1 | 2282 | 463382 | 295 | 0.82 | 0.82 | 0.780.07 | 0.810.04 | Yes |
| RC Kessler | SCS-4 | 1829 | 523835 | 328 | 0.83 | 0.83 | 0.770.04 | 0.800.02 | Yes |
| ZL Wang | SCS-3 | 2954 | 394080 | 299 | 0.71 | 0.77 | 0.690.10 | 0.760.05 | Yes |
| I Fofana | SCS-119997 | 353 | 5759 | 39 | 0.73 | 0.78 | 0.680.03 | 0.760.02 | No |
| N Tomoyuki | SCS-119993 | 304 | 9073 | 51 | 0.75 | 0.79 | 0.640.09 | 0.740.04 | No |
| U Sennur | SCS-119994 | 455 | 18987 | 63 | 0.73 | 0.78 | 0.680.05 | 0.760.03 | No |
Although the study of the time variations of the Gini () and Kolkata () indices (as shown in Figs. 2-6) and checking if value ever goes over the value by crossing the vs. line (as shown in the respective insets) is indispensable for detecting if the SOC state has arrived or not, one can also have an easy (but only approximate) indication of the SOC state by looking at the ratio of the citation number of the highest cited paper and the effective Dunbar number given by the average citation of the researcher. In Table 2, we precisely compare these values (where ) and see how its higher values compare with the observation of SOC (when vs. line is crossed affirmatively). We find, for more than cases correspond to SOC level.
| Researcher | Award/ | SOC level | Comments | ||||||
| Name | Known | achieved | |||||||
| for | (Table I) | ||||||||
| H Amano | NP(P) | 2161 | 57281 | 3154 | 106 | 27 | 119 | Yes | |
| B Josephson | NP(P) | 127 | 11685 | 6554 | 22 | 92 | 71 | No | Out of the |
| AB McDonald | NP(P) | 437 | 25111 | 5375 | 53 | 57 | 94 | Yes | eighteen |
| J Frank | NP(C) | 686 | 50518 | 2299 | 116 | 74 | 31 | No | researchers |
| R Henderson | NP(C) | 267 | 31822 | 3681 | 65 | 119 | 31 | Yes | with , |
| JP Sauvage | NP(C) | 655 | 61572 | 1805 | 114 | 94 | 19 | Marginally | one failed |
| M Houghton | NP(M) | 529 | 59029 | 9952 | 102 | 112 | 89 | Yes | in achieving |
| GL Semenza | NP(M) | 682 | 192246 | 12229 | 196 | 282 | 43 | Yes | the SOC level |
| S Yamanaka | NP(M) | 345 | 124106 | 30735 | 125 | 360 | 85 | Yes | (crossing the |
| A Banerjee | NP(E) | 524 | 79076 | 9254 | 106 | 151 | 61 | Yes | |
| W Nordhaus | NP(E) | 647 | 101219 | 19605 | 124 | 156 | 125 | Yes | line in |
| J Stiglitz | NP(E) | 2408 | 364237 | 23844 | 235 | 151 | 158 | Yes | Figs. 2-6; |
| D Dhar | BA | 209 | 8299 | 1182 | 44 | 40 | 30 | No | see Table I). |
| HE Stanley | BA, FEP | 2070 | 225169 | 14348 | 204 | 109 | 132 | Yes | |
| S Smale | FM | 346 | 48084 | 7912 | 85 | 139 | 57 | Yes | therefore |
| E Witten | FM, BP(P) | 620 | 242911 | 14380 | 206 | 392 | 37 | Marginally | indicates |
| C Kane | BP(P) | 189 | 80714 | 19504 | 75 | 427 | 46 | Yes | SOC level |
| A Sen | BP(P) | 401 | 37065 | 1443 | 103 | 92 | 16 | No | for the |
| WB Arthur | EFBP | 196 | 52545 | 15227 | 56 | 268 | 57 | Yes | researcher |
| BK Chakrabarti | FEP | 390 | 12596 | 730 | 47 | 32 | 23 | Marginally | with more |
| RIM Dunbar | DN | 857 | 85486 | 5312 | 141 | 100 | 53 | Yes | than 94% |
| S Galam | FSP | 252 | 8828 | 653 | 42 | 35 | 19 | Yes | success rate. |
| RN Mantegna | FEP | 259 | 28561 | 5796 | 68 | 110 | 53 | Yes | |
| VM Yakovenko | PKEM | 171 | 9076 | 920 | 44 | 53 | 17 | No | |
| M Graetzel | SCS-1 | 2282 | 463382 | 35789 | 295 | 203 | 176 | Yes | |
| RC Kessler | SCS-4 | 1829 | 523835 | 35079 | 328 | 286 | 122 | Yes | |
| ZL Wang | SCS-3 | 2954 | 394080 | 8120 | 299 | 133 | 61 | Yes | |
| I Fofana | SCS-119997 | 353 | 5759 | 333 | 39 | 16 | 20 | No | |
| N Tomoyuki | SCS-119993 | 304 | 9073 | 467 | 51 | 30 | 16 | No | |
| U Sennur | SCS-119994 | 455 | 18987 | 1198 | 63 | 42 | 29 | No |
IV Summary and Discussions
Our earlier analysis 15Ghosh2023 of the Scopus citation data for the 120000 top Stanford Cite-Score scientists showed that the Hirsch index , where and denote respectively the total number of citations and the total number of publications by the researcher. This, in turn, says that the average number of citations per paper ( , and hence , are statistical numbers (determined by the effective Dunbar number 28Dunbar1992 ; 33wiki ) of the community or network (coauthors and followers) in which the researcher belongs 15Ghosh2023 ; 18Ghosh2021 . Indeed the anticipated increase of research impact through collaboration (by increasing the number of coauthors) have been studied in 37Katz1997 , by looking at the average value of the community Dunbar number or . Also, detailed study from Google Scholar data on the relation between Hirsch index of individual scientists with their average number of co-authors per paper has been reported in ref. 38Arnaboldi2016 . Our study here shows that Hirsch index can not be a good measure of success for the researchers (even in Table 1; the highest does not correspond to a Nobel Prize winner, while the least one with do).
In an earlier work 18Ghosh2021 , we proposed that the citation inequality indices Gini and Kolkata might give better measures of success of the scientist (not or ) and perhaps and both approach to equality at for successful researchers. It may be mentioned here that we used there the entire citation data (over all the years) to get the Lorenz curve and the overall values of and of the researcher, and this gave a little higher value of point. Indeed, our numerical study 17Manna2022 of the overall or cumulative inequality statistics of the avalanches or cluster sizes in some well-studied and well-established Self-Organized Critical (SOC) models also suggested the arrival of the equality point of the avalanche size inequality indices () just appears as a precursor of the SOC point of the respective sand-pile or SOC models. In other words, as mentioned already, the SOC points in sand pile models (like BTW, Manna, etc) of physics signifies a critical state where sand grain avalanches of all sizes occur following a power law distribution. As shown in Ref.17Manna2022 , even in these physics SOC models, the inequality statistics (indices Gini & Kolkata) corresponding to the avalanche size statistics reach similar values for the inequality indices of the unequal citations (considered here equivalent to the sand mass avalanches in sand piles).
We analyzed here the citation data for all the recorded publications in each year since the first entry in the record for the chosen 30 successful scientists, each having an individual Google Scholar page. They have the minimum and maximum number of total publications = 127 and 2954, and minimum and maximum number of total citations = 5769 and 463382, respectively. For studying the growth of inequality in the citation statistics if each of these scientists, we select 5-year windows, where the central year of each window moves every year. We constructed the Lorenz functions for each of these windows (see Fig. 1) and extract the yearly values (corresponding to the central year of the window) of and indices. We have plotted these yearly and values for all the working years, starting the recorded first year and for the third year from there and continued for successive years up to 2022 (by considering data up to 2022) for each of these chosen 30 scientists. These are then shown in Figs. 2-6. The insets in each Fig. show the corresponding plot of vs. (disregarding the yearly sequence). These plots in all 30 cases of the researchers show very good linear fit to (cf. eqn. (1)), as obtained approximately using a (Landau-like) minimal polynomial expansion of the Lorenz function (see section II.A). The insets also show the actual or extrapolated (precursor of sand-pile SOC) point at . As we can see from Figs. 2-6, for 10 of the 12 Nobel Prize winners, several of the other International prize winners are considered here, well known Sociophysicists, Econophysicists, and all 3 of the highest rank Stanford Cite- Scorers, the crossing(s) of vs. (often at multiple years), do take place convincingly. The same is also true (often marginally), for several others. The 3 lower rank (yet from the “Top 2%”) Stanford Cite-Scorers did not come up to point. There are of course a few notable anomalies in this analysis of the data set; e.g., B. Josephson, J. Frank (both Nobel Laureates), D. Dhar (Boltzmann Award winner) and A. Sen (Breakthrough Prize winner) do not fit this picture of clearly reaching the SOC point. These anomalies indicate perhaps some shortcomings of this kind of analysis. On the other hand, noting that out of 27 of the researchers have chosen here (neglecting the 3 lower rank, though from the “Top 2%”, Stanford Cite-Scorers), the clear evidence of SOC are seen for 19 (neglecting the “no” and “marginal” entries in the last column of Table 1 for these 27 researchers), indicating a success rate more than 70% for identifying the outstanding researchers. In Table 2, we give a simple (though rough) indicator (where denotes the maximum citation of any paper and the effective Dunbar number of the researcher) to check if the researcher has achieved the SOC level or not. We see that the SOC level is achieved for , with more than 94% coincidence rate.
In summary, as statistically the Hirsch index of a prolific researcher grows with the total citations as 15Ghosh2023 and grows linearly with the total number of publications by the researcher, (see 15Ghosh2023 ; 18Ghosh2021 ), where the effective Dunbar number ( 15Ghosh2023 ) of the network community in which the scientist belongs, and can only give some average measures of success. In fact, very well appreciated members of the community can in principle have uniformly high citations of order for each of their publications and hence 75. Though such uniformly appreciated or cited scientists will have very low values of Gini ( 0) and Kolkata () index values. Our study here shows, notwithstanding some anomalies, most successful researchers have large fluctuations in the citations of one or more of their publications (presumably due to uneven but accurate appreciations from the usual Dunbar network or community and also perhaps from outside the usual Dunbar community), which do not increase directly the or values, but lead to larger values of their inequality indices and , which may then hover around the SOC level value , a little above the Pareto value ( = 0.80).
Acknowledgement
We are thankful to Soumyajyoti Biswas, Arnab Chatterjee, Arnab Das for careful readings of the manuscript and for useful criticisms and suggestions. BKC is grateful to the Indian National Science Academy for their Senior Scientist Research Grant.
References
- (1) S. M. de Oliveira, P. M. C. de Oliveira and D. Stauffer, Evolution, Money, War and Computers, B. G. Teubner, Stuttgart (1999)
- (2) B. K. Chakrabarti, A. Chakraborti and A. Chatterjee (Eds.), Econophysics and Sociophysics: Trends and Perspectives, Wiley-VCH, Weinheim (2006)
- (3) C. Castelano, S. Fortunato and V. Loreto, Statistical physics of social dynamics, Rev. Mod. Phys., 81, 591 (2009)
- (4) D. Helbing, Quantitative Sociodynamics: Stochastic Methods Models of Social Interaction Processes, Springer, Berlin (2010)
- (5) S. Galam, Sociophysics: A physicist’s Modeling of Psycho-political Phenomena, Springer, Heidelberg (2012)
- (6) P. Sen and B. K. Chakrabarti, Sociophysics: An Introduction, Oxford University Press, Oxford (2014)
- (7) S. Galam, Sociophysics: A review of Galam models, Int. J. Mod. Phys. C, 19, 409-440 (2008)
- (8) S. Galam and T. Cheon, Tipping points in opinion dynamics: A universal formula in five dimensions, Front. Phys. 8, 566580 (2020) (https://doi.org/10.3389/fphy.2020.566580)
- (9) S. Biswas, A. Chatterjee, P. Sen, S. Mukherjee and B. K. Chakrabarti, Social dynamics through kinetic exchange: The BChS model, Front. Phys. 2023, 11, 1196745 (2023) (https://doi.org/10.3389/fphy.2023.1196745
- (10) E. A. Filho, F. W. Lima, T. A. Alves, G. A. Alves and J. A. Plascak, Opinion Dynamics Systems via Biswas–Chatterjee–Sen Model on Solomon Networks Edmundo Alves, Physics (2023; in Press, this Spl. Issue)
- (11) D. Challet, M. Marsilli and, Y.-C. Zhang, Minority Games, Oxford University Press, Oxford (2005)
- (12) L. Martin, Extending Kolkata Paise Restaurant problem to dynamic matching in mobility markets. Juniour Management Sc., 4(1):1–34, (2019) https://doi.org/10.5282/jums/v4i1pp1-34
- (13) A Harlalka, A Belmonte and C Griffin, Stability of dining clubs in the Kolkata Paise Restaurant Problem with and without cheating, Physica A: Statistical Mechanics and its Application, 620, 128767 (2023)
- (14) A Ghosh, BK Chakrabarti, DRS Ram, M Mitra, R Maiti, S Biswas and S. Banerjee, Scaling behavior of the Hirsch index for failure avalanches, percolation clusters, and paper citations, Front. Phys., 10, 1019744 (2022) (https://doi.org/10.3389/fphy.2022.1019744)
- (15) A. Ghosh and B. K. Chakrabarti, Scaling and Kinetic Exchange Like Behavior of Hirsch Index and Total Citation Distributions: Scopus-CiteScore Data Analysis, Physica A: Statistical Mechanics and its Applications, 626, 129061 (2023)
- (16) J. E. Hirsch, An index to quantify an individual’s scientific research output. Proceedings of the National Academy of Science USA, 102, 16569–72 (2005) (https://doi.org:10.1073/pnas.0507655102)
- (17) S S Manna, S Biswas, B K Chakrabarti, Near universal values of social inequality indices in self-organized critical models, Physica A: Statistical Mechanics and its Applications 596, 127121 (2022)
- (18) A Ghosh, BK Chakrabarti, Limiting value of the Kolkata index for social inequality and a possible social constant, Physica A: Statistical Mechanics and its Applications 573, 125944 (2021)
- (19) S Banerjee, S Biswas, BK Chakrabarti, SK Challagundla, A Ghosh, SR Guntaka, H Koganti, AR Kondapalli, R Maiti, M Mitra, DRS Ram, Evolutionary dynamics of social inequality and coincidence of Gini and Kolkata indices under unrestricted competition, International Journal of Modern Physics C 34, 2350048 (2023)
- (20) C. Gini, Measurement of inequality of incomes, The Economic Journal, 31, 124-126 (1921)
- (21) A. Ghosh, N. Chattopadhyay and B. K. Chakrabarti, Inequality in societies, academic institutions and science journals: Gini and k-indices, Physica A: Statistical Mechanics and its Applications, Elsevier, 410, 30–34 (2014)
- (22) S. Banerjee, B. K. Chakrabarti, M. Mitra and S. Mutuswami, Social Inequality Measures: The Kolkata index in comparison with other measures, Front. Phys., 8, 562182 (2020) (https://doi.org/10.3389/fphy.2020.562182)
- (23) P. Bak, C. Tang and K. Wiesenfeld,Self-organized criticality: An explanation of the 1/f noise, Phys. Rev. Lett., 59, 381 (1987)
- (24) S. S. Manna, J. Phys. A: Math. Gen., 24, L363 (1991)
- (25) J. E. Hirsch, An index to quantify an individual’s scientific research output. Proceedings of the National Academy of Science USA, 102, 16569–72 (2005) (https://doi.org/10.1073/pnas.0507655102)
- (26) A. Yong, A critique of hirsch’s citation index: A combinatorial fermi problem, Notices of the American Mathematical Society, 61, 1040–50 (2014) (https://doi.org/10.1090/noti1164)
- (27) R. I. M. Dunbar, Neocortex size as a constraint on group size in primates, J. Human Evolution. 22, 469–493 (1992)
- (28) R. I. M. Dunbar, How many friends does one person need? Dunbar’s number and other evolutionary quirks, Harvard University Press (2010).
- (29) B. Joseph and B. K. Chakrabarti, Variation of Gini and Kolkata indices with saving propensity in the Kinetic Exchange model of wealth distribution: An analytical study, Physica A: Stat Mech its Appl, 594 127051 (2022) (doi:10.1016/j.physa.2022.127051)
- (30) D. Challet, M. Marsili, and Y.-C. Zhang, Minority Games: Interacting agents in financial markets, Oxford University Press, Oxford (2005)
- (31) F. Jovanovic and C. Schinckus, Econophysics and Financial Economics: An Emerging Dialogue, p. 178, Oxford University Press, Oxford (2017)
- (32) C. Schinckus, When Physics Became Undisciplined: An Essay on Econophysics (2nd Thesis), pp. 15-16, Department of History and Philosophy of Science, University of Cambridge (2018) [https://api.repository.cam.ac.uk/server/api/core/bitstreams/cc3d796f-c130-4f78-89ab-ed16301651ab/content]
- (33) Dunbar’s number, Wikipedia [https://en.wikipedia.org/wiki/Dunbar%27s_number]
- (34) Galam special issue [https://www.mdpi.com/journal/physics/special_issues/SergeGalam70]
- (35) V. M. Yakovenko and J. Barkley Rosser, Statistical mechanics of money, wealth, and income, Rev. Mod. Phys. 81, 1703-1725 (2009)
- (36) J. P. A. Ioannidis, September 2022 data-update for “Updated science-wide author databases of standardized citation indicators”, Elsevier Data Repository, V5 (2022) (doi: 10.17632/btchxktzyw.5)
- (37) J. S. Katz and D. Hicks, How much is a collaboration worth? A calibrated bibliometric model, Proc. Sixth Conf. of Int. Soc. for Scientometric and Informetric,, Jerusalem, June 16-19, pp. 163- 175 (1997)
- (38) V. Arnaboldi, R. I. M. Dunbar, A. Passarella and M. Conti, Analysis of Co-Authorship Ego Networks, In Advances in Network Science: 12th International Conference and School, NetSci-X 2016, Wroclaw, Poland, January 11-13, 2016, Proceedings 12 (pp. 82-96). Springer International Publishing (2016).[https://link.springer.com/chapter/10.1007/978-3-319-28361-6_7]