Impact of disorder in the charge-density-wave state of Pd-intercalated ErTe3 revealed by the electrodynamic response
Abstract
It is a general notion that disorder, introduced by either chemical substitution or intercalation as well as by electron-irradiation, is detrimental to the realisation of long-range charge-density-wave (CDW) order. We study the disorder-induced suppression of the in-plane CDW orders in the two-dimensional Pd-intercalated ErTe3 compositions, by exploring the real part of the optical conductivity with light polarised along the in-plane and axes. Our findings reveal an anisotropic charge dynamics with respect to both incommensurate unidirectional CDW phases of ErTe3, occurring within the -plane. The anisotropic optical response gets substantially washed out with Pd-intercalation, hand-in-hand with the suppression of both CDW orders. The spectral weight analysis though advances the scenario, for which the CDW phases evolve from a (partially) depleted Fermi surface already above their critical onset temperatures. We therefore argue that the long-range CDW orders of ErTe3 tend to be progressively dwarfed by Pd-intercalation, which favours the presence of short-range CDW segments for both crystallographic directions persisting in a broad temperature () interval up to the normal state, and being suggestive of precursor effects of the CDW orders as well as possibly coexisting with superconductivity at low .
I Introduction
The interplay between broken-symmetry ground states, either via competition or coexistence, belongs to the mostly explored topics of modern solid-state physics and seems to be an essential ingredient in the arena of strongly correlated materials. It goes without saying that the discovery of a charge-density-wave (CDW) phase in the middle of the pseudogap region of the high-temperature superconducting cuprates (HTC) brought into focus the intrinsic nature of those very different cooperative electronic phenomena, suggesting novel concepts such as intertwined order Fradkin et al. (2015). However, in HTC and other materials, like the iron-based superconductors, any kind of broken-symmetry ground state also arises in the presence of significant disorder, because of the large doping required in order to destroy the phase of the parent compound (i.e., Mott insulator or magnetic). In the absence of electron-electron interactions, a metal can turn into an Anderson insulator Anderson (1958) with disorder, but it can remain metallic if interactions are relevant. Therefore, disorder, intended from a broad perspective and induced either by doping or by electron-irradiation, cannot be neglected, when addressing the emergence of superconductivity from or within a CDW environment.
It is a widespread wisdom of competing orders that the disorder-induced suppression of the CDW state may naturally lead to the increase in the superconducting critical temperature . In a weak coupling picture, CDW suppression increases the number of carriers available for superconductivity pairing at the Fermi surface (FS), thus enhancing . The physical scenario that in systems, where CDW competes with superconductivity, disorder promotes the latter is very significant and even extends to a strongly coupled situation as long as disorder remains weak. Though, there is a need to better scrutinise such a proposition, particularly with model systems capturing the impact of disorder but allowing to circumvent the complications of strong magnetic correlations or of a Mott insulating phase. In this respect, several old materials were revisited and several new ones were chased. For instance, members of the transition metal dichalcogenides family Li et al. (2017); Cho et al. (2018) as well as alternative materials like CuxTiSe2 Morosan et al. (2006); Qian et al. (2007); Kogar et al. (2017) were intensively investigated in order to elucidate how the CDW order gets affected and conversely how superconductivity may be favoured by the presence of disorder.
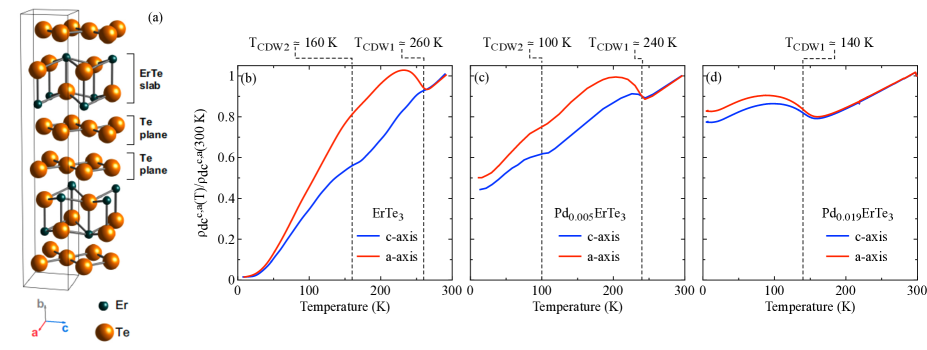
Here, we address the Pd-intercalated ErTe3 (from now on also noted as PdxErTe3), which recently arose to a model family of materials serving as suitable playground for a controlled tuning of disorder Straquadine et al. (2019); Fang et al. (2019), with the intent to trace its implications from the perspective of the charge dynamics. Our focus is specifically restricted to the optical signatures of the CDW ground state, being the Pd content 1.2 % in our samples (while the onset of superconductivity clearly occurs for 2% Straquadine et al. (2019)). A peculiar asset of the chosen compounds resides in the fact that, unlike the parent ditelluride material where vacancies were found, the (undoped) tritelluride one is free from defects in the Te layers and the accurately tunable Pd-intercalation in ErTe3 solely allows a more systematic optical investigation than previous attempts Huang et al. (2012); vac . ErTe3 itself originally kindled a lot of attention since it belongs to the wider series of Te3 ( = Y, La-Nd, Sm, Gd-Tm) quasi two-dimensional metals exhibiting unidirectional (in-plane) incommensurate CDW states and harbours two successive CDW phase transitions, with critical temperatures 260 K and 160 K DiMasi et al. (1995); Ru et al. (2008a, b); Fang et al. (2020). The resistivity () measurements Walmsley and Fisher (2017) provide signatures for anisotropic transport properties at both CDW phase transitions (i.e., broad bumps overlapped to the otherwise metallic-like for each in-plane and axis, Fig. 4 in Appendix), which are then smeared and suppressed (i.e., lowering of both and ) by the Pd-intercalation, consistent with the dominant effect arising from disorder Straquadine et al. (2019).
The absorption spectrum Dressel and Gruner (2002) generally gives access to the relevant energy scales (like the CDW gap(s)), and the optical spectral weight () encountered in the charge dynamics as well as its relative temperature () evolution shed light on the reconstruction of the electronic band structure and on FS instabilities with respect to the CDW transitions Kohn (1959); Grüner (2000); Eiter et al. (2013), here additionally singled out for both the and axes (Fig. 4(a) in Appendix). We will impart that our present data grasp first of all an anisotropic optical response (missed in previous investigations Pfuner et al. (2010); Hu et al. (2011)), emerging between the two in-plane crystallographic axes but diminishing with disorder, and second emphasise the relevance of CDW precursor effects, the latter present already at and evolving into a long-range CDW order at and in the pristine ( = 0) and weakly Pd-intercalated PdxErTe3.
II Samples and Experiment
The samples for our optical investigation were grown after a Te self-flux method as described previously for Te3 ( = rare-earth) Ru and Fisher (2006), with the additional small amounts of Pd to the melt. The resulting crystals are orange in color, shiny, soft, and micaceous metals.
The dependence of the optical reflectivity () at near-normal incidence of light is measured on shiny surfaces, pertaining to the -plane (Fig. 4(a) in Appendix), of an approximate size of 12 mm2 for all samples Dressel and Gruner (2002). Measurements were always performed on freshly cleaved (thin) crystals for both polarisations of light along the and axes. Data from to cm-1, thus from the far- (FIR) up to the mid- (MIR) and then near-infrared (NIR) spectral ranges, are collected from to 300 K by using the Fourier transform infrared spectrometer (Bruker Vertex 80v). From NIR up to the ultra-violet (UV) range, i.e. 4 00048 000 cm-1, is measured at 300 K with the PerkinElmer Lambda 950 spectrometer.
The spectra over the broad FIR-UV spectral range are then an indispensable prerequisite in order to preform reliable Kramers-Kronig transformation for achieving the real part () of the broadband (longitudinal) optical conductivity Dressel and Gruner (2002). We refer to the Appendix for further technical details about the experiment and for a comprehensive review of the original data (Figs. 5 - 7) and corresponding (Figs. 9 - 11).
III Results and Discussion
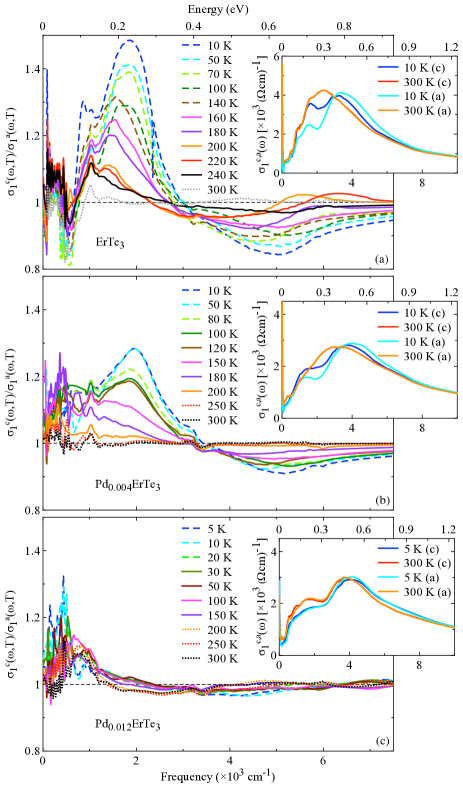
Introducing our results, we primarily highlight the derived optical anisotropy as a function of , defined by the ratio between the and axes (i.e., ), shown in Fig. 1 for the FIR up to the MIR spectral range. As pointed out earlier for the pristine compound, this FIR-MIR energy interval mates with the spectral range tied to the characteristic energy scales of the CDW gap(s), located at about 3000 cm-1 Pfuner et al. (2010); Hu et al. (2011, 2014). Such an anisotropy in ErTe3 (Fig. 1(a)) is mainly dominated by the peak around 2000 cm-1 and the depletion around 5000 cm-1, both coinciding with related absorption features at equivalent energy scales in (inset of Fig. 1(a)). The evolution in of the intensity in is quite monotonous upon crossing and . Moreover, the observed optical anisotropy progressively pales upon increasing the Pd-intercalation content (Figs. 1(b,c) and their insets). Overall, we anticipate that these findings bear testimony to an important reconstruction of the electronic band structure as well as to a substantial spillover effect of the intercalation-driven disorder with respect to both CDW transitions.
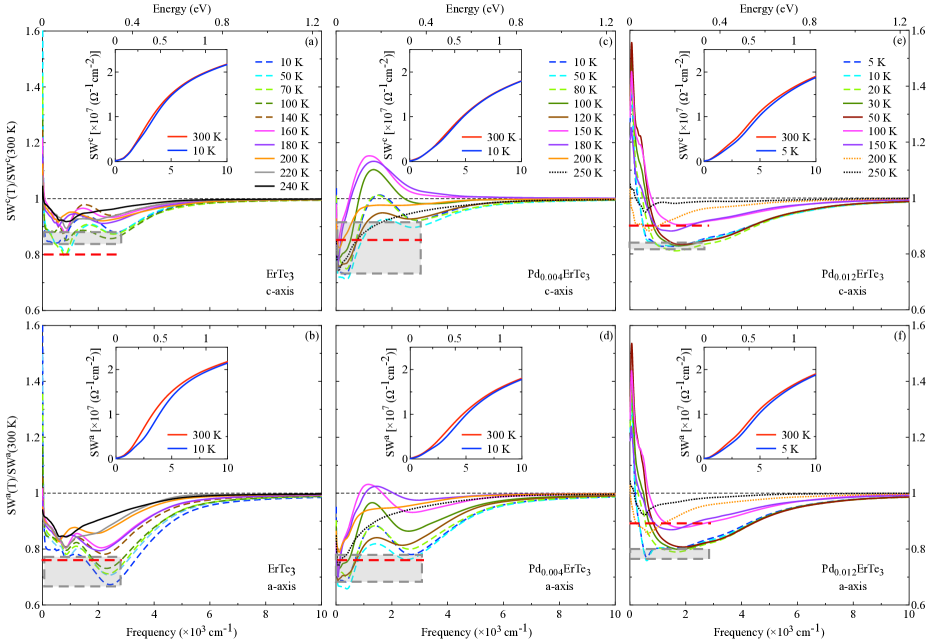
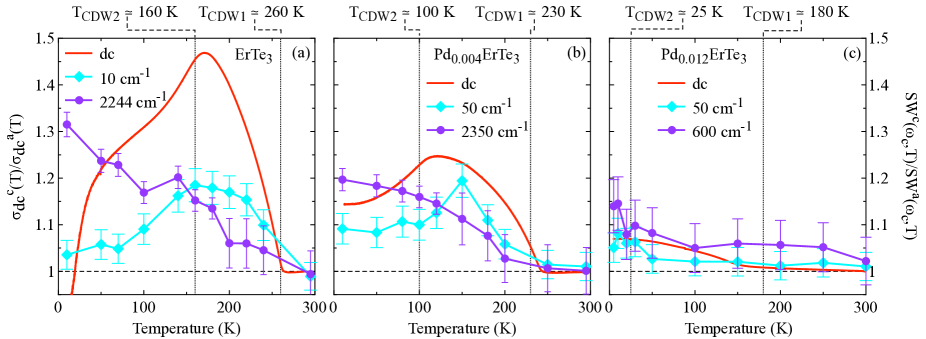
Figure 2 anew underscores the anisotropy of the optical response, depicted here by the ratio of the integrated spectral weight (Fig. 12 in Appendix) at selected cut-off frequencies SW . We choose two ; at FIR energy scales (i.e., 10-50 cm-1), pertaining to the metallic Drude component of (see Figs. 16(b,d,f) and 17(b,d,f) in Appendix), and at MIR ones (i.e., 600-2400 cm-1), denoting the energy interval with the occurrence of the optical anisotropy affiliated to the interband transitions (Fig. 1). We exert the criterion to set at MIR frequencies in coincidence with the peak of (Fig. 12 in Appendix). We remark that is uniquely identified and it is virtually constant at 150 - 200 K, while turns out to be less precisely defined at higher . This propagates to the uncertainties in the estimation of the anisotropic and it is accounted for by the enhanced error bars upon increasing in Fig. 2.
is contrasted with the transport anisotropy, represented by the ratio of the conductivity along the and axes (i.e., ) dca . For at FIR energy scales mimics the anisotropy of the conductivity. On the contrary, for at MIR energy scales the optical anisotropy increases gradually, with a change of slope between and being barely perceptible upon increasing the Pd-intercalation. This is already a signature that the conduction bands crossing the Fermi energy () directly reflect the anisotropy as a function of , while the implications of the CDW states on the electronic band structure at energy scales far away from are somehow more distinct and the resulting (optical) anisotropy is not necessarily copying with the transport-like behaviour across and . It is also worth noting that the anisotropy of all quantities gets considerably reduced upon increasing the Pd-intercalation concentration .
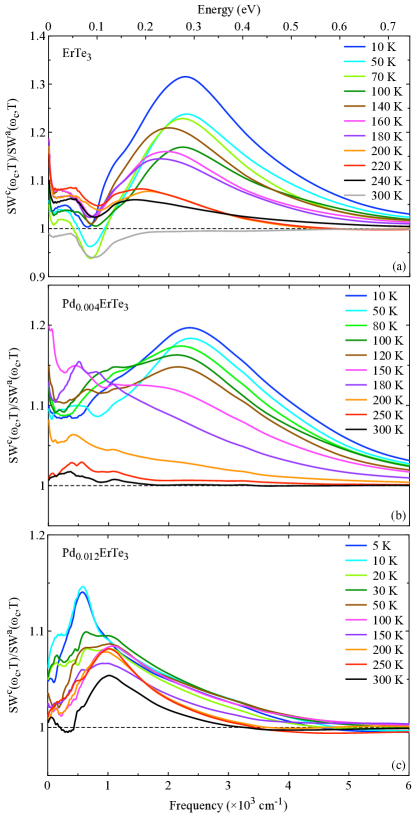
We stick to the model independent analysis based on the integrated SW and consider, complementary to Fig. 2, the ratio with respect to 300 K, given by K) and shown as a function of in Fig. 3 for the (lower panels) and (upper panels) axis. The ratio at 300 K clearly emphasises a two-fold reallocation to low (with ratio above 1) and above all to high (with ratio below 1) energies (see also Appendix for more insights), which gets more pronounced upon decreasing . This seems to be true for all PdxErTe3. Such a behaviour is anisotropic as well, since the depletion in K) below 1 is clearly stronger along the than axis (at least for = 0 and 0.004); an aspect which may be already recognised directly from the integrated (insets of Fig. 3), being it at 5 or 10 K in the MIR spectral range decidedly more depleted along the than axis with respect to 300 K. The accumulation of at low energies for both polarisations occurs in a rather small FIR spectral range, which narrows as well upon decreasing (for = 0 and 0.004 PdxErTe3) or at least at low (for = 0.012 PdxErTe3). This narrowing may be ascribed to the suppression of scattering channels for the itinerant charge carriers in the CDW ground state(s) (Figs. 13(a,c,e) in Appendix). On the other hand, the width at any of that low energy accumulation becomes visibly larger for the highest Pd-intercalation at = 0.012 (Figs. 3(e,f)), being this a direct fingerprint of the enhanced Drude scattering rate along both polarisation directions (Fig. 13(e) in Appendix) as consequence of the Pd-intercalation-induced disorder.
Figure 3 also tells us that a smaller fraction of FS gets gapped by the CDW transitions Kohn (1959); Grüner (2000) upon increasing the Pd-intercalation concentration . Indeed, the depletion below 1 of the ratio itself is a rough measure of that fraction Corasaniti et al. (2019), which is of the order of 10 to 30 % (graphically sketched by the grey areas in Fig. 3). Particularly along the axis, for which the anomalies in the resistivity are remarkably more pronounced than along the axis (Figs. 4(b-d) in Appendix), the effective FS-gapping tends to shrink with increasing Pd-intercalation. We might ponder that the amount of the FS-gapping along the axis is less influenced by the Pd-intercalation than along the axis for both (primary and secondary) CDW transitions. The relationship and correspondence between the FS-erosion and the anomaly in were already advanced in the past Ong and Monceau (1977) in connection with the CDW as well as SDW transitions in two-dimensional materials (for which notoriously the FS-nesting is not as perfect as in one dimension Kohn (1959); Grüner (2000); Eiter et al. (2013)). Independent from the origin of the FS-gapping or depletion upon which we will return later, we find a reasonable agreement within the same bulk values of its estimation from the ratio (grey areas in Fig. 3) and the transport data (horizontal red-dashed lines in Fig. 3 rho ) of PdxErTe3. We caution however that the presence of two CDW phase transitions at and and of the corresponding double anomaly in may configure such a comparison as disputable. Nonetheless, this appraisal looks a posteriori rather robust. The discrepancy between the two analysis at the = 0.012 Pd-intercalation (Figs. 3(e,f)) is explained by the use of for the = 0.019 one (Fig. 4(d) in Appendix), which consistently dissimulates a smaller FS-gapping. As a note on the side, the frequency of the deepest minimum in K) may be used as an indicative, notwithstanding rough measure of the CDW gap(s) Pfuner et al. (2010); Hu et al. (2011, 2014). We observe a broadening of the minimum in the ratio between the = 0 and 0.012 Pd-intercalations, testifying an amplified distribution of the gap energy scales and respectively an additional manifestation of disorder besides its generated reduction of the effective amount of the FS-gapping.
We finally turn our attention to the dependence of the ratio and its consequences towards a possible microscopic model for the interplay between disorder and CDW phase transitions. Foremost, it is worth knowing that a depletion of the ratio occurring over an ample interval, even extending well above the nominal CDW transition temperatures, was also recently observed in ZrTe3-xSex Chinotti et al. (2018). In fact, the ratio in Fig. 3 is consistently depleted in the MIR spectral range at all with respect to 300 K along both polarisation directions. Admittedly, for ErTe3 one may argue that the depletion of the ratio just happens for already below , since the relatively high and our -grid do not allow any firm claim for the optical response of the so-called normal state. However, for the two Pd-intercalated ErTe3 compositions studied here (Figs. 3(c-f)) it is a well-established experimental fact that the removal at MIR frequencies does already happen in the normal state, so at definitely above the highest CDW transition at . Interestingly enough, at an intriguing local recovering of is prominently observed in a narrow energy interval around 1000 cm-1 for the = 0.004 Pd-intercalation (Figs. 3(c,d)), affecting the low-frequency shoulder of the MIR peak prior a renewed depletion and full recovery at higher energy scales. This latter facet is just adumbrated in the pristine compound ( = 0, Figs. 3(a,b)) and is not at all detected in the spectra of the = 0.012 Pd-intercalation (Figs. 3(e,f)). While beyond the immediate scope of this work, we venture a guess that this not-straightforward reshuffling in selected spectral ranges underlines the complex evolution of the electronic band structure and its interplay with impurity bands in the intermediate regime between the two CDW transitions. We refer to the discussion around Figs. 16 and 17 in Appendix for an alternative analysis of the redistribution, pinned down to specific energy intervals.
IV Conclusions
The globally emerging picture is tightly bound to the presence of a pseudogap in the electronic excitation spectrum of PdxErTe3 in their normal-state. Such pseudogaps reveal the tendency towards the formation of short-range order, uncorrelated CDW segments forming already at high (i.e., in the normal state) and crossing over to a coherent CDW condensate at low . We conjecture that the Pd-intercalation may then perturb the long-range phase coherence of the pristine material by inducing patches of CDW condensates without specific and/or well defined orientations with respect to the crystallographic structure, as similarly proposed elsewhere Zhu et al. (2016). This destroys the bidirectional nature of the CDW transitions, waving the characteristic anisotropy in several physical properties between the crystallographic axes but leading yet to the partial depletion of FS for any Pd-intercalation (Fig. 3).
Our optical results therefore convey the relevance of precursors in the formation of the CDW condensate, which certainly are not surprising for genuine CDW materials Schwartz et al. (1995); Perucchi et al. (2004); Grüner (2000). In the latter materials, precursor effects predominantly originate from fluctuations of the order parameter, as originally proposed in the seminal work of Ref. Lee et al., 1973. Additionally, our findings directly map the impact of the intercalation-induced disorder, which concerns both the transport data as well as the optical outcome at any FIR-MIR energy scales (Fig. 2). In this context, alternative avenues may be considered for the interplay between CDW transition and disorder itself. It is worth recalling the setting based on the excitonic insulator dynamics Kohn (1967); Kidd et al. (2002), which was advanced as major ingredient for the (Overhauser-type) CDW state in TiSe2 Li et al. (2007). In fact, Cu intercalation in TiSe2 suppresses such excitonic correlations leaving nonetheless the electron-phonon interaction less affected and thus allowing the presence of CDW incommensurations Qian et al. (2007); Kogar et al. (2017). Whether this is likely pertinent for our materials calls for further investigations. As a matter of fact, contrary to the semimetallic nature of the CDW state in 1-TiSe2 the shape of FS in ErTe3, evinced from the angle-resolved-photoemission-spectroscopy Moore et al. (2010), principally tends to favour the creation of CDW gaps by perpendicular FS nesting vectors. Raman data question though the nesting as unique driving mechanism for the CDW transition; instead of a purely electronic instability the CDW ordering vector could be determined by a lattice distortion driven by some other mechanism exploiting the role of the electron-phonon coupling in the spirit of a so-called focusing effect Eiter et al. (2013). Generally, solving the dichotomy about the repercussion of disorder on the CDW collective state would be also instrumental towards superconductivity, as we now cursorily flash.
As future outlook, it remains indeed to be seen how the gradual suppression of the CDW state and of its anisotropic character with disorder, as disclosed by our optical data, paves the way to the onset of superconductivity upon Pd-intercalation. Since in PdxErTe3 typically does not exceed 3 K, our optical tool must be complemented with resonant-cavity investigations in order to achieve the expected, relevant energy scales of the superconducting state. Nonetheless and even though superconductivity appears at Pd-intercalations 2% Straquadine et al. (2019), upon extrapolating our results for 1.2% we might be tempted to suggest that electrons involved in the superconducting pairing instead of competing for the same portions of FS do actually coexist with those of the CDW segments Chinotti et al. (2018); Fang et al. (2020) and that superconductivity generically bunches out from a pseudogap-like phase, as for HTC Fradkin et al. (2015). The suppression of the electronic anisotropy upon Pd-intercalation in ErTe3 concomitant with the onset of superconductivity may equally resemble the situation at the intertwined nematic, CDW and superconducting order, lately considered to be an ubiquitous feature in unconventional superconductors (like in iron-based and Kagome materials) Kasahara et al. (2012); Nie et al. (2022); Zheng et al. (2022). At last, enlightening how our results could be compatible with the suggestive Bragg glass phase at weak disorder (i.e., the regime addressed here), as alluded by the scanning tunneling microscopy data Fang et al. (2019), still needs to be addressed and would furthermore profit from the support of dedicated theoretical work.
Acknowledgements
Work at Stanford was supported by the Department of Energy, Office of Basic Energy Sciences, under contract DE-AC02-76SF00515.
† Authors M.C. and R.Y. contributed equally to the work.
‡ Present affiliation: Key Laboratory of Quantum Materials and Devices of Ministry of Education, School of Physics, Southeast University, Nanjing 211189, China
∗ Correspondence and requests for materials should be addressed to: L. Degiorgi, Laboratorium für Festkörperphysik, ETH - Zürich, 8093 Zürich, Switzerland; email: degiorgi@solid.phys.ethz.ch.
Appendix
IV.1 Samples, experimental techniques and data
IV.1.1 Samples characterisation and crystal structure
The chemical analysis of our samples was performed in a JEOL JXA-8230 SuperProbe electron microprobe system, calibrated to ErTe3 and PdTe2 secondary standards Straquadine et al. (2019). The microprobe analysis showed that 12% of the Pd present in the melt incorporated into the crystals during growth and that the crystal composition is uniform to within experimental error at different spots on a crystal surface and between crystals grown in the same batch. Plate-shaped crystals ( axis normal to the -plane, Fig. 4(a)) 1-3 mm across were routinely produced. The crystal plate area remained fairly constant, but the resulting thicknesses decreased as Pd concentration () increased, from several hundred microns for = 0 to approximately 50 microns for = 0.05 Pd-intercalated ErTe3. This offers indirect evidence that Pd atoms act as intercalants between the Te planes, in that their presence tends to disrupt and slow the rate of growth in this direction Straquadine et al. (2019).
The crystal structure (Fig. 4(a)) is formed of alternating puckered Te slabs with bilayers of approximately square nets of Te atoms. The presence of a glide plane in the stacking of these layers creates a 0.05% Ru et al. (2008b) difference between the in-plane and axes lattice parameters at 300 K and biases the primary CDW transition to order along the axis. The space group of Te3 is nominally orthorhombic (), even though evidences for effectively fourfold symmetric electronic properties were pointed out in the literature Straquadine et al. (2019).
IV.1.2 transport characterisation
Measurements of the dependence of the resistance were performed in a Janis Supertran-VP continuous flow cryostat. The resistivity in the -plane (Fig. 4(a)) was measured on thin rectangular crystals which had been cut with a scalpel and cleaved to expose a clean surface immediately before contacting. Crystals were cut such that current flows along the (101) axis, and contacts were attached to the surface in the transverse geometry Walmsley and Fisher (2017). In this geometry, the sum of the resistivity components along the crystal axes and the in-plane resistivity anisotropy are measured simultaneously within the same crystal Walmsley and Fisher (2017); Straquadine et al. (2019). The extracted and are displayed in Figs. 4(b-d) for compositions coinciding or very close to the Pd-intercalations investigated in our work. One can easily recognise the two consecutive CDW transitions (at least at low Pd-intercalations) with bump-like features and/or changes of slope at and (dashed lines in Figs. 4(b-d)), which lower with increasing Pd-intercalation. The anisotropy, shown in Fig. 2, derives from these data in Figs. 4(b-d), thus comparing our samples with = 0.004 and 0.012 Pd-intercalation to the = 0.005 and 0.019 compositions, respectively.
It has been broadly established that marks the onset of the primary CDW order, while of the second, orthogonal CDW component. Thus, despite the nearly tetragonal symmetry of the crystal, the phase at has unidirectional CDW order, while the low-temperature phase is bidirectional, but with generally inequivalent strengths. The two CDW transitions in ErTe3 are associated with nesting wave vectors and (with and , and are the respective in-plane lattice constants) Fang et al. (2020).
IV.1.3 Measured optical reflectivity
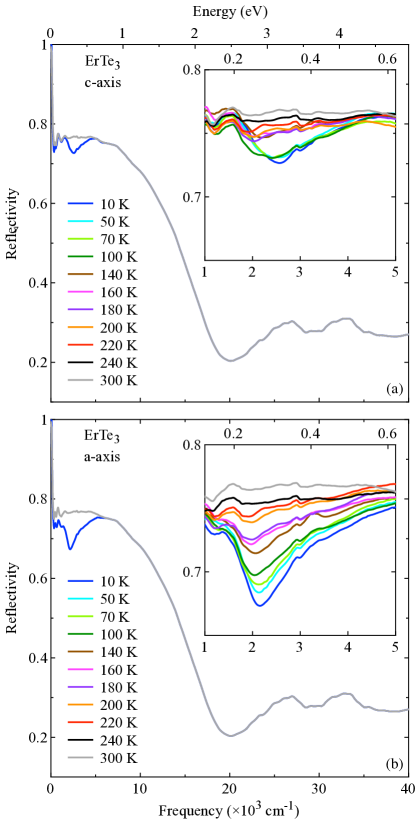
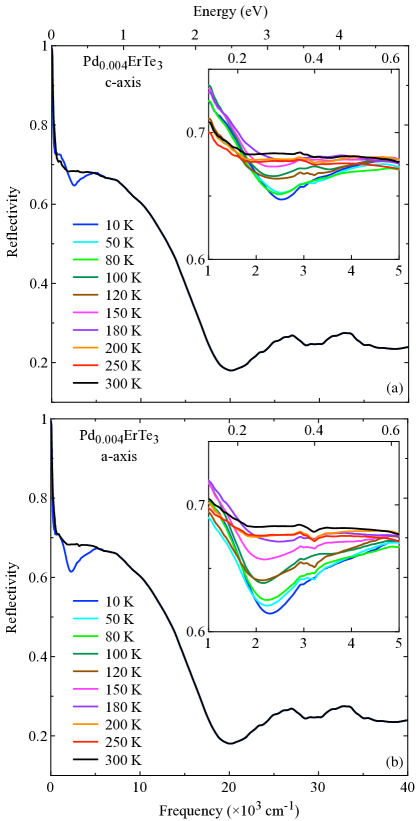
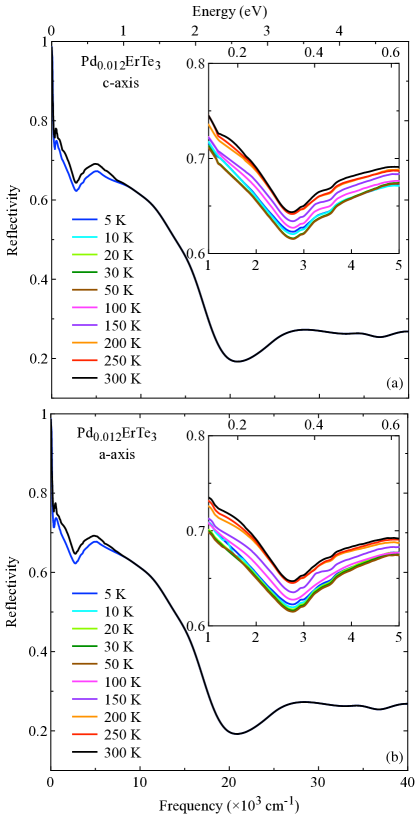
Figures 5-7 display the measured dependence of the in-plane optical reflectivity () for all investigated compounds along the and axes (Fig. 4(a)). In all data sets, we recognise the typical metallic behaviour with a -independent plasma edge (i.e., sharp increase of upon decreasing frequency), having its onset at approximately 2104 cm-1. While the dependence of mainly occurs at MIR frequencies for all Pd-intercalations (insets in Figs. 5-7), the anisotropy of the optical response appears in an obvious fashion at low but it is quite negligible for the = 0.012 Pd-intercalation. There is a fair agreement with previously collected (unpolarised) data Pfuner et al. (2010); Hu et al. (2011), even though the overall magnitude is here sensibly lower. This might be due to some scattering because of not perfectly flat surfaces after the fresh-cleaving, which was performed prior to each measurement. This should not impede a trusty outcome of our analysis, since we are mainly interested to quantities representing either the optical anisotropy or the relative dependence, thus based on their ratio between both polarisations or on normalised ones with respect to 300 K for each axis (Figs. 1 to 3), respectively. We also note that these data as well as our earlier unpolarised ones in ErTe3 Pfuner et al. (2010) do not reveal a second deep in around 800 cm-1 at either (also true for Pd-intercalated compounds), in contrast to previous claims Hu et al. (2011). We tend to exclude major sample issues related to their growth procedure or their degradation but speculate that, if real, the resulting additional absorption feature in Ref. Hu et al., 2011, yet distinct from our low frequency shoulder at the MIR peak (see insets of Fig. 1 and below Figs. 9-11), might be overcast by the metallic contribution in our samples.
IV.1.4 Optical conductivity and integrated spectral weight
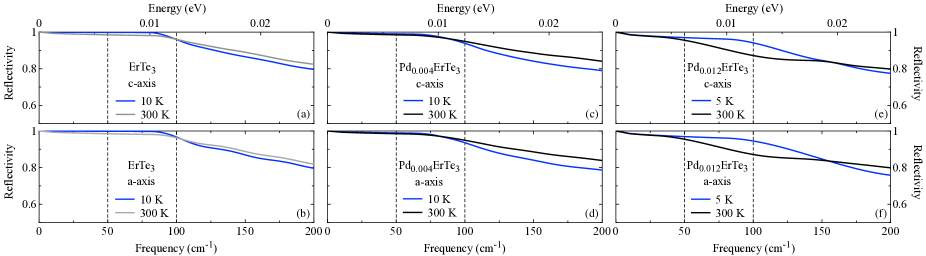
The real part () of the optical conductivity is then achieved via the Kramers-Kronig transformation of the measured . To this goal, appropriate extrapolations of are performed for and . Below the lowest measured frequency, the Hagen-Rubens (HR) relation for a metal is used. The values for the dc conductivity () satisfy the relative dependence of (Figs. 4(b-d)). The interpolation between the HR extrapolation and the measured data in FIR, performed within an energy interval between 50 and 100 cm-1, follows a standard, common procedure and allows to smoothly connect them, as shown explicitly in Fig. 8. Above the highest measured frequency is first assumed to be constant up to 7 eV and above is set to be consistent with the free-electron response () Dressel and Gruner (2002).
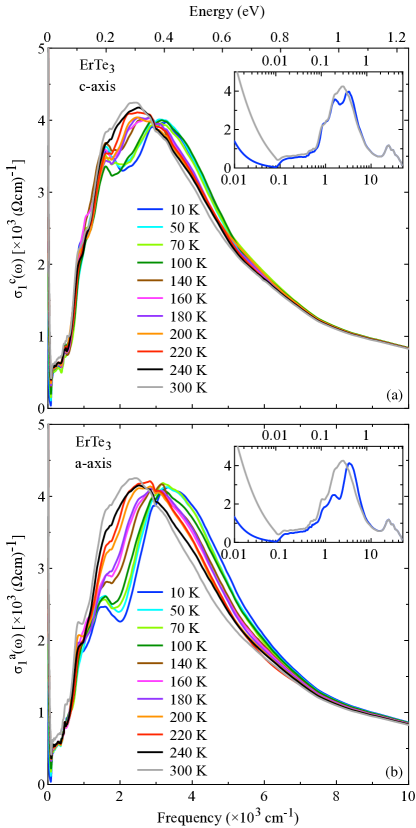
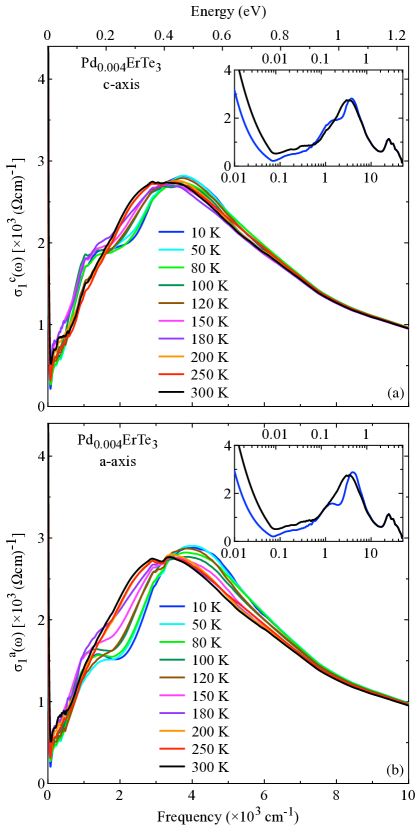
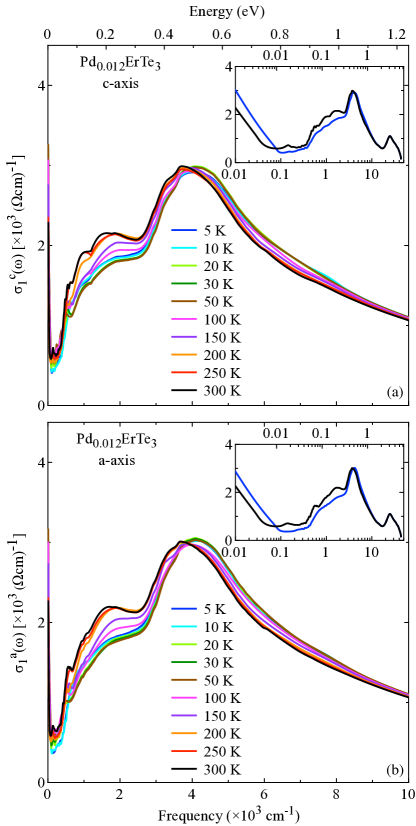
Figures 9-11 collect the derived dependence of the in-plane , highlighting the spectral range below 104 cm-1. The optical anisotropy between the and axes and its intercalation dependence as anticipated above for are equally reproduced in . As also shown in the corresponding insets, there are two relevant features in the spectra; a zero-energy mode, ascribed to the metallic Drude resonance, and a strong MIR absorption. The metallic component gets narrow with decreasing at low Pd-intercalations but broadens substantially for = 0.012 PdxErTe3. The Drude resonance and the MIR absorption are well distinct at all and may be also recognised in earlier work Pfuner et al. (2010); Hu et al. (2011), yet more blurred upon increasing . In fact, the MIR absorption was so far identified as a very broad feature at high , almost disappearing into the large high frequency Drude tail Pfuner et al. (2010). The peculiar dependence of the strong MIR absorption is then of interest. As emphasised by the main panels in Fig. 9, that MIR absorption in ErTe3 consists of a peak with a shoulder on its low frequency side at high , crossing over into two distinct peaks at low . Such a behaviour is still observable in the = 0.004 Pd-intercalation (Fig. 10), while the low frequency shoulder of the MIR peak for the = 0.012 Pd-intercalation remarkably broadens upon lowering (Fig. 11).
A quite central quantity in our discussion is the spectral weight () and its distribution SW . is generically defined through the direct integration of in chosen energy intervals between ( = 1 and 2) so that (i.e., expressed in units of cm-2 and with = 376.73 being the impedance of free space). This model-independent quantity is related to the number of the effective carriers (normalized by their effective mass) contributing to the optical processes within the integration limits and images the evolution of the electronic band structure upon varying . In the case = 0 and for the limit, the resulting integrated is expected to merge to a constant value at all T, satisfying the optical -sum rule Dressel and Gruner (2002). The integrated is here fully recovered at energy scales () above 104 cm-1 and its reshuffling mainly occurs at MIR frequencies at all . Before going any further, it is worth recalling, that if there is a transfer of from high to low energies, the ratio (i.e., K), shown in Fig. 3) will exceed 1 at low energies and then smoothly approach 1 upon increasing frequency until the full energy scale of the low-energy resonance is reached. For instance, may move into the metallic (Drude) zero-energy mode. If there is a transfer of from low to high energies though, the ratio will fall below 1 until the energy scale of the total transfer is accomplished. This latter case may suggest some erosion of the density-of-states and a FS-gapping, as it could step in by a reconstruction of the electronic band structure.
An alternative avenue is to focus on the anisotropy. Figure 12 indeed displays the ratio of the integrated spectral weight up to between the two relevant crystallographic axes, denoting an obvious deviation from the isotropic limit (i.e., 1). That anisotropy (shown at selected in Fig. 2) smoothly evolves with lowering but overall decreases in magnitude with Pd-intercalation. As evinced from other quantities (like e.g. ), the affected spectral range tends to shift towards low energy scales, concerning the FIR-MIR energy interval, upon Pd-intercalation. All that testifies an anisotropic electronic band structure across and below in coincidence with the CDW transitions.
IV.2 Phenomenological data analysis
We fit the dependence of the optical response using the phenomenological Drude-Lorentz approach, for which the dielectric function is given by Dressel and Gruner (2002):
| (1) |
is the optical dielectric constant, which turns out in our fits to be close to 1 for all PdxErTe3. In the second term, is the scattering rate and is the squared plasma frequency for the itinerant (Drude) carriers, with and as the carriers concentration and effective mass, respectively. equally defines the so-called Drude weight. In the third term, , and are the resonance frequency, width and strength, respectively, of the th Lorentz (Lj) harmonic oscillators (HO), which describe bound excitations. The square of their strength () corresponds to encountered in each Lj excitation. The use of the Drude and Lj-HOs is obviously an alternative approach to the direct integration of the measured quantity , as introduced above and elaborated in the main text. We will return however below to a comparison between the two methods, pointing then out their mutual consistency and complementarity.
The real part of the optical conductivity is specifically at the centre of our analysis, for which we seek a series of additive components being equivalent for all Pd-intercalations and for both polarisation directions. It turns out that a reliable fit covering the whole measured spectral range consists of one Drude term and six HOs. Figures 13, 14 and 15 display the dependence of the Drude as well as of the Lj-HOs parameters, while the panels of the right column in Figs. 16 and 17 visualise the fit components across the spectral range of interest along both the and axes. The same fit philosophy, which copies rather well with a previous analysis nonetheless for unpolarised data on ErTe3 Pfuner et al. (2010), allows a fairly precise reproduction of the spectra at any and polarisation directions for all Pd-intercalations, thus supporting a comprehensive and consequent discussion even beyond the intrinsic model-dependent nature of this phenomenological approach.
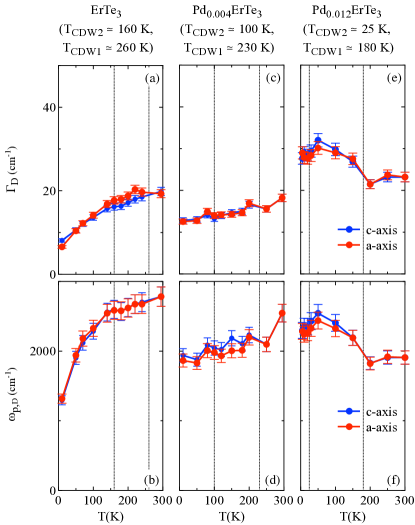
We first comment on the fit parameters of the Drude term. Both the = 0 and 0.004 Pd-intercalations display a monotonous decrease of the scattering rates and plasma frequencies with decreasing (Figs. 13(a-d)). The dependence of indicates a typical, effective metallic behaviour, while that of suggests an erosion of the metallic which gets quite pronounced for = 0 at low . These trends are again an indication for a progressively enhanced gapping of FS because of the CDW transitions (see an alternative elaboration around Fig. 3), similarly accompanied by a reduction of available scattering channels. Somehow opposite is the situation for the = 0.012 Pd-intercalation, since both Drude parameters increase upon lowering below prior being weakly depleted at the lowest measured below (Figs. 13(e,f)). Therefore, only at the lowest an effective but still partial gapping of FS and a modest switching-off of scattering channels can be optically mirrored as a consequence of the CDW transitions. Otherwise, disorder by Pd-intercalation seems here to dominate at between the two CDW transitions, with increasing scattering. This is then compensated by an increasing Drude plasma frequency for , denoting some enhancement of FS with more itinerant, yet less mobile charge carriers due to impurity bands. All in all, this may presage a nearly saturated dependence of for both in-plane axes besides the broad, humble anomaly below , as observed for instance in the = 0.019 composition (Fig. 4(d)). At this stage, it is worth warning the readership that it is admittedly challenging to perform a unique as well as fully reliable fit of the zero-energy resonance, since such an effective metallic component of is very narrow and at low even quite resolution-limited (i.e., almost fully beyond the measured experimental spectral range). Therefore, despite the fair qualitative agreement between the measured transport properties and their anisotropy and the calculated one from the Drude model, there is no pretension about any quantitative conclusions. However, as addressed below in terms of the encountered , the metallic spectral range in plays a marginal role with respect to the FIR-MIR energy interval.
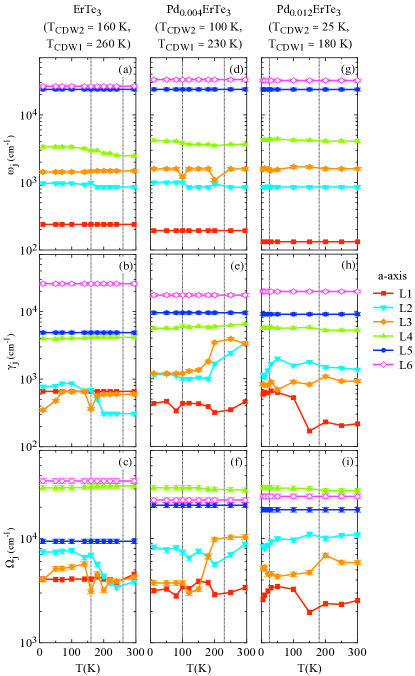
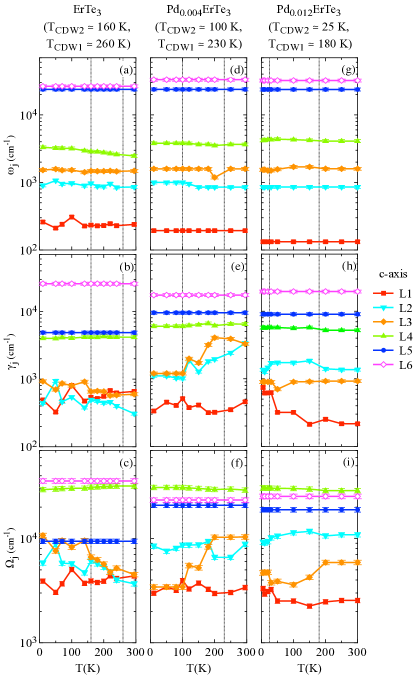
As far as the fit parameters of HOs are concerned, we remark an almost monotonous dependence, with some exceptions (Figs. 14 and 15): HOs L5 and L6 turn out to be fully independent and specifically HOs L1 to L3 show some abrupt or sudden changes in , particularly for their damping and strength, when crossing either CDW transitions. This means that the CDW transitions do not only affect the bands crossing and consequently the Drude fit parameters (Fig. 13) but also those bands deep into the electronic structure (i.e., far from ), suggesting its (intercalation-driven) remodelling. This is addressed next from the perspective of the redistribution.
Complementary to our analysis of the integrated in the main text, we can now single out the relevant spectral ranges harbouring the -dependent reshuffling. The fit components themselves, for which (Drude) and (Lorentz Lj-HO), identify the selected spectral ranges. We state the redistribution of as its relative change with respect to 300 K, i.e. (300 K) (Figs. 16 and 17 for the and axes, respectively). For the = 0 and 0.004 Pd-intercalations and along both axes (Figs. 16(a,c) and 17(a,c)), there is a weak depletion of upon lowering related to the Drude term (as anticipated above when presenting Figs. 13(b,d)) and its high frequency tail incorporated by HO L1 (i.e., Drude + L1 in Figs. 16(a,c) and 17(a,c) refers to ). The = 0.012 Pd-intercalation is though at variance. As already said in relation to Fig. 13(f) and for both axes, some very moderate first moves to the Drude term and its tail represented by HO L1 with decreasing but then below a renewed and weak suppression takes place at the metallic components. It is striking that the damping and partially the strength of HO L1 for the = 0.012 Pd-intercalation are steadily enhanced for , which could also mimic disorder-driven localisation effects of the itinerant charge carriers Huang et al. (2012), prior the onset of the CDW condensate at .
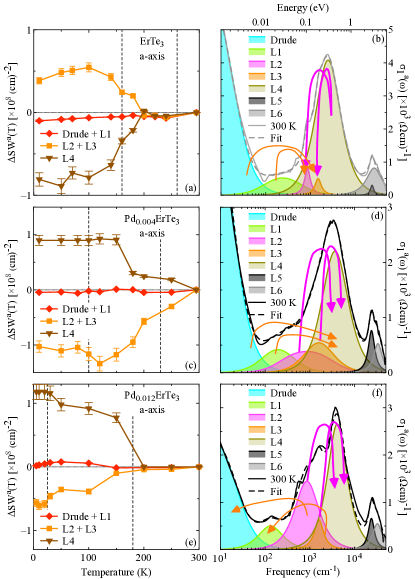

The moderate redistribution at low energy scales for all Pd-intercalations is accompanied by the stronger reshuffling pertinent to the spectral range covered by HOs L2 and L3 (i.e., L2 + L3 in Figs. 16(a,c,e) and 17(a,c,e) refers to ) as well as L4 (i.e., ), and being similar along both axes. For = 0, of HO L4 is removed and is then globally redistributed at low frequencies, accumulating into HOs L2 and L3 (Figs. 16(a) and 17(a)), when lowering . Exactly the reversed behaviour is observed for the = 0.004 and 0.012 Pd-intercalations (Figs. 16(c,e) and 17(c,e)). In fact, along both axes accumulates into HO L4 at the partial costs of in HOs L2 and L3 at low . Such trends upon lowering seem to be initially rather gradual with steady increase/depletion of upon crossing and lean to a saturation of below for all Pd-intercalations. Interestingly enough, for the = 0 and 0.004 Pd-intercalations the redistribution fully occurs within the indicated energy ranges related to each Lj-HOs and Drude term, since the involved total in the spectral range addressed here remains constant at any (i.e., 0, with running over each combinations of the grouped fit components in Figs. 16 and 17 for both the and axes). On the contrary, for the = 0.012 Pd-intercalation the reshuffling apparently does not guarantee its conservation at low within the discussed spectral ranges for both axes; we may speculate that additional should move with decreasing into the absorption described by HO L4 from excitations at higher energy scales and distributed over a large energy interval, eventually not accessible to our experiment.
Summarising, the rounded arrows in Figs. 16(b,d,f) and 17(b,d,f) pictorially highlight the direction and with increasing thickness catch a glimpse of the amount of the reshuffling upon decreasing . This representation features the overall equivalent redistribution for both axes at each Pd-intercalation. The metallic part (Drude) and its incoherent tail (HO L1) loose in favour of the low frequency shoulder (HOs L2 and L3) of the MIR peak for the = 0 and of the MIR peak itself (HO L4) for the = 0.004 Pd-intercalation with decreasing , respectively. On the other hand, that low frequency shoulder (HOs L2 and L3) also profits and gets additionally reinforced from of the MIR peak (HO L4) in = 0 but reversely looses towards the MIR peak for the = 0.004 Pd-intercalation upon lowering . For the = 0.012 Pd-intercalation, the low frequency shoulder (HOs L2 and L3) of the MIR peak experiences a diminishing at low towards the metallic part of as well as towards the MIR peak (HO L4), contributing to its reinforcement. However, the major reshuffling when crossing the CDW transitions for all Pd-intercalations effectively happens at and within the energy scales of the strong MIR peak in , widely associated with the spectral range of the CDW gap(s) and spanned by the combination of the phenomenological HOs L2 to L4. Intriguingly enough, the reallocation along both axes at low is towards the low frequency tail of the MIR peak (i.e., from HO L4 to HOs L2+L3) for the pristine materials, while it reinforces its high frequency absorption (i.e., from HOs L2+L3 to HO L4) as soon as Pd-intercalation takes place.
References
- Fradkin et al. (2015) Eduardo Fradkin, Steven A. Kivelson, and John M. Tranquada, “Colloquium: Theory of intertwined orders in high temperature superconductors,” Rev. Mod. Phys. 87, 457–482 (2015), and references therein.
- Anderson (1958) P. W. Anderson, “Absence of diffusion in certain random lattices,” Phys. Rev. 109, 1492–1505 (1958).
- Li et al. (2017) Lijun Li, Xiaoyu Deng, Zhen Wang, Yu Liu, Milinda Abeykoon, Eric Dooryhee, Aleksandra Tomic, Yanan Huang, John B. Warren, Emil S. Bozin, Simon J. L. Billinge, Yuping Sun, Yimei Zhu, Gabriel Kotliar, and Cedomir Petrovic, “Superconducting order from disorder in 2-TaSe2-xSx,” npj Quantum Materials 2, 11 (2017).
- Cho et al. (2018) Kyuil Cho, M. Kończykowski, S. Teknowijoyo, M. A. Tanatar, J. Guss, P. B. Gartin, J. M. Wilde, A. Kreyssig, R. J. McQueeney, A. I. Goldman, V. Mishra, P. J. Hirschfeld, and R. Prozorov, “Using controlled disorder to probe the interplay between charge order and superconductivity in NbSe2,” Nature Communications 9, 2796 (2018).
- Morosan et al. (2006) E. Morosan, H. W. Zandbergen, B. S. Dennis, J. W. G. Bos, Y. Onose, T. Klimczuk, A. P. Ramirez, N. P. Ong, and R. J. Cava, “Superconductivity in CuxTiSe2,” Nature Physics 2, 544–550 (2006).
- Qian et al. (2007) D. Qian, D. Hsieh, L. Wray, E. Morosan, N. L. Wang, Y. Xia, R. J. Cava, and M. Z. Hasan, “Emergence of Fermi pockets in a new excitonic charge-density-wave melted superconductor,” Phys. Rev. Lett. 98, 117007 (2007).
- Kogar et al. (2017) A. Kogar, G. A. de la Pena, Sangjun Lee, Y. Fang, S. X.-L. Sun, D. B. Lioi, G. Karapetrov, K. D. Finkelstein, J. P. C. Ruff, P. Abbamonte, and S. Rosenkranz, “Observation of a charge density wave incommensuration near the superconducting dome in CuxTiSe2,” Phys. Rev. Lett. 118, 027002 (2017).
- Straquadine et al. (2019) J. A. W. Straquadine, F. Weber, S. Rosenkranz, A. H. Said, and I. R. Fisher, “Suppression of charge density wave order by disorder in Pd-intercalated ErTe3,” Phys. Rev. B 99, 235138 (2019).
- Fang et al. (2019) Alan Fang, Joshua A. W. Straquadine, Ian R. Fisher, Steven A. Kivelson, and Aharon Kapitulnik, “Disorder-induced suppression of charge density wave order: STM study of Pd-intercalated ErTe3,” Phys. Rev. B 100, 235446 (2019).
- Huang et al. (2012) Y. Huang, B. F. Hu, T. Dong, A. F. Fang, P. Zheng, and N. L. Wang, “Effect of disorder in the charge-density-wave compounds LaTe1.95 and CeTe1.95-xSex ( and 0.16) as revealed by optical spectroscopy,” Phys. Rev. B 86, 205123 (2012).
- (11) For higher Pd concentrations, Te deficiencies might be present in PdxErTe3 Straquadine et al. (2019), though for smaller Pd-intercalations this is not clear and Te vacancies are hardly detected.
- DiMasi et al. (1995) E. DiMasi, M. C. Aronson, J. F. Mansfield, B. Foran, and S. Lee, “Chemical pressure and charge-density waves in rare-earth tritellurides,” Phys. Rev. B 52, 14516–14525 (1995).
- Ru et al. (2008a) N. Ru, J.-H. Chu, and I. R. Fisher, “Magnetic properties of the charge density wave compounds Te3 (, La, Ce, Pr, Nd, Sm, Gd, Tb, Dy, Ho, Er, and Tm),” Phys. Rev. B 78, 012410 (2008a).
- Ru et al. (2008b) N. Ru, C. L. Condron, G. Y. Margulis, K. Y. Shin, J. Laverock, S. B. Dugdale, M. F. Toney, and I. R. Fisher, “Effect of chemical pressure on the charge density wave transition in rare-earth tritellurides Te3,” Phys. Rev. B 77, 035114 (2008b).
- Fang et al. (2020) Alan Fang, Anisha G. Singh, Joshua A. W. Straquadine, Ian R. Fisher, Steven A. Kivelson, and Aharon Kapitulnik, “Robust superconductivity intertwined with charge density wave and disorder in Pd-intercalated ErTe3,” Phys. Rev. Res. 2, 043221 (2020).
- Walmsley and Fisher (2017) P. Walmsley and I. R. Fisher, “Determination of the resistivity anisotropy of orthorhombic materials via transverse resistivity measurements,” Review of Scientific Instruments 88, 043901 (2017).
- Dressel and Gruner (2002) Martin Dressel and George Gruner, Electrodynamics of Solids (Cambridge University Press, Cambridge, 2002).
- Kohn (1959) W. Kohn, “Image of the Fermi surface in the vibration spectrum of a metal,” Phys. Rev. Lett. 2, 393–394 (1959).
- Grüner (2000) George Grüner, Density Waves in Solids, Advanced book program: Addison-Wesley (Perseus Books Group, 2000).
- Eiter et al. (2013) Hans-Martin Eiter, Michela Lavagnini, Rudi Hackl, Elizabeth A. Nowadnick, Alexander F. Kemper, Thomas P. Devereaux, Jiun-Haw Chu, James G. Analytis, Ian R. Fisher, and Leonardo Degiorgi, “Alternative route to charge density wave formation in multiband systems,” Proceedings of the National Academy of Sciences 110, 64–69 (2013).
- Pfuner et al. (2010) F. Pfuner, P. Lerch, J.-H. Chu, H.-H. Kuo, I. R. Fisher, and L. Degiorgi, “Temperature dependence of the excitation spectrum in the charge-density-wave ErTe3 and HoTe3 systems,” Phys. Rev. B 81, 195110 (2010).
- Hu et al. (2011) B. F. Hu, B. Cheng, R. H. Yuan, T. Dong, A. F. Fang, W. T. Guo, Z. G. Chen, P. Zheng, Y. G. Shi, and N. L. Wang, “Optical study of the multiple charge-density-wave transitions in ErTe3,” Phys. Rev. B 84, 155132 (2011).
- Ru and Fisher (2006) N. Ru and I. R. Fisher, “Thermodynamic and transport properties of , , and ,” Phys. Rev. B 73, 033101 (2006).
- Hu et al. (2014) B. F. Hu, B. Cheng, R. H. Yuan, T. Dong, and N. L. Wang, “Coexistence and competition of multiple charge-density-wave orders in rare-earth tritellurides,” Phys. Rev. B 90, 085105 (2014).
- (25) The anisotropy is evinced from the resistivity data available in the literature Walmsley and Fisher (2017); Straquadine et al. (2019) and reproduced in Figs. 4(b-d) of Appendix for compositions coinciding or close enough to the Pd-intercalations investigated in this work.
- (26) The spectral weight () of the optical conductivity corresponds to its integral , expressed in units of cm-2 ( = 376.73 , being the impedance of free space) Dressel and Gruner (2002). is the cut-off energy. See Appendix for further details.
- Ong and Monceau (1977) N. P. Ong and Pierre Monceau, “Anomalous transport properties of a linear-chain metal: Nb,” Phys. Rev. B 16, 3443–3455 (1977).
- (28) The estimation of the FS-gapping from is calculated with the formula , where is the conductivity at its anomaly minimum at (i.e., is the temperature at which incidentally displays the bump-like maximum) and is its expected ’normal’ value without anomaly at the same , simply obtained from a linear interpolation of (Figs. 4(b-d) in Appendix and Ref. Straquadine et al., 2019) between temperatures just above and well below it Ong and Monceau (1977).
- Corasaniti et al. (2019) M. Corasaniti, R. Yang, A. Pal, M. Chinotti, L. Degiorgi, A. Wang, and C. Petrovic, “Fermi surface gapping in the Dirac material ,” Phys. Rev. B 100, 041107(R) (2019).
- Chinotti et al. (2018) M. Chinotti, J. Ethiraj, C. Mirri, Xiangde Zhu, Lijun Li, C. Petrovic, and L. Degiorgi, “Impact of the charge density wave state in the electrodynamic response of : Optical evidence for a pseudogap phase,” Phys. Rev. B 97, 045117 (2018).
- Zhu et al. (2016) Xiangde Zhu, Wei Ning, Lijun Li, Langsheng Ling, Ranran Zhang, Jinglei Zhang, Kefeng Wang, Yu Liu, Li Pi, Yongchang Ma, Haifeng Du, Minglian Tian, Yuping Sun, Cedomir Petrovic, and Yuheng Zhang, “Superconductivity and charge density wave in ,” Scientific Reports 6, 26974 (2016).
- Schwartz et al. (1995) A. Schwartz, M. Dressel, B. Alavi, A. Blank, S. Dubois, G. Grüner, B. P. Gorshunov, A. A. Volkov, G. V. Kozlov, S. Thieme, L. Degiorgi, and F. Lévy, “Fluctuation effects on the electrodynamics of quasi-one-dimensional conductors above the charge-density-wave transition,” Phys. Rev. B 52, 5643–5652 (1995).
- Perucchi et al. (2004) A. Perucchi, L. Degiorgi, and R. E. Thorne, “Optical investigation of the charge-density-wave phase transitions in ,” Phys. Rev. B 69, 195114 (2004).
- Lee et al. (1973) P. A. Lee, T. M. Rice, and P. W. Anderson, “Fluctuation effects at a Peierls transition,” Phys. Rev. Lett. 31, 462–465 (1973).
- Kohn (1967) W. Kohn, “Excitonic phases,” Phys. Rev. Lett. 19, 439–442 (1967).
- Kidd et al. (2002) T. E. Kidd, T. Miller, M. Y. Chou, and T.-C. Chiang, “Electron-hole coupling and the charge density wave transition in ,” Phys. Rev. Lett. 88, 226402 (2002).
- Li et al. (2007) G. Li, W. Z. Hu, D. Qian, D. Hsieh, M. Z. Hasan, E. Morosan, R. J. Cava, and N. L. Wang, “Semimetal-to-semimetal charge density wave transition in ,” Phys. Rev. Lett. 99, 027404 (2007).
- Moore et al. (2010) R. G. Moore, V. Brouet, R. He, D. H. Lu, N. Ru, J.-H. Chu, I. R. Fisher, and Z.-X. Shen, “Fermi surface evolution across multiple charge density wave transitions in ,” Phys. Rev. B 81, 073102 (2010).
- Kasahara et al. (2012) S. Kasahara, H. J. Shi, K. Hashimoto, S. Tonegawa, Y. Mizukami, T. Shibauchi, K. Sugimoto, T. Fukuda, T. Terashima, Andriy H. Nevidomskyy, and Y. Matsuda, “Electronic nematicity above the structural and superconducting transition in BaFe2(As1-xPx)2,” Nature 486, 382–385 (2012).
- Nie et al. (2022) Linpeng Nie, Kuanglv Sun, Wanru Ma, Dianwu Song, Lixuan Zheng, Zuowei Liang, Ping Wu, Fanghang Yu, Jian Li, Min Shan, Dan Zhao, Shunjiao Li, Baolei Kang, Zhimian Wu, Yanbing Zhou, Kai Liu, Ziji Xiang, Jianjun Ying, Zhenyu Wang, Tao Wu, and Xianhui Chen, “Charge-density-wave-driven electronic nematicity in a Kagome superconductor,” Nature 604, 59–64 (2022).
- Zheng et al. (2022) Lixuan Zheng, Zhimian Wu, Ye Yang, Linpeng Nie, Min Shan, Kuanglv Sun, Dianwu Song, Fanghang Yu, Jian Li, Dan Zhao, Shunjiao Li, Baolei Kang, Yanbing Zhou, Kai Liu, Ziji Xiang, Jianjun Ying, Zhenyu Wang, Tao Wu, and Xianhui Chen, “Emergent charge order in pressurized Kagome superconductor CsV3Sb5,” Nature 611, 682–687 (2022).