22email: {santosh.sanjeev,salwa.khatib,mai.kassem,ibrahim.almakky,
mohammad.yaqub}@mbzuai.ac.ae, vpapineni@ssmc.ae
PECon: Contrastive Pretraining to Enhance Feature Alignment between CT and EHR Data for Improved Pulmonary Embolism Diagnosis
Abstract
Previous deep learning efforts have focused on improving the performance of Pulmonary Embolism (PE) diagnosis from Computed Tomography (CT) scans using Convolutional Neural Networks (CNN). However, the features from CT scans alone are not always sufficient for the diagnosis of PE. CT scans along with electronic heath records (EHR) can provide a better insight into the patient’s condition and can lead to more accurate PE diagnosis. In this paper, we propose Pulmonary Embolism Detection using Contrastive Learning (PECon), a supervised contrastive pretraining strategy that employs both the patient’s CT scans as well as the EHR data, aiming to enhance the alignment of feature representations between the two modalities and leverage information to improve the PE diagnosis. In order to achieve this, we make use of the class labels and pull the sample features of the same class together, while pushing away those of the other class. Results show that the proposed work outperforms the existing techniques and achieves state-of-the-art performance on the RadFusion dataset with an F1-score of 0.913, accuracy of 0.90 and an AUROC of 0.943. Furthermore, we also explore the explainability of our approach in comparison to other methods. Our code is publicly available at https://github.com/BioMedIA-MBZUAI/PECon.
Keywords:
Contrastive learning Multimodal data Pulmonary Embolism CT scans.1 Introduction
Pulmonary Embolism (PE) is an acute cardiovascular disorder considered the third most common cause of cardiovascular death after coronary artery disease and stroke. Despite advances in diagnosis and treatment over the past years, PE has high early mortality rates [1], with nearly to deaths in the US each year [2]. Unfortunately, individuals diagnosed with PE frequently encounter a long delay before receiving a diagnosis, and approximately of patients are initially misdiagnosed [3, 4]. Hence, it is crucial to provide radiologists and clinicians with tools that can help them with the diagnosis.
Prior to deep learning, many efforts focused on using traditional feature extraction methods for PE diagnosis from Computed Tomography (CT) scans [5, 6]. However, more recently research efforts have investigated improving the performance of PE diagnosis using deep Convolutional Neural Networks (CNNs) [7, 8] and attention mechanisms [9]. More specifically, PENet [10] was introduced as a 3D CNN designed to detect PE using multiple CT slices. Such use of 3D convolutions allows the network to consider information from multiple slices when making predictions, which is important for diagnosing PE, as its presence is not limited to a single CT slice.
Features from CT scans alone could be insufficient for PE diagnosis. Therefore, CT scans along with the patient’s Electronic Health Records (EHR) data can provide a better insight into the patient’s condition and can help improve the diagnosis of PE. Previous studies have shown improved performance when combining demographic and clinical data with medical imaging data for various medical conditions such as Alzheimer’s disease and skin cancer [11, 12]. However, multimodal fusion is a non-trivial task, which can have varying results based on the fusion approach. Therefore, Huang et al. [13] compared different multimodal fusion approaches that combine inputs from both CT scans and EHR data to diagnose the presence of PE and explore optimal data selection and fusion strategies. Their results show that multimodal end-to-end deep learning models combining imaging and EHR provide better discrimination of abnormalities than using either modality independently. To this effect, Zhou et al. [14] released RadFusion, a multimodal dataset containing both EHR data and high-resolution CT scans labeled for PE. They assess the fairness properties across different subgroups and results suggest that integrating EHR data with medical images can improve classification performance and robustness without introducing large disparities between population groups.
Contrastive learning has been previously employed in medical imaging. Recently, Zhang et al. [15] made use of available pairs of images and text usually in medical contexts, and proposed Contrastive VIsual Representation Learning from Text (ConVIRT) [15]. The approach involves pretraining medical image encoders with paired text via a bidirectional contrastive objective. Nevertheless, their text encoder employs a general-purpose lexicon, resulting in issues with unknown words when processing a medical text. Although the division of terms into word pieces helps alleviate this problem, it results in the fragmentation of common biomedical terminology, leading to suboptimal results [16, 17]. Furthermore, [18] has shown that constrastive learning between two images (same modality) in a fully-supervised setting can outperform the self-supervised contrastive pretraining by leveraging the label information. In this paper, we propose Pulmonary Embolism Detection using Contrastive Learning (PECon), a novel fully supervised contrastive pretraining framework between 3D CT scans and EHR data. PECon uses a supervised contrastive learning objective to train a neural network to encode CT scans and EHR into a joint embedding space. In this space, we establish cross-modal alignment, through a fully supervised contrastive (SC) pretraining aiming to maximise the feature alignment between CT and EHR data. To the best of our knowledge we are the first to introduce a SC pretraining using different modalities (EHR,CT) in medical domain to maximize alignment between the feature representations. Unlike [18], which uses augmentations to get 2 views of the same image(single modality), we use CT and EHR as 2 views(multimodal) of the same patient. We demonstrate the effectiveness of our approach on a real-world dataset of PE patients, where we show that our pretrained model significantly outperforms state-of-the-art baselines. The main contributions of this work can be summarized as follows:
-
•
We propose a supervised contrastive pretraining method that better aligns the image and EHR embeddings thereby achieving enhanced alignment between the features of both modalities.
-
•
We demonstrate how the proposed method enhances the performance of multimodal PE detection and achieves state-of-the-art results on the RadFusion [14] dataset.
2 Methodology
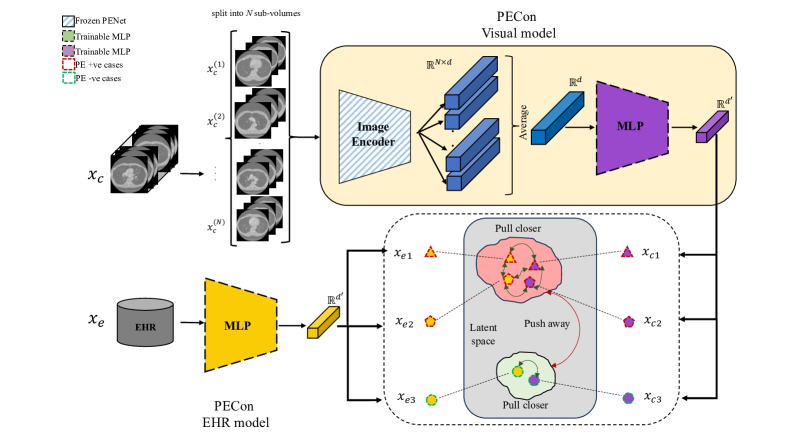
In this section, we discuss the details of PECon, the proposed pretraining method illustrated in Fig. 1, and the fine-tuning stage that follows. The pretraining stage involves a supervised contrastive learning step, where, for each anchor feature extracted from a CT scan volume or an EHR record, all other features having the same label as this feature in the batch are pulled to it, and all those having the opposite label are pushed away. As such, given a pair of a CT scan and corresponding EHR data belonging to the same patient, our goal is to learn a function that uses this paired input to approximate , the ground truth PE diagnosis of patient. We set a pre-text task whose objective is to learn an image projection head and an EHR projection head that respectively map and to -dimensional vectors . More precisely, projection head takes as input a -dimensional embedding, which is the result of averaging -dimensional embeddings from an image encoder. The image encoder is used to generate a -dimensional embedding for each of the sub-volumes belonging to a single CT scan (, , .. , as shown in Fig. 1). For a given input batch of data, [18] applies data augmentation twice and obtains two copies of the batch. Alternatively, in PECon, considering a batch containing pairs of , the training objective of PECon is a supervised contrastive loss with the following expression:
| (1) |
where is the set of all features extracted from and samples in the batch distinct from feature , is the set of features within the batch having the same ground truth label as feature , is the set cardinality, and is a temperature parameter.
The visual projection head and the EHR projection head are then separately fine-tuned for classification by minimizing the cross-entropy loss. For this, the multimodal prediction is given by:
| (2) |
where is a modality weighting hyper-parameter , which can be used to set the influence each modality model will have on the overall multimodal classification.
3 Experimental Setup
3.1 Dataset
In this work, we use the RadFusion dataset [14], which consists of both CT scans and EHR data of the patients with and without PE. It consists of axial CTPA exams from patients captured with spacing. The number of negative PE cases is , while the number of positive PE cases is . The EHR data consists of demographic features, vitals such as systolic and diastolic blood pressure, body temperature, unique inpatient and outpatient medications, unique diagnosis groupings, and laboratory tests of around categories. This information is represented with a binary presence/absence as well as the latest value of the test. EHR in the dataset is structured (categorical, numerical) without text. PE cases are mainly of 3 types: central, segmental and subsegmental based on the location of PE within the arterial branches. The number of cases of central, segmental and subsegmental PE are 257, 387 and 52 respectively. For a fair comparison, we followed the standard split of Radfusion[14] which was, training, validation, and testing splits of , , respectively. The scans are normalised between and the EHR data is normalised between .
3.2 Implementation Details
Pretraining stage. Pretraining is carried out in an end-to-end fashion with an SGD optimizer, using an initial learning rate (LR) of , , a batch size of , and for epochs on a single NVIDIA RTX A6000 GPU. We select the weights of the epoch with the lowest validation loss for later fine-tuning. As for data augmentation, the 3D scans are randomly (1) cropped along their widths and heights to , (2) jittered up to 8 slices along the depth axis, and (3) rotated up to , as is done in [10]. The image encoder architecture we adopt is PeNet [10]. The PENet we use is an end to end 3D CNN model consisting of 4 encoder blocks primarily constructed from 3D convolutions with skip connections and squeeze-and-excitation blocks. The PENet backbone is initialized with weights trained on RadFusion, pretrained on Kinetics dataset [19] and it remains frozen during the pretraining. Input to the PENet models are subvolumes consisting of slices, where PENet outputs a vector for each subvolume. The feature vector input to the visual projection head is an average of the embeddings generated for each subvolume. The image projection head is an MLP consisting of hidden layers with and neurons respectively outputting a feature vector of size . Similarly, the EHR projection head consists of hidden layer with neurons. Image size and number of slices were chosen based on the PENet[10], which provided the best results and allowed for a fair comparison. The modality weighting parameter was selected empirically by testing with different values and choosing the best performing on validation set. We explored different embedding sizes (128,256,512) with performance stagnation after 128. Similarly other hyper-parameters have been experimentally selected. Fine-tuning stage. In the fine-tuning stage, the visual projection head and the EHR projection head are separately fine-tuned on the RadFusion dataset. The imaging model is fine-tuned for epochs with an SGD optimizer, using a LR of and a stepLR scheduler with a step size of 20. The EHR model is fine-tuned for epochs using SGD optimizer with a LR of and a stepLR scheduler with a step size of 10. We report results for a of and the ablation is shown in the Supplementary.
4 Results and Discussion
| Modality |
|
Models | Accuracy | F1 score | AUROC | ||
|---|---|---|---|---|---|---|---|
| CT | PENet [10] | 0.689 | 0.677 | 0.796 | |||
| PECon Visual model | 0.726 | 0.752 | 0.775 | ||||
| EHR | ElasticNet [14] | 0.837 | 0.850 | 0.922 | |||
| PECon EHR model | 0.858 | 0.872 | 0.922 | ||||
| Multimodal | Radfusion [14] | 0.890 | 0.902 | 0.946 | |||
| PECon Multimodal | 0.900 | 0.913 | 0.943 | ||||
| CT | PENet [10] | 0.759 | 0.735 | 0.842 | |||
| PECon Visual model | 0.759 | 0.766 | 0.817 | ||||
| EHR | ElasticNet [14] | 0.877 | 0.877 | 0.932 | |||
| PECon EHR model | 0.883 | 0.883 | 0.930 | ||||
| Multimodal | Radfusion [14] | 0.895 | 0.895 | 0.962 | |||
| PECon Multimodal | 0.914 | 0.918 | 0.961 |
We consistently use the RadFusion test set to evaluate our approach and compare it with existing approaches. Table 1 compares the performance of our approach with the benchmark models. We observe that PECon achieves state-of-the-art performance on CT, EHR, as well as the multimodal setting. The boost in multimodal performance demonstrates the effectiveness of the approach in improving class separability in the latent space. Further, the improvement on the individual modalities shows a good separation even at the modality level, where samples belonging to the same class are pulled together and samples belonging to different classes are pushed apart. Although, we observe a small dip in the AUROC score in the visual and multimodal settings, our focus is on the F1-score as it provides a better measure of performance considering the slight class imbalance. Due to the questionable clinical value of subsegmental PE [20], we evaluate and compare the results with the benchmark models including and excluding subsegmental PE from the test set. We observe similar performance gains when including or excluding the subsegmental cases from the test set. However, excluding subsegmental cases from the training data for PECon during both pretraining and fine-tuning stages results in the best performance. We test the effect of excluding the sub-segmental cases in either the pretraining or the fine-tuning stages, while still including them in the evaluation. Results in Table 2 show that excluding samples from both stages achieves the best results.
| Pre-training | Finetuning | Accuracy | F1 score | AUROC |
|---|---|---|---|---|
| 0.889 | 0.905 | 0.931 | ||
| 0.878 | 0.893 | 0.941 | ||
| 0.873 | 0.887 | 0.920 | ||
| 0.900 | 0.913 | 0.943 |
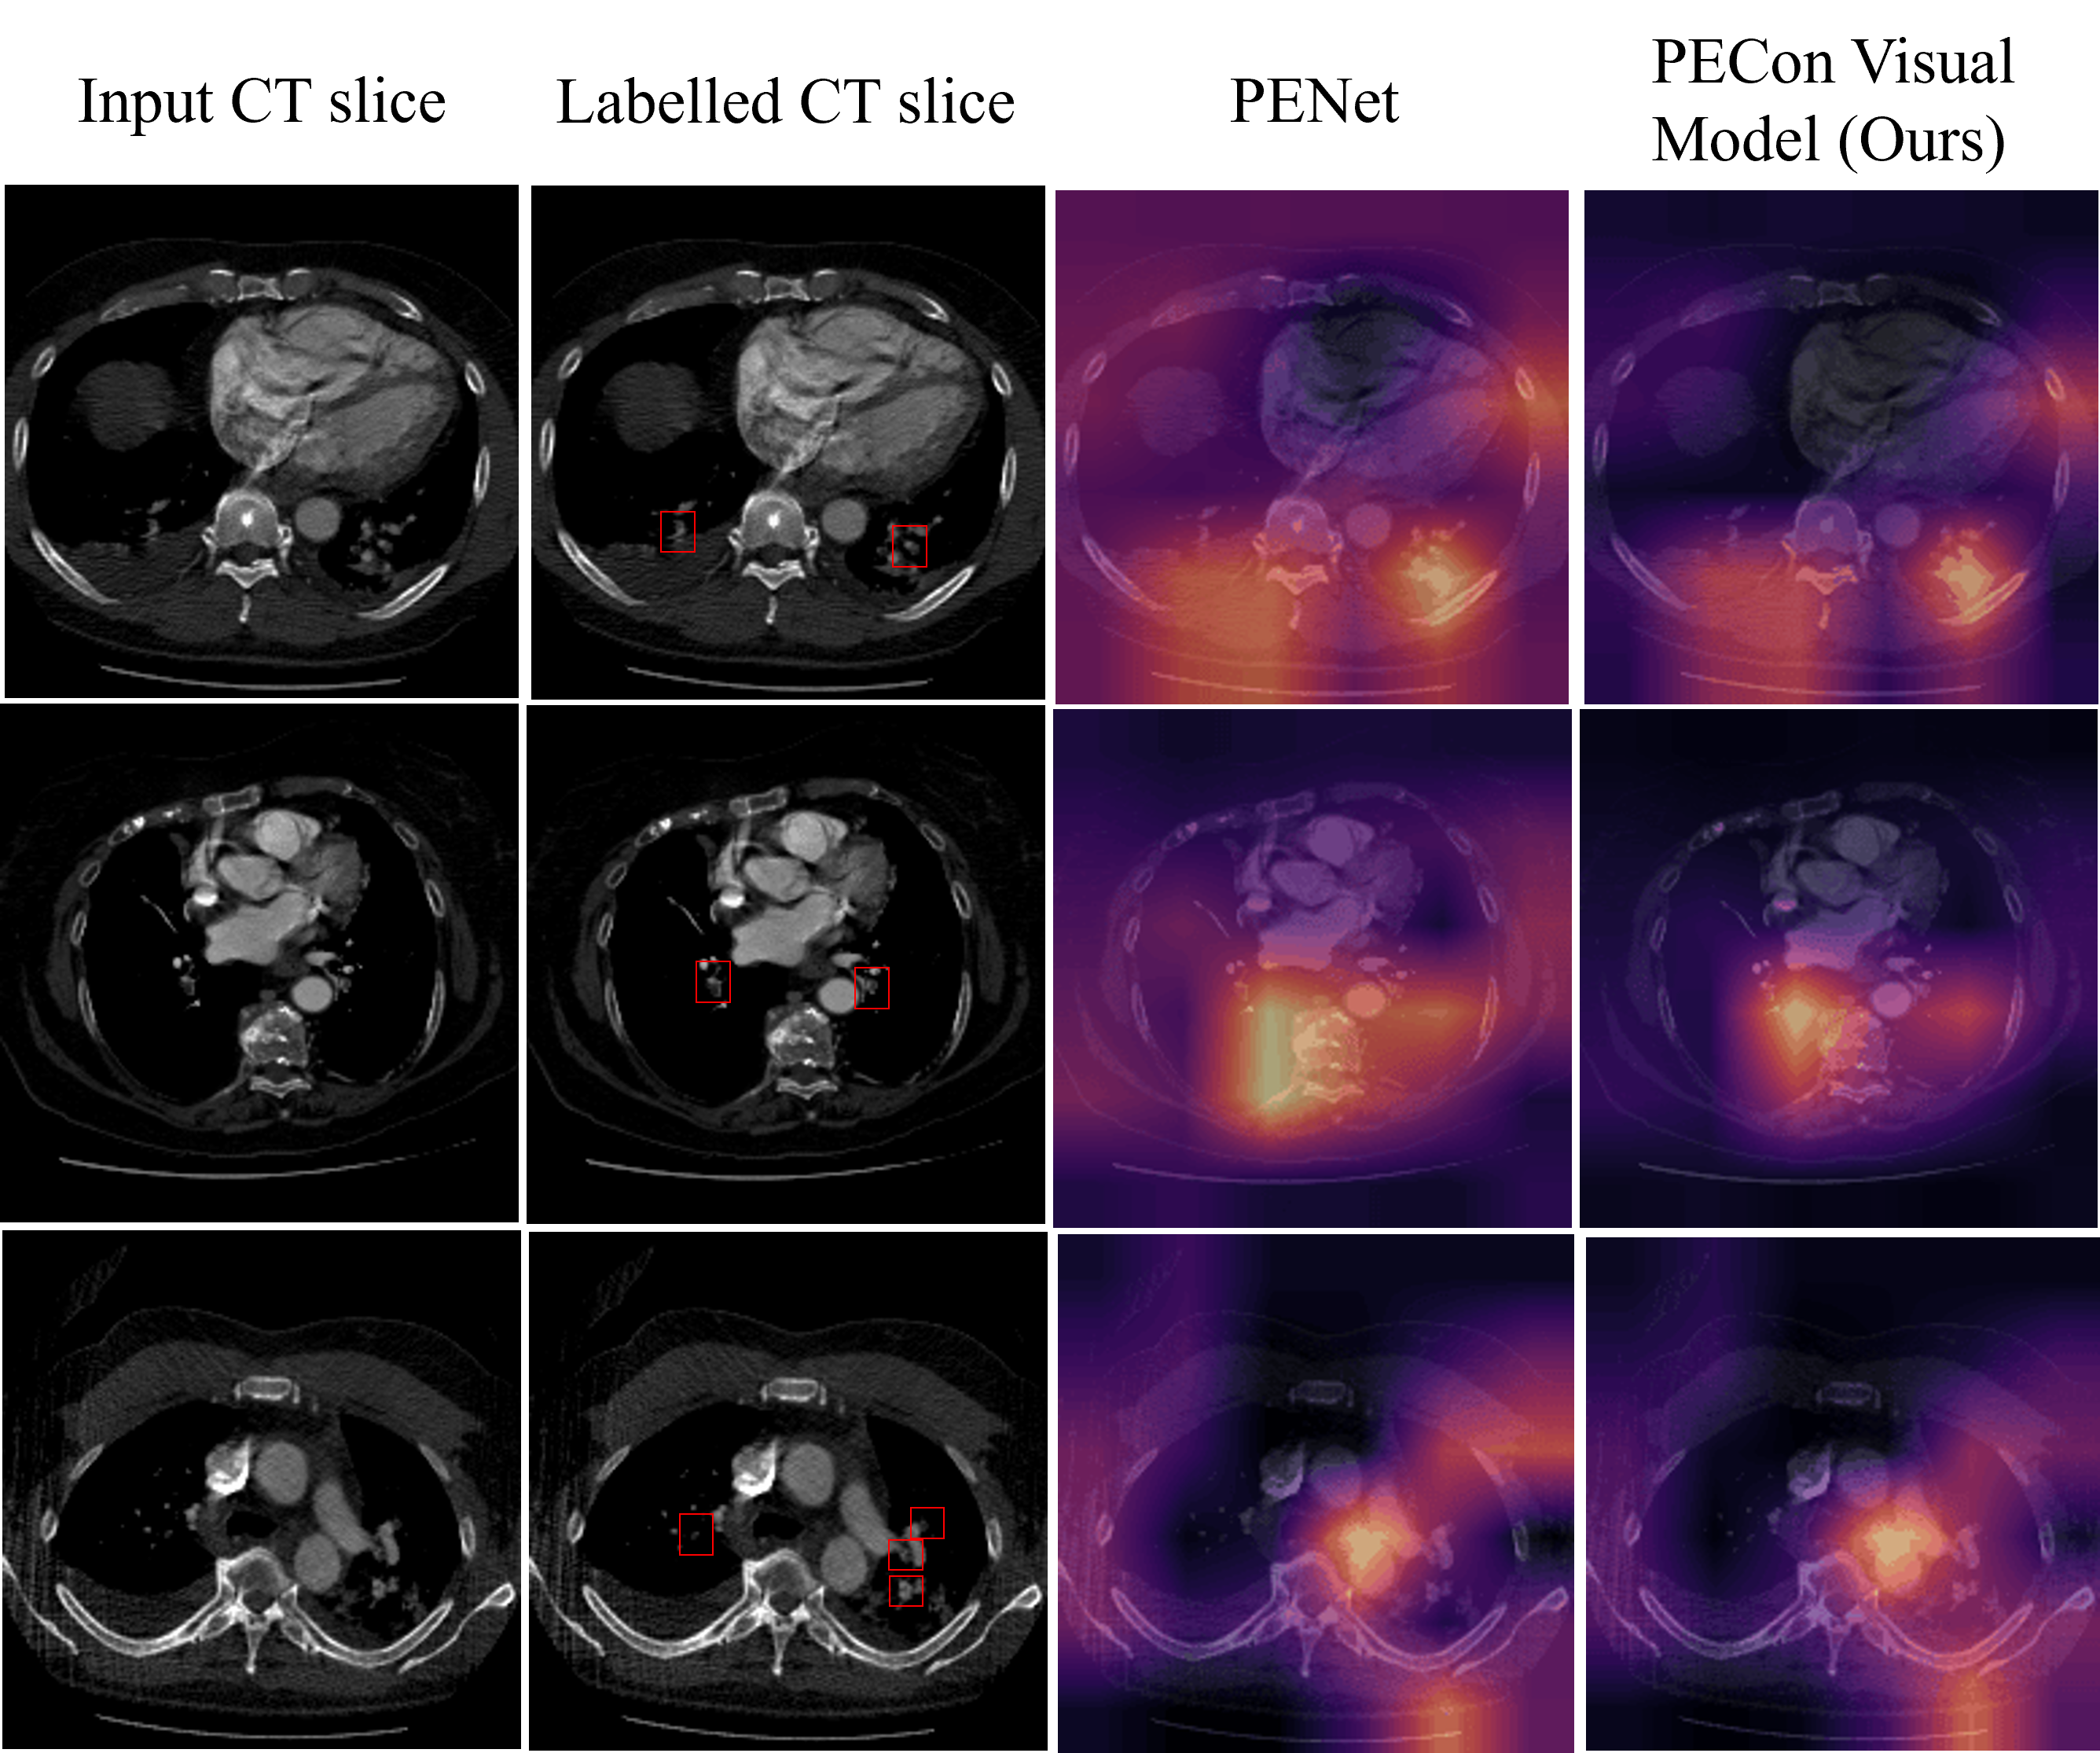
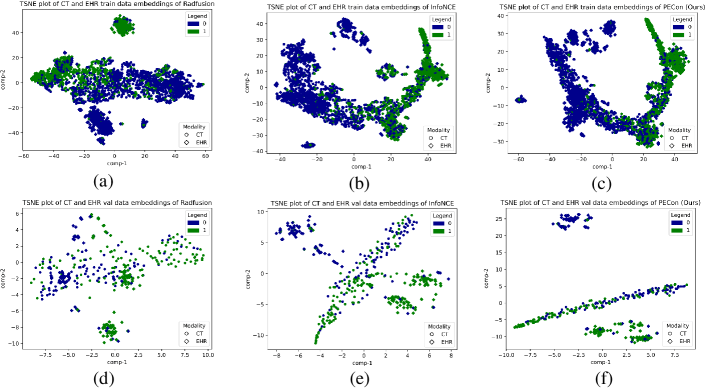
In Figure 2, we visualize and compare the TSNE plots of Radfusion and PECon (Ours) for the train and validation sets. We also visualize results of PECon with InfoNCE [21]. We observe that pretraining using a contrastive loss enhances the feature alignment between CT scan and EHR features, thereby making the data more separable and forming clusters. On the other hand, the RadFusion train and validation do not have a good separation. Furthermore, the use of supervision in PECon pulled together sample features of the same class while pushing away the features of different classes. This is lacking in the case of InfoNCE since it is a fully self-supervised method that is agnostic to the class labels of the features. To enhance the explainability of our approach, we use Grad-CAM [22] to visualize class activation maps of three CT slices pertaining to positive scans from the RadFusion dataset using PENet and PECon in Figure 3. In the case of PENet, some attention is put on irrelevant regions around the lungs, whereas PECon imaging model consistently demonstrates better and more precise localization of the PE. This shows that combining the two modalities using our approach enables the visual model to learn more precise features from the input volumes. We further compare our pretraining stage with other contrastive learning methods. Results in Table 3 show that PECon achieves better performance. This demonstrates that the inclusion of supervision with contrastive learning is more effective for PE classification compared to self-supervised pretraining methods. The hyper-parameters for each method are reported in the Supplementary.
5 Conclusion and Future Work
In this work, we present (PECon), a supervised contrastive pretraining framework for multimodal prediction of PE to enhance the alignment between the CT and EHR latent representations. To accomplish this, we start from an anchor feature extracted from CT scans and EHR data and pull features from the same class to it and push away those from the other class. We trained and validated our approach on the RadFusion dataset, and report state-of-the-art results. Additionally, we show that our model attends to more precise and localized regions in the CT scans through class activation maps.
The limitations of this work include testing on other datasets to assess the generalizability of our approach. Furthermore, our study was limited to the impact of the contrastive pretraining loss on the late fusion multimodal approach, where in the future it would be important to study this impact on early and joint fusion approaches. Further, attention techniques will be explored for feature aggregation.
References
- [1] Bělohlávek, J., Dytrych, V., Linhart, A.: Pulmonary embolism, part i: Epidemiology, risk factors and risk stratification, pathophysiology, clinical presentation, diagnosis and nonthrombotic pulmonary embolism. Experimental and clinical cardiology 18 2, 129–38 (2013)
- [2] Tarbox, A., Swaroop, M.: Pulmonary embolism. International Journal of Critical Illness and Injury Science 3(1), 69–72 (2013). https://doi.org/10.4103/2229-5151.109427, https://www.ijciis.org/text.asp?2013/3/1/69/109427
- [3] Hendriksen, J.M.T., Koster-van Ree, M., Morgenstern, M.J., Oudega, R., Schutgens, R.E.G., Moons, K.G.M., Geersing, G.J.: Clinical characteristics associated with diagnostic delay of pulmonary embolism in primary care: a retrospective observational study. BMJ open 7(3), e012789 (mar 2017). https://doi.org/10.1136/bmjopen-2016-012789
- [4] Alonso-Martínez, J.L., Sánchez, F.J., Echezarreta, M.A.: Delay and misdiagnosis in sub-massive and non-massive acute pulmonary embolism. European journal of internal medicine 21, 278–282 (8 2010). https://doi.org/10.1016/J.EJIM.2010.04.005, https://pubmed.ncbi.nlm.nih.gov/20603035/
- [5] Masutani, Y., MacMahon, H., Doi, K.: Computerized detection of pulmonary embolism in spiral ct angiography based on volumetric image analysis. IEEE Transactions on Medical Imaging 21(12), 1517–1523 (2002). https://doi.org/10.1109/TMI.2002.806586
- [6] Liang, J., Bi, J.: Computer aided detection of pulmonary embolism with tobogganing and mutiple instance classification in ct pulmonary angiography. In: Karssemeijer, N., Lelieveldt, B. (eds.) Information Processing in Medical Imaging. pp. 630–641. Springer Berlin Heidelberg, Berlin, Heidelberg (2007)
- [7] Lin, Y., Su, J., Wang, X., Li, X., Liu, J., Cheng, K.T., Yang, X.: Automated pulmonary embolism detection from ctpa images using an end-to-end convolutional neural network. In: Shen, D., Liu, T., Peters, T.M., Staib, L.H., Essert, C., Zhou, S., Yap, P.T., Khan, A. (eds.) Medical Image Computing and Computer Assisted Intervention – MICCAI 2019. pp. 280–288. Springer International Publishing, Cham (2019)
- [8] Khachnaoui, H., Agrébi, M., Halouani, S., Khlifa, N.: Deep learning for automatic pulmonary embolism identification using cta images. In: 2022 6th International Conference on Advanced Technologies for Signal and Image Processing (ATSIP). pp. 1–6 (2022). https://doi.org/10.1109/ATSIP55956.2022.9805929
- [9] Suman, S., Singh, G., Sakla, N., Gattu, R., Green, J., Phatak, T., Samaras, D., Prasanna, P.: Attention based cnn-lstm network for pulmonary embolism prediction on chest computed tomography pulmonary angiograms (2021). https://doi.org/10.48550/ARXIV.2107.06276, https://arxiv.org/abs/2107.06276
- [10] Huang, S.C., Kothari, T., Banerjee, I., Chute, C., Ball, R., Borus, N., Huang, A., Patel, B., Rajpurkar, P., Irvin, J., Dunnmon, J., Bledsoe, J., Shpanskaya, K., Dhaliwal, A., Zamanian, R., Ng, A., Lungren, M.: Penet–a scalable deep-learning model for automated diagnosis of pulmonary embolism using volumetric ct imaging. npj Digital Medicine 3 (12 2020). https://doi.org/10.1038/s41746-020-0266-y
- [11] Li, H., Fan, Y.: EARLY PREDICTION OF ALZHEIMER’S DISEASE DEMENTIA BASED ON BASELINE HIPPOCAMPAL MRI AND 1-YEAR FOLLOW-UP COGNITIVE MEASURES USING DEEP RECURRENT NEURAL NETWORKS. Proceedings. IEEE International Symposium on Biomedical Imaging 2019, 368–371 (apr 2019). https://doi.org/10.1109/ISBI.2019.8759397
- [12] Kawahara, J., Daneshvar, S., Argenziano, G., Hamarneh, G.: Seven-Point Checklist and Skin Lesion Classification Using Multitask Multimodal Neural Nets. IEEE Journal of Biomedical and Health Informatics 23(2), 538–546 (2019). https://doi.org/10.1109/JBHI.2018.2824327
- [13] Huang, S.C., Pareek, A., Zamanian, R., Banerjee, I., Lungren, M.P.: Multimodal fusion with deep neural networks for leveraging ct imaging and electronic health record: a case-study in pulmonary embolism detection. Scientific reports 10(1), 1–9 (2020)
- [14] Zhou, Y., Huang, S.C., Fries, J.A., Youssef, A., Amrhein, T.J., Chang, M., Banerjee, I., Rubin, D., Xing, L., Shah, N., Lungren, M.P.: Radfusion: Benchmarking performance and fairness for multimodal pulmonary embolism detection from ct and ehr (2021). https://doi.org/10.48550/ARXIV.2111.11665, https://arxiv.org/abs/2111.11665
- [15] Zhang, Y., Jiang, H., Miura, Y., Manning, C.D., Langlotz, C.P.: Contrastive learning of medical visual representations from paired images and text. In: Machine Learning for Healthcare Conference. pp. 2–25. PMLR (2022)
- [16] Zhang, S., Xu, Y., Usuyama, N., Bagga, J., Tinn, R., Preston, S., Rao, R., Wei, M., Valluri, N., Wong, C., et al.: Large-scale domain-specific pretraining for biomedical vision-language processing. arXiv preprint arXiv:2303.00915 (2023)
- [17] Gu, Y., Tinn, R., Cheng, H., Lucas, M., Usuyama, N., Liu, X., Naumann, T., Gao, J., Poon, H.: Domain-specific language model pretraining for biomedical natural language processing. ACM Transactions on Computing for Healthcare (HEALTH) 3(1), 1–23 (2021)
- [18] Khosla, P., Teterwak, P., Wang, C., Sarna, A., Tian, Y., Isola, P., Maschinot, A., Liu, C., Krishnan, D.: Supervised contrastive learning. Advances in neural information processing systems 33, 18661–18673 (2020)
- [19] Carreira, J., Noland, E., Banki-Horvath, A., Hillier, C., Zisserman, A.: A short note about kinetics-600 (2018). https://doi.org/10.48550/ARXIV.1808.01340, https://arxiv.org/abs/1808.01340
- [20] Albrecht, M.H., Bickford, M.W., Nance, Jr., J.W., Zhang, L., De Cecco, C.N., Wichmann, J.L., Vogl, T.J., Schoepf, U.J.: State-of-the-Art Pulmonary CT Angiography for Acute Pulmonary Embolism. Am. J. Roentgenol. (Nov 2016). https://doi.org/10.2214/AJR.16.17202
- [21] Oord, A.v.d., Li, Y., Vinyals, O.: Representation learning with contrastive predictive coding. arXiv preprint arXiv:1807.03748 (2018)
- [22] Selvaraju, R.R., Cogswell, M., Das, A., Vedantam, R., Parikh, D., Batra, D.: Grad-cam: Visual explanations from deep networks via gradient-based localization. In: Proceedings of the IEEE international conference on computer vision. pp. 618–626 (2017)
- [23] Zbontar, J., Jing, L., Misra, I., LeCun, Y., Deny, S.: Barlow twins: Self-supervised learning via redundancy reduction (2021). https://doi.org/10.48550/ARXIV.2103.03230, https://arxiv.org/abs/2103.03230