Fixating on Attention: Integrating Human Eye Tracking into Vision Transformers
Abstract
Modern transformer-based models designed for computer vision have outperformed humans across a spectrum of visual tasks. However, critical tasks, such as medical image interpretation or autonomous driving, still require reliance on human judgments. This work demonstrates how human visual input, specifically fixations collected from an eye-tracking device, can be integrated into transformer models to improve accuracy across multiple driving situations and datasets. First, we establish the significance of fixation regions in left-right driving decisions, as observed in both human subjects and a Vision Transformer (ViT). By comparing the similarity between human fixation maps and ViT attention weights, we reveal the dynamics of overlap across individual heads and layers. This overlap is exploited for model pruning without compromising accuracy. Thereafter, we incorporate information from the driving scene with fixation data, employing a “joint space-fixation” (JSF) attention setup. Lastly, we propose a “fixation-attention intersection” (FAX) loss to train the ViT model to attend to the same regions that humans fixated on. We find that the ViT performance is improved in accuracy and number of training epochs when using JSF and FAX. These results hold significant implications for human-guided artificial intelligence.
Introduction
The performance of Vision Transformers (ViTs) [1], has exceeded human performance across various visual tasks. ViTs have exhibited state-of-the-art performance in tasks such as image recognition, action classification, and even autonomous driving [2]. The success of ViTs has recently been attributed to their ability to process visual scenes like humans. This is particularly evident in their broader receptive fields compared to other model architectures and the distinct patterns of errors they exhibit [3]. Yet, utilizing ViTs in real-world situations like autonomous driving poses challenges stemming from their limited interpretability and the absence of frameworks for direct human guidance.
We propose a novel approach111Code and data available at: github.com/schko/fixatt to tackle these challenges: incorporating eye-tracking data into ViT. Eye fixations offer a reliable measure of visual behavior and are often used to analyze human perception of intricate scenes [4]. Moreover, the attention mechanism intrinsic to ViT has been leveraged to study their interpretation of images and videos [5, 6]. We conduct experiments on two datasets involving human turn-taking decisions in virtual and real-world scenarios. Our primary objective is to uncover the relationship between human fixations and model attention to enhance the precision and reliability of decisions achieved by their combination.
First, we highlight differences in decision-making between humans and transformers in driving scenarios that include various types of uncertainty. We focus on left and right turning choices extracted from openly-accessible and controlled virtual reality datasets. This controlled environment allows us to collect a larger volume of turn-related decisions. Humans tend to mitigate localized uncertainty, fixating on fewer scene regions for extended durations. Next, we propose two ways of augmenting model input with human fixation data. We train the ViT model to attend to fixation data and the driving scene concurrently. We use a simple method of computing overlap between model attention and human fixations to force attention to fixation regions actively. We find that both methods improve the model’s accuracy, requiring fewer training epochs, and are more consistent in performance than the baseline ViT.
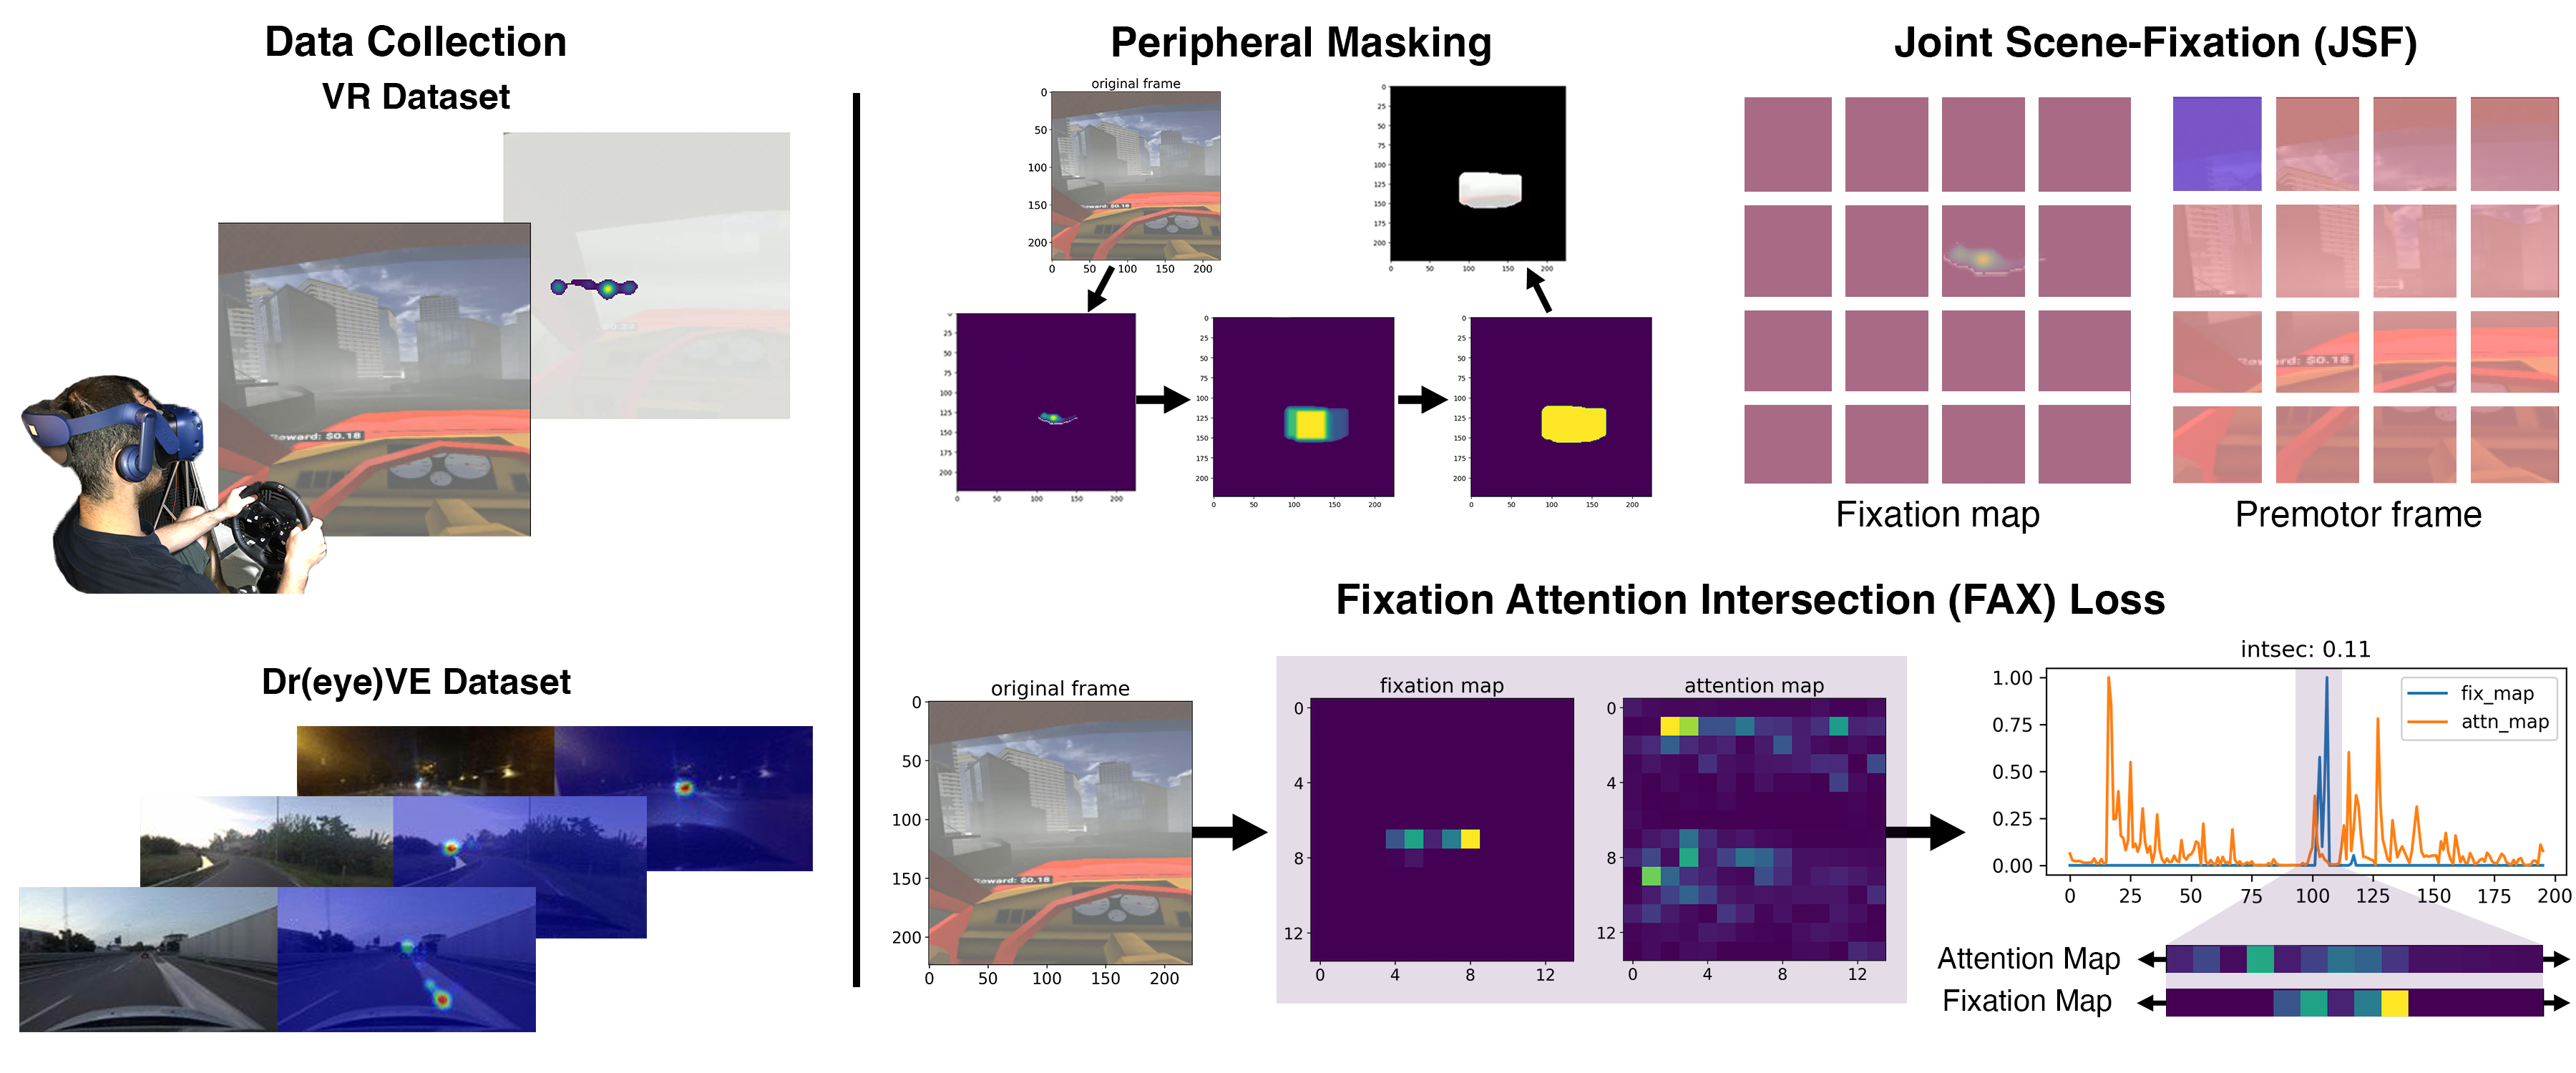
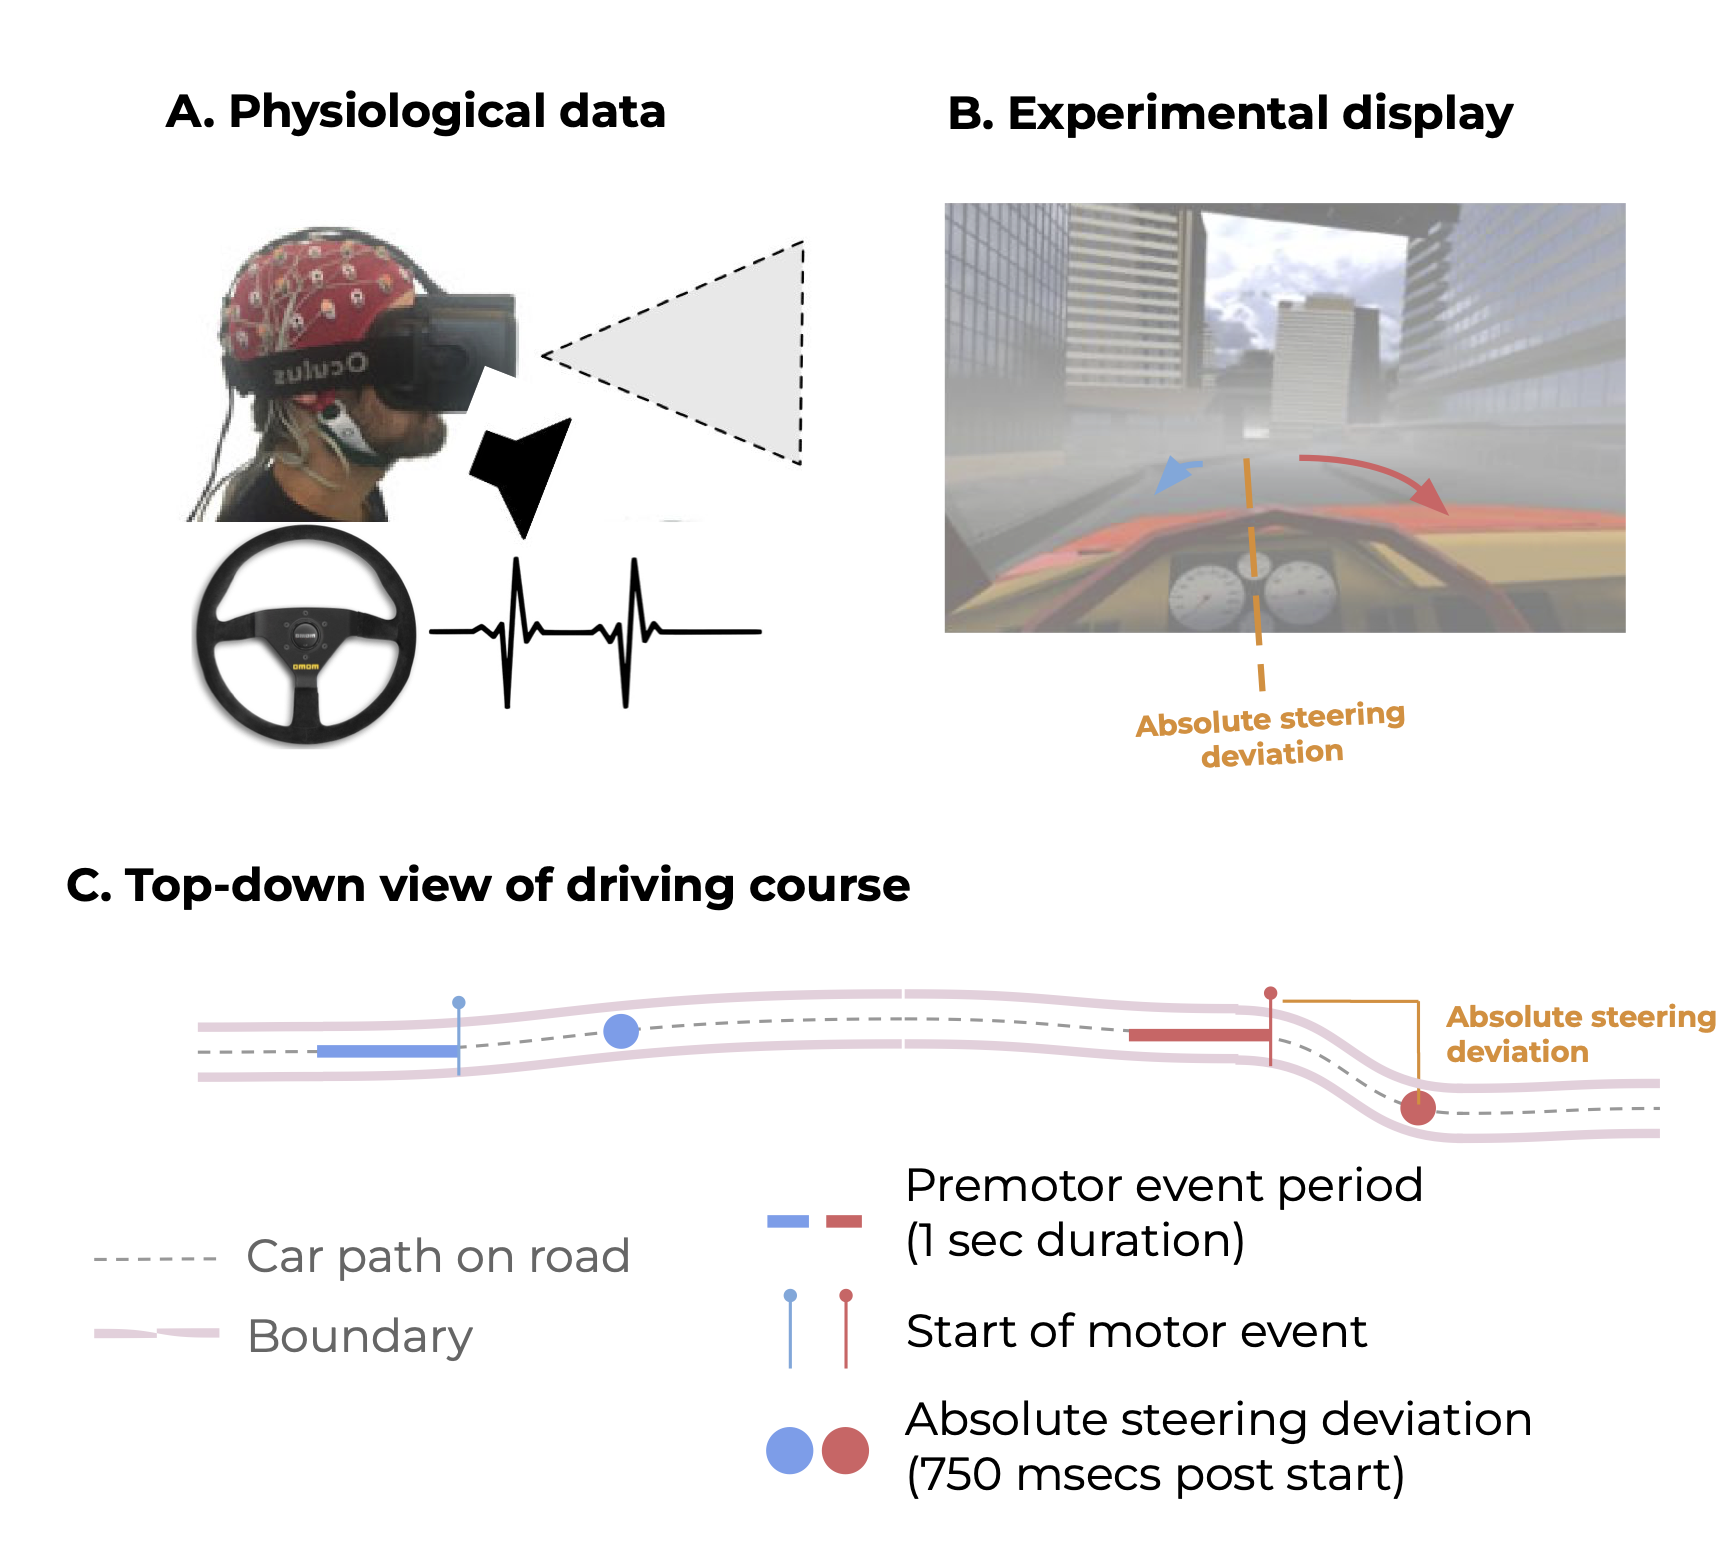
Fig. 1 shows an overview of our approach, and the main contributions of our work can be summarized as follows:
-
•
we compare how humans and transformers perceive visual scenes in the context of driving decisions under uncertainty,
-
•
we release a novel dataset of human driving decisions collected in virtual reality to study turn behavior,
-
•
we propose three methods for integrating human fixation data into ViT: (a) fixation-based masking of input, (b) augmenting input with fixation maps, and (c) introducing a custom loss function that optimizes alignment between human fixation and model attention regions, and
-
•
we show that the proposed fixation integration methods offer two distinct advantages: reducing model size through layer pruning and significantly improving the performance of ViT.
Related work
Human and machine vision
The parallel between human and machine vision has attracted considerable interest. Recent approaches have emphasized transformers’ self-attention attributes and receptive fields, which mirror the human visual system [3], are robust to occlusions and perturbations [7], generalize to multiple problems, and highly accurate compared to convolutional networks [8, 9]. ViTs and related models have shown high accuracy in predicting various eye tracking measures, such as types of eye behavior, gaze paths, or saliency maps [10]. However, integrating the two has been limited to retrospective comparisons of trained ViT and human attention [11] or knowledge distillation methods using teacher-student model designs [12]. Our proposed methods combine the advantage of larger receptive fields of ViTs with the ability of the human visual system to gather task-relevant information from complex scenes quickly [13] during model training.
Eye-gaze tracking in autonomous driving
Eye tracking in humans can provide many insights into the behavioral and neural dynamics that underlie the flexible decision-making required in tasks such as autonomous driving. Current research in autonomous driving has focused on integrating eye-gaze tracking to driver monitoring systems to index the driver’s attention and alertness as given by fixation coordinates and pupil dilation [14, 15]. Recent gaze-driven autonomous driving research has also been focused on identifying when a driver is distracted or not paying attention to the road. These systems can detect inattention by analyzing gaze direction and duration and provide warnings or interventions to maintain safety [16, 17]. Eye-gaze tracking can aid in predicting the driver’s intentions, such as lane changes or turns [18]. By analyzing gaze-based indices, an autonomous system can anticipate the driver’s maneuvers, adjust its behavior accordingly, and potentially use eye-gaze patterns to ensure safety and efficiency.
Sensorimotor decisions
Humans are notably successful in performing sensorimotor decisions under uncertainty compared to their artificially intelligent counterparts [19, 20, 21]. In tasks such as making a right turn onto a street, humans can infer and integrate information across spatial, temporal, and sensory modes for optimal and efficient decisions [22]. Recent advances in state-of-the-art robotics aim to integrate templates of the processes that underlie sensorimotor decision-making in humans to improve existing flexibility in decision-making [23, 24]. Prior studies have revealed that visual attention is a critical cognitive process in performing sensorimotor decision-making tasks in the information processing stage but not in the motor planning stage [25, 26]. Visual attention is often evaluated with eye tracking technologies as visual information available to a subject depends on the field of view and the position of the pupil [13].
Proposed methods
Baseline Vision Transformer
Following the original ViT architecture [1], the representative frame from the premotor period prior to motor action is divided into non-overlapping patches of size , which are then flattened to form , where are the dimensions of the input frame and is the total number of patches. Each flattened patch is then transformed into a fixed-size representation using a learnable linear projection , resulting in patch embeddings. Positional embeddings are then added to incorporate spatial information. The embeddings of size become the input to the ViT model (Eq. 1). Analogous to BERT [27], ViT introduces a CLS token as a learnable embedding at the beginning of the patch embeddings sequence. At the final Transformer layer, the output is used to form a comprehensive image representation (Eq. 4).
The input embeddings traverse a series of Transformer encoder layers, each consisting of Multihead Self-Attention (MSA) and Multi-Layer Perceptron (MLP) components. Layer normalization (LN) is applied before every block and residual connections after every block for both MSA and MLP. The MLP is comprised of two linear layers featuring a GELU non-linearity.
| (1) |
| (2) |
| (3) |
| (4) |
Given that , represents the number of attention heads and the number of layers in the ViT model, we choose to implement a ViT model with layers and attention heads. The weights for each attention head across layers are given by:
| (5) |
where and . We convert the attention weight matrix into a vector by averaging over patches, while excluding the CLS token. The resulting vector illustrates how the model, at head and layer , assigns attention to different image patches and is used to visualize attention maps.
In our specific application, which centers around predicting left or right turns based on the premotor period frame, we employ binary cross entropy loss () as the loss function for the baseline ViT model.
| (6) |
where denotes the two classes (left, right) and represent the predicted probabilities for the left and right class respectively.
Fixation maps
Fixation maps represent the aggregate eye gaze during the premotor period and match the size of input frames. We define flattened patches of fixation map , similar to the approach in the baseline ViT model. Additionally, we resize and flatten the original fixation map to produce the vector , which has same size as the vector of the ViT model and is used to compute the similarity between the attention and fixation maps.
Peripheral masking of input
Peripheral masking involves the removal of regions outside the visual periphery within the frame. This is achieved by expanding the fixation area within fixation maps () and zeroing all pixels outside of this area (Fig. 1). To study the importance of human-fixated regions, we train the baseline ViT model using the masked frame as input.
Joint scene-fixation (JSF) attention
Building upon the TimeSformer approach [6], which employs diverse attention techniques for spatiotemporal feature learning across multiple frames, we enhance the ViT architecture with joint scene-fixation (JSF) attention. We draw from the TimeSformer’s “joint space-time attention” concept, extending the ViT design to process a two-frame sequence. In this adaptation, we concatenate human fixation maps with the last frame of the premotor period, forming the input sequence. To accommodate this new input paradigm, we modify from Eq. 1 to incorporate patches from both input image () and fixation maps ():
| (7) |
This revised combines embeddings from image patches and fixation maps, thereby capturing spatial and fixation-related information.
Fixation-attention intersection (FAX) loss
To better guide the baseline ViT model to simulate human attention, we introduce a novel fixation-attention intersection loss to improve the model’s ability to capture human-like attention patterns during training. This loss quantifies the average intersection () as the dot product between ViT attention weights of all heads across all layers and the reduced human fixation map . To ensure comparability with , we sigmoid-transform to the range between 0.5 and 1. This step enhances meaningful comparisons between and .
| (8) |
| (9) |
Finally, we define by combining with the original classification loss :
| (10) |
where , , is the hyperparameter used for the weighted addition of the two losses. To determine the optimal value of for our experiments, we systematically evaluated a range of values, namely {0.01, 0.1, 0.2, 0.8, 1}.
Experiments
Implementation
The experiments were conducted on a Lambda Labs Vector Machine, equipped with Threadripper Pro 3990X v4 @ 4.3GHz (64 cores), 128 GB DDR4 RAM and 2x NVIDIA GeForce RTX 3090 (24 GB VRAM each). The implementation was carried out using a pre-trained ViT in PyTorch. The dataset was split into training, validation, and test sets with a ratio of 65:15:20 for the virtual reality (VR) and 68:12:20 for the real-world (DR(eye)VE) datasets to accommodate differences in dataset sizes. We report the average and variances of performance resulting from 10 random splits of our datasets for each type of run. The training was performed using the SGD optimizer with an initial learning rate of 0.001. The learning rate was adjusted using a scheduler to ensure convergence. Models were trained for a maximum of 200 epochs, with early stopping based on the validation loss (20 epochs) to prevent overfitting.
VR driving dataset
The VR dataset was collected as a part of a more extensive study on closed-loop brain-computer interface (Supplementary Fig. 9). 10 participants were recruited to complete a boundary avoidance task (BAT), presented by the HTC Vive Pro Eye VR headset, in a virtual city environment with varying visual noise opacity. Using the Logitech G steering wheel, participants were instructed to drive a simulated car toward target locations. Steering wheel data and a video of the driving scene were recorded throughout the driving sessions. We identify motor actions through a simple peak and trough-detection technique on the steering wheel channel. Using a non-overlapping, look-behind window of 750ms, we assured that the peak we encountered was the true peak in steering wheel activity. The transformer models in our study were trained with frames corresponding to individual left-right turn motor actions. There are 6006 frames identified to be associated with a left or right turn, with 3293 left-turn frames.
In addition to the video and steering information, eye-tracking data was collected using an HTC VIVE Pro Eye headset. Gaze coordinates from the eye tracker was used to construct the fixation map for one of the input frames of the JSF TimeSformer (see Supplementary). This map was computed by aggregating fixation data spanning a 3-second duration of the premotor period. We use the last frame in this premotor period as the input to all models.
We varied the visual uncertainty on a trial-by-trial basis by adjusting a visual noise opacity parameter as described in Ma et al. (2023)[28]. This parameter was meant to simulate the type of white, 1/f noise found in visual search tasks. Participants perceived it through the density of fog prevalent in the city environment.
DR(eye)VE dataset
DR(eye)VE [29] is a publicly available driving dataset collected in different landscape, weather, and time-of-day scenarios. The dataset contains gaze coordinates, driving speed, and course information for more than 500,000 frames. Geo-referenced locations are also available approximately every 25 frames. Because steering wheel data was unavailable, we used a combination of relative car positions, global positioning coordinates, and driving speed to identify left and right turn actions. To ensure the accuracy of our automated turn detection pipeline, at least two of the authors reviewed the videos manually and annotated frames corresponding to left or right turns. After review and validation of video frames, we identified 728 frames associated with a left or right turn, with 348 left-turn frames. Eye tracking data was collected for DR(eye)VE using an SMI ETG 2w sensor, and fixation maps for the DR(eye)VE dataset were computed using the same method for the VR dataset with a premotor period of 1 second. We use the first frame in this premotor period as the input to all models, driven by the relatively narrow field of view of the DR(eye)VE scene camera compared to the VR scene camera.
We computed the average contrast, across the whole image, by averaging the local pixel contrast that was calculated with the minimum and maximum luminance within a kernel of the reference pixel. The average contrast across all frames was used as a single measure of uncertainty for each sample.
We summarize the dataset sizes, classes (% left turns), and model performance by uncertainty in Table 1. We also provide a video of an example turn from both datasets (Supplementary Video 1).
Dataset Uncertainty Train Size Valid Size Test Size Left Turns (%) Density/ Contrast Human Acc. (%) Avg. ViT Acc. (%) Avg. FAX Acc. (%) VR High 2015 356 599 48.9 0.65 98.0 60.6 61.3 VR Low 2020 356 600 51.1 0.24 98.5 69.7 74.5 DR(eye)VE High 236 55 73 51.0 0.11 100 58.7 78.9 DR(eye)VE Low 236 55 73 46.7 0.39 100 59.7 71.7
Input frame and model ablations
We perform both input frame and model ablations to study the importance of human-fixated regions for model prediction. We transform input data using peripheral masking for both datasets and compare the performance with random rotation and translation of the mask in a “random masking” control. In practice, the mask size is sensitive to the eye-tracking sensor, so we visualize distributions of eye-tracking fixations in a kernel density estimate (KDE) plot.
We study the overlap between human and transformer vision by aggregating the intersection between ViT attention weights and the reduced human fixation map , as defined in Eq. 8. Using a qualitatively-determined cutoff, we identify layers with minimal overlap and prune these layers to study the impact on model performance.
Results
Quantitative performance
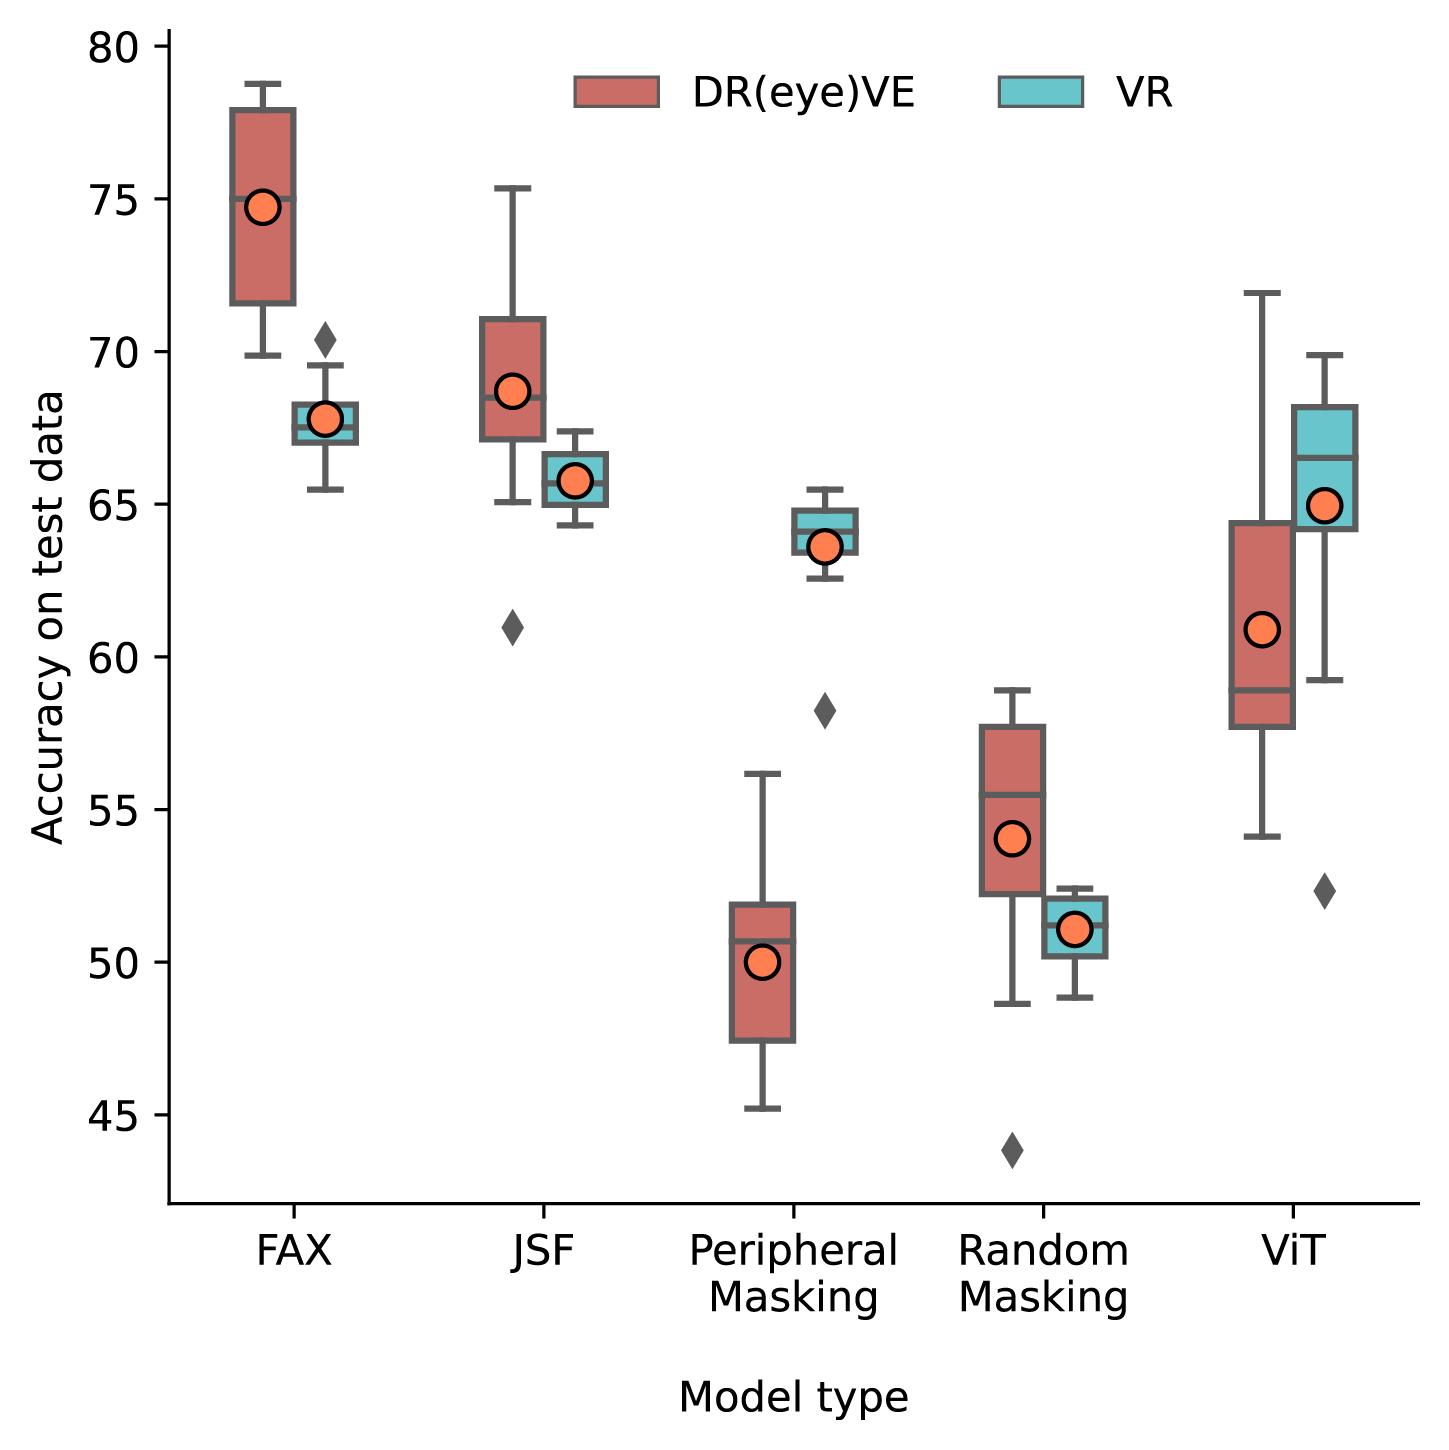
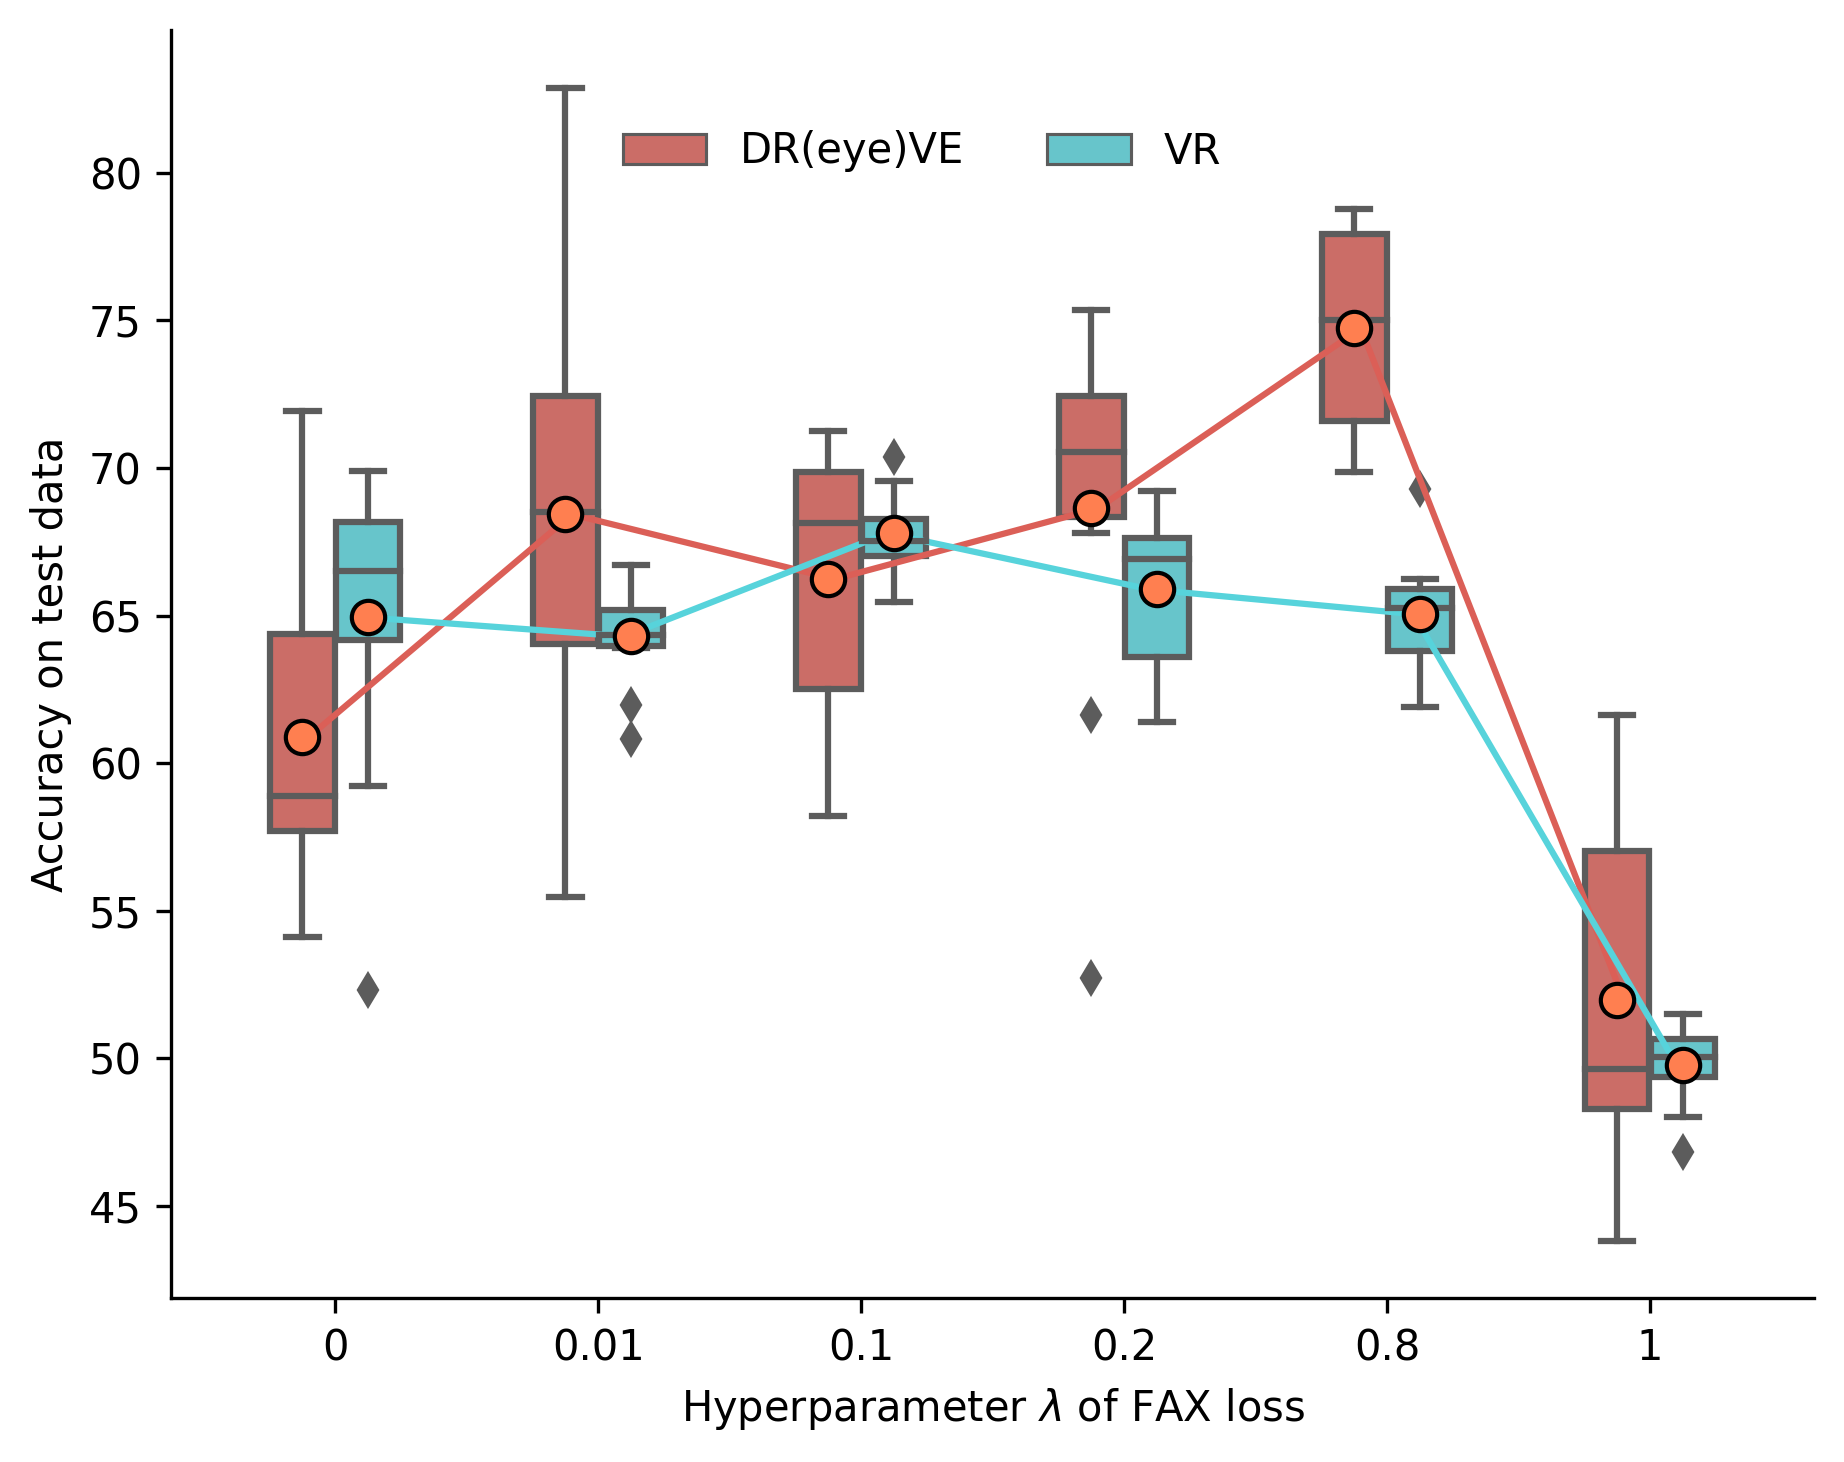
Fig. 2 shows accuracy for the baseline ViT model, with modified inputs (peripheral masking, JSF) and with the custom fixation-attention intersection loss (FAX). The mean accuracy of the baseline ViT model for the VR and DR(eye)VE is 64.95% and 60.98%, respectively. As expected, we find that, across both datasets, peripheral masking yields significantly higher accuracy than random masking (56.80% compared to 52.56%, see Supplementary Table 2). Peripherally masking input performs similarly to using the entire frame in the VR dataset but not in the DR(eye)VE dataset, most likely due to the smaller dataset size and increased fixation areas resulting from different sensors used in both studies.
FAX and JSF (71.26% and 67.23% respectively) outperform the baseline ViT model (62.92%) for both datasets. While this difference is not significant between FAX and JSF, FAX shows a statistically significant improvement over the baseline ViT (Supplementary Table 2). Furthermore, we find that baseline ViT and FAX accuracy differs by visual uncertainty in the scene (Table 1), with the model performing relatively worse when visibility is poor. The most significant improvement from adding fixation data through FAX was found in the “high” uncertainty condition of the DR(eye)VE dataset (20.2%). Our results show that adding human fixations during the training process improves the performance of the baseline ViT model and may be related to how humans fixate in uncertain conditions.
Visual vs. model attention
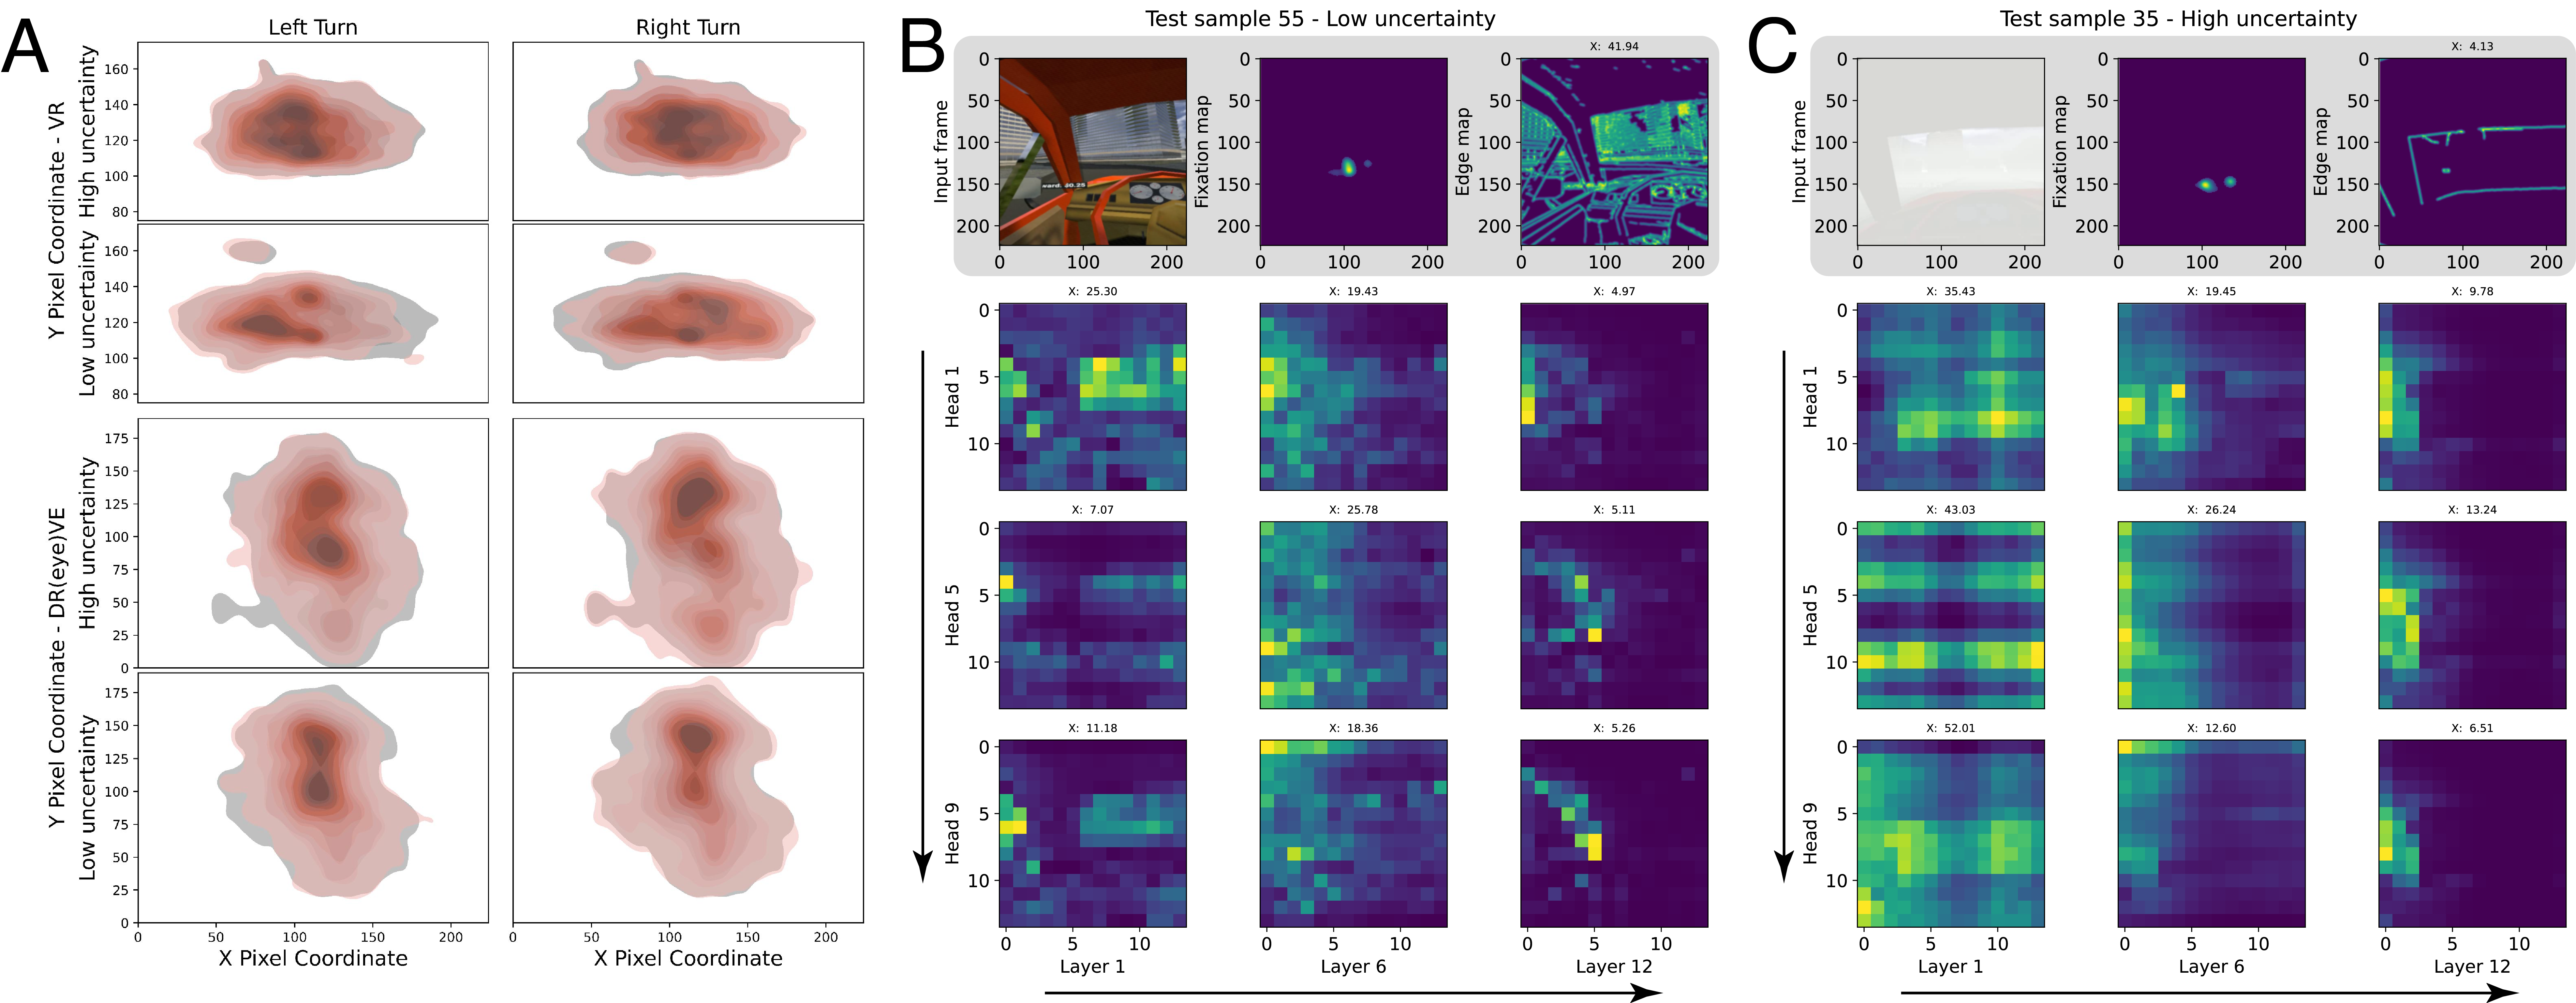
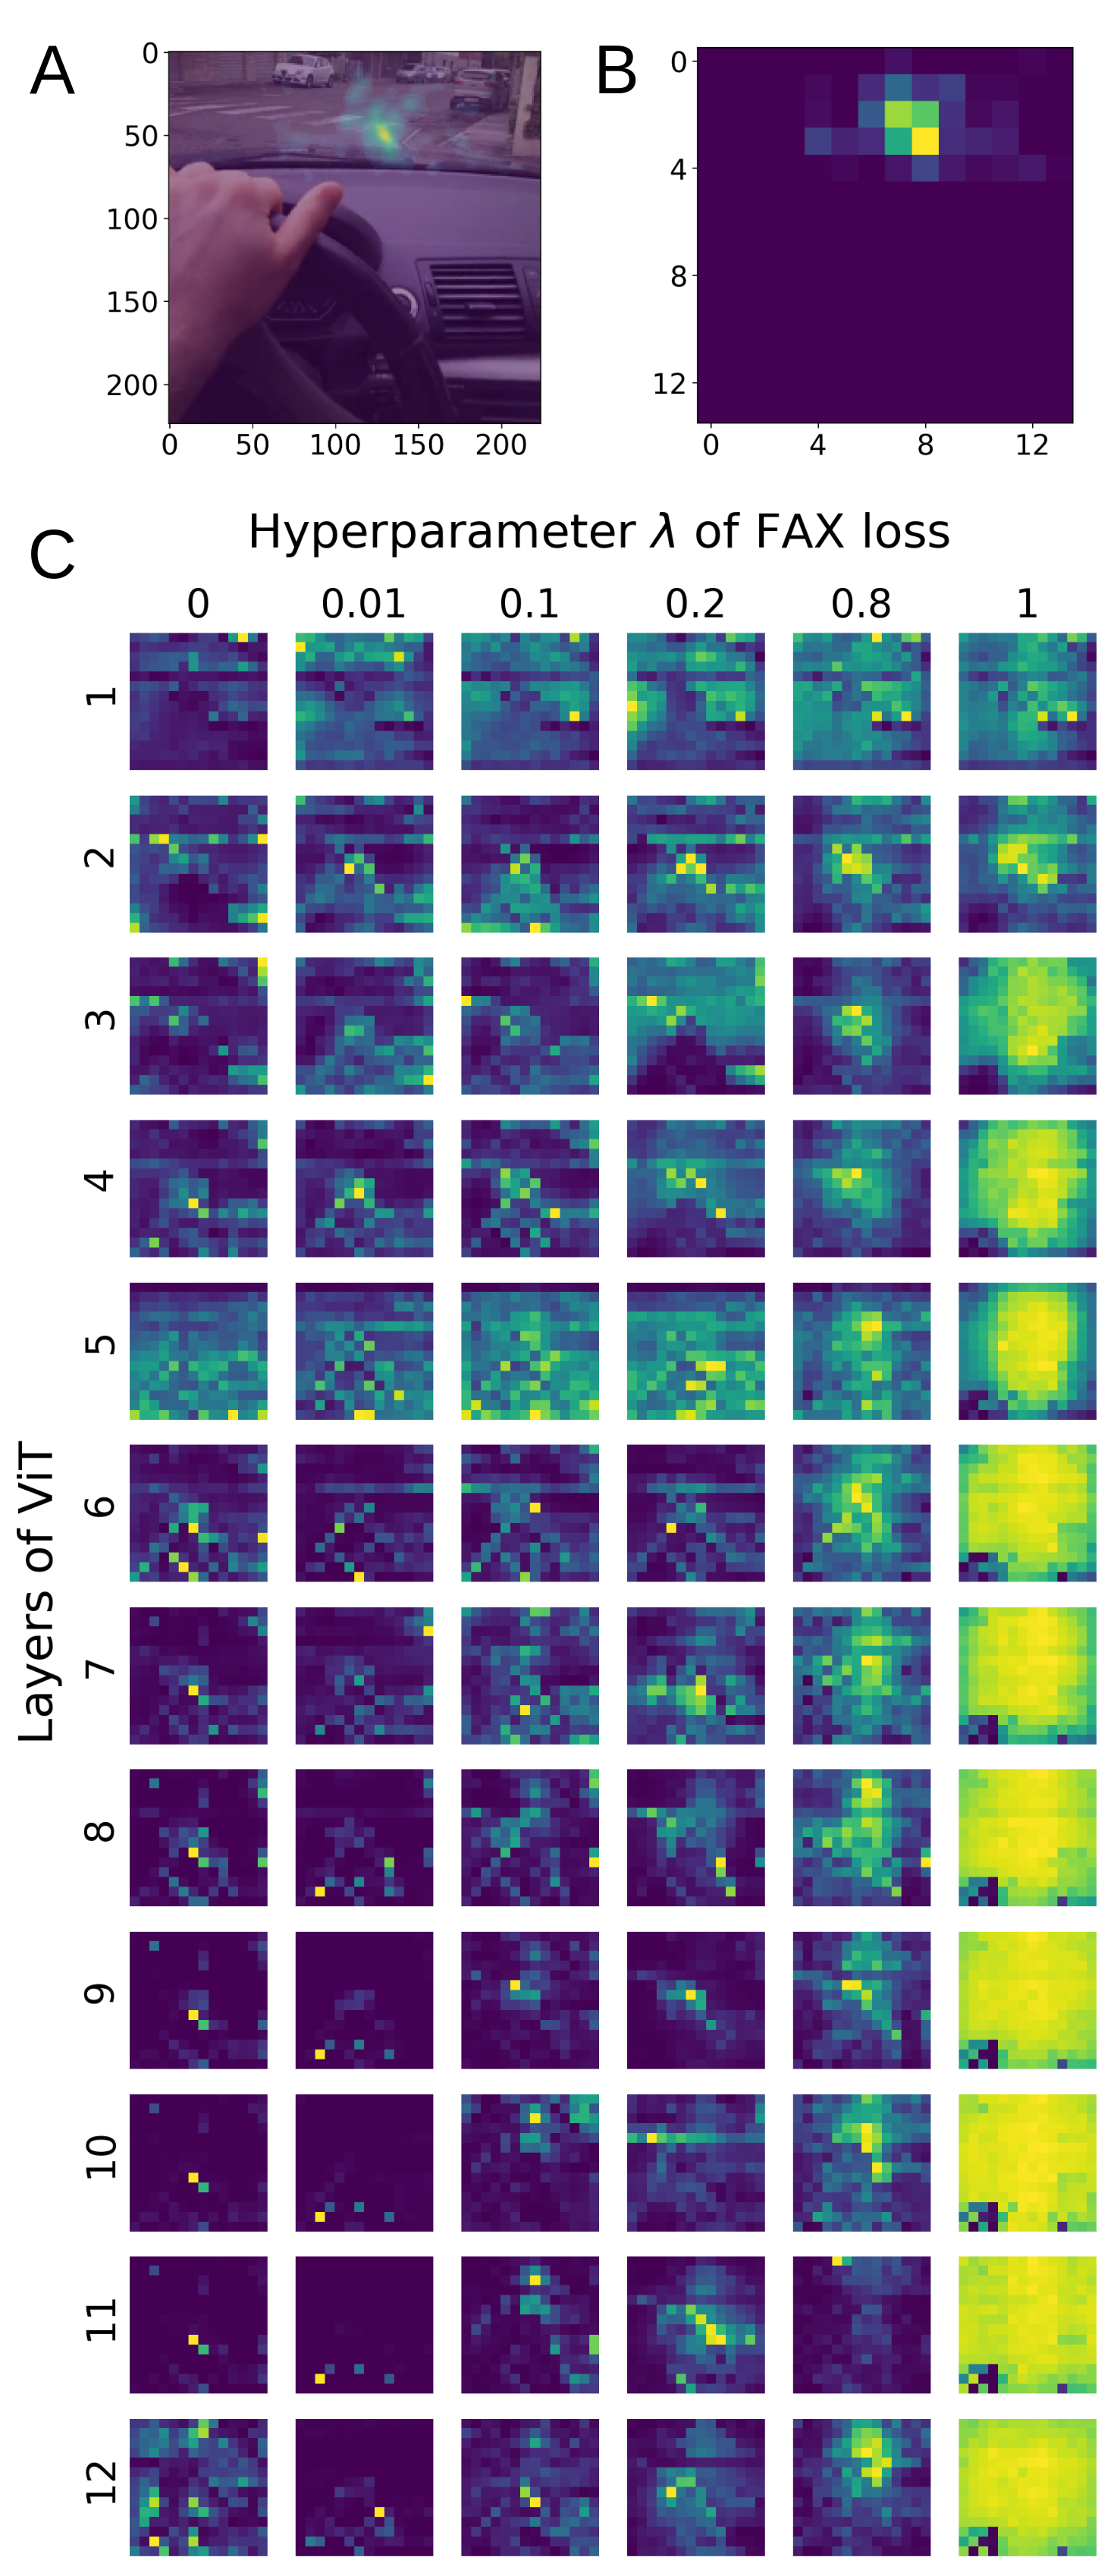
To assess whether fixations contribute to improved ViT performance by assisting models in resolving uncertainty, we perform a qualitative comparison between fixation maps (Fig. 3A) and attention weights (Fig. 3B and C) using the best-performing 12-layer, baseline ViT model on the VR dataset. We select the VR dataset due to the relatively larger number of samples.
The distribution of fixations in both datasets (gray) indicates that viewing time is concentrated around the center of the frames, although relatively sparse, with a larger fixation area for DR(eye)VE than the VR dataset. This difference is likely because participants were goal-directed in the VR dataset, focusing on avoiding the boundary and navigating through the environment with different levels of visibility. In comparison, in the DR(eye)VE dataset, participants needed to remain vigilant about other vehicles, attend to road signs, and ensure a safe driving experience by exploring the scene for unexpected events. The high uncertainty conditions across both datasets result in longer relative fixation durations in fewer regions. This finding is consistent with existing literature [13] and suggests that humans minimize local spatial uncertainty in low-visibility scenarios through longer fixation time in fewer areas rather than minimize global uncertainty through an exploration strategy.
During the decision-making process concerning left or right turns, the attention weights (as depicted in Fig. 3B, C) exhibit broader scene coverage than human fixation maps. This phenomenon is characterized by increased attention across the entire frame, particularly in high-uncertainty scenarios. Furthermore, the overall attention across ViT layers differs with depth. In shallower layers, attention is dispersed, primarily capturing edge-related scene details, while in deeper layers, attention is more concentrated, integrating contextual information. Our results suggest that transformer models may seek to minimize global over local uncertainty, the opposite of human strategy. Thus, human fixations may provide the model with information on which regions of the frame may be more relevant for resolving uncertainty, allowing faster and more accurate learning.
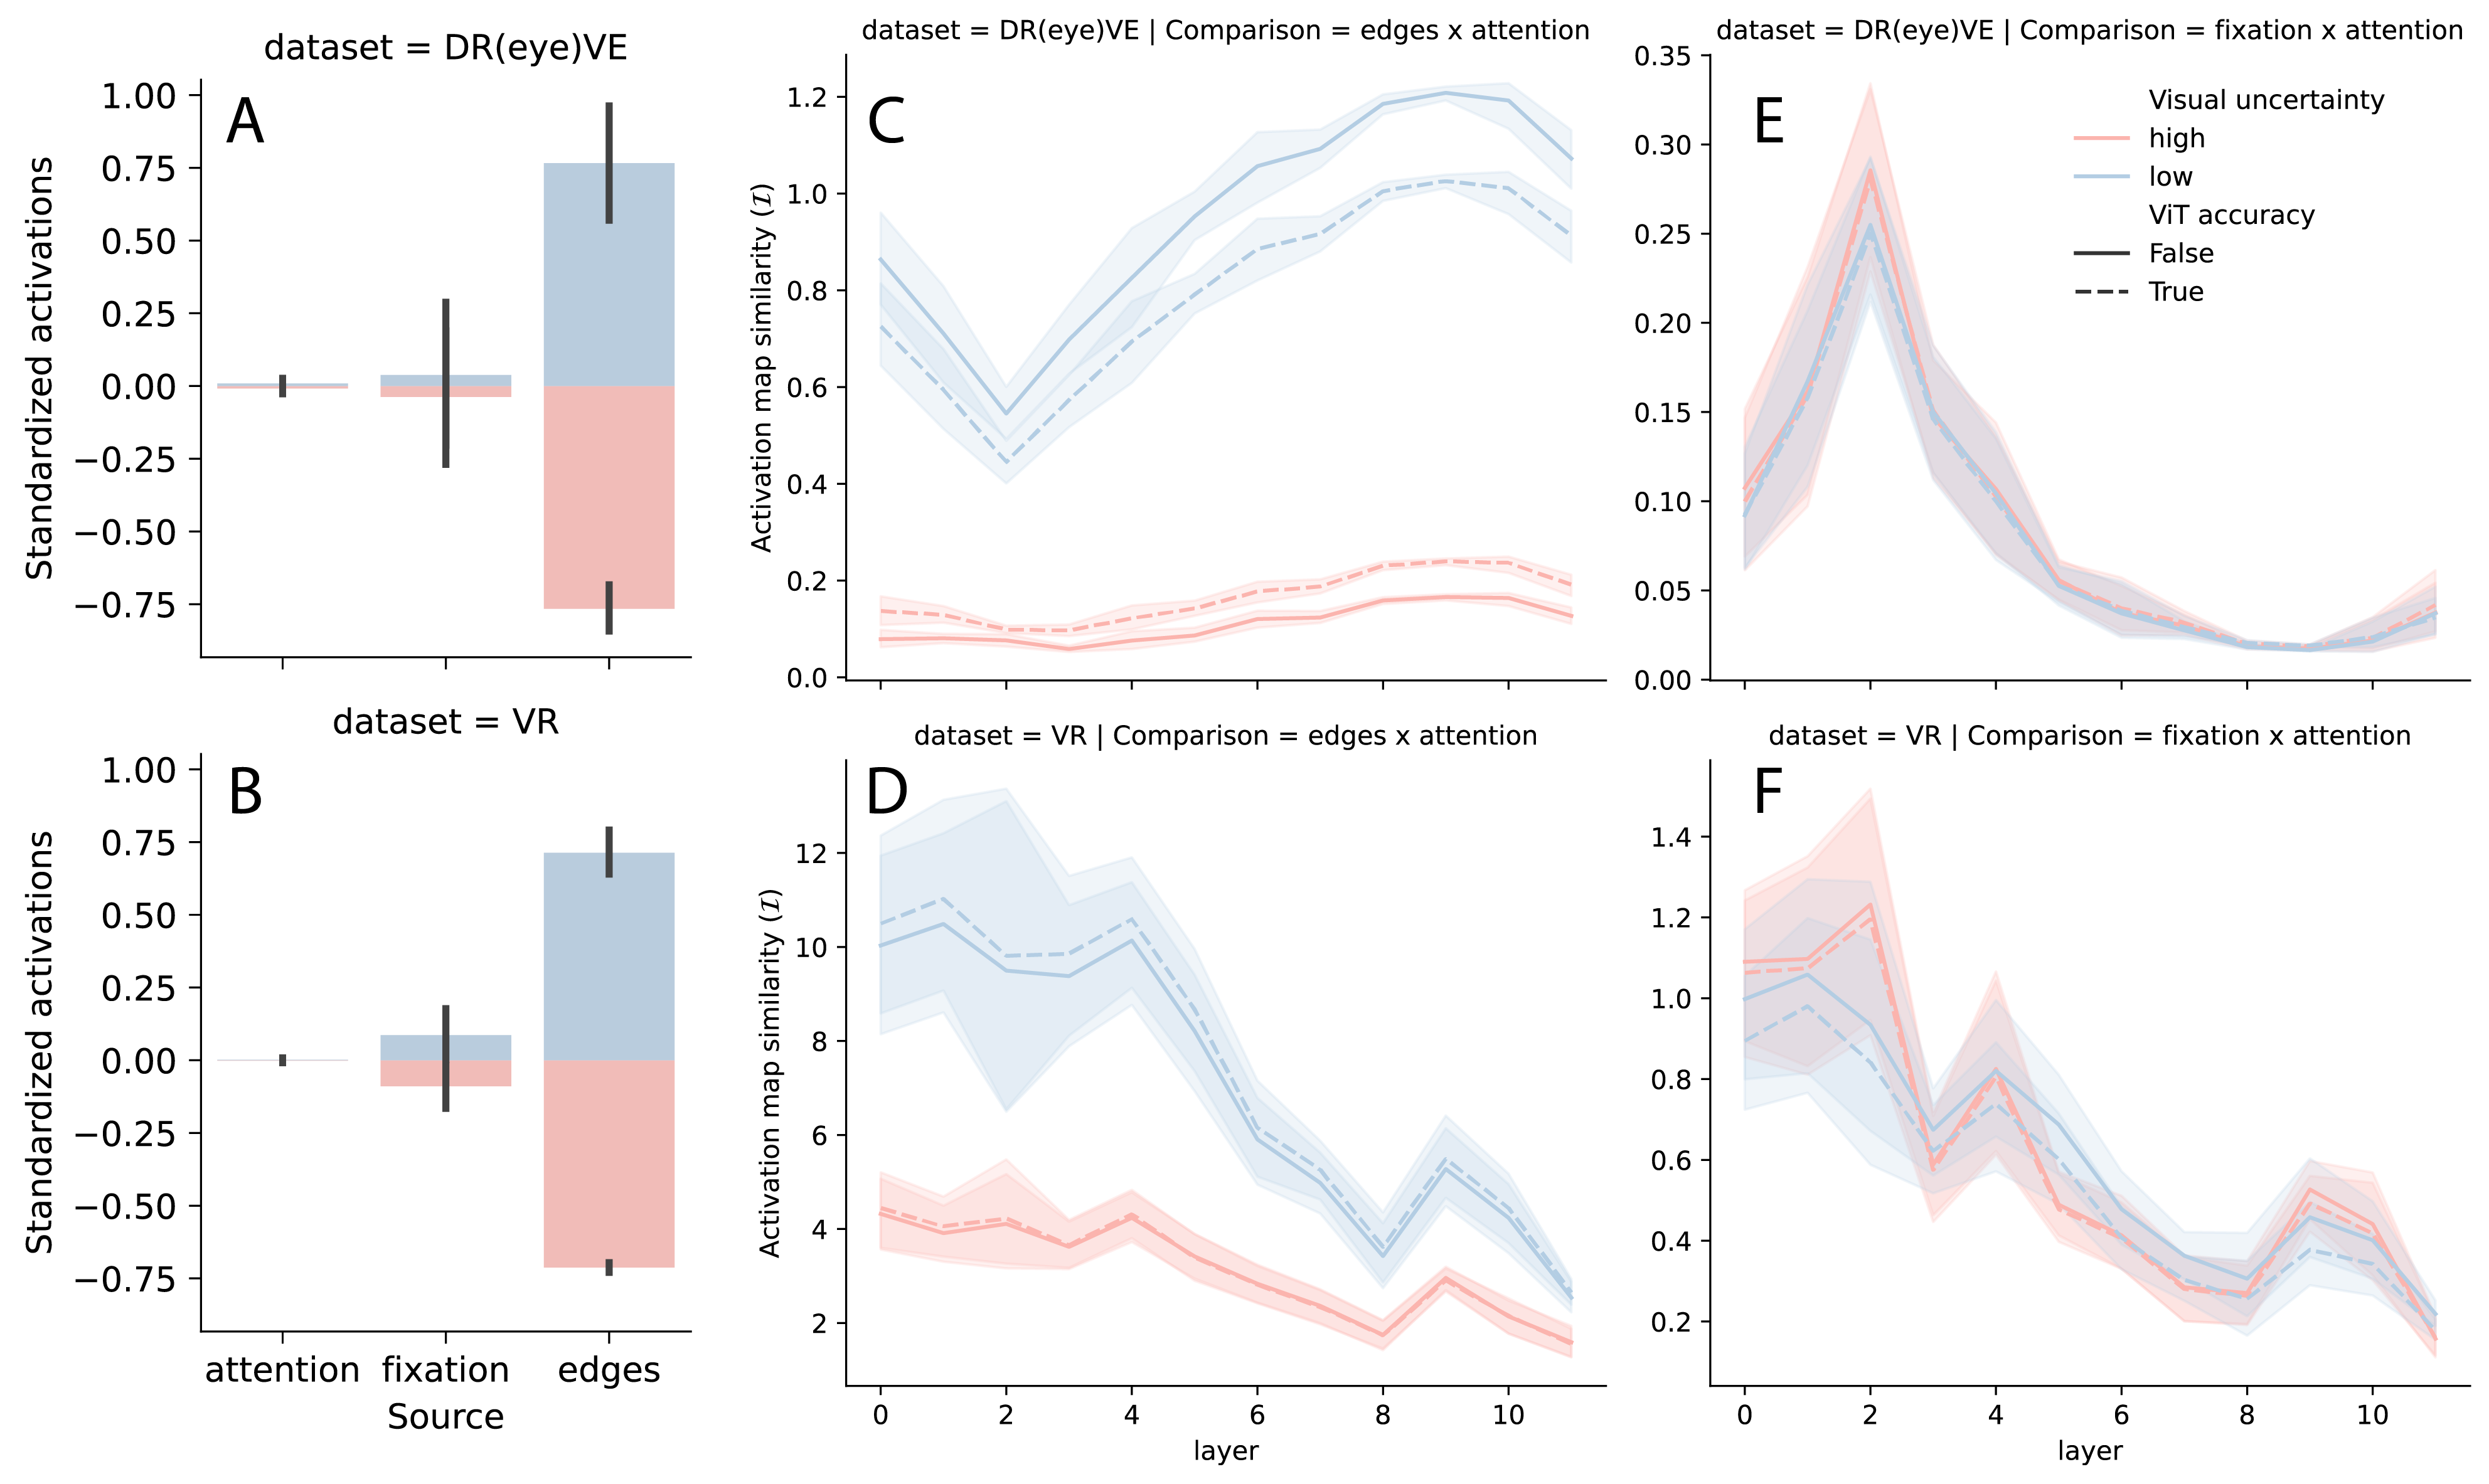
Fixation, edge, and model attention similarity
To understand how model attention overlaps with edges and fixations from the scene, we measure overall attention and compute the similarity between fixation maps and layer-specific attention maps using the dot product described in (Fig. 4). First, the total ViT attention is not notably different between low and high-uncertainty test samples. In contrast, the total number of fixations and edges varies by uncertainty condition (Fig. 4A, B). In other words, high visibility (i.e., low uncertainty) results in a larger fixation area and more detected edges. Still, the model does not employ a different strategy in its attention overall. This suggests that the model may find fixation data beneficial for parsing uncertainty through better distributing its attention weights spatially in the scene.
Although total model attention does not differ by visual uncertainty, attention across layers varies in similarity/overlap with edge (Fig. 4C, D) and human fixation maps (Fig. 4E, F). The model learns to attend to regions with edges differently for each dataset. Attention to edges is greater for deeper layers for the DR(eye)VE dataset but decreases in the VR dataset. However, the overlap between attention weights of the baseline ViT model and fixation maps faces a steady decline with increasing depth. Our results suggest that although the model varies in its attention to edges, it employs similar trends in perception, with respect to human fixations, across different types of visual scenes.
We found that the most significant performance gain from adding fixations into the training process occurred in the DR(eye)VE dataset, specifically in the high uncertainty condition (Table 1). Our results from Fig. 4C suggest that this may be because the model extracts edge-related information usefully in high-uncertainty conditions in real-world driving scenarios. In this case, human fixations may aid the model by improving the spatial resolution of important areas in the scene. Through training the model to attend similarly to humans, we believe methods such as JSF and FAX take advantage of the efficiency of human visual perception under uncertainty [30, 31].
Model and input frame ablations
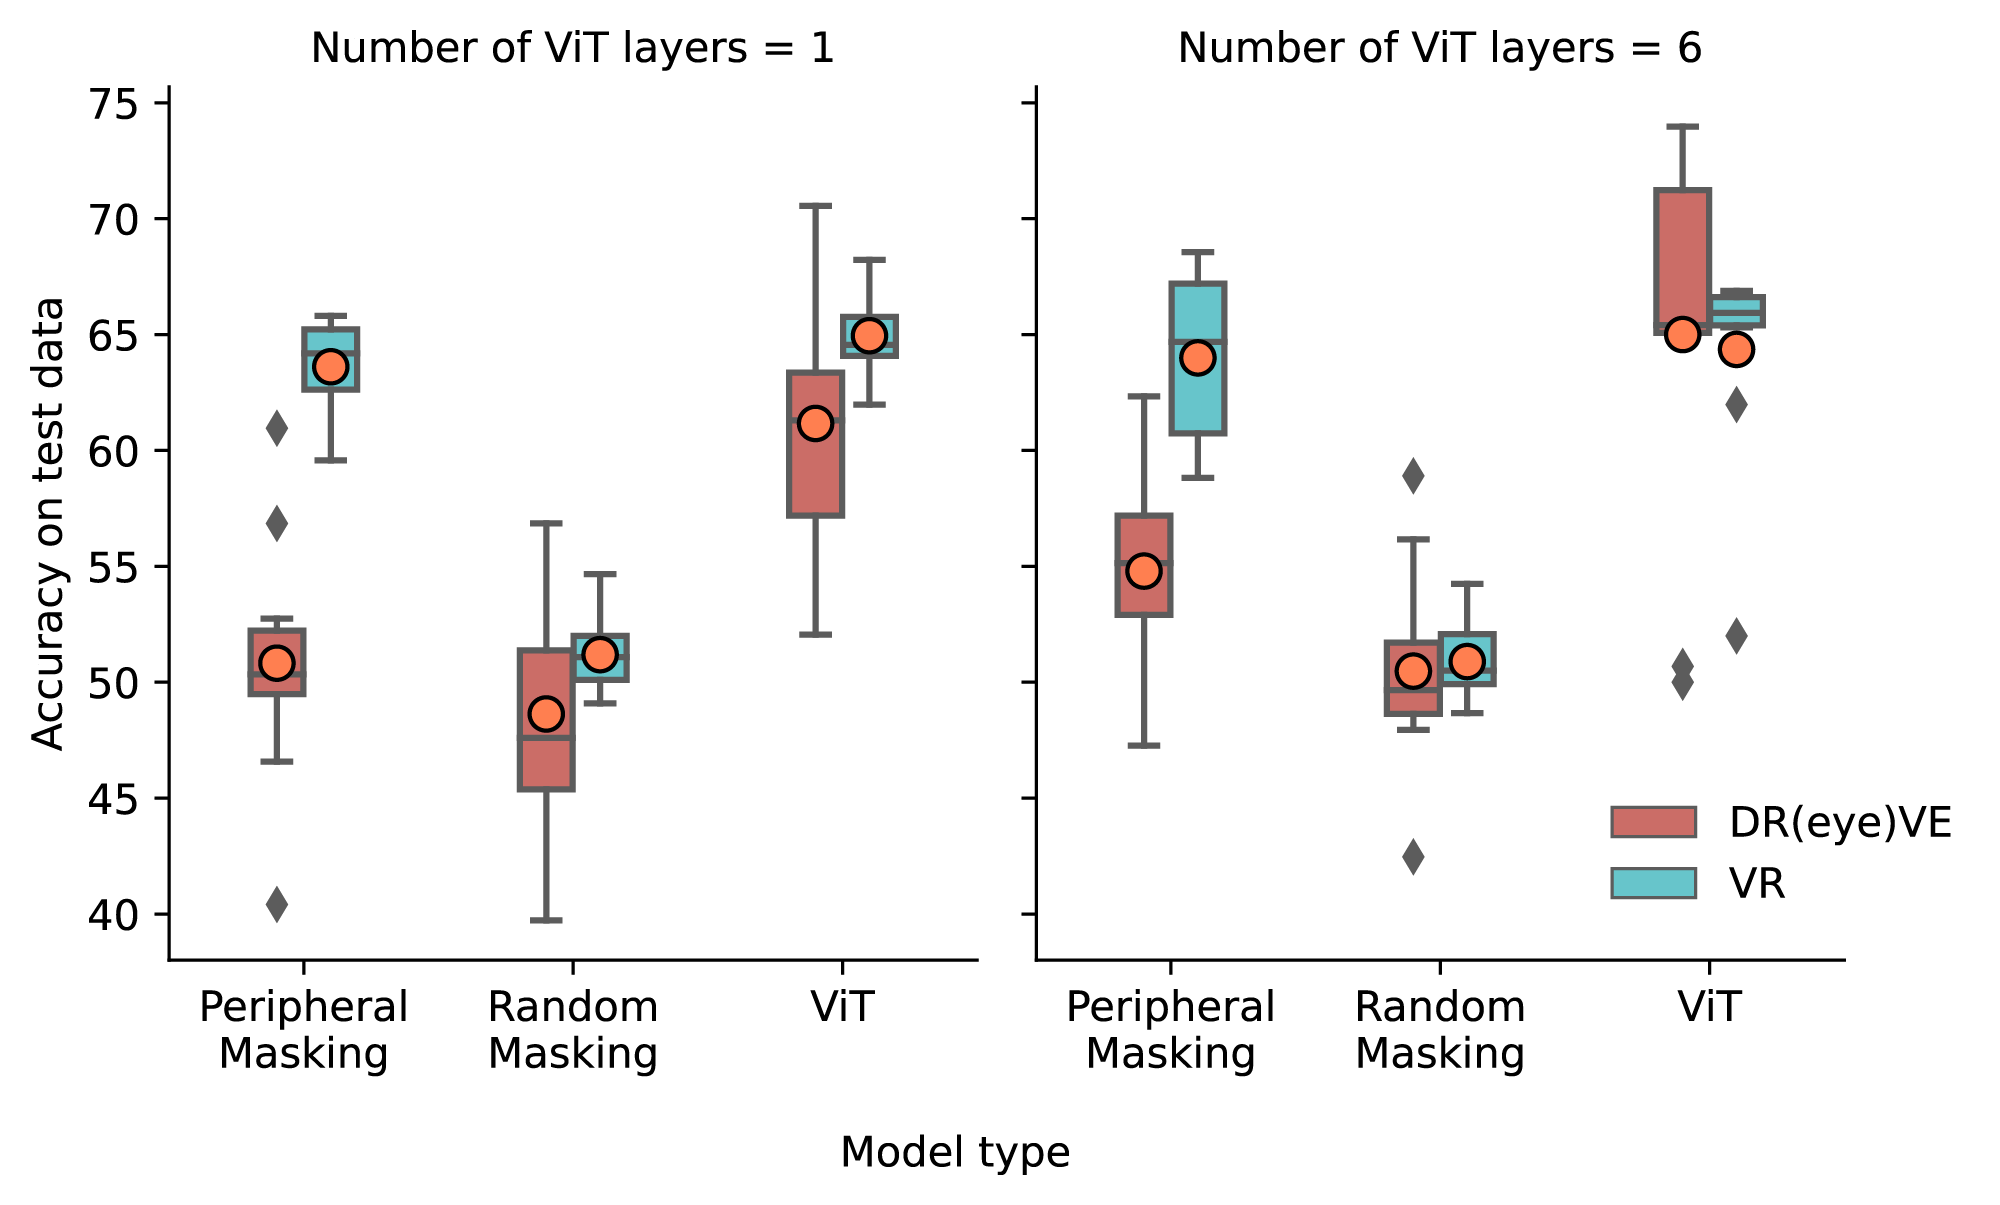
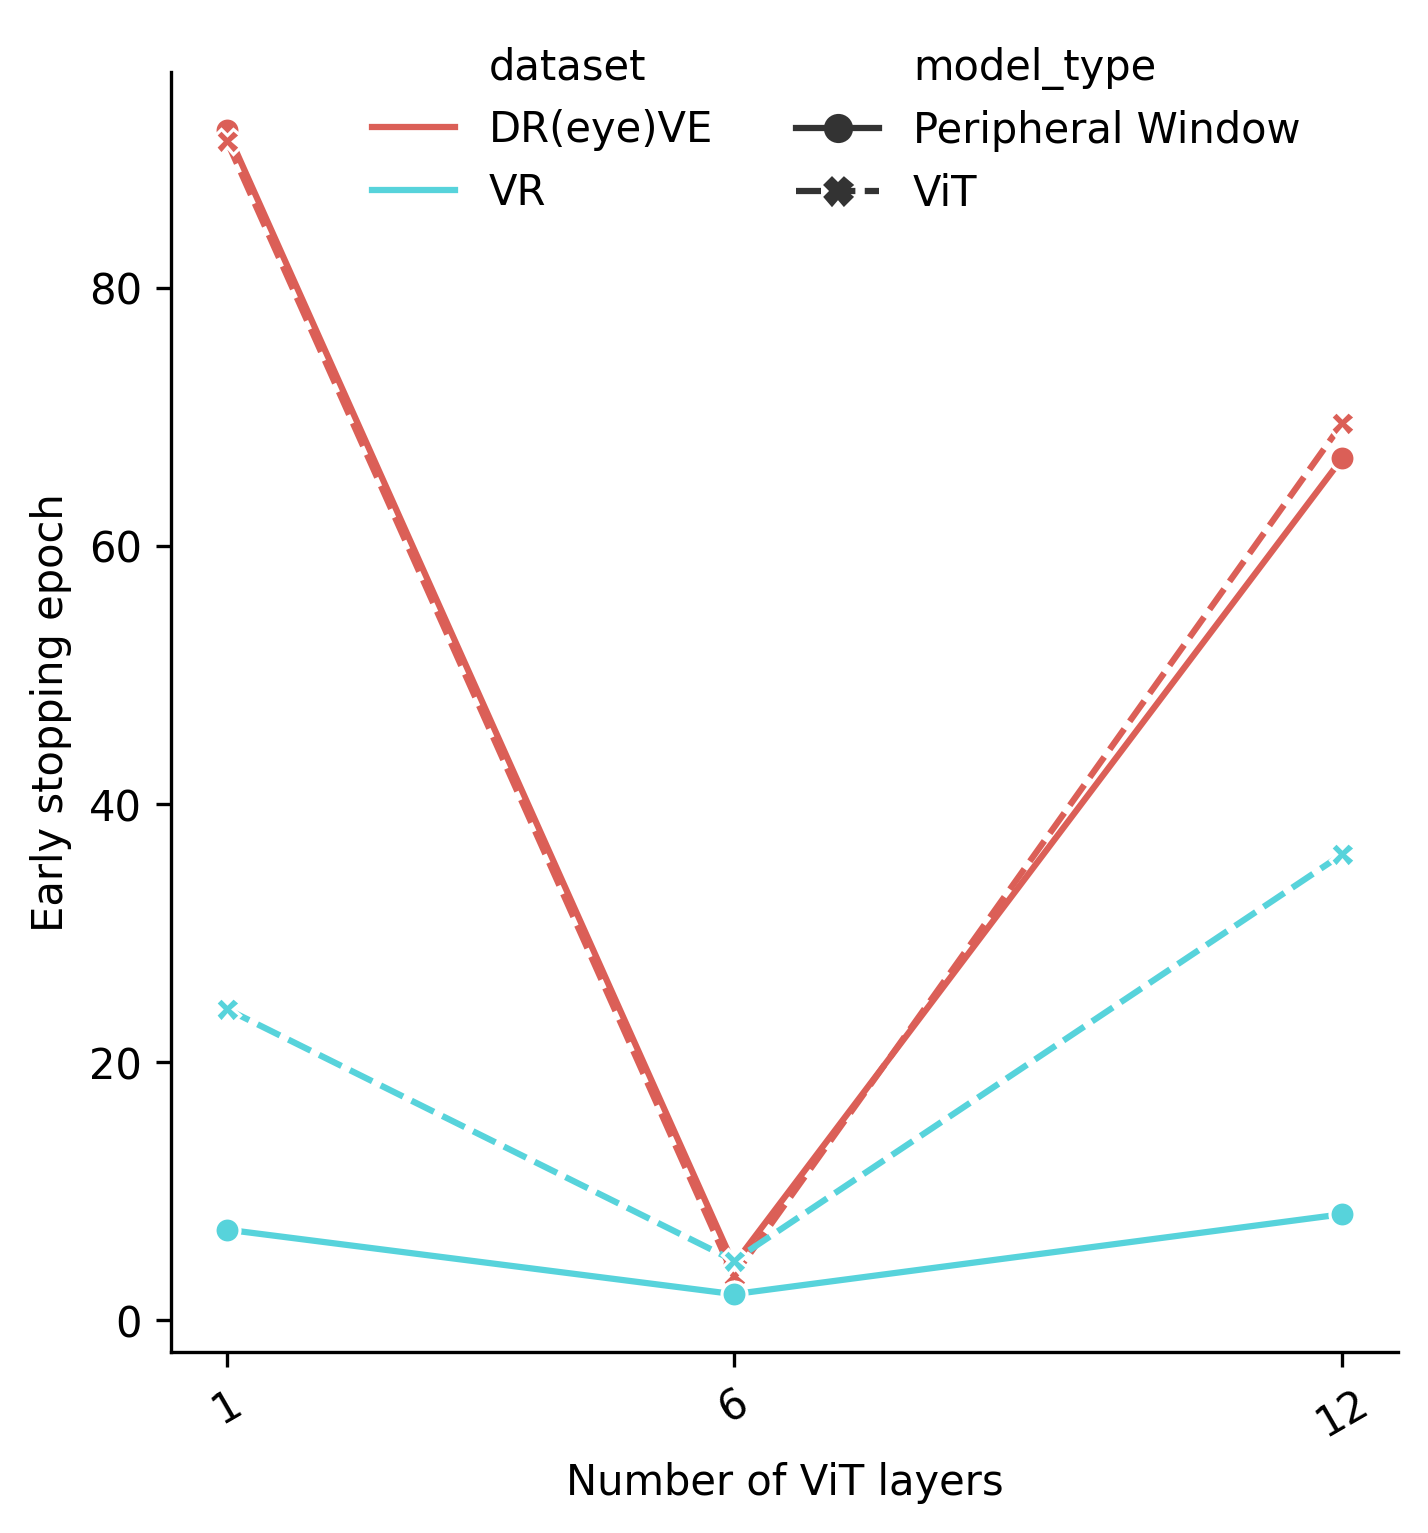
We selected two model ablations using visual inspections of findings from Fig. 4E and F. Given that the overlap between fixation maps and ViT attention maps decreases rapidly after 6 layers, we pruned layers 7-12 to form the 6-layer ViT model. We also used a single-layer ViT, as a control, in separate runs. The average accuracy for DR(eye)VE is greater when using the 6-layer ViT (Supplementary Fig. 6 right) than using the 12-layer ViT (Fig. 2), despite decreasing the depth of the model, and therefore the number of parameters, in half. Accuracy is similar to the VR dataset. However, a single layer (Supplementary Fig. 6 left) decreases average accuracy across datasets.
We reduce the amount of input data the model uses through peripheral masking (Fig. 1) to study the importance of human-fixated regions. Peripheral masking yields significant performance gains relative to random masking, even after model ablations (Supplementary Fig. 6). These results suggest that peripheral masking can be used by models to improve accuracy. Furthermore, reducing model size using the number of layers that overlap most with human fixations does not result in significant performance loss (Fig. 2, Supplementary Fig. 6).
Fixation integration
We present qualitative results from a selected head and visualize its attention maps across all ViT layers, ranging from , representing sole utilization of , to , indicating exclusive reliance on (Fig. 5). As increases (left to right), attention maps better emulate the original fixation data, except for , wherein the model increases attention to all areas of the frame to match human fixations. The initial layers exhibit a global image-wide focus, gradually transitioning to more focused attention maps in deeper layers (top to bottom). Post-initial layers show increased concentration around the original human fixation for optimal values (e.g., 0.2 or 0.8). Remarkably, , associated with peak accuracy, showcases the highest alignment between attention maps and human fixation data.
Our results show that rather than reducing global uncertainty by attending everywhere, ViTs can be trained to attend more like humans. Using fixation maps, ViTs can be trained to minimize local uncertainty, like humans, while maintaining a larger receptive field. This significantly enhances model performance in driving contexts and could also apply to other areas where transformers are employed for image and video tasks.
Conclusion
We present three methods demonstrating how vision transformers (ViTs) can integrate human fixation data to enhance motor action prediction accuracy in driving scenarios. Through peripheral masking, joint scene-fixation attention (JSF), and fixation-attention intersection loss (FAX), we show the model’s ability to utilize important fixation areas observed by humans for turn prediction while reducing local uncertainty. Our findings indicate that incorporating human-guided transformer design, by integrating eye gaze, can enhance the precision of autonomous driving systems and carry implications for other expert-dependent visual tasks.
Acknowledgments
The authors would like to thank Pawan Lapborisuth, Josef Faller, and Ziheng Li for their valuable contributions and support during the course of this study. The study was funded by a Vannevar Bush Faculty Fellowship from the U.S. Department of Defense (N00014-20-1-2027), a Cooperative Agreement with the Army Research Laboratory (W911NF-23-2-0067), and a Center of Excellence grant from the Air Force Office of Scientific Research (FA9550-22-1-0337).
References
- [1] Alexey Dosovitskiy, Lucas Beyer, Alexander Kolesnikov, Dirk Weissenborn, Xiaohua Zhai, Thomas Unterthiner, Mostafa Dehghani, Matthias Minderer, Georg Heigold, Sylvain Gelly, Jakob Uszkoreit, and Neil Houlsby. An Image is Worth 16x16 Words: Transformers for Image Recognition at Scale. 2020.
- [2] Sayak Paul and Pin-Yu Chen. Vision Transformers Are Robust Learners. Proceedings of the AAAI Conference on Artificial Intelligence, 36(2):2071–2081, June 2022.
- [3] Shikhar Tuli, Ishita Dasgupta, Erin Grant, and Thomas L. Griffiths. Are Convolutional Neural Networks or Transformers more like human vision?, July 2021.
- [4] James F. Cavanagh, Thomas V. Wiecki, Angad Kochar, and Michael J. Frank. Eye tracking and pupillometry are indicators of dissociable latent decision processes. Journal of Experimental Psychology: General, 143(4):1476–1488, 2014.
- [5] Jacob Gildenblat. Exploring Explainability for Vision Transformers. http://jacobgil.github.io/deeplearning/vision-transformer-explainability, December 2020.
- [6] Gedas Bertasius, Heng Wang, and Lorenzo Torresani. Is Space-Time Attention All You Need for Video Understanding?, June 2021.
- [7] Hugo Touvron, Matthieu Cord, Matthijs Douze, Francisco Massa, Alexandre Sablayrolles, and Hervé Jégou. Training data-efficient image transformers & distillation through attention, January 2021. arXiv:2012.12877 [cs].
- [8] Muzammal Naseer, Kanchana Ranasinghe, Salman Khan, Munawar Hayat, Fahad Shahbaz Khan, and Ming-Hsuan Yang. Intriguing Properties of Vision Transformers, November 2021. arXiv:2105.10497 [cs].
- [9] Robert Geirhos, Patricia Rubisch, Claudio Michaelis, Matthias Bethge, Felix A. Wichmann, and Wieland Brendel. ImageNet-trained CNNs are biased towards texture; increasing shape bias improves accuracy and robustness, November 2022. arXiv:1811.12231 [cs, q-bio, stat].
- [10] Jianxun Lou, Hanhe Lin, David Marshall, Dietmar Saupe, and Hantao Liu. TranSalNet: Towards perceptually relevant visual saliency prediction. Neurocomputing, 494:455–467, July 2022. arXiv:2110.03593 [cs].
- [11] Ekta Sood, Simon Tannert, Diego Frassinelli, Andreas Bulling, and Ngoc Thang Vu. Interpreting Attention Models with Human Visual Attention in Machine Reading Comprehension, October 2020. arXiv:2010.06396 [cs].
- [12] Moinak Bhattacharya, Shubham Jain, and Prateek Prasanna. RadioTransformer: A Cascaded Global-Focal Transformer for Visual Attention-guided Disease Classification, July 2022. arXiv:2202.11781 [cs].
- [13] Laura Walker Renninger, Preeti Verghese, and James Coughlan. Where to look next? Eye movements reduce local uncertainty. Journal of Vision, 7(3):6, February 2007.
- [14] James F. Cavanagh, Thomas V. Wiecki, Angad Kochar, and Michael J. Frank. Eye tracking and pupillometry are indicators of dissociable latent decision processes. Journal of Experimental Psychology: General, 143(4):1476–1488, 2014.
- [15] Andrea Palazzi, Davide Abati, Simone Calderara, Francesco Solera, and Rita Cucchiara. Predicting the Driver’s Focus of Attention: the DR(eye)VE Project, June 2018. arXiv:1705.03854 [cs].
- [16] Christer Ahlstrom, Katja Kircher, and Albert Kircher. A Gaze-Based Driver Distraction Warning System and Its Effect on Visual Behavior. IEEE Transactions on Intelligent Transportation Systems, 14(2):965–973, June 2013.
- [17] T. D’Orazio, M. Leo, C. Guaragnella, and A. Distante. A visual approach for driver inattention detection. Pattern Recognition, 40(8):2341–2355, August 2007.
- [18] Jan Willem De Gee, Tomas Knapen, and Tobias H. Donner. Decision-related pupil dilation reflects upcoming choice and individual bias. Proceedings of the National Academy of Sciences, 111(5), February 2014.
- [19] I Barabás, A Todoruţ, N Cordoş, and A Molea. Current challenges in autonomous driving. IOP Conference Series: Materials Science and Engineering, 252:012096, October 2017.
- [20] José Fernando Sabando Cárdenas, Jong Gyu Shin, and Sang Ho Kim. A Few Critical Human Factors for Developing Sustainable Autonomous Driving Technology. Sustainability, 12(7):3030, April 2020.
- [21] John W Krakauer and Pietro Mazzoni. Human sensorimotor learning: adaptation, skill, and beyond. Current Opinion in Neurobiology, 21(4):636–644, August 2011.
- [22] Jason P. Gallivan, Craig S. Chapman, Daniel M. Wolpert, and J. Randall Flanagan. Decision-making in sensorimotor control. Nature Reviews Neuroscience, 19(9):519–534, September 2018.
- [23] Kuniaki Noda, Hiroaki Arie, Yuki Suga, and Tetsuya Ogata. Multimodal integration learning of robot behavior using deep neural networks. Robotics and Autonomous Systems, 62(6):721–736, June 2014.
- [24] Luka Peternel, Nikos Tsagarakis, and Arash Ajoudani. A Human–Robot Co-Manipulation Approach Based on Human Sensorimotor Information. IEEE Transactions on Neural Systems and Rehabilitation Engineering, 25(7):811–822, July 2017.
- [25] T. D’Orazio, M. Leo, C. Guaragnella, and A. Distante. A visual approach for driver inattention detection. Pattern Recognition, 40(8):2341–2355, August 2007.
- [26] Jeffrey D Schall and Narcisse P Bichot. Neural correlates of visual and motor decision processes. Current Opinion in Neurobiology, 8(2):211–217, April 1998.
- [27] Jacob Devlin, Ming-Wei Chang, Kenton Lee, and Kristina Toutanova. BERT: Pre-training of Deep Bidirectional Transformers for Language Understanding. 2018.
- [28] Jia Li Ma, Sharath Koorathota, and Paul Sajda. Neurophysiological Predictors of Self-Reported Difficulty in a Virtual-Reality Driving Scenario.
- [29] Stefano Alletto, Andrea Palazzi, Francesco Solera, Simone Calderara, and Rita Cucchiara. DR(eye)VE: A Dataset for Attention-Based Tasks with Applications to Autonomous and Assisted Driving. In 2016 IEEE Conference on Computer Vision and Pattern Recognition Workshops (CVPRW), pages 54–60, Las Vegas, NV, USA, June 2016. IEEE.
- [30] Peter Wittek, Ying-Hsang Liu, Sándor Darányi, Tom Gedeon, and Ik Soo Lim. Risk and Ambiguity in Information Seeking: Eye Gaze Patterns Reveal Contextual Behavior in Dealing with Uncertainty. Frontiers in Psychology, 7, November 2016.
- [31] Tad T. Brunyé, Trafton Drew, Donald L. Weaver, and Joann G. Elmore. A review of eye tracking for understanding and improving diagnostic interpretation. Cognitive Research: Principles and Implications, 4(1):7, December 2019.
Supplementary materials
Human Accuracy
Human accuracy for VR dataset was calculated by using the difference between the damage of the car taken for the current trial, , and the previous trial, . The accuracy was computed relative to the previous trial. The trial from zero damage to minimal damage was considered 0% accuracy.
Preprocessing
Fixation map and Edge Detection
The fixation maps for both VR and DR(eye)VE datasets are generated by aggregating fixation data spanning a different duration of the premotor period. The fixation map for DR(eye)VE datasets was generated by utilizing the fixation coordinate for 10 frames, which is 0.4 seconds, whereas the VR dataset uses fixation data for 3 seconds. The reason for such a difference was, the fixation map for DR(eye)VE tends to have a larger fixation area due to the number of uncertain factors to consider. A shorter duration in this case generates a fixation map with a reasonable size.
The fixation map is generated based on the dimension of the original frame. The gaze coordinates for the VR, in particular, need to be re-scaled to match the frame dimension before the fixation map gets generated. The generation of the fixation map starts with computing a 2D Gaussian matrix with pre-defined variables. These variables are being used to further re-scale the gaze coordinate so that the coordinate aligns with the Gaussian matrix. The fixation map is generated by adding up the portion of the Gaussian matrix that corresponds to those gaze coordinates. There is a duration parameter available that can be used to adjust the weight of the gaze coordinate. The fixation map for the DR(eye)VE dataset is generated in the same fashion.
For edge detection, the original frame first goes through color conversion from color to grayscale. Afterward, Gaussian smoothing is performed on the grayscale image with a 3x3 kernel. The purpose of this step is to improve the edge detection result. This blurred image finally feeds into the Canny edge detector with a lower threshold of 25 and an upper threshold of 50.
Specific implementation can be found in the get_video_clip.py function.
Peripheral masking
In our processing pipeline, we enhance the fixation heatmap to encompass a broader peripheral area, which we subsequently employ for generating masks. This augmentation of the heatmap accounts for the fact that peripheral regions can provide valuable insights into what is visually perceived around the central foveated point, as captured by eye tracking systems.
To achieve this, we perform a dilation operation on the fixation heatmap. Dilation involves expanding regions of high intensity, effectively enlarging the areas of interest. The dimensions of the kernel used for dilation are set empirically to 30x30 pixels within the context of a input frame. This choice aligns with the approximate 30 degrees of visual angle that humans perceive in the mid-peripheral region.
We show our specific implementation in the create_peripheral_mask.py function.
Statistical approach
An analysis of variance (ANOVA) was conducted to evaluate the differences in model accuracy among the different model types: baseline Vision Transformer (ViT), joint space-fixation (JSF), and fixation attention intersection (FAX) (Table 2, top) across 10 runs.
For each pair of model types (group1 and group2), Table 2 (bottom) presents:
-
1.
meandiff: The mean difference in accuracy between the two groups.
-
2.
p-adj: The adjusted p-value after applying the multiple comparisons correction.
-
3.
lower and upper: The bound of the confidence interval for the mean difference.
-
4.
reject: Whether the null hypothesis of equal means is rejected based on the adjusted p-value (True or False).
We find that FAX shows a statistically significant accuracy difference compared to Peripheral Masking, Random Masking, and ViT. JSF and ViT is a significantly better performer compared to Peripheral Masking and Random Masking. FAX and JSF, as well as JSF and ViT, do not yield statistically significant differences after adjusting for multiple comparisons.
| df | sum_sq | mean_sq | F | PR(F) |
|---|---|---|---|---|
| 4.0 | 4599.63 | 1149.91 | 42.59 | 0.0 |
| 95.0 | 2565.01 | 27.00 | NaN | NaN |
group1 group2 meandiff p-adj lower upper reject FAX JSF -4.02 0.11 -8.59 0.54 False FAX Peripheral Masking -14.46 0.00 -19.02 -9.89 True FAX Random Masking -18.70 0.00 -23.27 -14.13 True FAX ViT -8.34 0.00 -12.91 -3.77 True JSF Peripheral Masking -10.43 0.00 -15.00 -5.86 True JSF Random Masking -14.67 0.00 -19.24 -10.11 True JSF ViT -4.31 0.07 -8.88 0.26 False Peripheral Masking Random Masking -4.24 0.08 -8.81 0.33 False Peripheral Masking ViT 6.12 0.00 1.55 10.69 True Random Masking ViT 10.36 0.00 5.79 14.93 True
| df | sum_sq | mean_sq | F | PR(F) |
|---|---|---|---|---|
| 2.0 | 1255.84 | 627.92 | 9.4 | 0.0 |
| 217.0 | 14488.13 | 66.77 | NaN | NaN |
group1 group2 meandiff p-adj lower upper reject 1 6 1.52 0.56 -2.00 5.05 False 1 12 5.43 0.00 2.28 8.57 True 6 12 3.90 0.01 0.75 7.05 True
We also report the results from an analysis on whether there are significant differences in model accuracy when considering a subset of baseline ViT layers, selected based on the extent of overlap between their attention maps and fixation maps. We find a statistically significant difference in model accuracy based on the number of layers selected from the ViT (Table 3, top).
Models with 6 layers exhibit a significant accuracy difference compared to models with the 12-layer, baseline ViT (p-adj = 0.01), with a mean difference of 3.90%. This difference is smaller than the control condition, where we selected a single layer for training (mean difference of 5.43, p-adj = 0.00). We find no statistically significant difference in accuracy between models with 1 layer and 6 layers (p-adj = 0.56).