Tracing obscured galaxy build-up at high redshift using deep radio surveys
Abstract
Context. A fundamental question of extra-galactic astronomy that is yet to be fully understood, concerns the evolution of the star formation rate (SFR) and supermassive black hole (SMBH) activity with cosmic time, as well as their interplay and how it impacts galaxy evolution. A primary focus that could shed more light on these questions is the study of merging systems, comprising highly star-forming galaxies (SFGs) and active galactic nuclei (AGN) at the earliest stages of galactic formation. However, considering the challenges associated with identifying these objects, it is essential to explore complementary selection methods across multiple wavelengths.
Aims. The primary objective of this study is to conduct a comprehensive analysis of a sample of high-redshift () far-infrared (far-IR) and radio-emitting galaxies in the highest possible spatial resolution. The aim is to study the properties of this population, such as their morphological characteristics, and to explore the interplay of SFR and SMBH activity at this epoch.
Methods. In order to select the galactic population of our interest, we employed two selection criteria that have frequently been used as separate methods in the literature. In more detail, we selected galaxies that present relatively compact radio morphologies at 1.4 GHz (i.e. an angular size smaller than 10 arcsec) as well as a far-IR spectrum that peaks in flux at (i.e. ). For these selection criteria, we used the COSMOS and ECDF-S fields, two of the most extensively observed astronomical fields currently available, which provide high spectral and spatial resolution at a multi-wavelength scale. By accepting only galaxies that satisfied these selection criteria, we derived a sample of eight galaxies that were identified either photometrically or spectroscopically at from literature studies and by our team.
Results. A thorough investigation of available optical, near-IR, and millimetre (mm) imaging reveals a possible merging scenario in five out of eight cases in our sample. Additionally, available multi-wavelength photometry strongly suggests active star formation at the level in massive systems (stellar masses of ) co-hosting an active SMBH.
Conclusions. Comparison of these results with previous studies, suggests that our selection method preferentially identifies galaxies hosting an active SMBH, as well as a strong SFG component, resulting in high SFR and IR luminosity. An additional examination of the efficacy of the radio and far-IR selection criteria provides further support for their combined application in selecting co-evolving AGN and star formation activity at high redshift. In this regard, future use of these selection criteria on radio and far-IR/mm observations of statistically larger galaxy samples is of high interest.
Key Words.:
star formation – radio galaxies – high redshift1 Introduction
One of the main challenges in the field of extra-galactic astronomy is understanding how the star formation rate density (SFRD - ) evolves with redshift (see Madau & Fragos, 2017; Oesch et al., 2018; Tacconi et al., 2020, for a detailed review). While we have accurate estimates of the SFRD at intermediate redshifts () using various selection methods from deep multi-wavelength data (e.g. Gruppioni et al., 2020; Novak et al., 2017; Ishigaki et al., 2018; Dunlop et al., 2017, for infrared (IR), radio, ultraviolet-UV and millimetre (mm) criteria, respectively) that agree with results from hydrodynamical simulations (e.g. Pillepich et al., 2018; Lagache, 2018), uncertainties regarding higher redshifts () still remain (e.g. Magnelli et al., 2019; Gruppioni et al., 2020). For instance, studies of UV-selected galaxy samples (e.g. McLeod et al., 2016; Ishigaki et al., 2018) estimate a steep decline in the SFRD at , while other works employing far-IR radio selection criteria (e.g. Viero et al., 2013; Rowan-Robinson et al., 2016; Novak et al., 2017; Malefahlo et al., 2022) or gamma-ray-burst-selected samples (e.g. Yüksel et al., 2008; Kistler et al., 2009) suggest a flatter behaviour.
These uncertainties may originate from our current instrumentational limitations, including low sensitivity, coarse spatial resolution, and coverage of small parts of the sky, which hinder our ability to properly characterise distant objects and obtain a statistically unbiased sample at higher redshifts. For instance, observations based on telescopes such as the Herschel Space Observatory (Pilbratt et al., 2010) or the Submillimetre Common-User Bolometer Array (SCUBA; Holland et al., 2013) are bound to limit the redshift detection to (e.g. Donevski et al., 2018), and to uncover only the very bright end of the far-IR luminosity function (e.g. Gruppioni et al., 2013; Wang et al., 2021). On the other hand, more sensitive telescopes, such as the Atacama Large Millimeter/submillimeter Array (ALMA; Wilson et al., 2019) or the Northern Extended Millimeter Array (NOEMA; Chenu et al., 2016) are limited to smaller areas. Thereby, these telescopes provide fewer objects (e.g. Dunlop et al., 2017; Faisst et al., 2020; Casey et al., 2021) and reveal a fainter star-forming galaxy (SFG) population (e.g. Pantoni et al., 2021). Nevertheless, recent studies using the capabilities of both single telescopes and interferometers have pushed the limits of our current understanding regarding the star formation (SF) history, exposing a mm dusty galaxy population at (see e.g. Donevski et al., 2018; Yamaguchi et al., 2019; Gruppioni et al., 2020).
Another aspect of our current limitations regarding the accurate estimation of the SFRD at high redshifts might be hidden in the selection criteria that are currently used to detect SFGs. Various methods have been employed over the years in order to detect this galaxy population (e.g. Gruppioni et al., 2013; Bouwens et al., 2015), however, the bulk of the research is focused on the detection of Lyman-break galaxies in the rest frame UV and the application of dust-correction low-redshift empirical relations for the derivation of their star formation rates (e.g. Bouwens et al., 2015; Oesch et al., 2018). These relations might not be necessarily valid at where the SFG population remains uncertain. Alternatively, recent studies using sensitive far-IR or mm telescopes (e.g. the ALPINE-ALMA survey; Gruppioni et al., 2020) or radio surveys (e.g. Talia et al., 2021; Enia et al., 2022) aim to reveal a an SFG population that has so far remained undetected in the optical/UV bands, which is estimated to significantly contribute to the SFRD at (e.g. Gruppioni et al., 2020). In order to obtain accurate SFR estimates, these studies separate the SFG from the AGN population (e.g. Lanzuisi et al., 2017; Gruppioni et al., 2020) by removing the AGN contribution from the IR luminosity. However, this approach can introduce a bias in the sample. Interestingly, results from the recent surveys of the James Webb Space Telescope (JWST) (e.g. Harikane et al., 2023; Nakajima et al., 2023; Pérez-González et al., 2023; Rodighiero et al., 2023) reveal a dusty-galaxy population like this at even higher redshifts (i.e. ) that have not been explored before.
Previous studies, such as the work by Duncan et al. (2019), indicated that the galaxy pair and merging ratio increases with redshift (from at to at and for ). Therefore, in this work, we question the strategy of removing AGN-contaminated radio sources from selected samples as this approach may overlook merging systems in which the AGN emission conceals an additional SFG population that could significantly contribute to the SFRD at high redshifts. Such galaxies could be detected from the identification of far-IR bright Herschel galaxies along with a radio emission. Even though these selection criteria might favour sources with cold gas and negative k-correction, their application to fields with deep coverage (e.g. the COSMOS field; Scoville et al., 2007) along with photometric data and high spatial resolution information from telescopes such as the Hubble Space Telescope (HST) and ALMA could potentially reveal a population of SFGs that would be omitted by the current selection criteria because of the AGN contribution of a neighbour galaxy.
In an attempt to explore new techniques to assist radio surveys reaching , we present a complementary study combining the radio selection and far-IR peak spectrum criteria (e.g. Yan et al., 2022). Furthermore, we suggest that at , a substantial amount of star formation occurs that is hardly revealed from optical or near-IR surveys, and which is consequently excluded by the current selection methods due to the AGN contribution in the system. In more detail, we explore a sample of far-IR radio-emitting galaxies, detected in the COSMOS and ECDF-S fields, that might uncover interacting systems and merging galaxies with a substantial contribution of an AGN component, along with the presence of high star formation activity. If radio emission can help to pinpoint this important ‘missing’ SF component, upcoming radio surveys, such as the Evolutionary Map of the Universe (EMU) survey (e.g. Norris, 2009; Norris et al., 2021) as well as novel selection criteria in the radio (e.g. Talia et al., 2021; Enia et al., 2022) could become even more important to our understanding of the SFRD at .
The paper is structured as follows: in Sect. 2 we present the method and criteria that were employed in the selection of the original sample and the subsequent reduction of the sample to the high-redshift far-IR radio candidates. Section 3 briefly highlights the photometric and spectroscopic properties of the sample, along with the results obtained from various properties of the entire sample. In Sect. 4 we compare our work with previous studies and provide a brief discussion of the results, emphasising the importance of the merging population for SFRD estimations. Finally, we provide the conclusions of this study in Sect. 5 and discuss future prospects regarding our method. Throughout this paper, we assume a -CDM cosmology using , , and .
2 Sample selection
For our selection, we examined two of the most deeply explored extra-galactic fields that were observed under the projects Extended Chandra Deep Field-South (ECDF-S; Lehmer et al., 2005) and Cosmic Evolution Survey (COSMOS; Scoville et al., 2007). In past years, these two fields have been extensively observed in a wide range of electromagnetic frequencies, ranging from X-rays to radio waves. Radio data were obtained from both fields at 1.4 GHz with the VLA (VLA-COSMOS; the flux density limit is 7 and VLA-ECDF-S; the flux density limit is 7.4 ; Schinnerer et al., 2010; Smolčić et al., 2017; Miller et al., 2013) at an angular resolution of .
The far-IR wavelength regime, which is necessary for our selection, is available through the Herschel Multi-tiered Extragalactic Survey (HerMES; Oliver et al., 2012). This survey covered a total of 380 using the two main instruments on board Herschel , namely the Spectral and Photometric Imaging Receiver (SPIRE; Griffin et al., 2010; Nguyen et al., 2010, ; at 250, 350 and 500 ; the confusion noise level is , and , respectively) and the Photodetector Array Camera and Spectrometer (PACS; Poglitsch et al., 2010, ; at 100 and 160 ; the detection limits are and , respectively). The ECDFS and COSMOS fields are also included in the covered area of HerMES, comprising a total of . Previous studies using HerMES data have demonstrated the efficient use of Herschel’s far-IR fluxes for detecting high-redshift () dusty galaxies. For instance, Dowell et al. (2014) employed simple criteria for the increasing fluxes for the 250, 350, and 500 bands, which is indicative of a far-IR peak at longer (redshifted) wavelengths, revealing a dusty SF galaxy population with a mean redshift distribution of .
To identify potential high-redshift hybrid AGN-SFG systems, we conducted a cross-match analysis between the VLA COSMOS and ECDF-S 1.4 GHz catalogues with those of HerMES, applying a maximum separation of 18 arcsec (motivated by the beam size of Herschel at 250 of 18.1 arcsec). The resulting cross-matched sample contained 2292 sources for COSMOS, and for the ECDF-S field is provided 769 sources. This sample was further reduced by considering robust radio sources (signal-to-noise ratio; S/N¿5) without an indication for extended or multicomponent radio emission (according to each catalogue; for more details, see Lehmer et al., 2005; Scoville et al., 2007). To ensure the correspondence between radio and far-IR emission, we excluded from the sample sources that present multiple radio detections within one Herschel beam. Furthermore, only sources with 250, 350, and 500 flux errors smaller than 50 were accepted, which ensured that the shape of the far-IR emission was properly determined. This selection method resulted in 219 and 93 sources for COSMOS and ECDF-S, respectively.
Furthermore, motivated by the efficacy of studies such as Dowell et al. (2014) and Donevski et al. (2018) in selecting high- dusty SF galaxies, we adopted a similar method to identify sources with , which would translate into a potential redshift. This selection method resulted in a sample of 53 and 30 galaxies (see Fig. 1) for the COSMOS and ECDF-S fields, respectively. The radio 1.4 GHz and far-IR () images of each of these sources were visually inspected in order to secure the robustness of the matching process and identify potentially uncertain or confused radio/far-IR detections. We confirmed that all 83 selected sources display compact morphologies both in the radio and in the FIR, and that the detected counterparts are robust, with average separations between the radio and far-IR detections below arcsec.
High-redshift candidates
Application of these far-IR criteria resulted in a sample of sources from both fields for which we retrieved possible photometric or spectroscopic identifications from the literature. For this exploration, we consulted Simbad (Wenger et al., 2000), the NED111\hrefhttps://ned.ipac.caltech.eduhttps://ned.ipac.caltech.edu online search tools, and the Cosmos2015 (Laigle et al., 2016) online catalogue222\hrefhttps://irsa.ipac.caltech.edu/cgi-bin/Gator/nph-scan?projshort=COSMOShttps://irsa.ipac.caltech.edu, retrieving redshift values from sources that are within 2 arcsec of our candidates.
From this analysis, we found 18 sources in the ECDF-S and 19 sources in the COSMOS field with spectroscopic redshift determination. Five of these radio sources present a spectroscopic redshift of , namely J033140.1-275631 (ECDF-S field; =5.14; Suh et al., 2015), J100028.71+023203.7 (COSMOS field; =4.76; Hasinger et al., 2018), [LBX2017] 214 (ECDF-S field; =3.74; Iwasawa et al., 2012), COSMOSVLA J100256.53+021158.4 (COSMOS field; =3.503; Pâris et al., 2014), and [DSS2017] 554 (ECDF-S field; =3.1988; Danielson et al., 2017). The reported spectroscopic redshifts of the two highest- sources, however, are not reliable. For instance, the candidate with the highest redshift, found in the ECDF-S, reveals contradicting spectroscopic measurements. More specifically, the value (derived from near-IR spectroscopy; Suh et al., 2015) contradicts Coppin et al. (2012) and Danielson et al. (2017), who estimated a lower spectroscopic value of (with spectra from optical and far-IR wavelengths) for this candidate. Because a high-redshift nature of this source cannot be excluded, we further explored its available spectra. This investigation indicated that the emission line responsible for the =5.137 solution can be also interpreted as an emission line at =1.617, which further supports the notion for the intermediate-redshift solution derived in the literature. Therefore, we considered this source as an intermediate-redshift galaxy and did not explore it further.
| Source name | Abbreviation | RA | DEC | ||||
|---|---|---|---|---|---|---|---|
| – | – | [deg] | [deg] | [mJy] | [mJy] | [mJy] | [mJy] |
| CVLA J100256.53+021158.4 | CVLA1002 | 150.73553 | 2.19963 | ||||
| ALESS J033152.49-280319.1 | ALESS14 | 52.96871 | -28.05531 | ||||
| CVLA J100004.81+023045.2 | CVLA1000 | 150.0200 | 2.51255 | ||||
| CVLA J095845.94+024329.2 | CVLA958 | 149.69144 | 2.72479 | ||||
| CVLA J100233.16+020626.5 | CVLA100 | 150.63817 | 2.10736 | ||||
| CVLA J100028.75+023203.5 | CVLA028 | 150.11958 | 2.53438 | ||||
| ALESS J033211.34-275211.9 | ALESS33 | 53.04738 | -27.87003 | ||||
| DSS2017 554 | ECDFS544 | 53.42108 | -27.92731 |
Likewise, for J100028.71, inspection of its DEIMOS 10k survey spectrum (Hasinger et al., 2018) revealed a very low S/N spectrum without an obvious line detection that could explain the indication. We assumed an erroneous redshift estimate caused by a possible false-positive of the automated feature recognition from the DEIMOS survey. This source is however kept in this work as a high-redshift source, prompted by a photometric redshift determination of by Miettinen et al. (2015). Inspection of the remaining three sources with a spectroscopic redshift higher than 3 revealed that the emission lines used to determine the redshifts of these sources have either a high S/N (i.e. S/N) or are denoted with a secure spectroscopic quality flag. This means that these measurements are accurate.
Our search identifies 12 sources in the ECDF-S field and 34 sources in the COSMOS field based on photometric redshifts from the literature. These results are depicted in Fig. 2, where the histograms for the redshifts of each survey and the total values are plotted with different colours. This figure reveals that our selection favours radio sources around with a distribution that extends to higher redshifts. Four sources of this sample in the COSMOS field have photometric redshifts (identified in the Cosmos2015 catalogue) of (i.e. COSMOSVLA J100233.16+020626.5 with =3.016, COSMOSVLA J095845.94+024329.2 with =3.172, COSMOSVLA J100028.75+023203.5 with =3.175, and COSMOSVLA J100004.81+023045.2 with =3.76). Similarly, in the ECDF-S sample, we identified one source with ¿3, namely ALESS J033152.49-280319.1 (=3.56; Wardlow et al., 2011). These five high-redshift candidates, along with the three sources with a spectroscopic redshift above 3, are presented along with their 1.4 GHz and far-IR HerMES flux densities in Table 1.
We are particularly interested in sources with the highest
redshifts. We therefore decided to further investigate the five sources for which the photo- indicates a nature. Follow-up observations of these sources aimed to improve the redshift determination (for the photometric redshift estimates), and a more detailed analysis of their properties was initiated, using mm observatories from the northern and southern hemispheres (for the COSMOS and ECDF-S fields, respectively), the first results of which are described in the following section.
The comparison of our acquired spectroscopic/photometric redshift values for our sample with the corresponding values from alternative photometric catalogues in the literature is a valuable exercise. This comparison is presented in more detail in Appendix A and indicates that the COSMOS and the ECDF-S fields do not contain additional candidates at that our analysis could have miss-identified at lower , and the nature of the five sources with photo- considered here is confirmed. Therefore, we are more confident that the sources that are presented in the following sections are the only ones with that could be selected with our selection criteria from the two fields of study.
3 Results
To characterise the morphological and physical properties of the eight high-redshift galaxies under investigation, a detailed examination of the available photometric and spectroscopic data from the literature was conducted. Simultaneously, follow-up observations were initiated, in particular, using millimetre facilities. The results are described below.
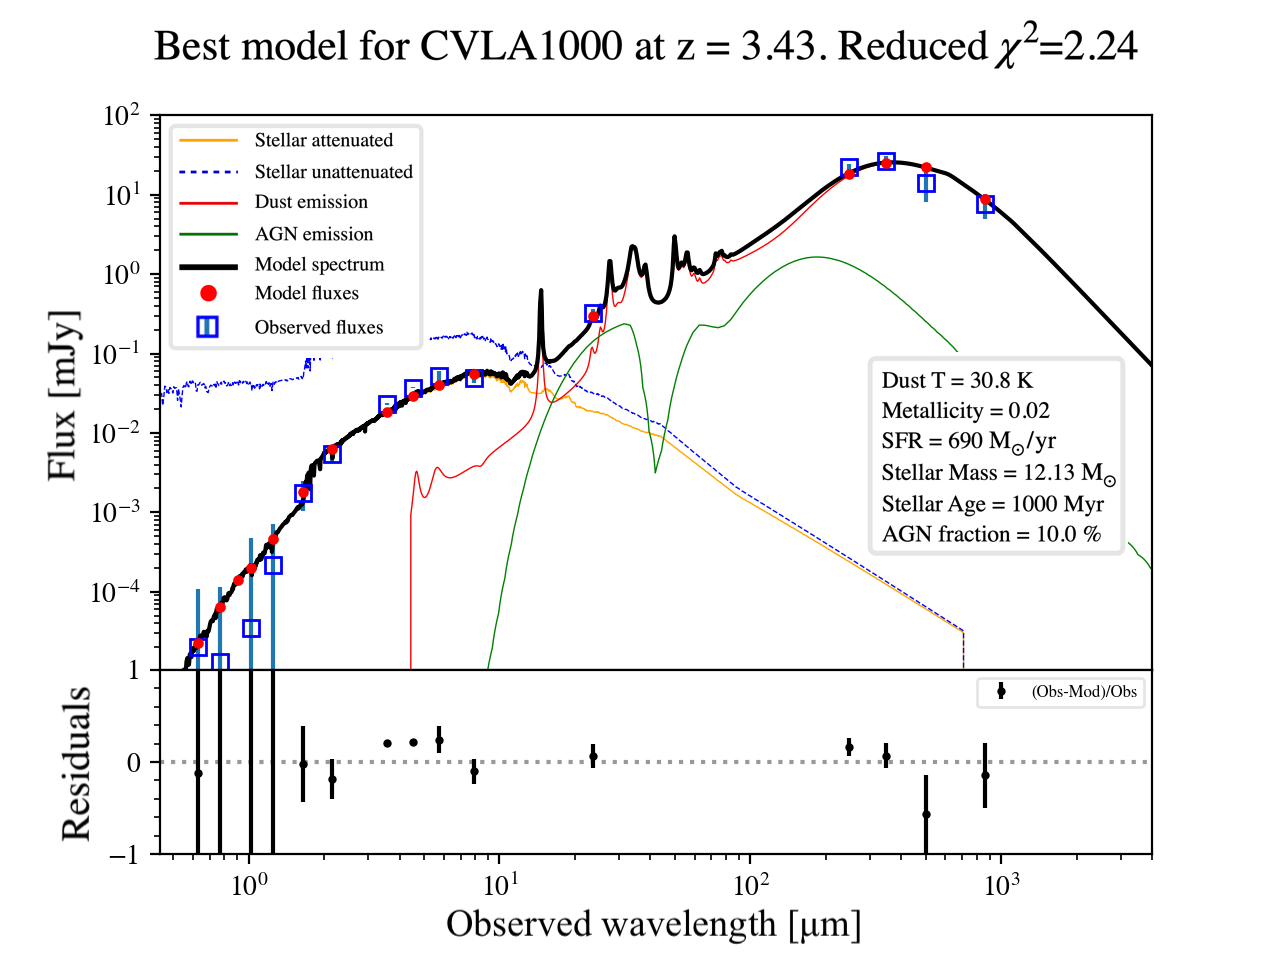
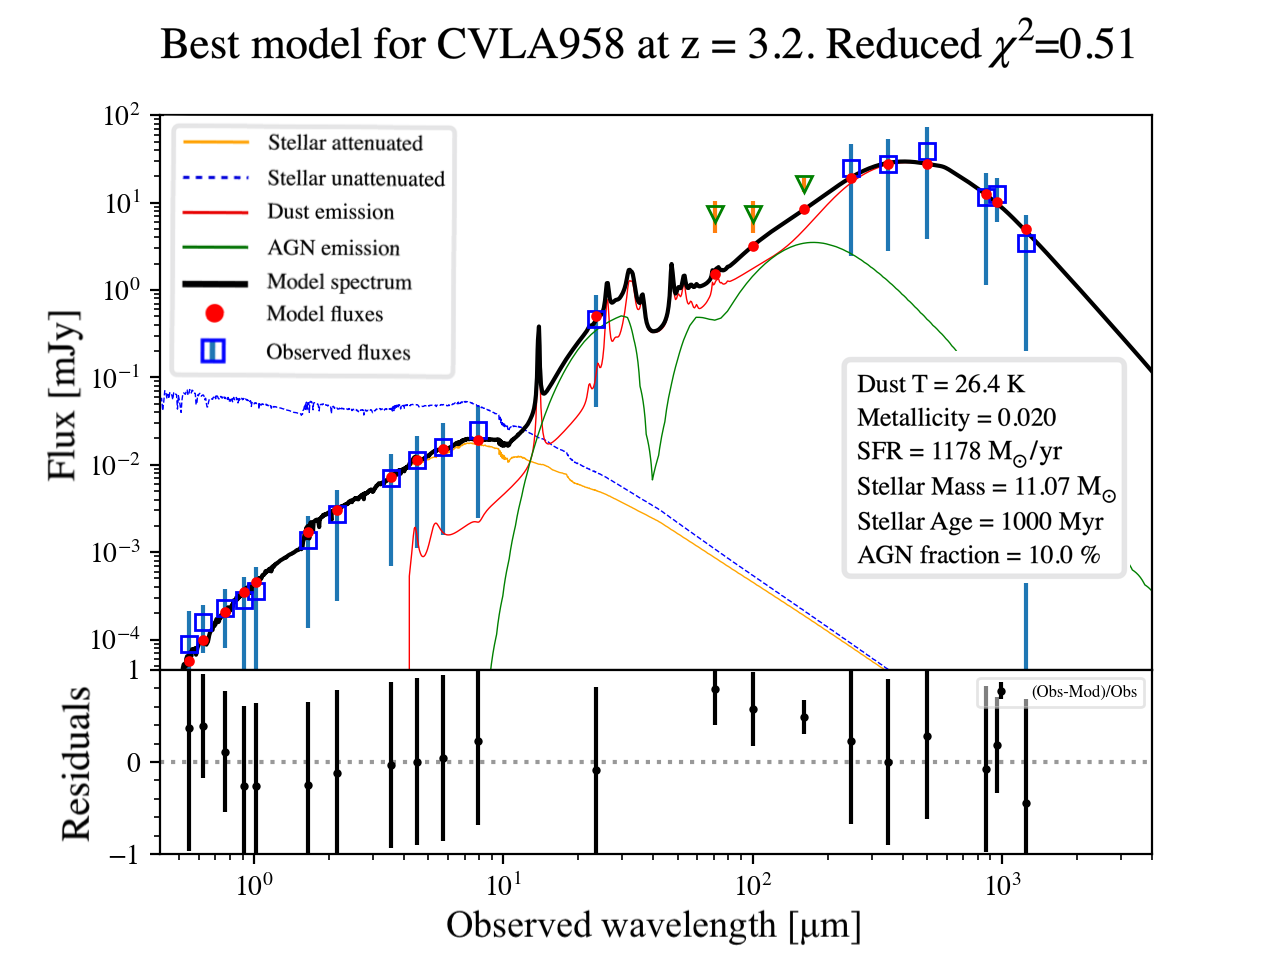
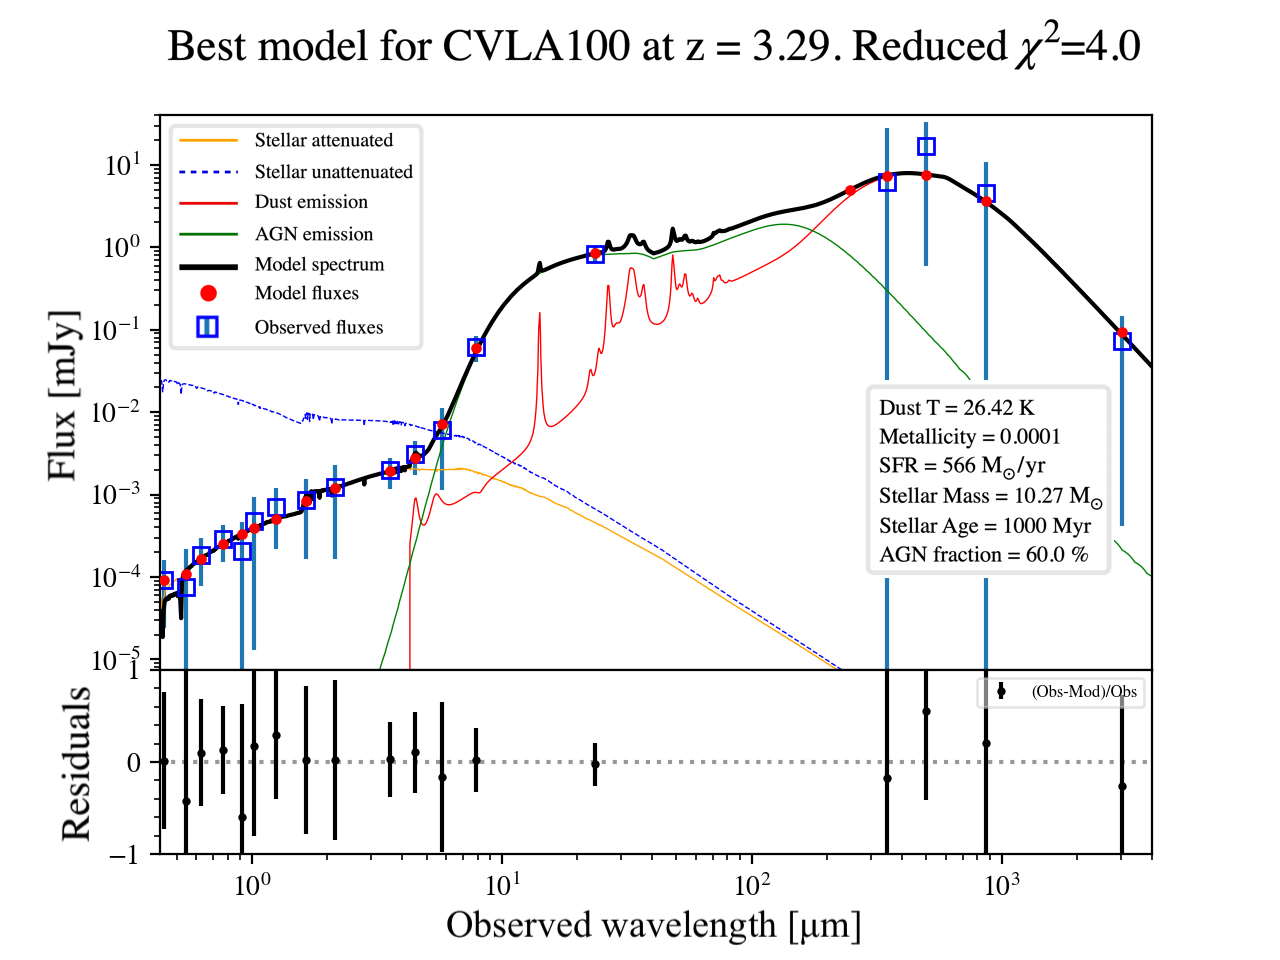
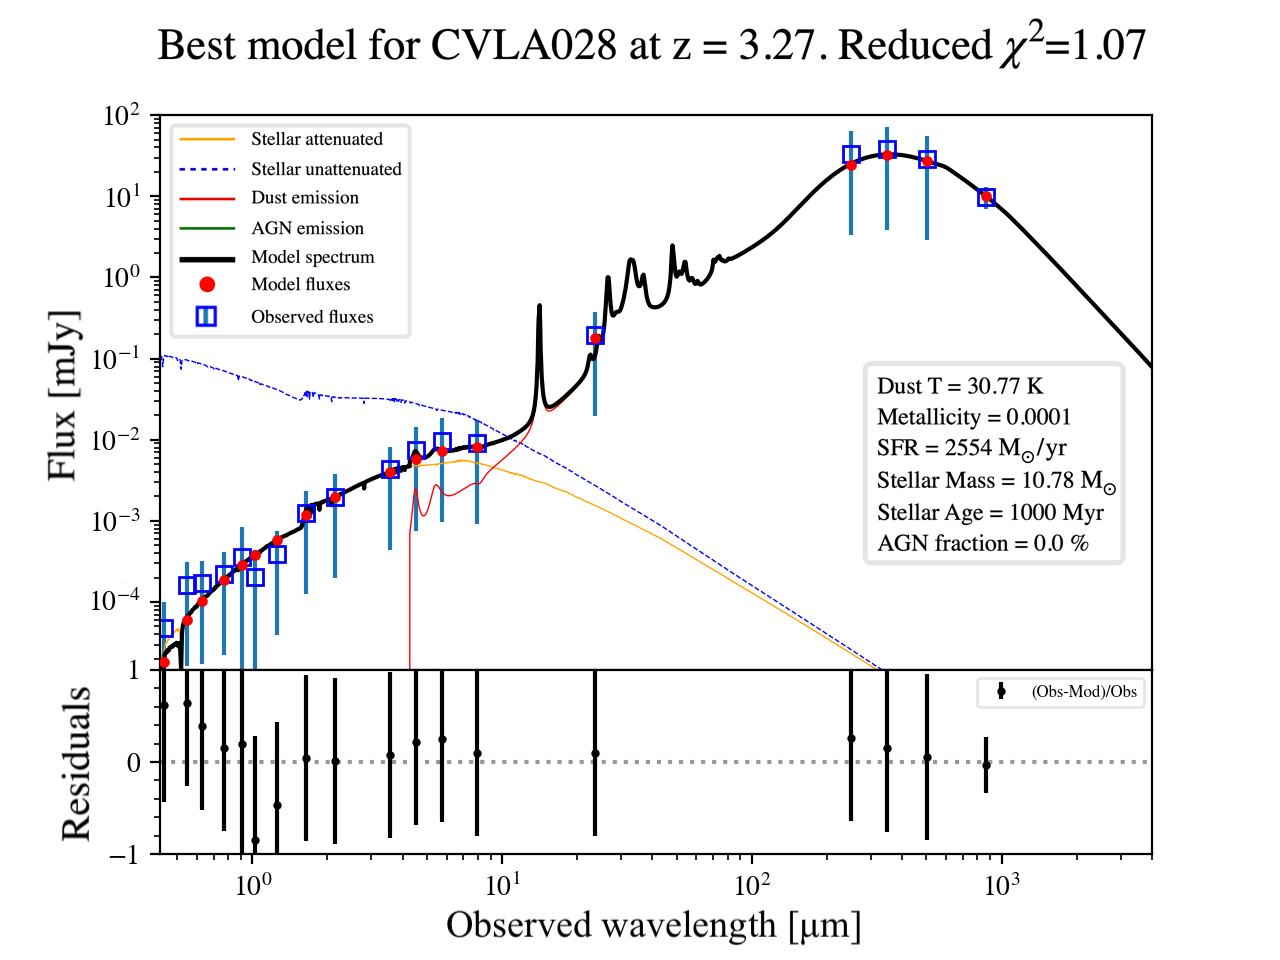
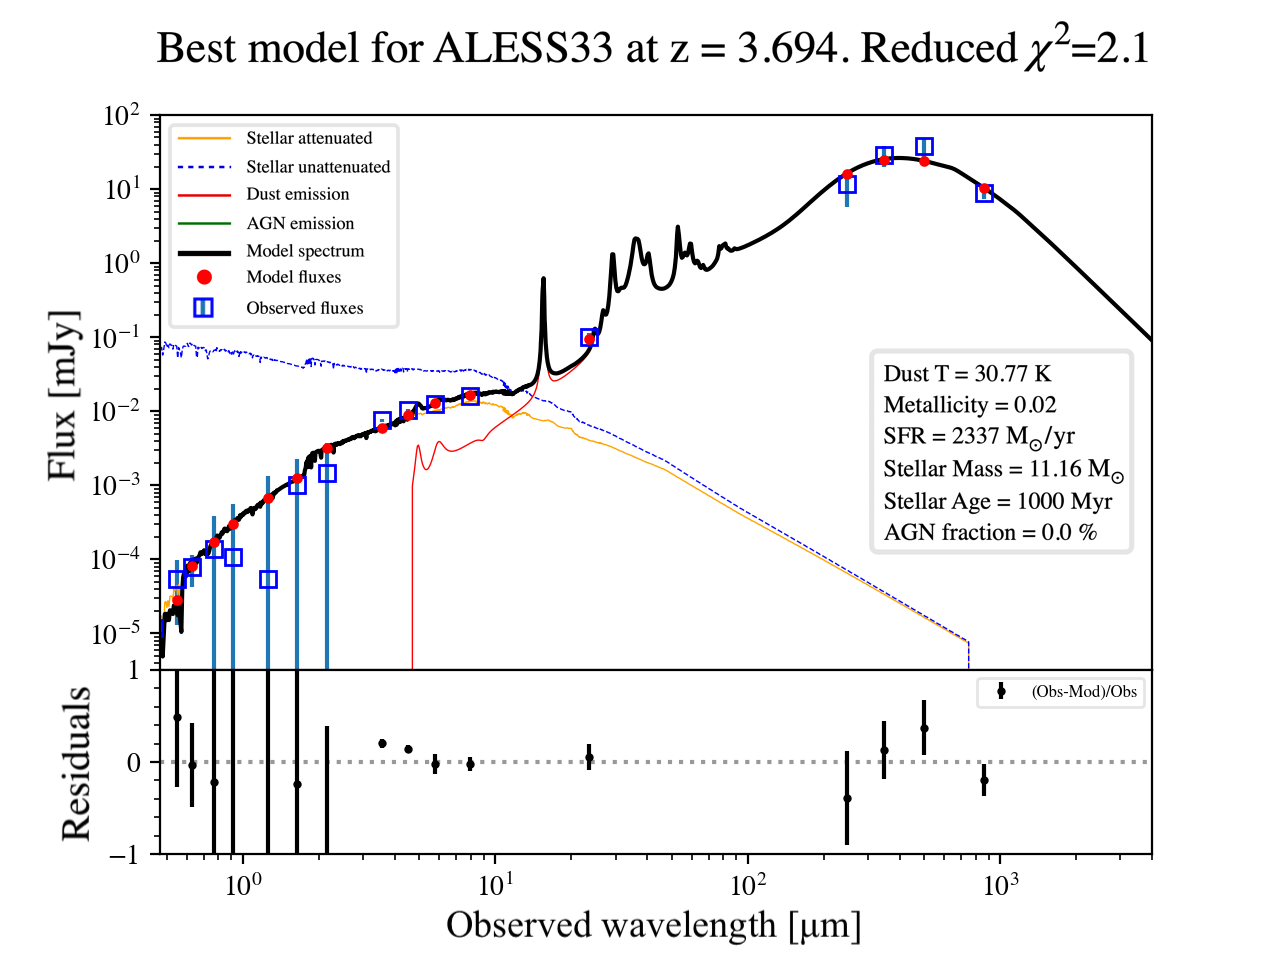
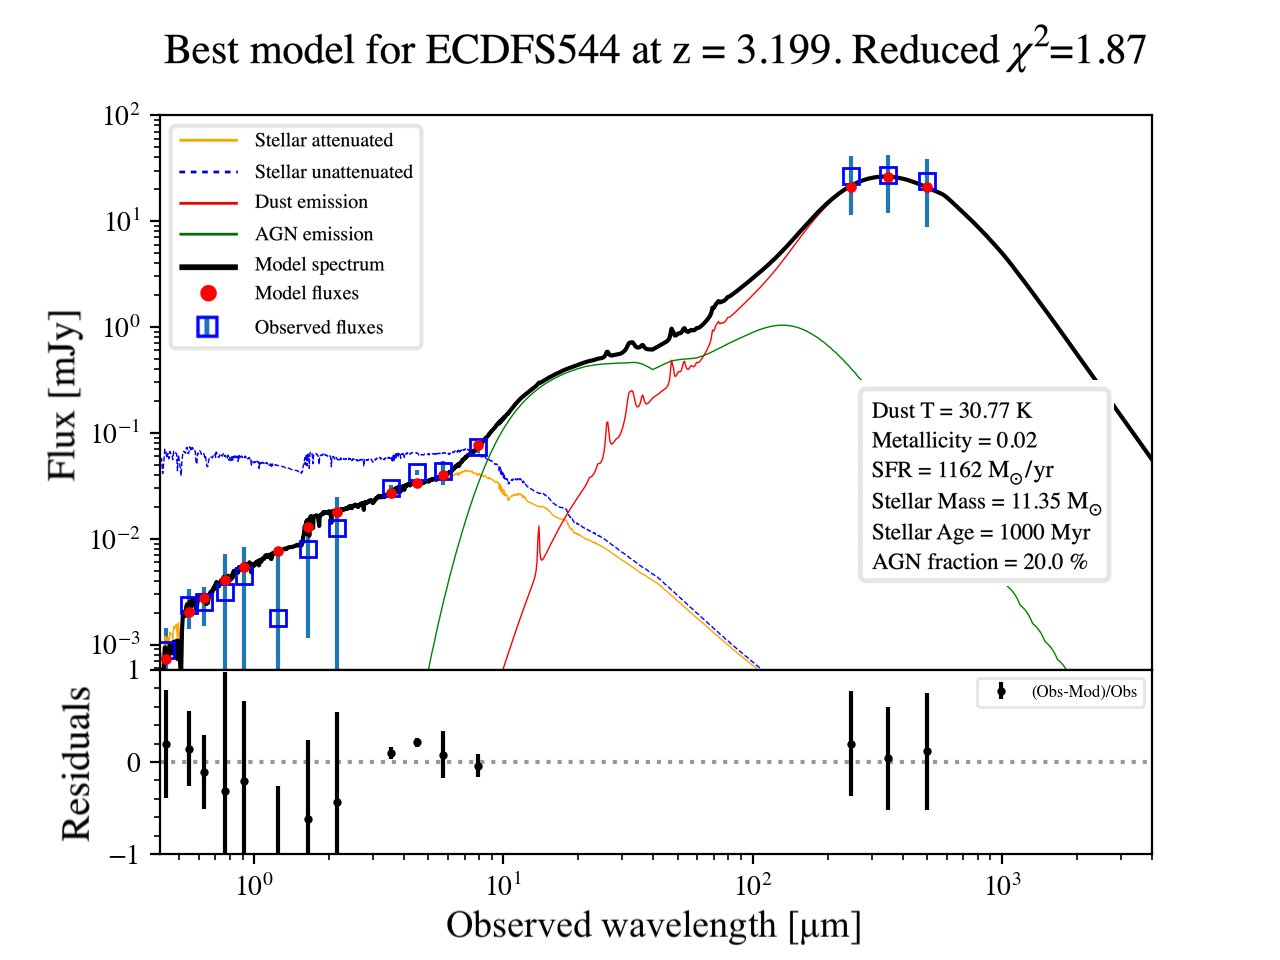
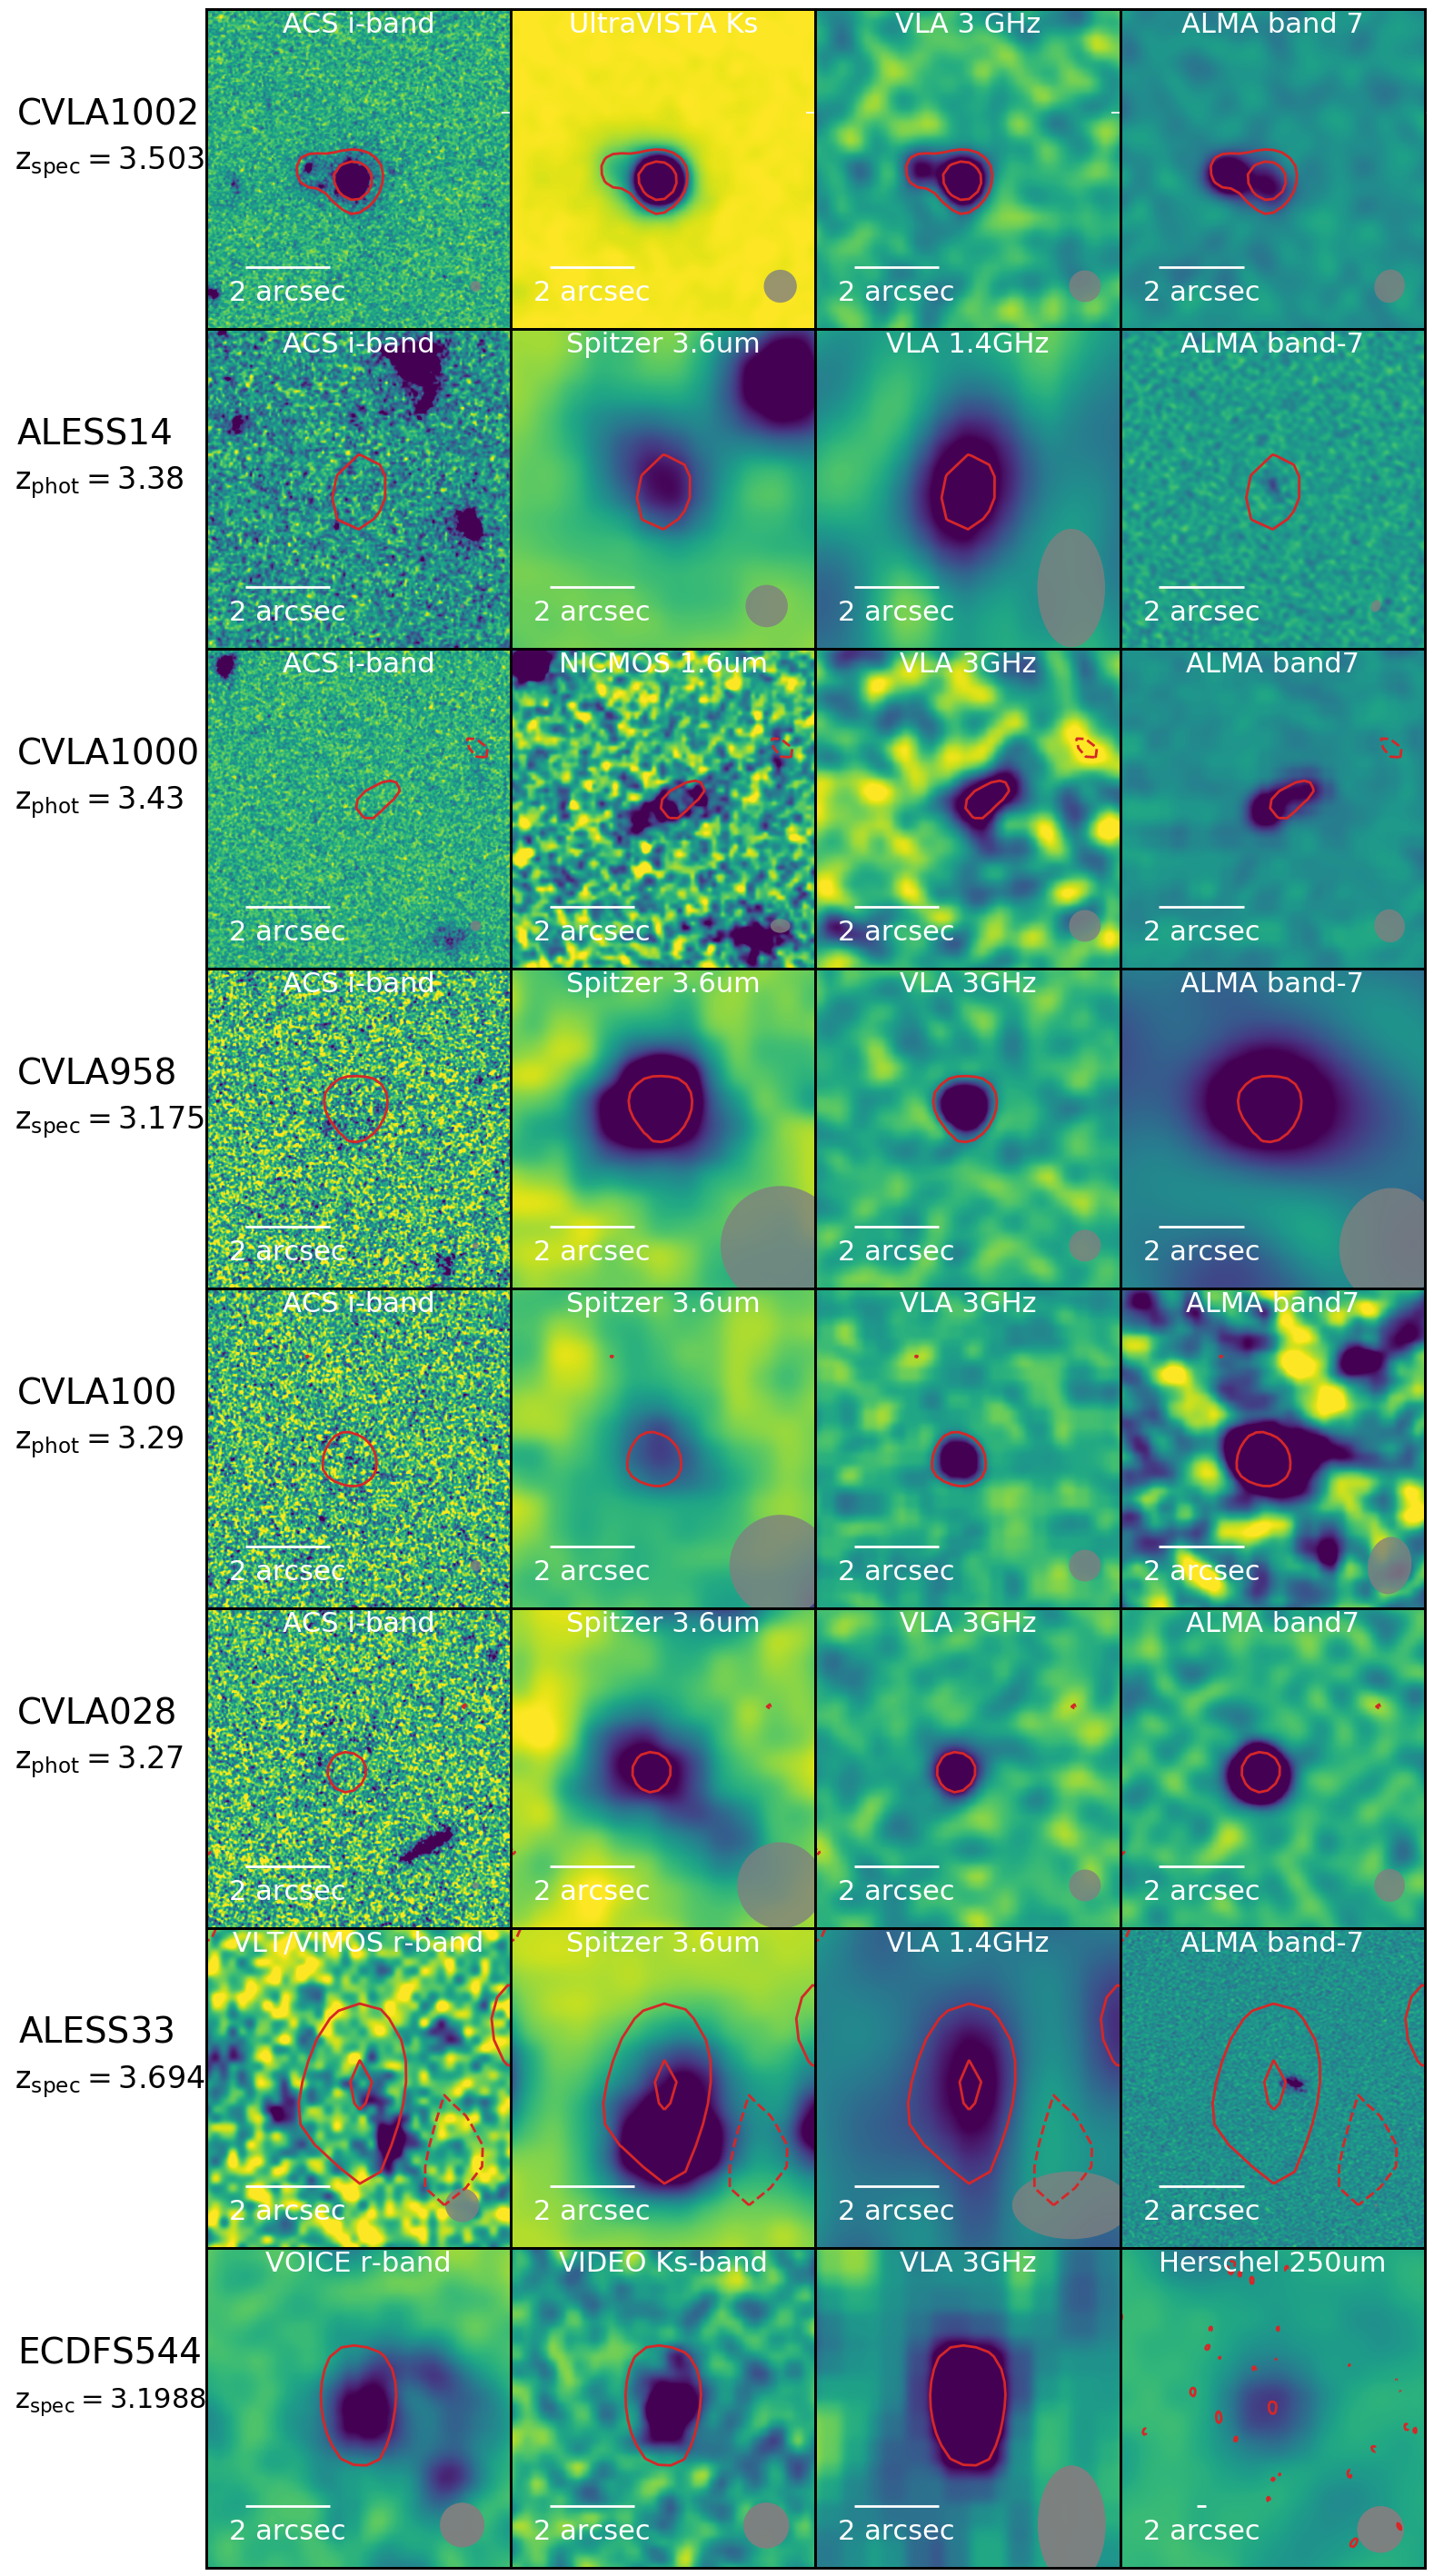
During this analysis, a spectral energy distribution (SED) fitting analysis was performed for each galaxy in the sample using CIGALE (Noll et al., 2009; Serra et al., 2011). The resulting fits yield two values for each modelled physical property of a galaxy (e.g. stellar mass and redshift), one corresponding to the best-fit solution and another that is derived through a Bayesian statistical analysis. In the following text, we refer to the best-fit values when presenting the sample, while the Bayesian-derived estimates along with their corresponding uncertainties are introduced in Table 3. The images of the eight sources for four different photometric bands (optical, near-IR, radio, and mm wavelengths) are presented in Fig. 4. For each wavelength regime, the observations with the highest available spatial resolution were selected.
3.1 SED fitting results
The SED fitting analysis was conducted using the CIGALE software, employing consistent input models and parameters for the entire sample. The data fluxes from the Cosmos2015 catalogue were used in the analysis, while the radio information as well as any nebular emission component were not taken into consideration. For the sources that have been identified spectroscopically in the literature (i.e. CVLA1002, CVLA958, ALESS33, and ECDFS544), the redshift input was fixed to the corresponding spectroscopic value. From the remaining galaxies, ALESS14 and CVLA1000, the redshifts were fixed to the photometric values retrieved from the literature, while for CVLA100 and CVLA028, the best-fitting SED was selected by introducing intervals. The resulting fits, along with the model parameters used in this analysis, are presented in Fig. 3 and Table 2.
To probe the significance of the AGN contribution, we applied the same fitting strategy using CIGALE without the AGN component. The updated SED fits revealed that for sources that initially required a lower AGN contribution (e.g. CVLA1000), the values changed marginally by approximately . On the other hand, for galaxies such as CVLA100, which presents a substantial AGN contribution, no accurate SED fit could be provided without an AGN component (). Consequently, this exercise demonstrates the necessity of incorporating an AGN component in the SED fit for five out of eight sources, generally leading to improved fits as compared to those obtained without an AGN component.
| Type | Model name | Reference | Parameters used | |||||||
|---|---|---|---|---|---|---|---|---|---|---|
|
sfhdelayed | (Ciesla et al., 2017) |
|
|||||||
| Stellar emission | bc03 | (Bruzual & Charlot, 2003) |
|
|||||||
| Dust attenuation | dustatt2powerlaws | (Charlot & Fall, 2000) |
|
|||||||
|
lycabsorption | (Inoue, 2011) |
|
|||||||
| Dust emission | dl2014 | (Dale et al., 2014) |
|
|||||||
| AGN | fritz2006 | (Fritz et al., 2006) |
|
|||||||
| Redshift | redshifting | (Meiksin, 2006) | redshift=0.01-7.5 (or fixed) |
3.2 Sample presentation
COSMOSVLA J100256.53+021158.4
The COSMOS field deep multi-wavelength data provide the opportunity of examining the structure of this source, which appears to be composed of two galaxies: an optically bright quasar, and a fainter millimetre source (see the top left panel of Fig. 4). Spectroscopic data from the BOSS survey (Reid et al., 2016) secured the detection of the Ly- emission line at a redshift of . Because the BOSS capabilities cannot resolve the two sources in study here, this archival spectrum corresponds to both galaxies. However, considering that the main source (i.e. the quasar) is the brightest galaxy at optical wavelengths, we assume that the emission line and subsequently derived redshift correspond to this source.
Furthermore, inspection of the 3 GHz data reveals that the quasar causes most of the radio flux density emitted from this system with a value of ( of the total), while the second source has a flux density of . When we assume a typical radio spectral index of 0.8 for both sources333, where corresponds to the flux density, is the frequency, and is the radio spectral index, which is 0.8 for pure radio synchrotron emission., the corresponding radio flux density at 1.4 GHz is equal to and . Therefore, if both galaxies are located at and the detected radio emission was generated solely from SF, the corresponding SFR (Bell, 2003) would be and for the quasar and SFG, respectively (). According to Lanzuisi et al. (2017), this system of galaxies has a total stellar mass of and of 1549 . The latter value is derived from the far-IR flux integrated at the position of the quasar and is rather close to our SED-fitting, best-derived SFR estimate of 1721 . Curiously, this value is similar to the value derived from the radio for the second source in the system (i.e. ). This is compatible with a system with a powerful quasar and a companion where most of the SF is taking place, and where no AGN is detected.
It has to be noted that for most bands, we cannot separate the brightness contribution from each of the two sources because of the sub-arcsec separation and the insufficient angular resolution of telescopes such as Spitzer. The SED fit was therefore performed using only total fluxes. A separation of the SED fitting analysis for the two sources would be non-trivial and would yield high uncertainties in the fluxes of each source. In the X-ray regime, COSMOS has been observed both with XMM-Newton (XMM-COSMOS survey; Cappelluti et al., 2009) and the Chandra X-ray Observatory (Chandra COSMOS Survey and Chandra COSMOS Legacy Survey; Elvis et al., 2009; Civano et al., 2016), reaching flux limits of and , respectively. The source CVLA1002 has been observed and detected by the Chandra COSMOS survey with a flux of (see Marchesi et al., 2016).
ALESS J033152.49-280319.1
Based on the current photometric data, this source seems to be a single galaxy, and according to the SED photometric analysis by da Cunha et al. (2015), it has a photometric redshift of , an of 1202 and a stellar mass of . For our photometric analysis, which takes the possibility of an AGN component into account, the estimated best SFR value has a similar value of . Assuming that the galaxy is located at and its radio emission is solely due to star formation, the corresponding SFR from the radio emission would be equal to . A comparison between this value and the value derived from our SED fitting analysis or by da Cunha et al. (2015) suggests that the source hosts intense SF, and an accreting SMBH explains the clear radio excess that is observed. The X-ray energies have been observed in the CDF-S field with XMM-Newton and the Chandra observatories (for more details, see Ranalli et al., 2013; Luo et al., 2017) in deep surveys, resulting in sensitivities of and at 2-10 keV, respectively. However, ALESS14 is not detected in any of these surveys, supporting the view that if an AGN exists, it contributes mostly to the radio emission, and at a much lower level at X-ray and optical/IR wavelengths. This was also suggested by the AGN contribution to the IR emission from our CIGALE SED fit.
COSMOSVLA J100004.81+023045.2
According to the HELP catalogues (Shirley et al., 2021), this source is located at a redshift of 3.43 with an of 1519 , while our SED fitting analysis predicts a lower of 690 . Based on the SED fitting results, modelling of the IR emission of CVLA1000 requires an AGN contribution. According to the Cosmos2015 and Cosmos2020 (Weaver et al., 2022) catalogues, the photometric redshifts are 3.26 and 3.62, respectively. When we accept an average redshift value of for this source, then according to its radio flux density of the should be , which in comparison with the previous estimate from the IR emission strongly suggests an active SMBH at the centre of this galaxy.
Due to its morphology in the near-IR, radio, and mm wavelengths, this source could be classified as a group of galaxies (see the third row of Fig. 4), however, catalogues with large samples of galaxies (i.e. Cosmos2015 and Cosmos2020) identify this galaxy as a single source due to the lack of resolution. With a radial extent of arcsec, measured at the 1.6 - NICMOS data, and a scaling factor of (at ), the actual size of this galaxy can be estimated as . This value is compatible with an ultra-compact dwarf galaxy (e.g. Rodriguez et al., 2021), however, the images reveal a source that resembles a disk rather than a spherical object. Inspection of all the available images cannot exclude the possibility of a merging system, considering that the NICMOS data depict a structure that could resemble a complex of galaxies. No detection in the X-ray bands is reported in the literature for this galaxy.
COSMOSVLA J095845.94+024329.2
Source CVLA958 was recently spectroscopically observed by our team with the Institut de Radioastronomie Millimetrique (IRAM) 30m antenna (project code: 227-19; for more details regarding these observations, see Appendix B). Unfortunately, its mm faint nature prevented us from acquiring a secure redshift determination with the IRAM telescope. According to Cosmos2015, the photometric redshift of this galaxy is , while our photometric analysis suggests a minimum of at 3.21. The latter redshift solution agrees with the only line that is detected from recent ALMA archival spectra (project code: 2019.1.01600.S). The detected emission line at has a full width at half maximum of 0.4 GHz (), possibly indicating a merging system or an orderly rotating spiral galaxy (see Chen et al., 2022, for more details). The recent work by Birkin et al. (2021) also identified the emission line as due to the CO4-3 rotational transition at band 3 of ALMA, locating this source at . According to our photometric SED fitting analysis, this source has a stellar mass of , an SFR of 1177 and a significant AGN contribution. Considering the measured flux density at 1.4 GHz of 90 , we estimate that its (assuming that its radio emission comes purely from star formation) should be . This value is significantly higher than the value determined from the SED fitting (see Table 3 for further details), supporting the presence of an AGN in this source as well. CVLA958 is not detected in any available dataset in the X-ray wavelengths.
| Name | Redshift(1) | Stellar Mass | AGN (2) | (3) | ||||
|---|---|---|---|---|---|---|---|---|
| – | – | [] | [] | [] | [] | [] | [] | – |
| CVLA1002 | ||||||||
| ALESS14 | ||||||||
| CVLA1000 | ||||||||
| CVLA958 | 3382 | |||||||
| CVLA100 | ||||||||
| CVLA028 | ||||||||
| ALESS33 | ||||||||
| ECDFS544 |
(1)(s): spectroscopic redshift; (p): photometric redshift (accepting the solution with the lowest or the best available in the literature), (2): the AGN percentage (Bayesian values) is estimated by our CIGALE fitting and corresponds to the same wavelength range in which the dust luminosity of each source was estimated, (3) this infrared luminosity corresponds to the wavelength range 42-122 m (rest frame), (4) according to equation 5 by Enia et al. (2022):
COSMOSVLA J100233.16+020626.5
The source CVLA100 seems to be a single galaxy as well. Our photometric analysis places this source at a redshift of . This result agrees with the estimates of other photometric catalogues (see Laigle et al., 2016; Weaver et al., 2022). ALMA spectroscopic data acquired by our team (project code: 2017.1.01713.S; see Appendix B for more details) reveal an emission line at , which corresponds to the CO(4-3) emission line with the galaxy located at . For the derived physical properties of this source, our SED fitting analysis indicates a stellar mass of , an SFR of 566 and an AGN fraction of 60 . Application of equation 6 by Bell (2003) provides us with an estimate of the of 2760 . The SED fitting models for this redshift suggest an SFR of , which could mean that the observed 1.4 GHz radio flux cannot be obtained solely from SF, but by a combination of star emission and AGN activity (see Table 3 for additional information). Similarly to CVLA958, this source is not detected at any high-energy band.
COSMOSVLA J100028.75+023203.5
As mentioned in the previous section, this source (which seems to be a single galaxy) has a spectroscopic redshift of 4.76 (see Hasinger et al., 2018), however, inspection of the DEIMOS spectrum does not reveal a secure emission line (i.e. the Ly- line, according to the authors). No further spectroscopic data are available in the literature. Our own photometric SED fitting analysis suggests a redshift of 3.27, which is consistent with the redshift provided by the HELP database and Miettinen et al. (2015). When we assume this photo- to be the true redshift of this galaxy, our SED fit analysis proposes a stellar mass of , an SFR of 2554 and no AGN contribution. The derived SFR from the radio emission of this galaxy (i.e. 2166 ) further supports the argument that no radio emission is added by SMBH activity. This result establishes CVLA028 as the only galaxy in our sample without an indication of an AGN by the SED fit or radio excess. Although this galaxy has been observed by both XMM-Newton and Chandra, the images at all bands reveal no clear detection.
ALESS J033211.34-275211.9
This source is recognised in the literature as an X-ray AGN with faint radio emission. Photometric analysis from various deep surveys (e.g. Guo et al., 2020) reveals a redshift of , while ALMA spectroscopic data (see Birkin et al., 2021) show two clear emission lines (namely the CO4-3 and [CI] lines at and , respectively). This secures the galaxy at . Assuming that this spectroscopic redshift and that a radio flux density of solely originate from star formation, the corresponding SFR is . However, according to Guo et al. (2020), following the SED fitting method using CIGALE, this galaxy is a type II AGN with a stellar mass of , an SFR of (our CIGALE SED fitting analysis suggests a higher value of 1194 ), and an AGN fraction of 72 (our analysis proposes a lower value of 10 ). The source detected in the HST image (see Fig. 4), which is rather close to the ALMA detection (), seems to cause the radio and IR emission (see Wardlow et al., 2011). Therefore, this source could be a complex system of at least two galaxies possibly interacting, with the presence of a radio-quiet AGN and an SFG. Even though ALESS33 is not detected in any of the X-ray surveys, another source lies at a distance of arcsec (named ; see Ranalli et al., 2013, for more details) that seems to be an X-ray bright AGN with a flux of and no counterparts. This X-ray source was spectroscopically identified by Ranalli et al. (2013) at , meaning that it could be part of a merging system along with the sub-millimetre and radio galaxy identified with the source ALESS33.
[DSS2017] 554
This source is present in the VIMOS spectroscopic survey presented by Danielson et al. (2017) with a spectroscopic redshift of 3.1988, which was used in this work as a fixed value for the subsequent SED fitting analysis. This galaxy is placed at the outskirts of the ECD-S field, meaning that it was not selected in the photometric analysis by Guo et al. (2020). Inspection of the VST Optical Imaging of the CDFS and ES1 (VOICE; Vaccari et al., 2016) data for this source in bands r, g, and i (see the bottom row of Fig. 4) suggests the possibility of multiple components. These observations might signify a merging or interacting system. The predicted SFR derived solely from the radio emission is 1520 , while our SED fitting analysis suggests a value of 1162 and an AGN contribution of . No clear detection has been reported regarding the possible X-ray nature of this source.
4 Discussion
We have examined a sample of eight high-redshift dusty galaxies with an AGN component (3 ¡ ¡ 4). The selection process involved using the 1.4 GHz VLA radio catalogues from the COSMOS and ECDF-S fields in combination with the far-IR peak criterion () using the HerMES survey. Moreover, a compact morphology was considered as an additional criterion. In the following paragraphs, we assess the efficacy of these criteria in selecting these sources. Furthermore, we provide a comparison between the derived properties of our sample with those obtained in previous studies, focusing on similar redshift ranges.
4.1 Validity of the selection criteria
While the compactness criterion merely serves as a method for avoiding local extended galaxies, the far-IR and radio criteria have been employed extensively in the past in the study of the distant Universe. For instance, Amblard et al. (2010) demonstrated that the redshift of a source tends to increase for galaxies that satisfy the criteria and . These results are expected, considering that the far-IR emission of an SED traces the dust content of a galaxy, and more specifically, its blackbody radiation, which is shifted to higher wavelengths with increasing redshift. However, this emission is affected by the temperature of the dust as well, which consequently introduces a degeneracy that is non-trivial to break. Another point of attention is the sensitivity of the Herschel surveys, which are inherently biased towards the detection of the brightest dust-rich far-IR galaxies.
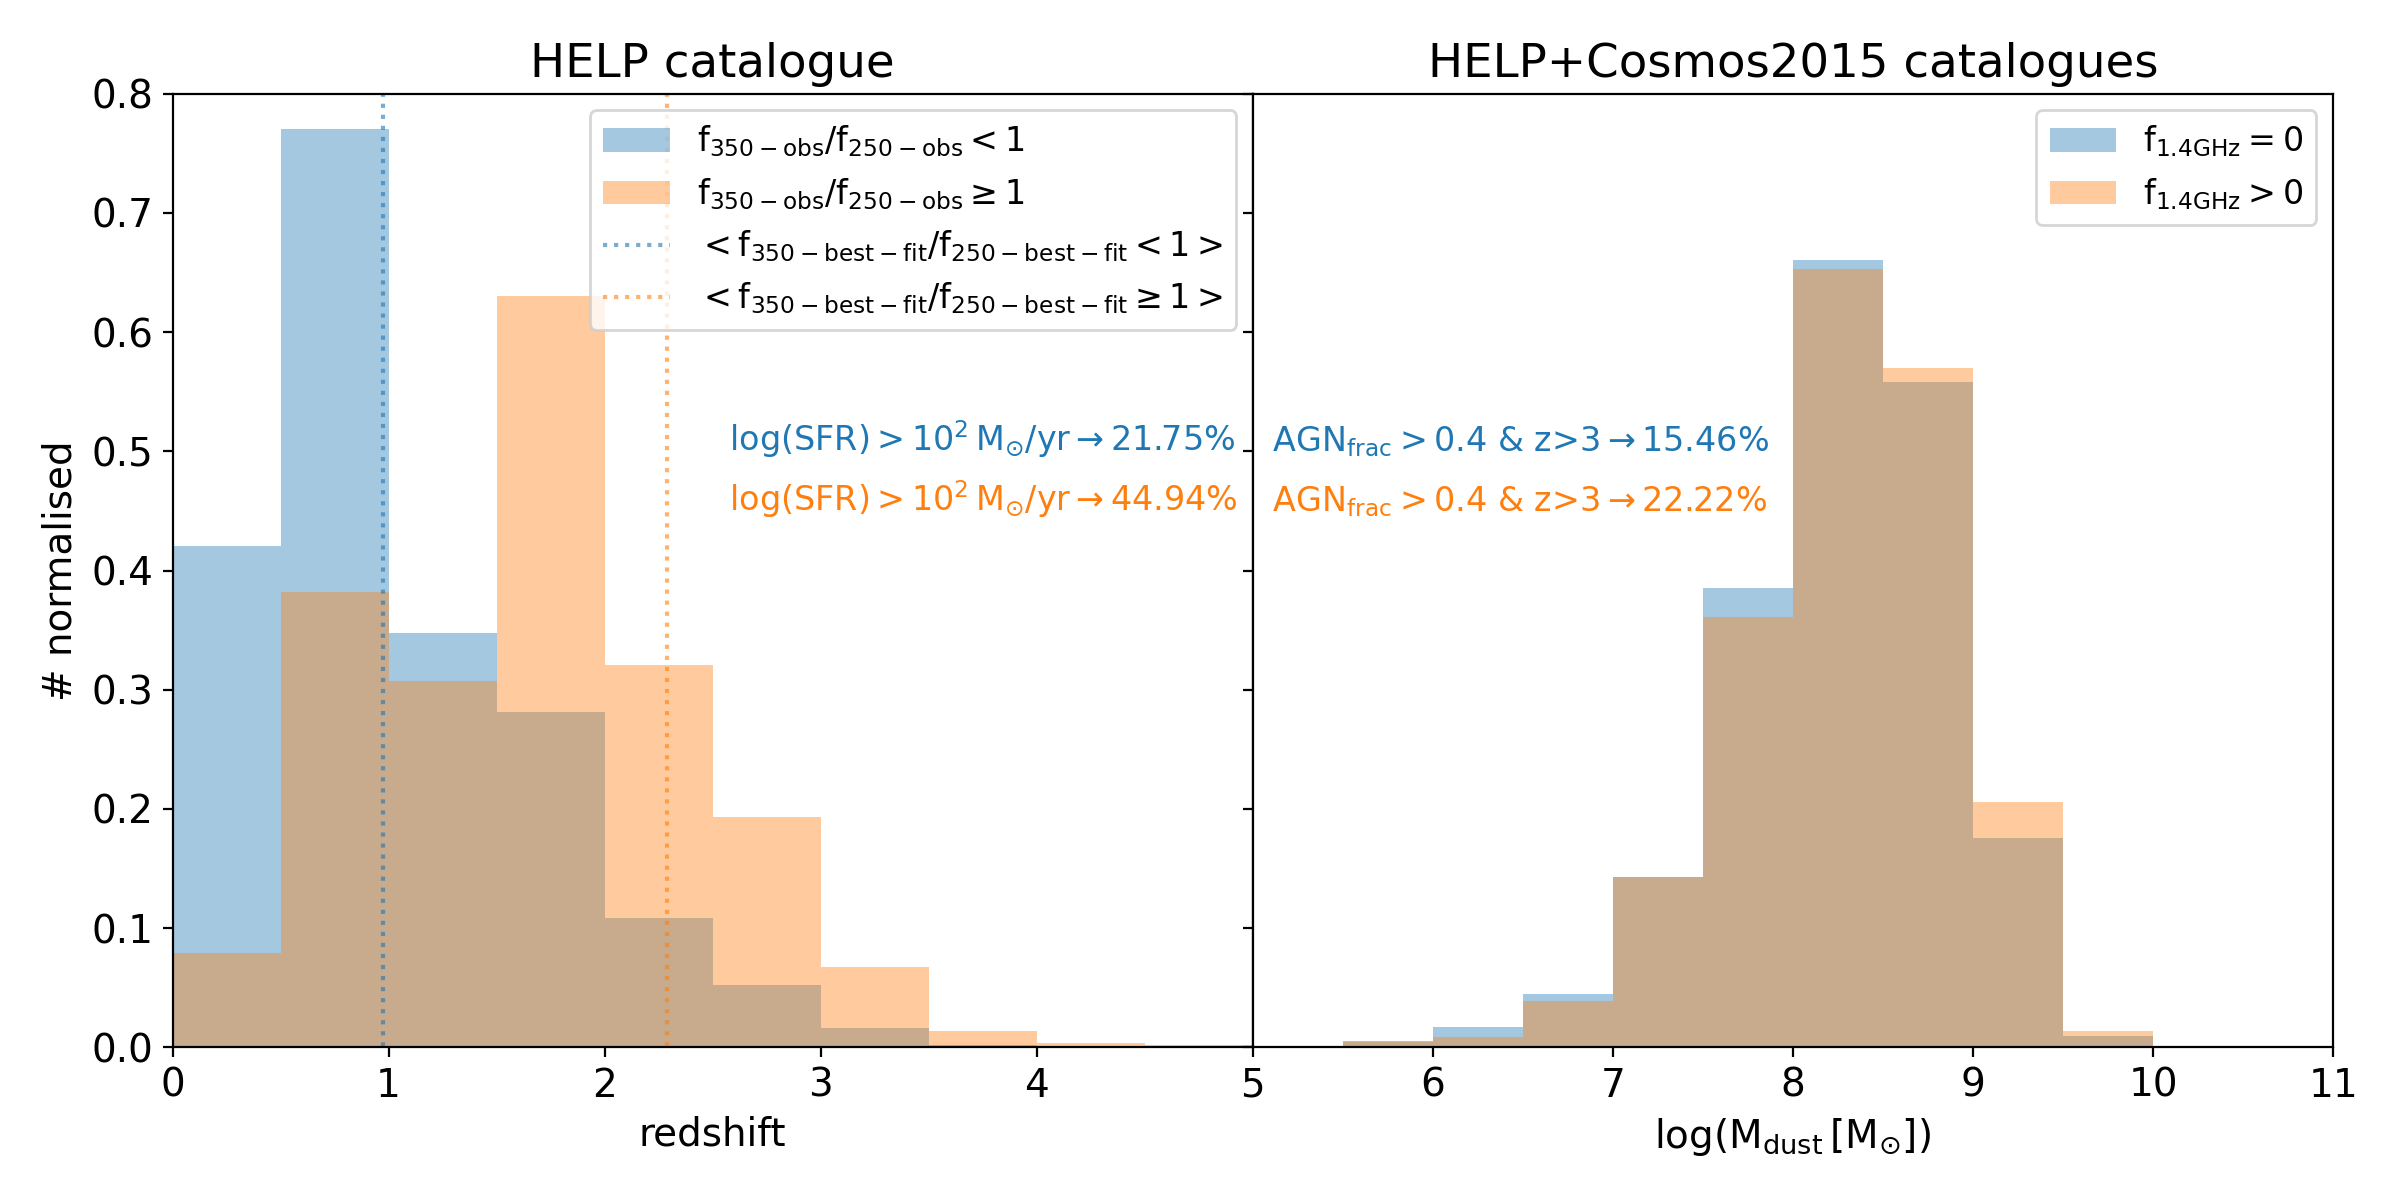
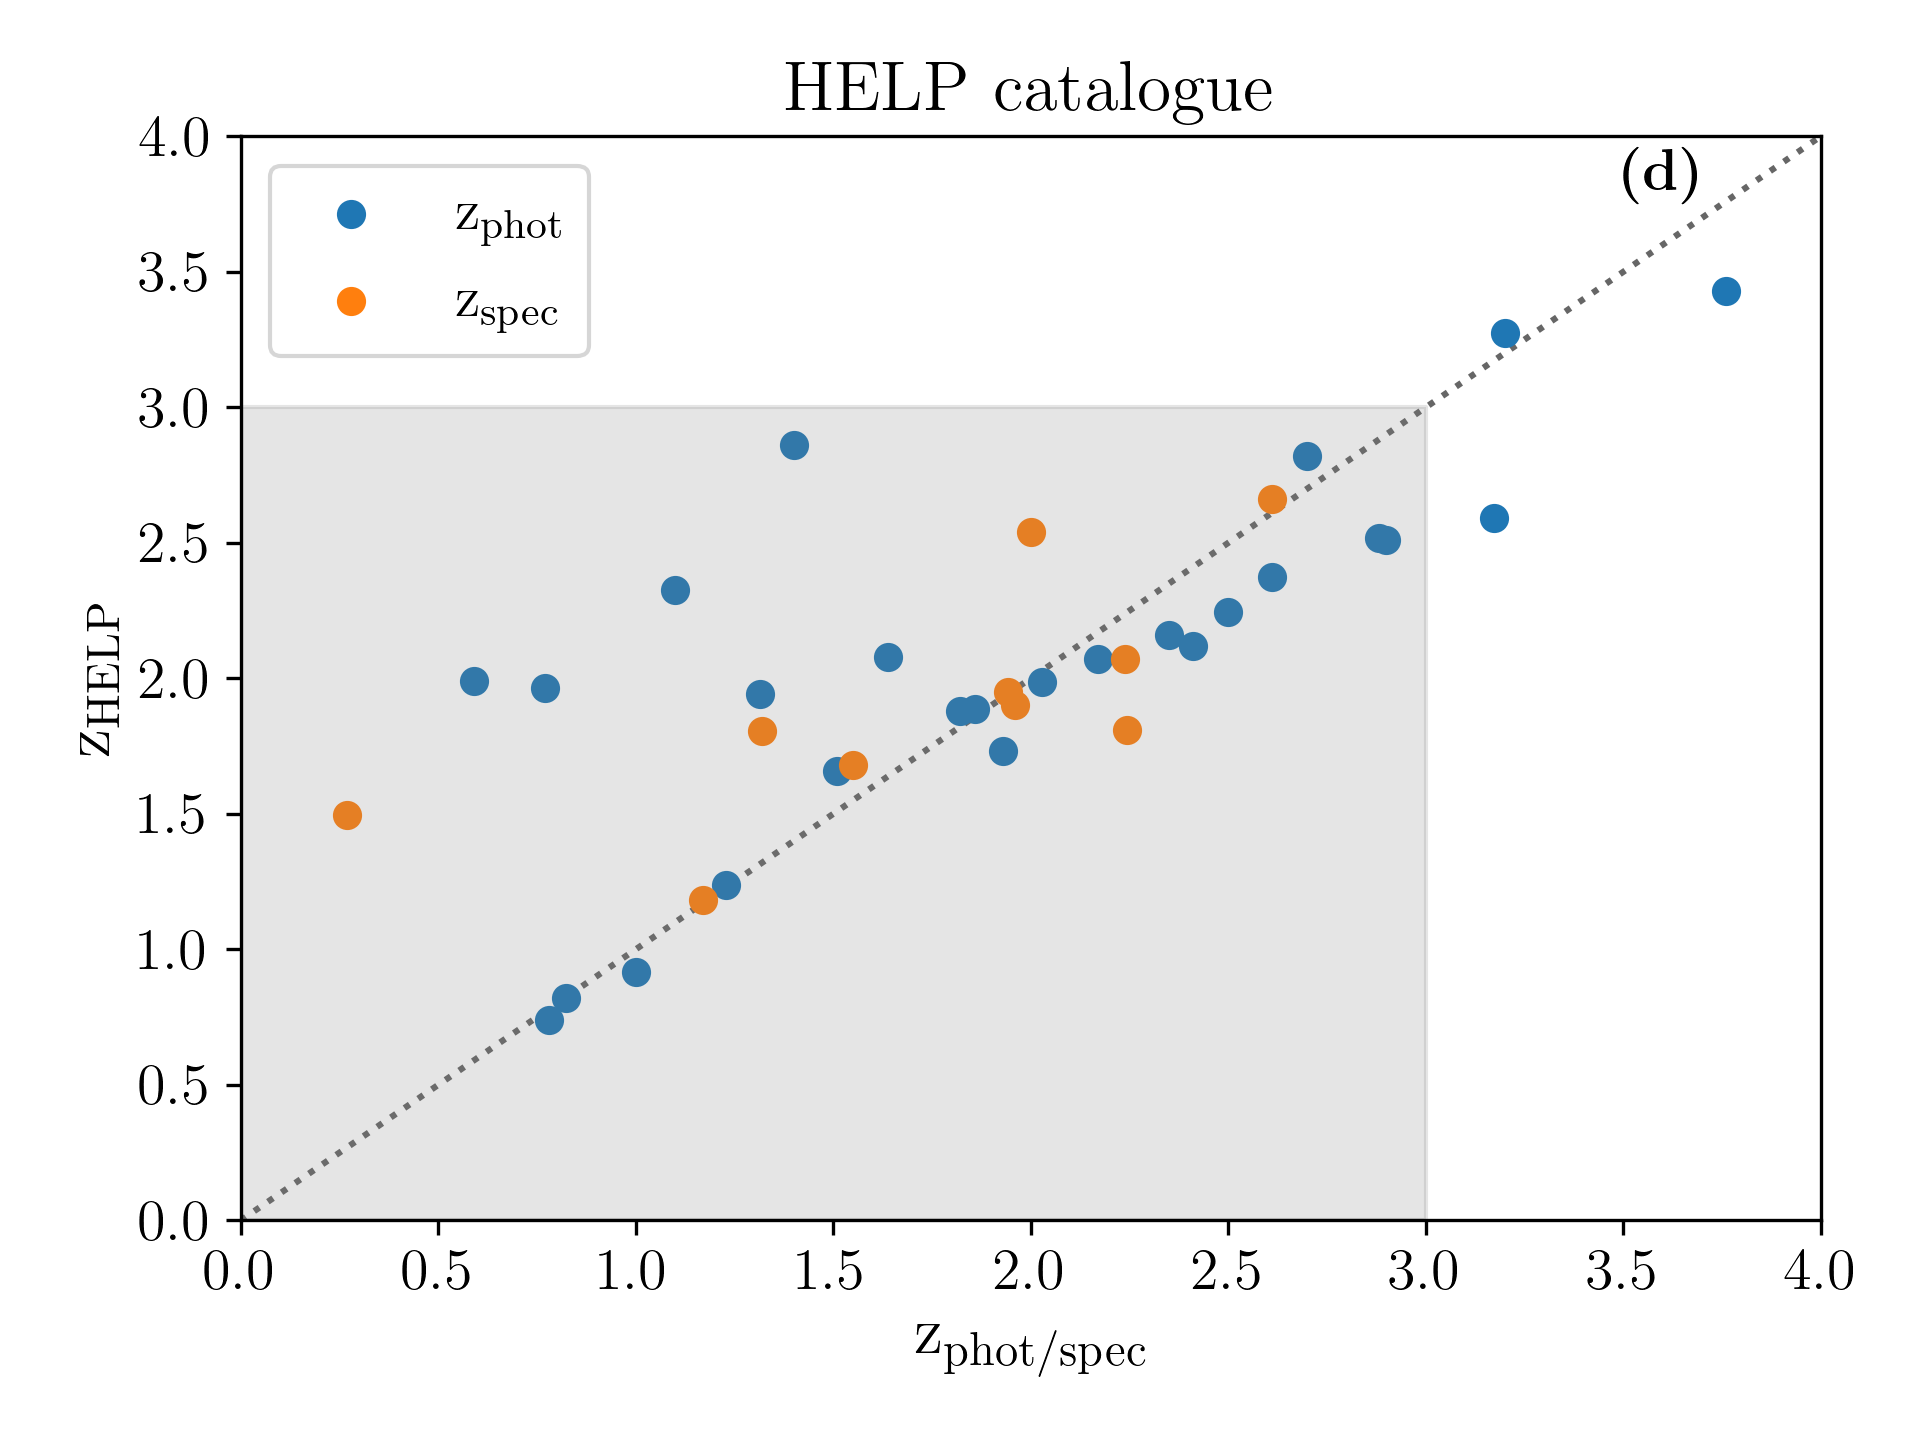
In order to evaluate this argument and selection method further, we employed the HELP catalogue, which contains far-IR observational data (i.e. 15747 Herschel detected galaxies) along with SED fitting results from CIGALE (for a detailed description of the CIGALE parameters used in this catalogue, see Małek et al., 2018). The galaxies from this catalogue are presented in the left panel of Fig. 5, in which the blue and orange histograms correspond to the sources that follow the criterion and , respectively. As anticipated, galaxies that adhere to the far-IR criterion are situated at higher redshifts on average. Interestingly, based on the CIGALE fits, a higher percentage (i.e. ) of the galaxies that follow the criterion exhibit SFRs of . In contrast, for the rest of the sources, a smaller percentage () demonstrates high SFR values like this.
A similar exercise was repeated for the radio criterion by estimating the AGN fraction and dust mass, derived from the CIGALE fits, for each galaxy. Because the HELP catalogues do not consider the radio emission in their fits, we cross-matched this catalogue with Cosmos2015, which includes the 1.4 GHz VLA data. The results of this analysis are displayed in the right panel of Fig. 5, which shows histograms of the dust mass. The shape and mean values of these histograms indicate that the radio selection criterion does not guarantee the preferential selection of highly dusty SFGs. However, upon examining galaxies at redshifts above 3, it becomes evident that the radio selection method identifies a higher proportion of sources (i.e. ) with a substantial AGN fraction (i.e. ) compared to cases without detected radio emission ().
While this percentage difference may not be statistically significant, the combination of the two far-IR and radio selection methods still provides motivation for their application in identifying high-redshift SFGs with an AGN component. The detailed analysis of the eight sources in this sample has reinforced these findings and encourages their application in large-scale surveys, such as EMU.
4.2 Comparison with previous work
Overall, our sample has a mean redshift of , an average stellar mass of , (total IR luminosity of ), and a mean star formation rate (derived from the rest-frame IR luminosity of each source) of . This average SFR is consistent with previous results that reported an increasing SFR at higher redshift. For instance, Rowan-Robinson et al. (2016) and Gao et al. (2022) showed that Herschel-detected samples of hyper-luminous infrared galaxies (HLIRGs; ) at have SFR values ranging between . Therefore, the inclusion of the 500 emission in our selection criteria naturally provides us with the high bright tail of the SFR distribution at these redshifts. Similarly, Wang et al. (2019) reported that the selection of Herschel galaxies above revealed dusty SFR galaxies with infrared luminosities of , similar to the derived values of our sample.
Furthermore, for 87.5 of the sources in our sample (seven out of eight), an AGN is indicated either by the radio excess or by the mid-IR signature obtained from the best SED fit. Although the morphology of these sources still remains uncertain, five out of eight (63 ) might consist of multiple galaxies, with significant levels of both SF and AGN activity. In comparison, Gao et al. (2021) and Wang et al. (2021), who analysed a sample of HLIRGs selected using data from Herschel and the Deep Fields of the LOFAR Two-metre Sky Survey (LOTSS; Shimwell et al., 2017). described an AGN contamination of 34-64 (using six different models to fit the AGN component) for galaxies at the redshift range . These values, although model dependent, seem to be lower than the AGN contribution of our sample, which can be attributed to the fact that the LOTSS survey reaches sensitivities of 20-30 at 150 MHz. When we assume a typical radio synchrotron slope, this value translates into a lower flux density value at 1.4 GHz than the COSMOS-VLA sensitivity (i.e. 7 ). Therefore, it seems that by selecting radio sources from a deeper radio survey, the authors revealed a population of SF galaxies that receive contributions from AGN less frequently. However, it is important to emphasise that a comparison of our results with studies involving larger sample sizes should be approached with caution, considering the limited statistics that our data provides.
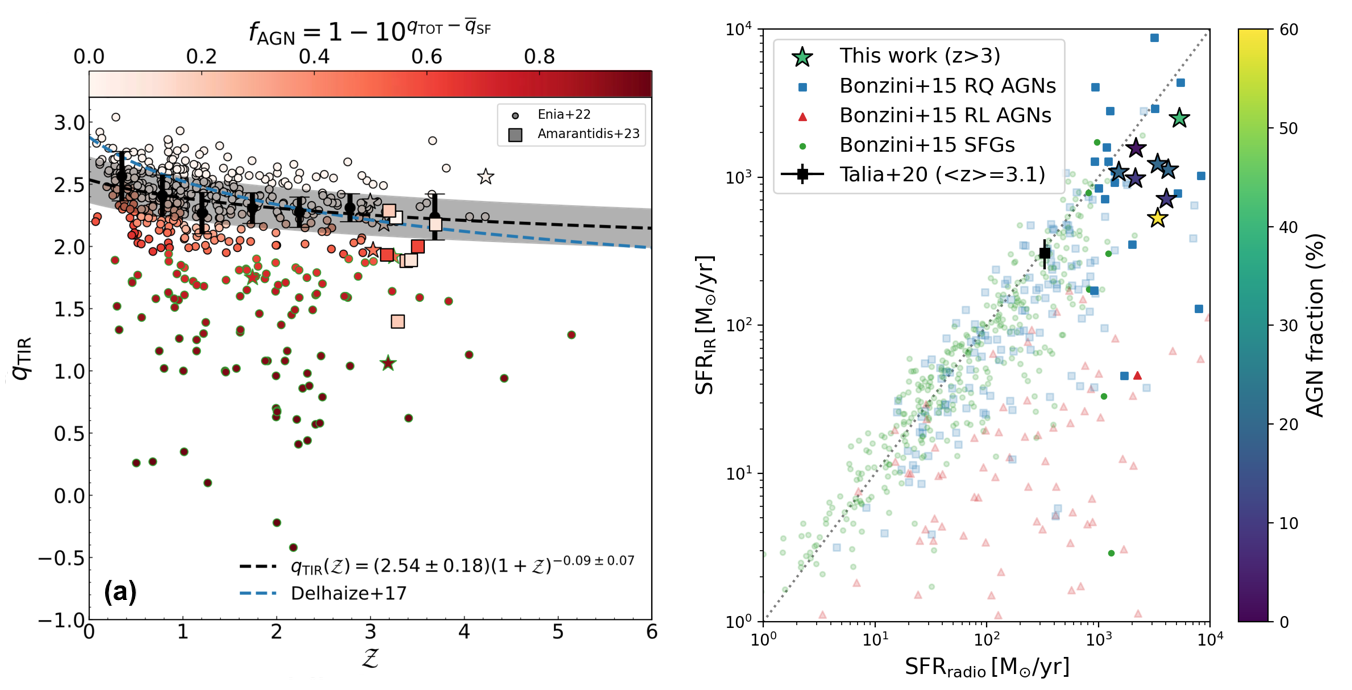
Additionally, Enia et al. (2022) reported a negligible percentage of AGN for the entire sample (), which was selected using deep radio 1.4 GHz observations from the GOODS-N field (sensitivity of 2.2 ). This can be perceived with the parameter , which is commonly used as an indicator of the presence of AGN contribution to the radio emission. Figure 6 depicts the values for our sample and those of Enia et al. (2022), demonstrating the AGN contamination in the radio emission in most of our galaxies. In more detail, 62.5 of the sources in our sample have lower values of than the grey region of the plot (which denotes the average redshift-dependent ). These statistics do not fully match the number of 87.5 of AGN contamination that was derived from the SED fitting and described earlier in the text. However, this discrepancy might originate from the low AGN contribution and uncertainties in the measurements of the radio and infrared fluxes of the SED of some galaxies. In contrast, the sample by Enia et al. (2022) for the redshift bin of indicates an AGN contamination of 37.5 . This difference can be attributed to the fact that in their selection criteria, they did not require the far-IR emission (or better, far-IR peak spectrum) that we employed. As a result, only 38.4 of their total sample has a 500 Herschel detection.
Another comparison can be conducted with the relation derived by Delvecchio et al. (2021) and presents a mass-dependent and almost redshift-independent equation (i.e. ). According to this relation, all of the galaxies in our sample satisfy the criterion, placing them below the mean of the SFR population. However, none of the sources in our sample follows the relation that was derived earlier by Delvecchio et al. (2017) and corresponds to the deviation from the peak distribution of the ratio of and as a function of redshift.
In the same manner, Novak et al. (2017), which selected sources from the VLA 3GHz survey without a far-IR emission requirement, similarly presented the trend of a lower contamination of AGN (23 and 47 of the total sample and redshift bin, respectively) than in our sample. This comparison favours the inclusion of the criterion of a far-IR rising spectrum to the radio emission when AGN at high redshifts are to be identified and studied. In contrast, an interesting comparison can be performed with studies such as that by Bonzini et al. (2015), in which the authors presented a sample with galactic properties similar to those of our galaxies. This sample was derived from the radio 1.4 GHz ECDF-S catalogues (6 sensitivity) with the addition of the Herschel detection in all sources at the redshift bin of interest (i.e. ). Fifteen of the 28 galaxies presented in this redshift range were categorised as radio-quiet (RQ) AGN while one as a radio-loud (RL) AGN, totalling 16 galaxies, or an AGN contamination of 73 . This value is close to the value derived from our sample, which further supports the necessity of including the far-IR criterion to detect high- AGN. Additionally, the right panel of Fig. 6 shows that our galaxies fall in the RQ region of their work, even though our estimates indicate that at least two of our sources should have a significant AGN contribution.
In this sense, our selection method might provide an increased probability for the detection of dusty galaxies at high- that present high SFRs with an additional AGN component, with weak radio emission, as part of a merging system. Additionally, our galaxies seem to be a more extreme group of interacting systems, having brighter IR and radio luminosities as well as stellar masses and SFRs as compared, for instance, to the work by Talia et al. (2021). This outcome might originate from the fact that their sample, once again, did not require a far-IR Herschel detection and was originally derived from the 3 GHz - COSMOS survey, which has a higher detection limit than the VLA-1.4 GHz-COSMOS survey we employed. Nevertheless, Novak et al. (2017) also explored the same field at 3 GHz and reached the same flux density sensitivity (rms of 2.3 ), from which they achieved more AGN detections. The main difference lies in their selection criteria, with the latter work requiring an optical/near-IR counterpart, while Talia et al. (2021) excluded these sources. The selection of radio sources with a far-IR peak spectrum and an optical counterpart might therefore reveal merging systems that at high , present high SFRs () and an AGN counterpart in most cases.
Nevertheless, selecting galaxies that are considered as extreme in terms of mass and luminosity will naturally limit the study to a rare sample, hence to a reduced number of selected sources. This infrequency, along with the complexity of the adopted selection method, will unavoidably provide a less accurate estimation of the SFRD at , which can be only considered as a lower limit (following the method introduced by Avni & Bahcall, 1980), and for our study, this is equal to . However, these selection criteria might be quite powerful in the aforementioned identification and in studying the interplay between AGN and SF activity at high redshift, especially with their application to the upcoming next-generation radio surveys (e.g. the EMU survey) and current/future observational data from mm facilities (e.g. Bing et al., 2023).
5 Conclusions
In this work, we present the exploration of a sample of a high-redshift () radio galaxy population that was selected with the criterion of a rising far-IR spectrum (i.e. ) along with the detection of non-extended (¡10 arcsec) radio emission at 1.4 GHz. The aim behind this selection method was to investigate the potential of combining these two criteria in identifying high-redshift dusty SFGs that are contaminated by an AGN and might be ‘hidden’ by other selection methods. A population like this, due to its extremity and low occurrence, might not contribute significantly to the SFRD of the Universe, but it can provide us with further insight into the interplay between SMBHs and SF activity at high .
In order to explore the morphology of our sample and its physical characteristics in depth, we took advantage of the multi-wavelength deep data available in the literature from the COSMOS and ECDF-S fields. These data sets enabled us to identify that five out of eight galaxies in our sample might consist of more than one galaxy with possible interaction/merging. It has to be noted that the low angular extent of these galaxies did not permit confirmation of this statement due to the spatial resolution of the current instrumentation. Nevertheless, future observations with telescopes such as the James Webb Space Telescope (JWST) may provide further insights into this argument. Furthermore, we determined the presence of an AGN component in seven out of eight of these sources, which in most cases represents a weak radio emission, identifying these sources as radio-quiet AGN. An additional highly star-forming component seems to be present in all cases, with a typical SFR of .
We have demonstrated that the combination of the far-IR and radio emission criteria is highly efficient in selecting merging systems at , typically with the presence of a radio-quiet AGN and a highly SFG. With upcoming wide radio surveys (e.g. the Evolutionary Map of the Universe, EMU) and next-generation telescopes such as the SKA, these results motivate further exploration of alternative selection methods. In order to advance the study of systems similar to those in our sample, particularly during the epoch of reionisation (EoR), sources with a mm rise in flux in combination with deep radio surveys might further be studued. A possible rising mm spectrum profile, which could be explored for faint individual sources using interferometric facilities (e.g. ALMA and NOEMA) and single-dish instruments (e.g. the NIKA2 camera of the IRAM 30m antenna, or the ToLTEC of the Large Millimeter Telescope) targeting a brighter population from larger surveys could assist in the identification of the redshifted dust component of SFGs at . Similarly, the morphology of these galaxies could be further understood with infrared facilities, including the JWST.
Acknowledgements.
This work was supported by Fundação para a Ciência e a Tecnologia (FCT) through the research grants PTDC/FIS-AST/29245/2017, 1220UID/FIS/04434/2019, UIDB/04434/2020, and UIDP/04434/2020. C.P. acknowledges support from DL 57/2016 (P2460) from the ‘Departamento de Física, Faculdade de Ciências da Universidade de Lisboa’. This paper makes use of ALMA data. ALMA is a partnership of ESO (representing its member states), NSF (USA), and NINS (Japan); together with NRC (Canada), MOST, and ASIAA (Taiwan); and KASI (Republic of Korea), in cooperation with the Republic of Chile. The Joint ALMA Observatory is operated by ESO, AUI/NRAO, and NAOJ. This research made extensive use of core PYTHON packages for Astronomy as well as TOPCAT. We thank the anonymous referee for all the valuable comments, which improved the quality of the paper.References
- Amblard et al. (2010) Amblard, A., Cooray, A., Serra, P., et al. 2010, A&A, 518, L9
- Avni & Bahcall (1980) Avni, Y. & Bahcall, J. N. 1980, ApJ, 235, 694
- Bell (2003) Bell, E. F. 2003, ApJ, 586, 794
- Bing et al. (2023) Bing, L., Béthermin, M., Lagache, G., et al. 2023, arXiv e-prints, arXiv:2305.07054
- Birkin et al. (2021) Birkin, J. E., Weiss, A., Wardlow, J. L., et al. 2021, MNRAS, 501, 3926
- Bonzini et al. (2015) Bonzini, M., Mainieri, V., Padovani, P., et al. 2015, MNRAS, 453, 1079
- Bouwens et al. (2015) Bouwens, R. J., Illingworth, G. D., Oesch, P. A., et al. 2015, ApJ, 811, 140
- Bruzual & Charlot (2003) Bruzual, G. & Charlot, S. 2003, MNRAS, 344, 1000
- Cappelluti et al. (2009) Cappelluti, N., Brusa, M., Hasinger, G., et al. 2009, A&A, 497, 635
- Carter et al. (2012) Carter, M., Lazareff, B., Maier, D., et al. 2012, A&A, 538, A89
- CASA Team et al. (2022) CASA Team, Bean, B., Bhatnagar, S., et al. 2022, PASP, 134, 114501
- Casey et al. (2021) Casey, C. M., Zavala, J. A., Manning, S. M., et al. 2021, ApJ, 923, 215
- Charlot & Fall (2000) Charlot, S. & Fall, S. M. 2000, ApJ, 539, 718
- Chen et al. (2022) Chen, C.-C., Liao, C.-L., Smail, I., et al. 2022, ApJ, 929, 159
- Chenu et al. (2016) Chenu, J.-Y., Navarrini, A., Bortolotti, Y., et al. 2016, IEEE Transactions on Terahertz Science and Technology, 6, 223
- Ciesla et al. (2017) Ciesla, L., Elbaz, D., & Fensch, J. 2017, A&A, 608, A41
- Civano et al. (2016) Civano, F., Marchesi, S., Comastri, A., et al. 2016, ApJ, 819, 62
- Coppin et al. (2012) Coppin, K. E. K., Danielson, A. L. R., Geach, J. E., et al. 2012, MNRAS, 427, 520
- da Cunha et al. (2015) da Cunha, E., Walter, F., Smail, I. R., et al. 2015, ApJ, 806, 110
- Dale et al. (2014) Dale, D. A., Helou, G., Magdis, G. E., et al. 2014, ApJ, 784, 83
- Danielson et al. (2017) Danielson, A. L. R., Swinbank, A. M., Smail, I., et al. 2017, ApJ, 840, 78
- Delhaize et al. (2017) Delhaize, J., Smolčić, V., Delvecchio, I., et al. 2017, A&A, 602, A4
- Delvecchio et al. (2021) Delvecchio, I., Daddi, E., Sargent, M. T., et al. 2021, A&A, 647, A123
- Delvecchio et al. (2017) Delvecchio, I., Smolčić, V., Zamorani, G., et al. 2017, A&A, 602, A3
- Donevski et al. (2018) Donevski, D., Buat, V., Boone, F., et al. 2018, A&A, 614, A33
- Dowell et al. (2014) Dowell, C. D., Conley, A., Glenn, J., et al. 2014, ApJ, 780, 75
- Duncan et al. (2019) Duncan, K., Conselice, C. J., Mundy, C., et al. 2019, ApJ, 876, 110
- Dunlop et al. (2017) Dunlop, J. S., McLure, R. J., Biggs, A. D., et al. 2017, MNRAS, 466, 861
- Elvis et al. (2009) Elvis, M., Civano, F., Vignali, C., et al. 2009, ApJ, 184, 158
- Enia et al. (2022) Enia, A., Talia, M., Pozzi, F., et al. 2022, ApJ, 927, 204
- Faisst et al. (2020) Faisst, A. L., Schaerer, D., Lemaux, B. C., et al. 2020, ApJS, 247, 61
- Fritz et al. (2006) Fritz, J., Franceschini, A., & Hatziminaoglou, E. 2006, MNRAS, 366, 767
- Gao et al. (2021) Gao, F., Wang, L., Efstathiou, A., et al. 2021, A&A, 654, A117
- Gao et al. (2022) Gao, F., Wang, L., Ramos Padilla, A. F., et al. 2022, A&A, 668, A54
- Griffin et al. (2010) Griffin, M. J., Abergel, A., Abreu, A., et al. 2010, A&A, 518, L3
- Gruppioni et al. (2020) Gruppioni, C., Béthermin, M., Loiacono, F., et al. 2020, A&A, 643, A8
- Gruppioni et al. (2013) Gruppioni, C., Pozzi, F., Rodighiero, G., et al. 2013, MNRAS, 432, 23
- Guo et al. (2020) Guo, X., Gu, Q., Ding, N., Contini, E., & Chen, Y. 2020, MNRAS, 492, 1887
- Harikane et al. (2023) Harikane, Y., Ouchi, M., Oguri, M., et al. 2023, ApJS, 265, 5
- Hasinger et al. (2018) Hasinger, G., Capak, P., Salvato, M., et al. 2018, ApJ, 858, 77
- Holland et al. (2013) Holland, W. S., Bintley, D., Chapin, E. L., et al. 2013, MNRAS, 430, 2513
- Inoue (2011) Inoue, A. K. 2011, MNRAS, 415, 2920
- Ishigaki et al. (2018) Ishigaki, M., Kawamata, R., Ouchi, M., et al. 2018, ApJ, 854, 73
- Iwasawa et al. (2012) Iwasawa, K., Gilli, R., Vignali, C., et al. 2012, APP, 546, A84
- Kistler et al. (2009) Kistler, M. D., Yüksel, H., Beacom, J. F., Hopkins, A. M., & Wyithe, J. S. B. 2009, ApJ, 705, L104
- Klein et al. (2012) Klein, B., Hochgürtel, S., Krämer, I., et al. 2012, A&A, 542, L3
- Klein et al. (2008) Klein, B., Krämer, I., Hochgürtel, S., et al. 2008, in Ninteenth International Symposium on Space Terahertz Technology, ed. W. Wild, 192
- Klein et al. (2009) Klein, B., Krämer, I., Hochgürtel, S., et al. 2009, in Twentieth International Symposium on Space Terahertz Technology, ed. E. Bryerton, A. Kerr, & A. Lichtenberger, 199
- Lagache (2018) Lagache, G. 2018, in Peering towards Cosmic Dawn, ed. V. Jelić & T. van der Hulst, Vol. 333, 228–233
- Laigle et al. (2016) Laigle, C., McCracken, H. J., Ilbert, O., et al. 2016, ApJ, 224, 24
- Lanzuisi et al. (2017) Lanzuisi, G., Delvecchio, I., Berta, S., et al. 2017, A&A, 602, A123
- Lehmer et al. (2005) Lehmer, B. D., Brandt, W. N., Alexander, D. M., et al. 2005, APJS, 161, 21
- Luo et al. (2017) Luo, B., Brandt, W. N., Xue, Y. Q., et al. 2017, ApJ, 228, 2
- Madau & Fragos (2017) Madau, P. & Fragos, T. 2017, ApJ, 840, 39
- Magnelli et al. (2019) Magnelli, B., Karim, A., Staguhn, J., et al. 2019, ApJ, 877, 45
- Malefahlo et al. (2022) Malefahlo, E. D., Jarvis, M. J., Santos, M. G., et al. 2022, MNRAS, 509, 4291
- Małek et al. (2018) Małek, K., Buat, V., Roehlly, Y., et al. 2018, A&A, 620, A50
- Marchesi et al. (2016) Marchesi, S., Civano, F., Elvis, M., et al. 2016, ApJ, 817, 34
- McLeod et al. (2016) McLeod, D. J., McLure, R. J., & Dunlop, J. S. 2016, MNRAS, 459, 3812
- Meiksin (2006) Meiksin, A. 2006, MNRAS, 365, 807
- Miettinen et al. (2015) Miettinen, O., Smolčić, V., Novak, M., et al. 2015, A&A, 577, A29
- Miller et al. (2013) Miller, N. A., Bonzini, M., Fomalont, E. B., et al. 2013, APJS, 205, 13
- Muzzin et al. (2013) Muzzin, A., Marchesini, D., Stefanon, M., et al. 2013, ApJS, 206, 8
- Nakajima et al. (2023) Nakajima, K., Ouchi, M., Isobe, Y., et al. 2023, arXiv e-prints, arXiv:2301.12825
- Nguyen et al. (2010) Nguyen, H. T., Schulz, B., Levenson, L., et al. 2010, A&A, 518, L5
- Noll et al. (2009) Noll, S., Burgarella, D., Giovannoli, E., et al. 2009, A&A, 507, 1793
- Norris (2009) Norris, R. P. 2009, in Panoramic Radio Astronomy: Wide-field 1-2 GHz Research on Galaxy Evolution, 33
- Norris et al. (2021) Norris, R. P., Marvil, J., Collier, J. D., et al. 2021, PASA, 38, e046
- Novak et al. (2017) Novak, M., Smolčić, V., Delhaize, J., et al. 2017, A&A, 602, A5
- Oesch et al. (2018) Oesch, P. A., Bouwens, R. J., Illingworth, G. D., Labbé, I., & Stefanon, M. 2018, ApJ, 855, 105
- Oliver et al. (2012) Oliver, S. J., Bock, J., Altieri, B., et al. 2012, MNRAS, 424, 1614
- Pantoni et al. (2021) Pantoni, L., Massardi, M., Lapi, A., et al. 2021, MNRAS, 507, 3998
- Pâris et al. (2014) Pâris, I., Petitjean, P., Aubourg, É., et al. 2014, AAP, 563, A54
- Pérez-González et al. (2023) Pérez-González, P. G., Barro, G., Annunziatella, M., et al. 2023, ApJ, 946, L16
- Pilbratt et al. (2010) Pilbratt, G. L., Riedinger, J. R., Passvogel, T., et al. 2010, A&A, 518, L1
- Pillepich et al. (2018) Pillepich, A., Springel, V., Nelson, D., et al. 2018, MNRAS, 473, 4077
- Poglitsch et al. (2010) Poglitsch, A., Waelkens, C., Geis, N., et al. 2010, A&A, 518, L2
- Ranalli et al. (2013) Ranalli, P., Comastri, A., Vignali, C., et al. 2013, A&A, 555, A42
- Reid et al. (2016) Reid, B., Ho, S., Padmanabhan, N., et al. 2016, MNRAS, 455, 1553
- Rodighiero et al. (2023) Rodighiero, G., Bisigello, L., Iani, E., et al. 2023, MNRAS, 518, L19
- Rodriguez et al. (2021) Rodriguez, F., Montero-Dorta, A. D., Angulo, R. E., Artale, M. C., & Merchán, M. 2021, MNRAS, 505, 3192
- Rowan-Robinson et al. (2016) Rowan-Robinson, M., Oliver, S., Wang, L., et al. 2016, MNRAS, 461, 1100
- Schinnerer et al. (2010) Schinnerer, E., Sargent, M. T., Bondi, M., et al. 2010, APJS, 188, 384
- Scoville et al. (2007) Scoville, N., Aussel, H., Brusa, M., et al. 2007, ApJ, 172, 1
- Serra et al. (2011) Serra, P., Amblard, A., Temi, P., et al. 2011, ApJ, 740, 22
- Shimwell et al. (2017) Shimwell, T. W., Röttgering, H. J. A., Best, P. N., et al. 2017, A&A, 598, A104
- Shirley et al. (2021) Shirley, R., Duncan, K., Campos Varillas, M. C., et al. 2021, MNRAS, 507, 129
- Smolčić et al. (2017) Smolčić, V., Novak, M., Delvecchio, I., et al. 2017, A&A, 602, A6
- Suh et al. (2015) Suh, H., Hasinger, G., Steinhardt, C., Silverman, J. D., & Schramm, M. 2015, ApJ, 815, 129
- Tacconi et al. (2020) Tacconi, L. J., Genzel, R., & Sternberg, A. 2020, ARA&A, 58, 157
- Talia et al. (2021) Talia, M., Cimatti, A., Giulietti, M., et al. 2021, ApJ, 909, 23
- Vaccari et al. (2016) Vaccari, M., Covone, G., Radovich, M., et al. 2016, in The 4th Annual Conference on High Energy Astrophysics in Southern Africa (HEASA 2016), 26
- Viero et al. (2013) Viero, M. P., Moncelsi, L., Quadri, R. F., et al. 2013, ApJ, 779, 32
- Wang et al. (2021) Wang, L., Gao, F., Best, P. N., et al. 2021, A&A, 648, A8
- Wang et al. (2019) Wang, L., Pearson, W. J., Cowley, W., et al. 2019, A&A, 624, A98
- Wardlow et al. (2011) Wardlow, J. L., Smail, I., Coppin, K. E. K., et al. 2011, MNRAS, 415, 1479
- Weaver et al. (2022) Weaver, J. R., Kauffmann, O. B., Ilbert, O., et al. 2022, ApJS, 258, 11
- Wenger et al. (2000) Wenger, M., Ochsenbein, F., Egret, D., et al. 2000, A&As, 143, 9
- Wilson et al. (2019) Wilson, C., Dong, R., di Francesco, J., et al. 2019, in Canadian Long Range Plan for Astronony and Astrophysics White Papers, Vol. 2020, 19
- Yamaguchi et al. (2019) Yamaguchi, Y., Kohno, K., Hatsukade, B., et al. 2019, ApJ, 878, 73
- Yan et al. (2022) Yan, H., Ling, C., & Ma, Z. 2022, MNRAS, 516, 5471
- Yüksel et al. (2008) Yüksel, H., Kistler, M. D., Beacom, J. F., & Hopkins, A. M. 2008, ApJ, 683, L5
Appendix A Comparison of the retrieved with photometric catalogues
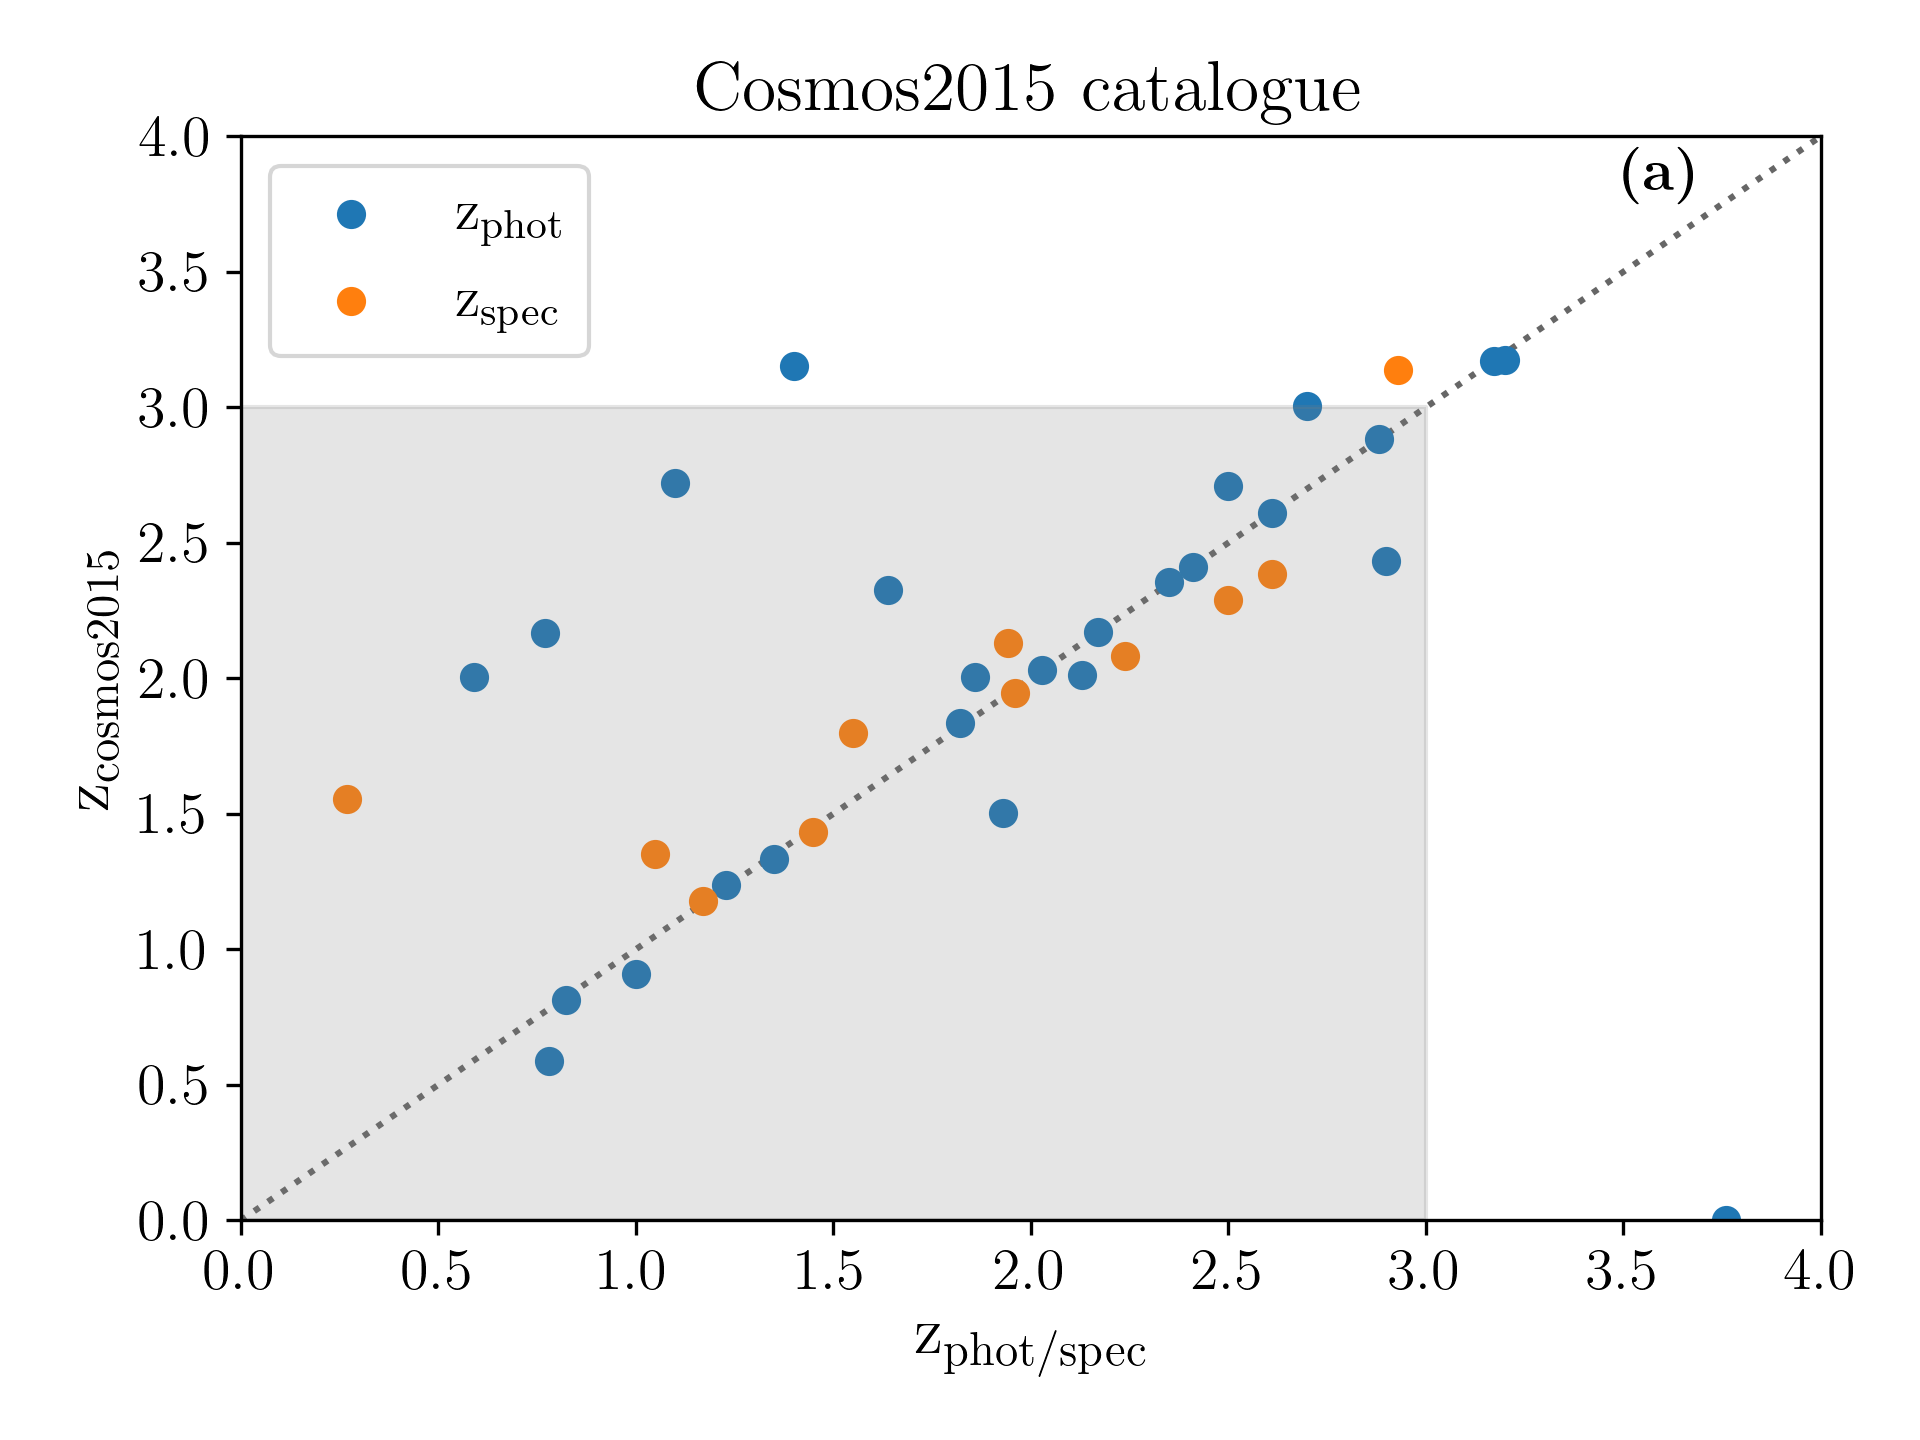
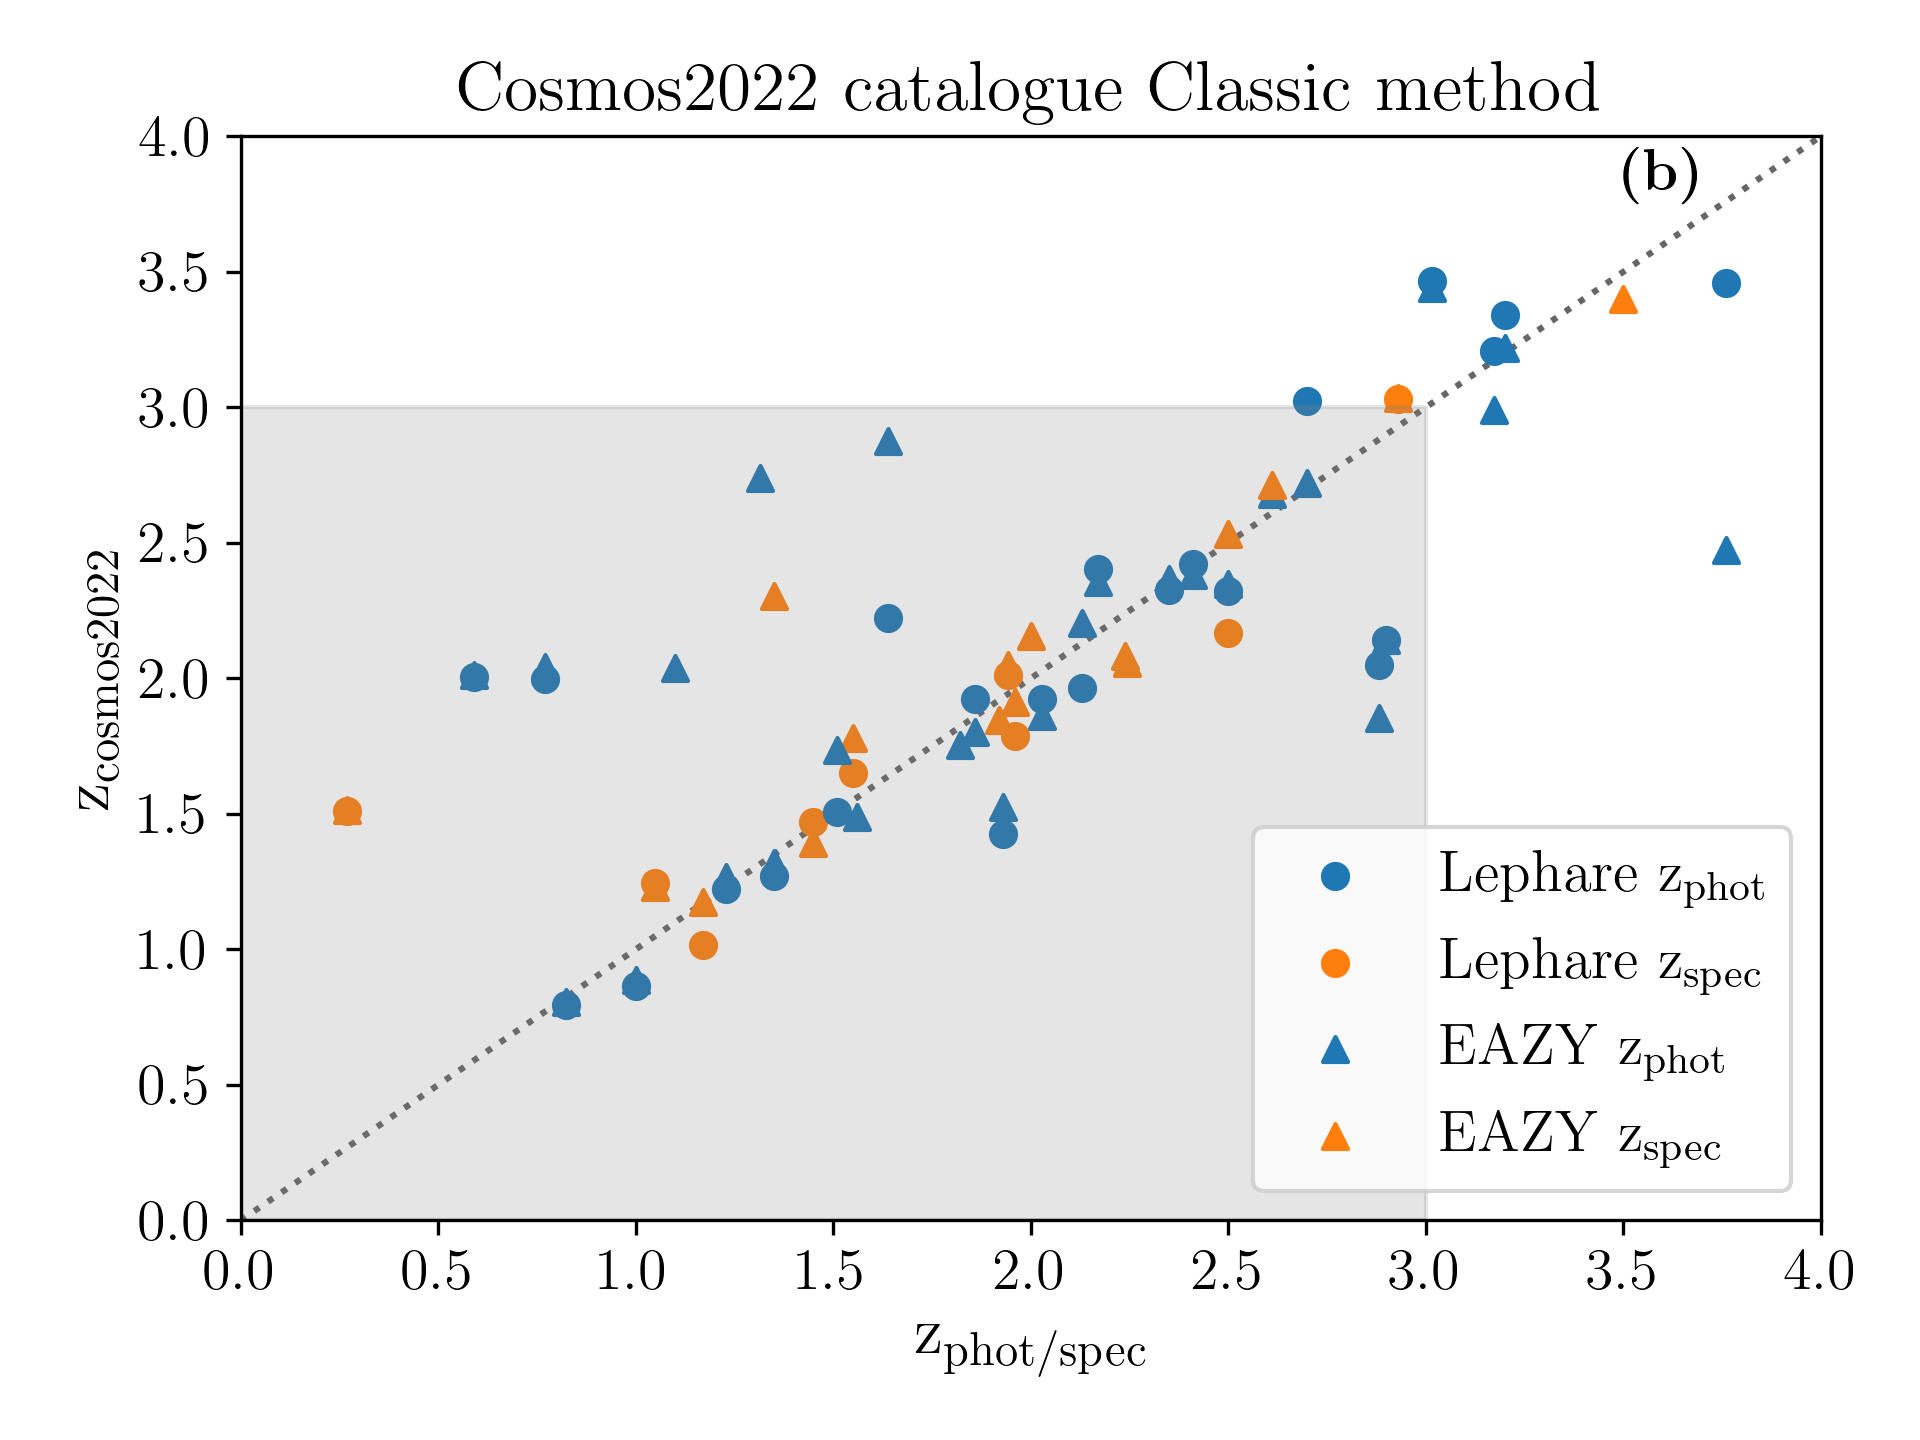
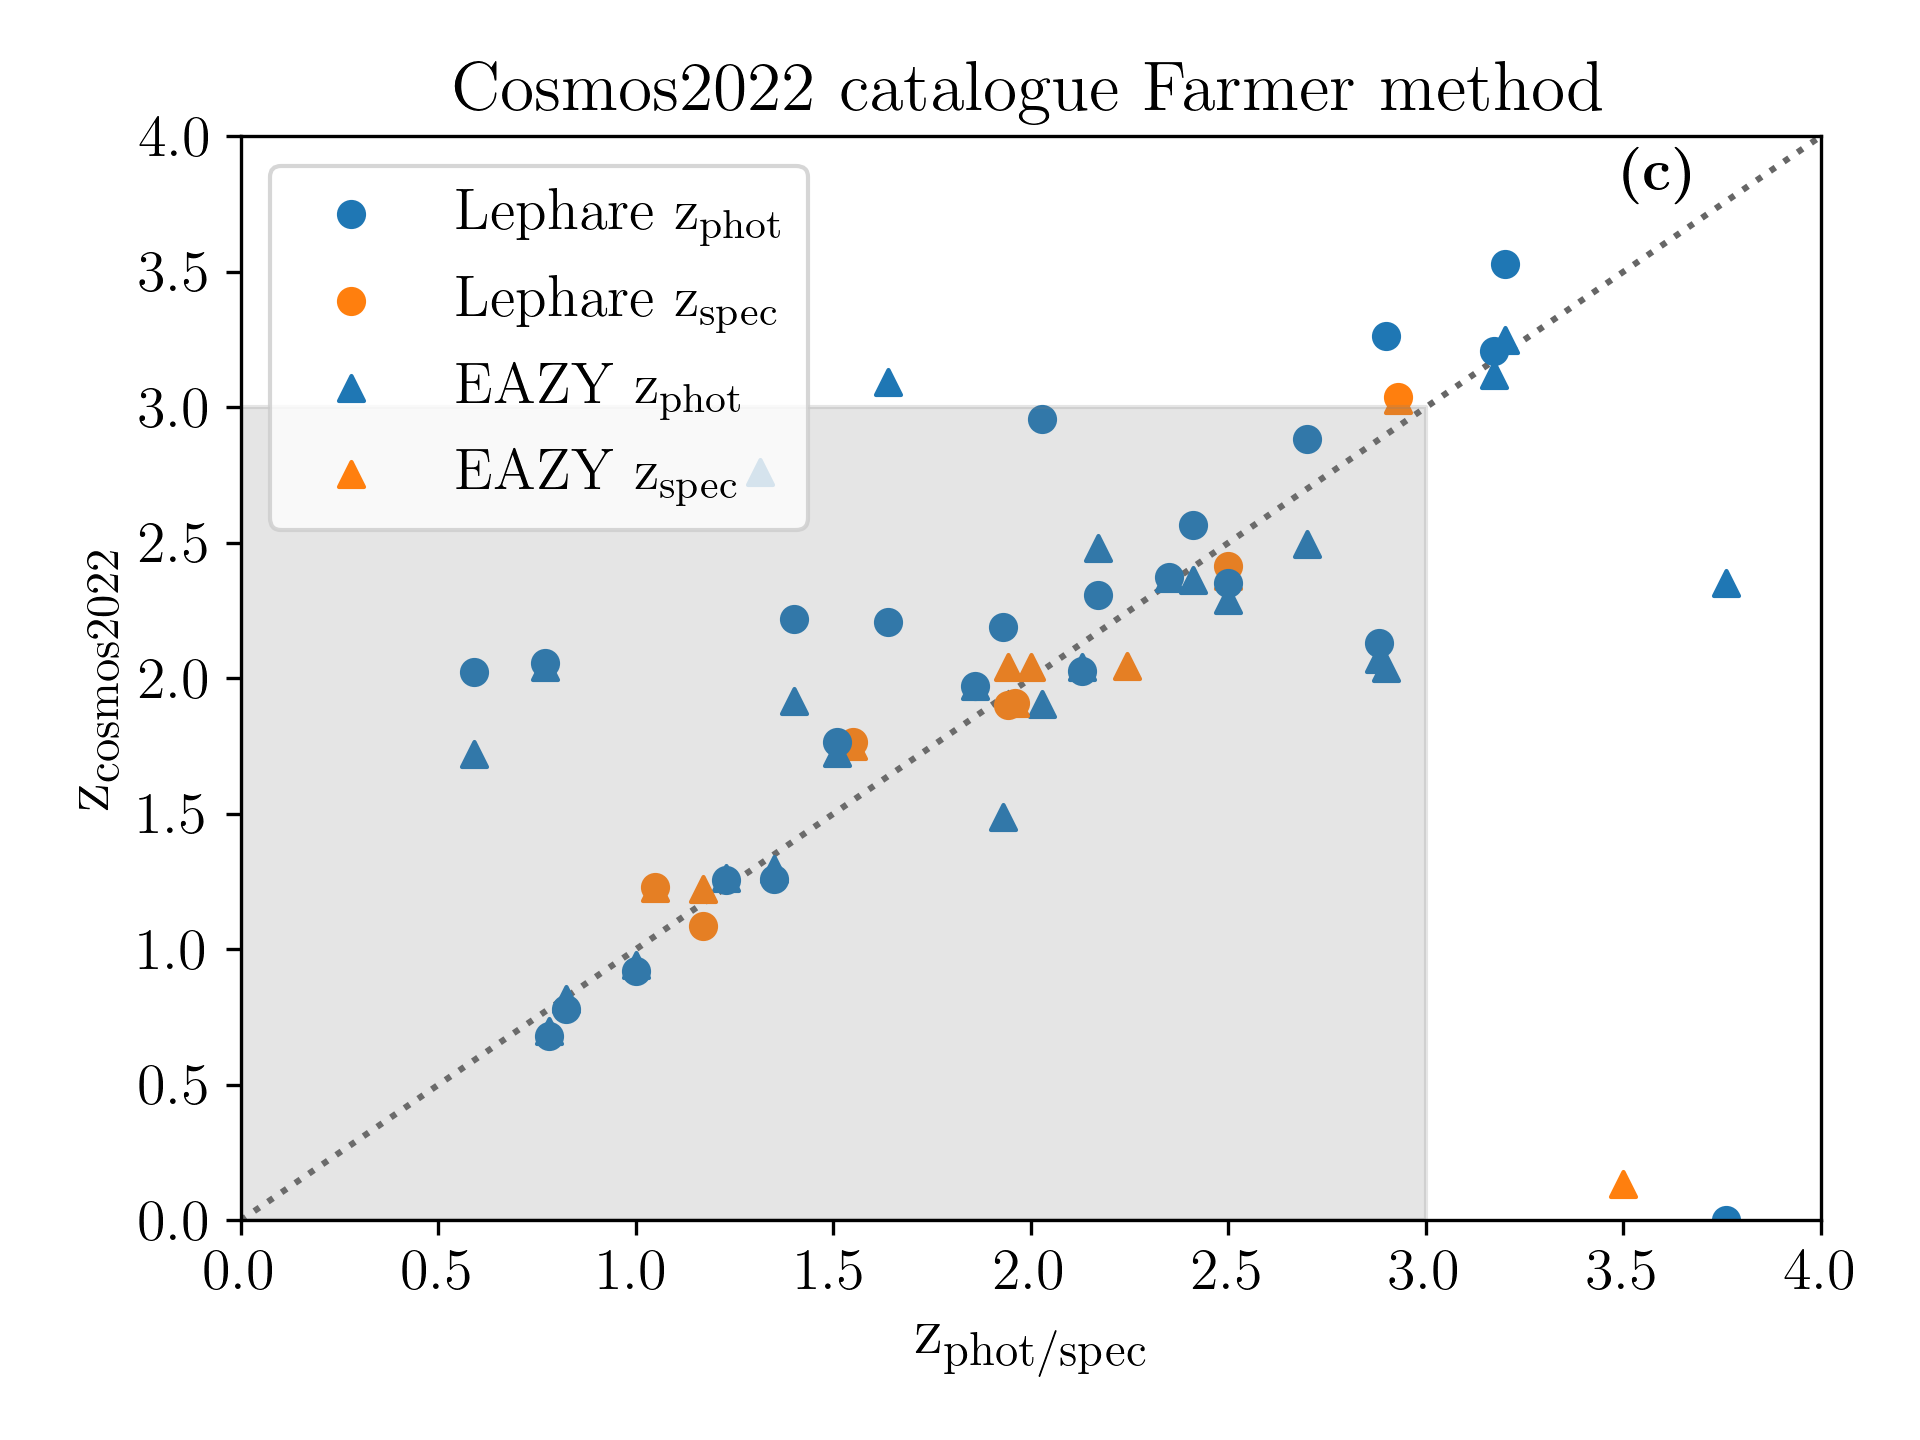
In this appendix, we present a comparison between the redshift values estimated by various photometric catalogues and our analysis, as described above. In more detail, the catalogues consist of the Cosmos2015 (Laigle et al. 2016), the Cosmos2020 (Weaver et al. 2022, employing all possible redshift estimations, namely the classic and Farmer methods using the SED fitting codes Lephare and EAZY) and the HELP catalogues (Shirley et al. 2021). The redshift values derived from these catalogues are compared with the values that our team acquired from the literature and from the IRAM/ALMA observations of the aforementioned two targets (i.e. CVLA958 and CVLA100; see Sect. 3). For the cross match between catalogues, a radius of 1 arcsec was employed in order to ensure that each source from the catalogues corresponded to the correct source from our sample. The results of these comparisons are presented in Fig. 7.
In our findings, certain sources exhibit lower redshift values in the catalogues than in the present study. These differences can be attributed to the low S/N of the photometric points that were used in the SED fitting. Furthermore, the authors of these catalogues may not have individually examined each source due to the extensive volume of data. For example, the source with coordinates (Ra, Dec)=(150.02005417, 2.51254722) is depicted in the Cosmos2020 comparison plots (see Fig. 7) with a redshift of , derived from the EAZY SED fit ( of ). However, our work adopts a redshift value of 3.46 obtained from the Lephare SED fit solution for the same source. This choice was made due to the lower values obtained from both the literature Lephare analysis () and our own CIGALE fits ().
Additionally, this figure shows that according to Cosmos2015, two galaxies that were identified by our search as sources have a higher photometric redshift value. In more detail, the sources are identified as UVISTADR1 J100131.33+020325.2 and UVISTADR1 J100114.75+023516.3 and have a of 3.152 and 3.007, respectively. However, the more detailed photometric analysis by Muzzin et al. (2013) proposed lower values for both sources of and , respectively. Similarly, for the cosmos2020-Farmer method, a source named UVISTADR1 J095834.49+015504.9 was estimated to be at , however, Muzzin et al. (2013) reported a lower value of . The latter redshift results can be further supported by the redshift estimate by Lephare cosmos2020 of . These discrepancies between various photometric catalogues can mainly be attributed to the faint nature of these sources and to the subsequent low fit quality of their SED. Finally, according to the HELP catalogue, no further source could be added to our sample.
Appendix B Spectroscopic follow-up of CVLA958 and CVLA100
Because of the uncertainty of the high-redshift nature of CVLA958 and CVLA100, these sources were originally included in a follow-up spectroscopic study by our team with the aim to understand their nature and potentially employ this knowledge to detect galaxies at higher redshifts. In this appendix, we present the retrieved spectroscopic data for these two galaxies, bearing in mind the redshift solution of that the current photometric analysis indicated. The original idea of the spectra acquired with the Institute Radio Astronomie Millimétrique (IRAM) 30m antenna and the ALMA telescopes was the detection of two possible CO emission lines that would constrain the redshift of each galaxy.
B.1 IRAM observations
The IRAM444\hrefhttps://www.iram-institute.orghttps://www.iram-institute.org institute is composed of two facilities, namely the interferometer NOrthern Extended Millimeter Array (NOEMA; Chenu et al. 2016) and a single-dish telescope with a diameter of 30m, located in the Sierra Nevada, Spain. The adopted strategy to retrieve the millimetre spectrum of our galaxies was to scan the 3 mm band with the spectral line receiver Eight MIxer Receiver (EMIR; Carter et al. 2012) of the 30m antenna, along with the Fast Fourier Transform Spectrometers (FTS200; Klein et al. 2012) and Wideband Line Multiple Autocorrelator (WILMA555\hrefhttps://www.iram.fr/IRAMFR/TA/backend/veleta/wilma/index.htmhttps://www.iram.fr/IRAMFR/TA/backend/veleta/wilma/index.htm) backends (in parallel) at the wavelength range of 73-117 GHz (band E0/E090). Given the possible AGN nature of the targeted sources, the CO spectral line energy distribution will likely peak at mid-J transitions (e.g. for the frequency range of band E0, the CO J=4-3 line could be at and the CO J=5-4 line at ). The expected redshift span for this candidate is , and therefore, the 3 mm spectral range provides an excellent trade-off of weather versus line detection to search for ideally two emission lines required to determine the source redshift. Nevertheless, in the following analysis, only the data from the FTS units were investigated since they provide a higher spectral resolution than WILMA, which is necessary to resolve faint emission lines.
The project code is 227-19, and the observations were initially scheduled for 19-24 December 2019. However, considering that the weather conditions were not appropriate to observe for the full length of our original allocated time, additional observing time was provided during 21-23 March 2020, 12-14 May 2020, and finally, 14-17 July 2020. Out of a total of 103 hours provided for this source, only hours of observations generated spectra with acceptable quality to be considered in the assembly of the final spectrum. The rest of the observing time was lost due to instrumentation malfunctions and weather conditions (strong wind and high water vapour).
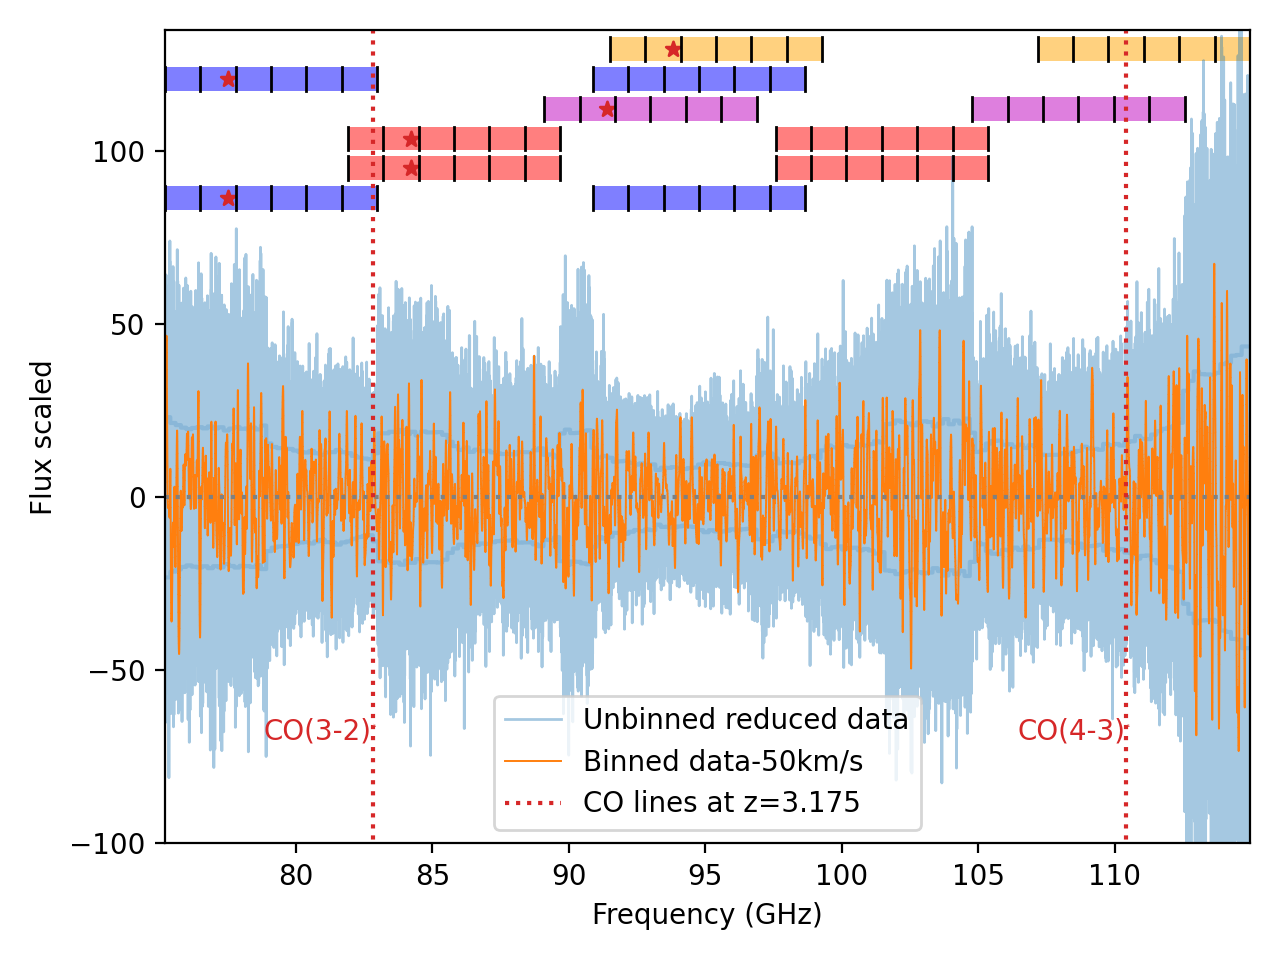
The final spectrum of CVLA958 was constructed using only data from the last three days of observations (i.e. 21, 22, and 23 December 2019). We further inspected the histograms of the opacity of the clouds (), rms random noise temperature (), and receiver and system temperature ( and , respectively) from these observations in order to exclude possible outliers in the scans. After removing these outliers and correcting for the platforming issue (e.g. Klein et al. 2008, 2009), we generated the final spectrum for the 3 mm band, depicted in the left panel of Fig. 8. In this plot, the total spectrum (blue line) and its filtered version for a Gaussian filter of (orange line) are presented, and the colours are denoted in the legend. The full applied FTS configuration is also shown, as is the location of the CO lines, accepting the recent spectroscopic redshift value of 3.1755 by Birkin et al. (2021) (dashed red lines). The figure clearly shows that no secure line can be attributed to any feature because the S/N does not permit this determination.
The high-redshift candidate CVLA100 was also observed by our team with the IRAM 30m antenna as part of the project 198-16 and during the time period of 23-27 March 2017. In these observations, we also scanned the E0 band of EMIR (frequency range of 73–117 GHz) using the FTS200 backend. Additional time was allocated for our source, and observations were conducted remotely on May 2107, aiming at the 2 mm spectral window. Similarly, with the acquired spectrum of CVLA958, no secure emission line could be detected for CVLA100. In order to further test possible lines that are not apparent with visual inspection, we developed a simple convolution algorithm to search for emission from CO lines at a given redshift. Essentially, the approach of this code is to sum the observed spectra at the positions where a CO detection was expected at a given redshift, and subsequently vary the redshift in steps of 0.01. Application of this analysis, presents no emission line detection, considering that the resulting values for specific redshifts ranging from to do not deviate significantly from zero.
B.2 ALMA observations
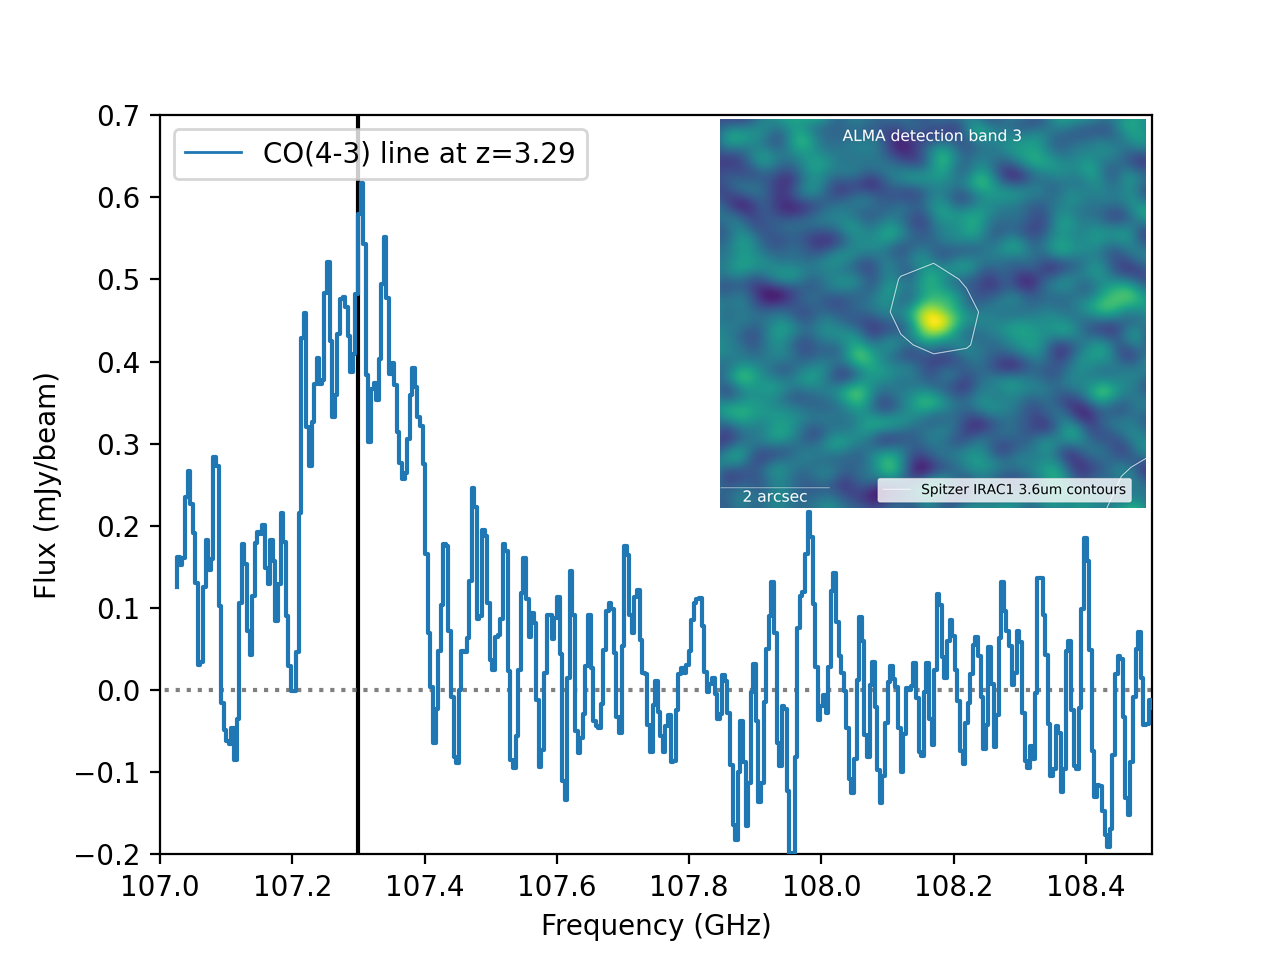
No emission was detected in the IRAM spectrum for CVLA100, our team decided to secure additional observing time for the same candidate using the ALMA telescope. More specifically, the source was observed with multiple tunings in bands 3 (84-116 GHz) and 4 (125-163 GHz) in various configurations (longest baselines from 300 m to 1400 m), under the project code 2017.1.01713.S. With acceptable weather conditions (water vapour of at all times; wind at ), our observations achieved a mean angular resolution of 1 arcsec and a mean continuum sensitivity of 0.2 mJy after 4.1 hours at band 3 and 1.4 hours of integration time at band 4. By analysing the spectrum, extracted using the CASA software (CASA Team et al. 2022), we detected a feature at 107.3 GHz which, considering the numerous CO emission lines, assisted in constraining the redshift of the source. One plausible solution indicates that this feature corresponds to the redshifted CO(4-3) emission line at . This proposed redshift possibility closely agrees with the suggested solution of obtained from our photometric analysis and the referenced literature catalogues (i.e. HELP, Cosmos2015, and cosmos2020).