| Pawel Pieranski∗a and Maria Helena Godinhob |
| Abstract: The persistent quasi-planar nematic texture known also as the dowser texture is characterized by a 2D unitary vector field d. We show here that the dowser texture is sensitive, in first order, to electric fields. This property is due to the flexo-electric polarisation P collinear with d expected from R.B. Meyer’s considerations on flexo-electricity in nematics. It is pointed out that due to the flexo-electric polarisation nematic monopoles can be manipulated by electric fields of appropriated geometry. |
1 Introduction
1.1 The dowser texture and its order parameter
Generation and handling of monopoles in nematics are two challenging tasks emerging in the field of topological metamaterials. Giomi et al. 1 proposed recently a micro-fluidical method of handling monopoles. They have shown that nematic monopoles can be trapped in stagnation points of different topological charges created by appropriate microfluidic junction.
Alternatively, monopoles can be generated and handled in the persistent quasi-planar nematic texture, called the dowser texture (see below), which can be considered as a natural universe of nematic monopoles for reasons expounded below 5, 4, 2.
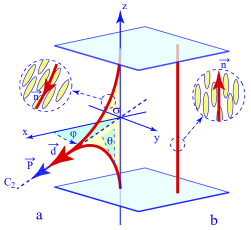
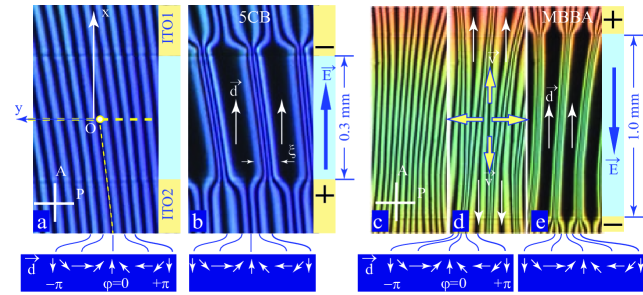
The three-dimensional quasi-planar texture n(z) (see Fig.1a):
| (1) |
is generated when a gap between two surfaces with homeotropic anchoring conditions is filled for the first time with a nematic. It is in competition with the distorsionless homeotropic uniform texture n(z)=(0,0,1) which usually, for energetical reasons, eliminates the quasi-planar one.
The symmetry C2v of the quasi-planar texture is lower then the symmetry D∞h of the homeotropic one. The order parameter, resulting from the symmetry breaking D C2v, is a two dimensional unitary vector field
| (2) |
called the dowser field, which is fully determined by its azimuthal angle called phase. Let us stress that , contrary to the nematic director field for which . Alternatively, a complex order parameter can also be used. Let us emphasize that contrary to quantum systems such as superfluids, superconductors, or cold atoms condensates which are also equipped with the complex order parameter , the phase of the dowser texture has a direct geometrical meaning (see Fig. 1).
1.2 Metastability of the dowser texture
For decades, the quasi-planar texture has been considered as ephemeral because of its metastabilty with respect to the undistorted homeotropic ground state. For this reason it has been scarcely studied in past. The breakthrough came from the discovery made for the first time by Gilli et al. 3 and more recently in ref.4 that in thick enough samples, limited laterally by an air/nematic interface with homeotropic boundary conditions (see Fig.1.7a), the homeotropic texture can be eliminated for the benefit of the quasi-planar one. Upon a subsequent reduction of the sample thickness, the metastable quasi-planar texture persists until the thickness h is reduced below . Because of its resemblance with a wooden dowser tool such a long-lived quasi-planar texture has been dubbed "the dowser texture".
1.3 Properties of the dowser texture
The discovery of the method allowing to preserve indefinitely the dowser texture allowed to unveil its properties:
- The dowser texture as an universe of nematic monopoles 2:
- Tropisms of the dowser texture:
-
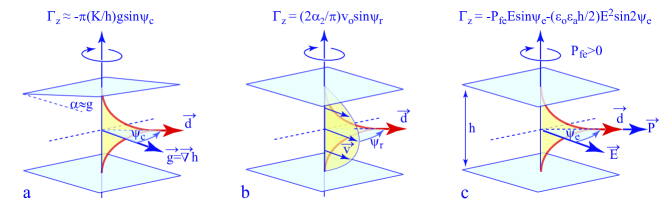
Due its degeneracy with respect to the phase angle , the dowser field is sensitive to perturbations such as a thickness gradient gradh or a Poiseuille flow v. As the dowser field d tends to align in directions of the thickness gradient and of the flow we called these properties respectively cuneitropism 4 and rheotropism 6 (see Fig.2a and b).
1.4 Electrotropism of the dowser texture
In the present work we deal with electrotropism corresponding to the alignment of the dowser field by electric fields (see Fig.2c). It is due to the torque (per unit area)
| (3) |
exerted by the electric field, parallel to the xy plane of the nematic layer, on the polarisation P being a sum
| (4) |
of the spontaneous flexo-electric polarisation (per unit area, see the next section)
| (5) |
and of the anisotropic part of the polarization (per unit area) induced by the electric field:
| (6) |
When the electric field makes with the dowser field an angle (see Fig.2c), the electric torque given by equation 3 can be written as:
| (7) |
The relative importance of the two terms depends on the intensity of the electric field E with respect to a characteristic field Ec defined as
| (8) |
1.5 Flexo-electric polarization of the dowser texture
One of the principal results of this work is the detection, for the first time, of the flexo-electric polarisation Pfe of the dowser texture which is expected from symmetry arguments enounced for the first time by of R.B. Meyer 7. In the present case, the C2v symmetry allows the dowser texture to have a polarisation per unit area directed along the C2 symmetry axis parallel to d: Pfe=Pfed.
1.6 Former works on flexo-electricity of a nematic layer with hybrid anchoring
The flexo-electric polarization per unit area of the dowser texture is related to that of a nematic layer with hybrid anchoring conditions - planar on one limit surface and homeotropic on the other one - which has been studied extensively in past. Indeed, as shown in Fig.1.4, the dowser texture is a superposition of two hybrid aligned textures - a lower one (labelled ) for 0zh/2 and upper one (labelled ) for h/2zh. The two hybrid aligned textures are related by the C2 symmetry of the dowser texture.
When considered separately, these hybrid aligned textures have polarisations per unit area given by:
| (11) | |||||
| (12) |
Let us emphasize that signs of the x and z components of the flexo-electric polarisations displayed in Fig.1.4a correspond to e3-e0 and e1+e0.
First experiments with the hybrid geometry were made by I. Dozov et al. 10. The electric field E applied in y-direction exerted a torque on the Pxl component of the polarisation. Let us stress that in this hybrid geometry (identical with lower half of the dowser texture in Fig.1.4), the planar anchoring on the upper glass slide hinders rotation of the splay-bend texture so that its deformation is torsion-like. The value of the pertinent flexo-electric coefficient obtained by Dozov et al. with MBBA was
| (13) |
Its negative sign means that the orientation of the flexo-electric polarisation Pxl in MBBA is contrary to the one in Fig.1.4a.
More recently, D.R. Link et al. performed experiments with a 5CB nematic film floating on the surface of glycerol 11 where the splay-bend texture (identical with upper half of the dowser texture in Fig.1.4) is free to rotate around the z axis similarly to the dowser texture in our experiments discussed below. The local azimuthal orientation of this floating splay-bend texture was indicated by a 2D unitary vector field c similar to the dowser field d except for its sign which was taken opposite to d. Using this convention, the in-plane component of the flexo-electric polarisation can be written as:
| (14) |
This floating, free-to-rotate splay-bend hybrid texture was submitted to an in-plane electric field. From the width of 2 walls induced by the electric field E in the c field (see section 5.2.1), Link et al. determined the value of the pertinent flexo-electric coefficient in 5CB :
| (15) |
This means that the in-plane flexo-electric polarisation Px detected by by Link et al. in 5CB would have the same direction as the one in MBBA: being parallel to c it would be opposite to d.

As we will see below, our experiments with the dowser texture are similar both to those of Link et al. and of Dozov et al. because the electric field was applied in the xy plane of the nematic layer. In other experiments with the hybrid splay-bend texture, the electric field was applied in z direction orthogonal to the nematic layer. For this reason we will not discuss them here.
1.7 The aim of the present work
Stimulated by former experiments of Giomi et al.1 on trapping of antimonopoles in stagnation points of flows in microfluidic junctions, we plan to use the expected flexoelectric polarisation of the dowser texture for manipulation of defects of the dowser field by electric fields of appropriate geometry.
Here we report only on preliminary experiments performed with the aim to detect the sign and the amplitude of the flexo-electric polarisation in MBBA and 5CB. For this purpose we used the simplest geometry of a homogeneous electric field applied in the direction orthogonal to the dowser field.
As we will see below, in the case of MBBA our result, P antiparallel to d (i.e. ), agrees in sign with findings of Dozov et al. however, in the case of 5CB, we have found, contrary to Link et al. that P is parallel to d (i.e. ).
As we have found it quite easy to make a sign error during determination of the pertinent coefficient , we represented in Fig.4 16 typical aspects of the flexo-electric polarisation density calculated for the dowser texture, defined by Eq.1, using 16 sets of flexo-electric ceoffcients defined by with and .
This scheme shows clearly that the mean polarisation is parallel (antiparallel) to d when is positive (negative).
2 Experimental
2.1 Setup
For the study of the interaction of the dowser texture with electric fields and, in particular, for the detection of the flexo-electric polarisation of the dowser texture we used the setup depicted in Fig.1.7. It is identical with the one that has been described in more details in ref.6 except for the glass slide which now can be equipped with ITO electrodes of various geometries.
In the work presented here we used the two-gap system of three ITO electrodes depicted in Fig.1.7c. The central electrode ITO2 is grounded, while the two other electrodes ITO1 and ITO3 are connected together and fed with an AC alternating voltage U(t)=U of frequency f=20mHz. The amplitude Uo was 5V in the case of MBBA and 3V in the case of 5CB. With the width of the gap lg=1mm one obtains thus Emax=5 or 3 V/mm.
Each experiment was made in three steps:
-
1.
Generation of the dowser texture by an adequate manipulation of the sample thickness (see ref.5).
-
2.
Relaxation of the dowser field to its radial configuration by action of the cuneitropism.
-
3.
Application of electric fields by means of systems of ITO electrodes located at the lower surface of the glass slide.
2.2 Conductive and dielectric regimes
The geometry of the electric field generated by our systems of ITO electrodes depends crucially on the frequency f of the potential difference U(t)=Uocos(2ft) applied to them. Indeed, it is well known since the first studies on electrohydrodynamic instabilities in nematics that two different regimes are possible (see f.ex. ref.8).
Let be the characteristic time of charges relaxation in our sample considered as a capacitor C, formed by ITO electrodes and filled with a nematic treated as a resistor R. Typically is of the order of a few milliseconds. Therefore at the frequency used in experiments f=20mHz, which is much lower then , the field E is produced in the so-called conductive regime. In the "one-gap" geometry the corresponding equipotentials are represented approximatively in Fig.2.2a. The electric field is uniform and its value is simply
| (16) |
At frequencies of the order of 10kHz, the field produced in the dielectric regime (see Fig.2.2b) would be much less uniform: its intensity would vary across the gap and would depend on the dielectric constants of the nematic and on dimensions of the cell.
3 Measure of e3-e1 in MBBA and 5CB
3.1 Geometry
In the plane/sphere geometry of our samples, the cuneitropism induces the radial configuration of the dowser field with d//g=gradh. A typical view of this texture with a defect (called residual monopole) in its centre is shown in Figs.7a and b. This radial dowser field d is submitted to the electric field E=-U/lg generated by a potential difference U between the ITO1 and ITO2 electrodes separated by the parallel gap of width lg=1mm. As this relatively narrow gap is oriented radially, the electric field E is with a good approximation orthogonal to the initial dowser field d: (defined in Fig.2c).
This geometry has two advantages:
-
1.
the torque due to the induced polarisation given by Eq.7 vanishes,
-
2.
the torque due to the flexo-electric polarisation is extremal:
3.2 Experimentum crucis, determination of the sign of e3-e1
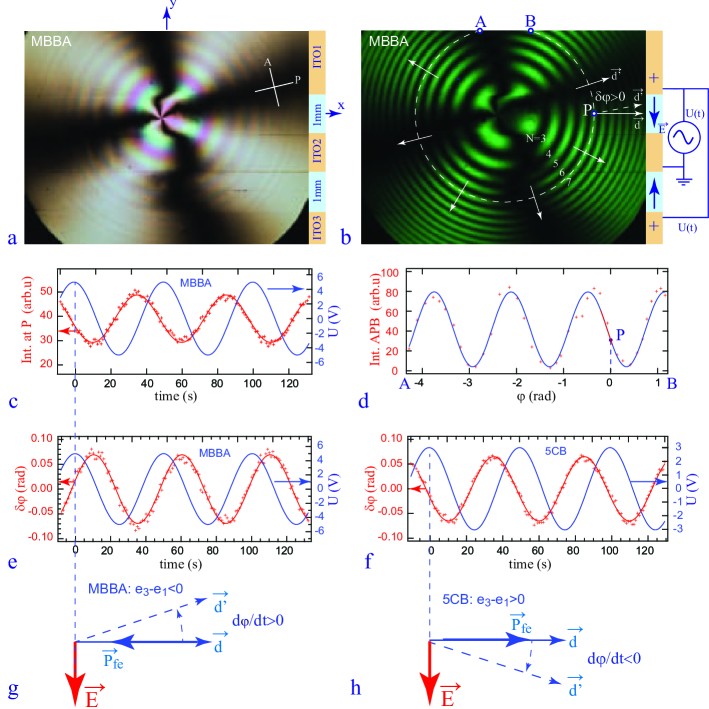
Our first task was to determine the sign of the pertinent flexo-electric coefficient e3-e1 by means of a very simple experimentum crucis. With the aim to detect directly rotation of the dowser field d induced by the electric field E, the crossed polarisers have been tilted by about =22.5∘ with respect to the initial orientation d//x of the dowser field in the gap. In this geometry, variations (t) of the orientation of the dowser field induced by the electric field E(t)=-U(t)/lg can be deduced from variations of the intensity of the transmitted light I(t).
Let us consider for example the point P located on the bright isochromatic interference fringe (marked in Fig.7b with a dashed line). Upon application of the alternating voltage to the ITO1/ITO2 gap, the intensity of the transmitted light varies as shown in Fig.7c. At the first maximum of the applied voltage, the intensity of the transmitted light I(t) is decreasing. This means that the dowser field is rotating in the anticlockwise direction out from the equilibrium orientation d toward d’ (see Fig.7b) for which the intensity of the transmitted light is lower.
For U=+5V, the electric field E has the -y direction as depicted in Fig.7g. Thus the angle between E and d is increasing. This means that the direction of the torque exerted by the electric field on the dowser field is opposite to the one shown in Fig.2c. The flexo-electric polarisation Pfe is thus opposite to d and P0.
Using the definition we can already conclude that in MBBA the flexo-electric coefficient e3-e1 is negative in agreement with the result of Dozov et al. 10.
With the aim to measure the value of e3-e1, one has to determine quantitatively variation of the dowser field angle. For this purpose we performed a calibration experiment which consists in measuring the intensity of the transmitted light I() along the circular dashed line path APB defined in Fig.7b. As expected, the plot of I() shown in Fig.7d obeys to the expression:
| (17) |
in which corresponds to the tilt angle of crossed polarizers with respect to E.
In the vicinity of the point P (where =0), one has a linear variation of I with
| (18) |
with a negative slope dI/d=-141. Using this relationship between I and we transformed the plot I(t) from Fig.7c into the plot (t) shown in Fig.7e.
Before a detailed discussion of this plot obtained with MBBA, let us compare it with the analog plot shown in Fig.7f obtained, by an identical experiment, with 5CB. Obviously, at the first maximum of the applied voltage (+3V instead of +5V in the case of MBBA), the angle between the dowser field and the electric decreases, contrary to the case of MBBA.
3.3 Determination of e3-e1
From plots in Fig.7e is obvious that the change (t) in the orientation of the dowser field is retarded by with respect to the electric torque proportional to U(t)=Uocos(2ft). Such a dissipative behavior is expected when the driving electric torque is balanced mainly by the viscous torque:
| (19) |
Indeed, in such a case one has
| (20) |
with
| (21) |
Using this expression we obtain an evaluation of the flexo-electric polarisation:
| (22) |
From the plot in Fig.7e we obtain =0.07 for Uo=5V and f=20mHz. The thickness h in the point P can be estimated from the interference pattern inFig.7b. As the point P is located on the bright fringe with the index N=6.5 we have
| (23) |
with 0.53m. The mean birefringence of the dowser texture is by definition:
| (24) |
with
| (25) |
In MBBA no=1.557 and ne=1.792 9 so that C=0.245 and by numerical integration of the equation 24 one obtains =0.111. In the case of 5CB with no=1.51, ne=1.75 and C=0.255 one obtains almost the same value of =0.113. The local thickness in point P in Fig.7 is thus h=31m in both cases of MBBA and 5CB.
The missing value of the effective rotation viscosity in equation 22 can be estimated as
| (26) |
Using results of measurements of made in MBBA and 5CB by Oswald et al. 12 one obtains =50 mPa.s.
Finally, using expression 22 we gets:
| (27) |
and, using equation 11
| (28) |
In the case of 5CB (see Fig.7f) we have measured =-0.065 for Uo=3V and f=20mHz. Using h=31m, =50 mPa.s we obtain
| (29) |
and
| (30) |
4 Flexo-electric modulation of birefringence
4.1 Field-induced motion of isochromes in MBBA and 5CB
The interference figure in polarized light of the dowser texture in its radial configuration is made of four isogyres forming a maltese cross and of circular concentric isochromes unveiling thickness variation in the plane/sphere geometry. In experiments discussed above the flexo-electric polarisation was determined from the motion of the right isogyre making the angle of with the ITO1/ITO2 gap.
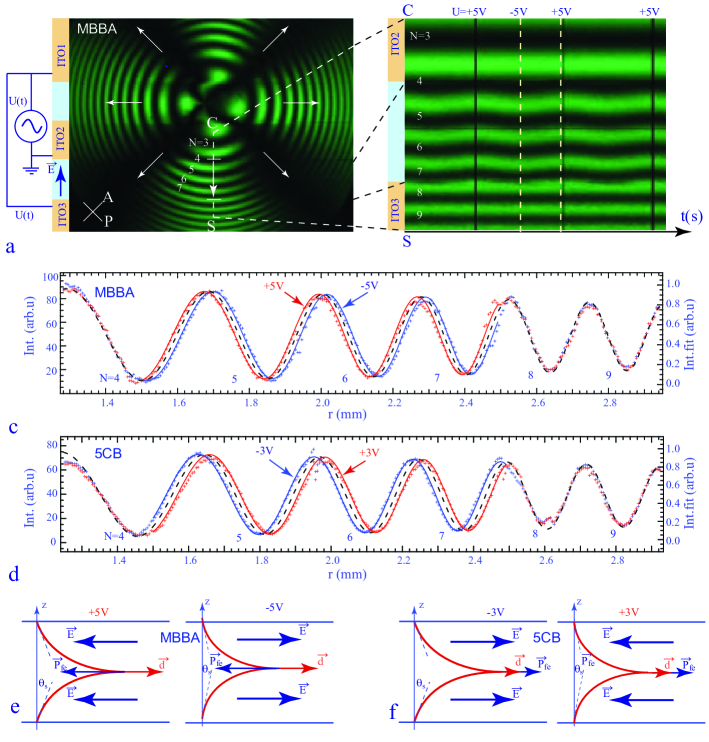
During these experiments we observed unexpected motions of the N=5, 6 and 7 isochromes located in the second, ITO2/ITO3 gap. We have therefore performed another experiment with crossed polarizers tilted by with respect to the direction of the electric field as it is shown in Fig.8a. In this configuration the contrast of isochromes on the dashed line CS is the best. As previously, an alternating voltage U(t)=Uocos(2ft) of frequency f=20mHz and amplitude Uo=5V was applied to the gap ITO2/ITO3 and a video with frame rate 1/sec was recorded.
Fig.8b shows a spatio-temporal cross section of the video extracted along the dashed line CS defined in Fig.8a. It is obvious that the N=5, 6 and 7 isochromes located in the ITO2/ITO3 gap are set in motion by the action of the electric field. To determine the phase relationship between this motion and the applied field we obturated briefly the camera at instants ti corresponding to the maximum of the voltage U(ti)=+5V. By this means we produced vertical black lines well visible in the spatio-temporal cross section. Clearly, there is no phase shift between the excitation U(t) and the displacement of isogyres: the response of the dowser texture to the applied field is purely elastic.
The amplitude of the displacement of isogyres has been determined from the intensity profiles I-5V and I+5V measured on the spatio-temporal cross section along dashed lines labeled -5V and +5V. Plotted in Fig.8c, these profiles are shifted, with respect to their equilibrium positions, in sections corresponding to the N=5, 6 and 7 isochromes. The intensity plot labeled +5V is shifted to the left which corresponds to an increase of the mean birefringence n. The direction of the shift of the plot labeled -5V is opposite.
The mean birefringence n corresponding to these plots has been determined from fits to the expression:
| (31) |
in which
| (32) |
The radius of curvature of the lens has been determined as Rl=107mm. The wavelength of the green monochromatic light is also known: 0.53m. In the interval the best fits of experimental points labeled +5V and -5V were obtained with ho=22.4m and n+5V=0.097 and n-5V=0.096. Outside of this interval, for the equilibrium dowser texture, the best fit gave no=0.0965.
We repeated the same experiment with 5CB. The corresponding intensity profiles are plotted in Fig.8d. It is obvious that the field-induced shifts are opposite here: the profiles labeled +3V and -3V are shifted respectively to the right and to left. Using Rl=107mm and ho=22.9m, we obtained : n+3V=0.0964, n-3V=0.0977 and no=0.097.
We can conclude that upon the application of an alternating potential difference U(t)=Uocos(2ft) the mean birefringence of the dower texture varies as:
| (33) |
with =+0.005 for Uo=5V in MBBA and =-0.006 for Uo=3V in 5CB.
4.2 Field-induced surface effect
Experimental results described above are similar to those obtained by Madhusudana and Durand 13 in cells with hybrid anchorings when the electric field E is parallel to the z axis instead the y axis as in experiments of Dozov at al. (see Fig.1.4b). They have interpreted them in terms of a model taking into account a finite strength of the homeotropic anchoring on one of the limit glass slides. The planar anchoring on the other slide was supposed to be infinitely strong.
In the present case of the dowser texture this last assumption is not necessary for the anchorings on both limit surfaces are homeotropic and of the same strength.
Below, we will adapt the Madhusudana and Durand’s model to the case of the dowser texture. To start with, we will use one elastic constant approximation for which the energy per unit area of the dowser texture can be expressed as
| (34) |
with
| (35) |
The last term in equation 34 corresponds to the sum of anchoring energies on the glass surfaces with homeotropic anchoring.
Minimisation of Fs leads to the Euler-Lagrange equation
| (36) |
with the solution:
| (37) |
satisfying boundary conditions:
| (38) |
Inserting this solution to the expression of energy 34, one obtains:
| (39) |
Minimisation of Fs with respect to leads to
| (40) |
or, in the limit of small , to
| (41) |
When the ratio K/W=L known as extrapolation length is much smaller than h, one obtains a very simple expression:
| (42) |
In the absence of the electric field, for E=0, the angle of the tilt of the homeotropic anchoring is proportional to the elastic torque K((/2)/h) and inversely proportional to the anchoring strength W. The application of the electric field changes is it by =-Ee3/W.
4.3 Determination of e3
We have now to calculate changes in the mean birefringence due the field-driven modulation of the anchoring angle . Inserting eq.37 in 24 one obtains for small C (0.24)
| (43) |
or, using expressions 42 and 16
| (44) |
with
| (45) |
As the equation 44 corresponds to the equation 33, we obtain
| (46) |
To determine the value of e3 from this expression we will use results of the experiment discussed in section 4.1: =0.005 for Uo=5V for MBBA and =-0.006 for Uo=3V in 5CB. The homeotropic anchoring obtained with the egg yolk being weak, we will estimate it strength as W10-6J/m2 (see ref.14). Finally, with lg=1mm, we obtain
| (47) |
and
| (48) |
4.4 Determination of e1
5 Discussion
5.1 Qualitative explanation of experimental results
Using these values of the flexo-electric coefficients determined in our experiments we can select two polarisation patterns from the set of 16 typical patterns shown in Fig.4. They are surrounded by dashed-line frames in Fig.4 and labeled MBBA and 5CB. For convenience sake they are reproduced in Fig.4.3.
Let us consider first the case of MBBA. Its polarisation pattern is shown in Fig.4.3a2 beside the unperturbed dowser texture (a1). Upon application of the electric field in the direction opposite to the dowser field, the polar angle grows and the dowser texture is deformed as shown in b1. One can see it as a truncated version of the unperturbed one. For this reason, the corresponding polarisation pattern shown in b2 is a truncated version of the equilibrium one shown in a2. Obviously, by removing bands with polarisation Pfe opposite to E, the energy -PE is lowered.
In the case of 5CB (Figs.4.3c and d), the same arguments held when the field E is applied in the direction of the dowser field.
5.2 Perspectives
Once the existence of the flexo-electric polarisation in the radial dowser texture is firmly established and approximate values of the flexo-electric coefficients in MBBA and 5CB are known, we could discuss results of experiments with more complex dowser fields, possibly containing +2 and -2 defects, submitted to electric fields with more complex geometries. As these results are too abundant for their presentation here we postpone their discussion to other forthcoming papers. Nevertheless, it seems useful to mention here briefly two of them.
5.2.1 Wound up dowser texture
The first one is related to the work of Link et al. 11 on the width of 2 walls created be an electric field in a wound up c field of a 5CB layer floating on glycerol. In the wound up c field the azimuthal angle varies, let us say, as =2y/. When observed between crossed polarizers (parallel to x and y axes), such a wound up c texture appears as a system of equidistant black isogyres parallel to the x axis and located at yi=i/4, with integer i. Upon application of the electric field in x direction, Link et al. observed that isogyres corresponding to c//E, are enlarged while the other isogyres are assembled into 2 walls. Using the definition of the c vector given in ref.11 and reproduced here in Fig.1.4c, the authors concluded that the flexo-electric polarisation P has the direction of the c field so that the pertinent coefficient e3-e1 is negative. From the width of 2 walls Link et al. determined e3-e1=-11pC/m.
We have performed similar experiments with a dowser texture d wound up in y direction by the method described in ref.6. In the case of 5CB, upon application of the electric field in x direction, the system of equidistant black isogyres (see Fig.10a) was split into 2 walls separated by bands in which the dowser field d is parallel to the applied field E (see Fig.10b). This means that in 5CB the flexo-electric polarisation P has the direction of the d field.
In the case of MBBA (see Figs.10c, d and e) when the electric field was applied in -x direction the system of equidistant isogyres shown in Fig.10c was split into 2 separated by bands in which the dowser field d is antiparallel to the applied field E (see Fig.10e). This means that in MBBA the flexo-electric polarisation P has the direction oppposite to the d field.
These two experiments with a wound up dowser texture lead to the same conclusions as those of experiments with the radial dowser texture discussed in section 3: in 5CB the pertinent flexo-electric coefficient e3-e1 is positive while in MBBA it is negative.
Let us emphasize that conclusions of experiments with the wound up dowser texture depend crucially on the detection of the dowser field direction in isogyres enlarged by application of the electric field. To determine this direction we submitted the wound up dowser texture to the action of a divergent radial flow driven by decreasing the distance ho between the lens and the glass slide. The pattern of initially equidistant isogyres was perturbed as shown in Fig.10d: isogyres in which the dowser field d has the same direction as the flow velocity v are enlarged by rheotropism discussed recently in ref.6.
5.2.2 Manipulation of defects
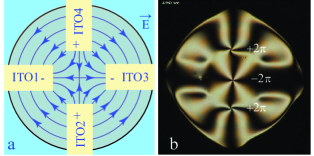
The second experiment depicted in Fig.11 proves that as expected the defects of the dowser texture can be manipulated by electric fields of appropriate geometry. In Fig.11b, as expected by analogy with the work of Giomi et al. 1, a -2 defect is trapped in the stagnation point of a quadrupolar electric field generated by a system of four ITO electrodes. Let us emphasize that beside this -2 defect the dowser field inside the nematic droplet contains, for topological reason, also two +2 defects. Their positions are also stable.
Conflicts of interest
There are no conflicts to declare.
Acknowledgements
P.P. is grateful to L. Giomi, T. Lubensky and V. Vitelli for the invitation to the Lorentz Workshop on Topology in Complex Fluids and for fruitful discussions about generation and handling of topological defects. We thank P. Oswald for discussions and for the information about the reference 12 containing careful measurements of the viscosity coefficient . This work benefited from the technical assistance of V. Klein, S. Saranga, J. Sanchez, M. Bottineau, J. Vieira, I. Nimaga and C. Goldmann. P.P. thanks also S. Ravy for a financial support. MHG thanks FEDER funds through the COMPETE 2020 Program and National Funds through FCT-Portuguese Foundation for Science and Technology under projects numbers POCI-01-0145- FEDER-007688 (Reference UID/CTM/50025).
Notes and references
- 1 L. Giomi, Z̆. Kos, M. Ravnik and A. Sengupta, Cross-talk between topological defects in different fields revealed by nematic microfluidics, PNAS 114(29,) E5771-E5777 (2017).
- 2 P. Pieranski, Cristaux liquides : l’univers metastable des monopoles nematiques, Reflets de la physique, May 2017, 6-12, May (2017), doi:10.1051/refdp/201753006,
- 3 J.M. Gilli, S. Thiberge, A. Vierheilig and F. Fried, Inversion walls in homeotropic nematic and cholesteric layers, Liquid Crystals 23, 619-628 (1997).
- 4 P. Pieranski, M.H. Godinho, S. Čopar, Persistent quasi-planar nematic texture: Its properties and topological defects, Phys. Rev. E 94, 042706 (2016)
- 5 P. Pieranski, S. Čopar, M.H. Godinho, M. Dazza, Hedgehogs in the dowser state, Euro. Phys. J. E, 39 121 (2016).
- 6 P. Pieranski, J.-P. Hulin, M.H. Godinho, Rheotropism the dowser state,Eur. Phys. J. E 40 109 (2017).
- 7 R.B. Meyer, Piezoelectric effects in liquid crystals, PRL 22, 918-921 (1969).
- 8 P.-G. de Gennes and J. Prost, The physics of liquid crystals, Clarendon Press, Oxford, (1993) page 136.
- 9 D. Schmidt, M. Schadt and W. Helfrich, Liquid-crystalline curvature electricity: The bending mode in MBBA, Z. Naturforsch. 27a, 277-280 (1971.
- 10 I. Dozov, Ph. Martinot-Lagarde and G. Durand, Flexoellectrically controlled twist of texture in a nematic liquid crystal, J. Physique Lettres, L-365, 356-369 (1982)
- 11 D.R. Link, M. Nakata, Y. Takanishi, K. Ishikawa, H. Takezoe, Flexo-electric polarisation in hybrid nematic films, Phys. Rev. E, 65 010701(R) (2001).
- 12 P. Oswald, G. Poy, F. Vittoz and V. Popa-Nita, Experimental relationship between surface and bulk rotational viscosities in nematic liquid crystals, Liquid Crystals, 40 734-744 (2013).
- 13 N.V. Madhusudana and G. Durand, Linear flexo-electro-optic effect in a hybrid aligned nematic liquid crystal cell, J. Phys. Lett. 46, L-195 (1985).
- 14 B. Jérôme, Surface effects and anchoring in liquid crystals, Reports on Progress in Physics, 54, 391 (1991).