Accelerating Continuous Integration with Parallel Batch Testing
Abstract.
Continuous integration at scale is costly but essential to software development. Various test optimization techniques including test selection and prioritization aim to reduce the cost. Test batching is an effective alternative, but overlooked technique. This study evaluates parallelization’s effect by adjusting machine count for test batching and introduces two novel approaches.
We establish TestAll as a baseline to study the impact of parallelism and machine count on feedback time. We re-evaluate ConstantBatching and introduce BatchAll, which adapts batch size based on the remaining changes in the queue. We also propose TestCaseBatching, enabling new builds to join a batch before full test execution, thus speeding up continuous integration. Our evaluations utilize Ericsson’s results and 276 million test outcomes from open-source Chrome, assessing feedback time, execution reduction, and providing access to Chrome project scripts and data.
The results reveal a non-linear impact of test parallelization on feedback time, as each test delay compounds across the entire test queue. ConstantBatching, with a batch size of 4, utilizes up to 72% fewer machines to maintain the actual average feedback time and provides a constant execution reduction of up to 75%. Similarly, BatchAll maintains the actual average feedback time with up to 91% fewer machines and exhibits variable execution reduction of up to 99%. TestCaseBatching holds the line of the actual average feedback time with up to 81% fewer machines and demonstrates variable execution reduction of up to 67%. We recommend practitioners use BatchAll and TestCaseBatching to reduce the required testing machines efficiently. Analyzing historical data to find the threshold where adding more machines has minimal impact on feedback time is also crucial for resource-effective testing.
1. Introduction
Testing is both time-consuming and resource intensive. To reduce both resource consumption and provide earlier feedback, test selection has been widely adopted in the industry and extensively studied (Rothermel and Harrold, 1996; Engström et al., 2010; Chen et al., 2011). Test selection’s inherent trade-off is that not all tests are run, and some test failures may be missed. On the other hand, test prioritization guarantees that all tests will be run, but those that are more likely to reveal faults will be run first, reducing feedback time on test failures, but not reducing the resource usage in testing (Bagherzadeh et al., 2022; Zhu et al., 2018; Rothermel et al., 2001). In contrast, batch testing which groups builds for testing and bisects on failure is conceptually better than both test selection and prioritization because all the tests are run with less resource consumption and much faster overall feedback times (Najafi et al., 2019a; Beheshtian et al., 2021). Most changes require similar test sets, and the saving in batch testing is achieved because batching groups changes and tests to reduce the number of redundant test runs among builds. For example, if we are testing four builds in a batch that request the same tests, and the batch passes, we will save three build test executions. However, when a batch fails, a bisection algorithm must be run to identify the culprit build that is causing the failure. Bisection can slow individual builds, but when fewer than 40% of builds fail, batching and bisection effectively reduce overall feedback time (Beheshtian et al., 2021).
Despite its effectiveness, only few studies examine batch testing. Najafi et al. (Najafi et al., 2019a) studied batching and bisection techniques at Ericsson and found that constant batch sizes can reduce the resource usage, i.e. execution time, necessary to run all the required tests by up to 42%. Beheshtian et al. (Beheshtian et al., 2021) evaluated open-source Travis torrent projects and proposed BatchStop4, which can reduce build test executions on average by 50%. Bavand et al. (Bavand and Rigby, 2021) used a dynamic batch size approach using the historical failure rate of the projects and reduced the execution time by about 47% against their baseline. Previous batch testing works make three assumptions that are unrealistic on large software systems. First, they do not run tests in parallel and implicitly use a single machine. Second, after the failure of a batch, they rerun all tests. This is inefficient because we know which tests failed on a batch, and we do not need to bisect and re-run the passing tests. Third, previous researchers only focus on reducing resource consumption and do not investigate the feedback time outcomes for different batching algorithms.
In this study, we address the limitations of prior work, and study systems with a much larger scale of CI builds and tests: Ericsson and Chrome. To understand the impact of parallelization on testing, we replicate the TestAll algorithm which simply runs all tests without applying any batching technique, but unlike prior work, we vary the number of machines available for testing and run tests in parallel. Our outcome measures are the feedback time, i.e. wall time per test, and total test execution time reduction for all the tests. We replicate ConstantBatching from the Beheshtian et al.’s study (Beheshtian et al., 2021) which uses a constant batch size for batching, and we introduce two novel BatchAll and TestCaseBatching techniques. BatchAll algorithm adapts the batch size to the number of remaining changes inside the queue to batch them all at each time. TestCaseBatching approach works the same as BatchAll except that it also accepts new changes while running the batch. We adopt different numbers of machines on these batching algorithms and evaluate their performance by using feedback time and execution reduction.
We provide results for the following research questions:
RQ1: How does parallelization affect the feedback time performance of TestAll with varying numbers of machines?
RQ2: How effective is ConstantBatching in terms of feedback time and execution reduction when executed in parallel with varying numbers of machines?
RQ3: How effective is BatchAll in terms of feedback time and execution reduction when executed in parallel with varying numbers of machines?
RQ4: How effective is TestCaseBatching in terms of feedback time and execution reduction when executed in parallel with varying numbers of machines?
Our major contributions to this study are as follows.
-
•
Parallelism in batching: we study the impact of parallelization on testing in general and batching.
-
•
Datasets: we use two large-scale Ericsson and Chrome datasets which run millions of tests per day and are suitable to run our batching algorithms and apply parallelism.
-
•
Simulation: we replicate TestAll and ConstantBatching algorithms and introduce two novel BatchAll and TestCaseBatching approaches.
-
•
Outcome measure: we use feedback time and execution reduction measures to evaluate the performance of batching algorithms.
-
•
Results: we reach the following conclusions.
-
(1)
The impact of parallelism on the performance testing algorithms exhibits a non-linear relationship.
-
(2)
ConstantBatching with a batch size of 4, utilizes up to 72% fewer machines to maintain the actual average feedback time and provides up to 75% in execution reduction, regardless of the number of machines utilized.
-
(3)
BatchAll maintains the actual average feedback time with up to 91% fewer machines and exhibits variable execution reduction of up to 99% depending on machine utilization and the dataset.
-
(4)
TestCaseBatching holds the line of the actual average feedback time with up to 81% fewer machines and demonstrates variable execution reduction of up to 67% depending on machine utilization and the dataset.
-
(1)
2. Background and Methodology
We study a proprietary project at Ericsson and the Google-led open source project Chrome. The project we examine at Ericsson tests the software that runs on cellular base stations. In this context, the machines used for testing are extremely expensive and limited in number. Ericsson spends millions on testing infrastructure and still needs to batch tests in order to test all the changes. Test resources are scarce, and managers discuss the tradeoff of buying new test machine resources for having slower feedback or removing more tests through selection and risking failures slipping through.
Testing at Ericsson involves a multistage process, including various testing levels from unit tests to integration tests, before changes are integrated into the released product. Our study focuses on confidence levels 2 and 3, primarily consisting of integration tests, which significantly contribute to the overall testing costs at Ericsson compared to other levels like unit testing. Thus, we capture the test results, execution time, and change timestamps for each test case during integration testing to gain insights and optimize this critical stage.
To generate our sample dataset, we evaluate the integration testing of a project at Ericsson. We capture the test results for the period of six weeks from January to February 2021. For this duration, we observe over 11,000 changes. For confidentiality reasons, we do not disclose other data or aspects of the testing process and use the data to simulate batching scenarios where machines are very expensive and highly utilized leading to strong resource constraints.
Chrome is one of the most popular browsers in the world, and it is representative of a large-scale project. There are millions of tests run each day, and there are a massive number of builds and tests running in parallel. The testing process used by Chrome was described in detail by Fallahzadeh et al. (Fallahzadeh and Rigby, 2022), we summarize briefly below. A change list, i.e. pull request, is committed to the Gerrit code review tool for revision. Reviewers may suggest changes to the change list to improve the code or when they find issues. If the change is satisfactory to the reviewers, it will be sent for testing on the try bot builders. After being approved by the builders, the change is merged into the main Chrome repository.
For the Google Chrome case, we use the Chrome test results published by Fallahzadeh et al. (Fallahzadeh and Rigby, 2022). This publicly available dataset is captured by calling the Gerrit code review APIs from Chrome. This dataset consists of 276 million test cases for the month of January 2021 for Chrome. These test runs are for 9,524 changes across 49,932 distinct test suites for an average of 8.9 million test case runs per day. The rate of failures for the builds in this project is about 8.5%. We describe how this data is used in our simulation below.
For both Ericsson and Chrome, the data of interest are the test id, test name, build id, build start time, build end time, status, final result, and test duration. We use these attributes to implement our various batching algorithms which will be discussed in the following. This methodology can be applied to any project that collects this basic data. We release our scripts and data for Chrome in the supplemental material in an anonymized replication package.
2.1. Simulation Method and Outcome Measures
In this study, we use the record of real historical test runs and only vary the number of machines to evaluate different batching algorithms. We do not re-run any tests. Instead, the process involves determining tests for a batch based on the historical test results of the included builds, selecting the maximum execution time among the corresponding builds for each test to capture the worst-case execution time. The simulated batch is then dispatched across available machines, optimizing test allocation for parallelism and resource utilization, considering the varying number of machines in different scenarios. During the simulation, we assume that a test will fail in the simulated batch if it failed in any of the builds included in the batch, and a test is considered to pass in the simulated batch only if it passed in all the builds. This approach ensures an accurate reflection of test behavior and outcomes in the simulation. We preserve the order of test runs and discuss the limitations of simulation in Section 6.
The data necessary to conduct the simulation is not company specific and the simulations can be applied to the test results of the other projects as well. The data includes the code change under test, the time the change was available for testing, the requested tests for the change, and the duration that each test took to run. The changes are then queued based on their arrival time and simulated using the batching algorithm, i.e. how efficiently would we have been able to process the same changes and requested tests?
Feedback time: One of the most important factors in designing a continuous integration testing infrastructure is giving fast feedback on test outcomes for each change. The time between committing a change and receiving all test verdicts is defined as feedback time.
| (1) |
For example, if a developer commits a change at 9 am and receives the feedback that the tests passed successfully on that change at 10 am, the feedback time will be 1 hour for that change. In contrast, if the change was queued for 1 hour, then the feedback time would be 2 hours, a doubling in feedback time. In the examples, we use a unit to represent time, but in the study, we use the actual time each test takes to run. The time a test will be queued depends on the available resources and batching algorithm.
To contrast batching algorithms, we use the AvgFeedback as the sum of the feedback times for each change in the project divided by the total number of changes for the project. The equation below shows the AvgFeedback for batching algorithm across changes with machines.
| (2) |
To contrast batching algorithms, we calculate the FeedbackReduction as the percentage decrease in AvgFeedback of batching algorithm, A1, compared to the AvgFeedback of the algorithm, A2, with machines.
| (3) |
Execution Reduction: The ExecutionReduction metric quantifies the performance of different batching algorithms in terms of saving execution time with varying numbers of machines. It is calculated using Equation 4.
| (4) |
This formula calculates the execution reduction in test executions achieved by a batching algorithm (A) with m machines compared to running all tests in their original order (TestAll). Here, represents the number of tests executed by the batching algorithm (A) with m machines, and is the total number of tests executed by TestAll. The formula calculates the percentage of time required for running the tests using approach A with m machines relative to TestAll. Subtracting this percentage from 1 provides the percentage of execution time that was reduced. For example, if approach A with m machines takes 40% less time to run tests than TestAll, the ExecutionReduction by A with m machines is calculated as 60%, indicating that approach A with m machines saves 60% of the time in test execution compared to TestAll.
By using this formula as a metric, we can compare the performance of different batching algorithms and determine their efficiency in saving time during test execution.
Simulation Setup and Plateau Thresholds. To evaluate the batching algorithms’ performance in terms of feedback time, we compare them to the actual average feedback time as the baseline. Due to the complexity and unavailability of the exact number of machines required to achieve the actual average feedback time in both Ericsson and Chrome, we use the baseline number of machines needed to maintain the actual average feedback time for TestAll. Our simulations vary the available resources (machines) from 1 to 9 for Ericsson and from 1 to 375 for Chrome, where the average feedback time for all algorithms reaches a plateau.
Determining a plateau often involves the expertise of domain experts who suggest appropriate thresholds. For Ericsson, we establish a threshold of 6 percent improvement from the actual feedback baseline, indicating that beyond this point, the improvement in feedback time becomes insignificant with a unit increase of 1 machine. In the case of Chrome, the threshold is set at 2 percent improvement from the baseline, considering a unit increase of 25 machines. These thresholds are carefully determined to account for the specific requirements and trade-offs in each domain. Ericsson, with its high-cost machines, necessitates a more stringent plateau criterion, while Chrome, benefiting from machine farms, adopts a lower threshold to optimize performance.
3. Batching Algorithms
Although parallel testing can help to reduce the feedback time, even at large companies using farms of servers to run tests in parallel, they still need batch changes to further reduce resources (Ziftci and Reardon, 2017). In the following, we describe the definitions and formulations for each batching algorithm.
3.1. TestAll
Ideally, each change would be tested immediately and in isolation, running all the requested tests independently of other changes. This approach works well on small projects that are not resource constrained. The feedback time for each change varies and depends on the time that a change waits in the queue.
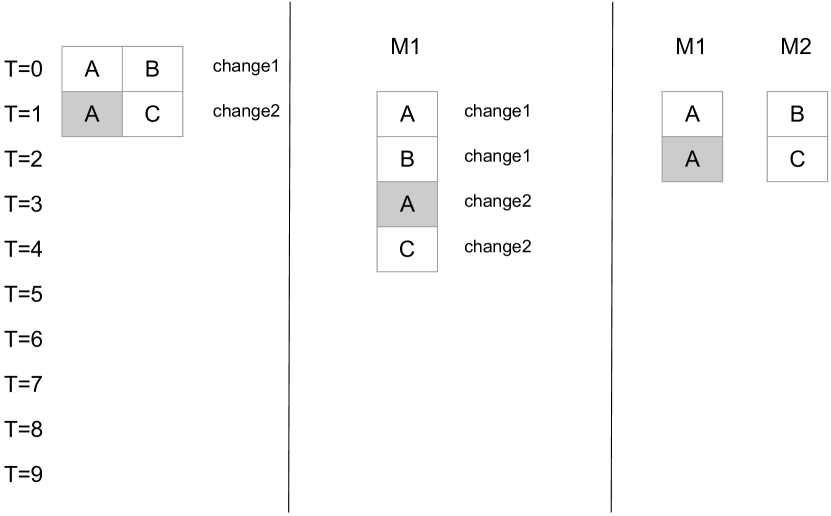
Figure 1 describes the testing process for TestAll algorithm with 1 and 2 machines scenarios. There are two changes that arrive at and times respectively. When there is only one machine available, all tests are running on a single machine and subsequent changes have to wait in a queue. At the time , the tests belonging to the first change are executed with a feedback time equal to 2 units of time. Test execution for change 2 is finished at resulting in the feedback time of 3 units of time. In the 2 machines scenario, the tests belonging to the changes are distributed between the two machines. At the time both tests A and B for change 1 are executed by the machines M1 and M2, leading to 1 unit of feedback time. At the time , tests are run for all changes, making the average feedback time of 1 in comparison with the previous average feedback time of 2.5 units of time.
3.2. Batch Testing and BatchStop4
TestAll is expensive and sometimes infeasible at large companies, e.g., Ericsson (Najafi et al., 2019a) or Google (Ziftci and Reardon, 2017). Instead of testing every change individually, we can combine multiple changes and run the union of their requested tests in a batch. If a batch passes, we save resources and provide feedback more quickly. However, if a test fails, we need to find the culprit change(s) that are responsible for the failure. If the intersection of the requested tests for the batched changes is large, and most tests pass, the saving could be substantial. In an extreme example, if we batch 50 changes, and each change requests the same tests when the batch passes we save 49 build test executions.
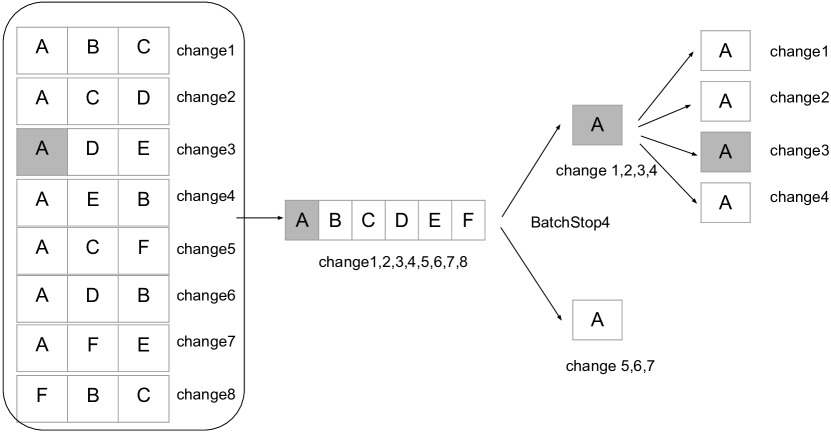
However, when the batch fails, we need to find the culprit change(s) responsible for the failure. Out of different culprit-finding approaches like Dorfman and bisection (Dorfman, 1943; Najafi et al., 2019a), we use the BatchStop4 which has been shown both mathematically and empirically to be the top performing approach (Beheshtian et al., 2021). Figure 2 displays the batching process of 8 changes consisting of different tests with the same execution time. To create the batch, a union of the tests across all the changes is used, which gives 6 distinct tests of A, B, C, D, E, and F to run. Executing the batch fails, leading to the culprit-finding process that requires additional 6 test executions. Since we know that test A failed, we only run this test in the subsequent builds. This ends up running 12 test runs, which is 50% less than the TestAll approach that requires 24 test executions.
3.3. ConstantBatching
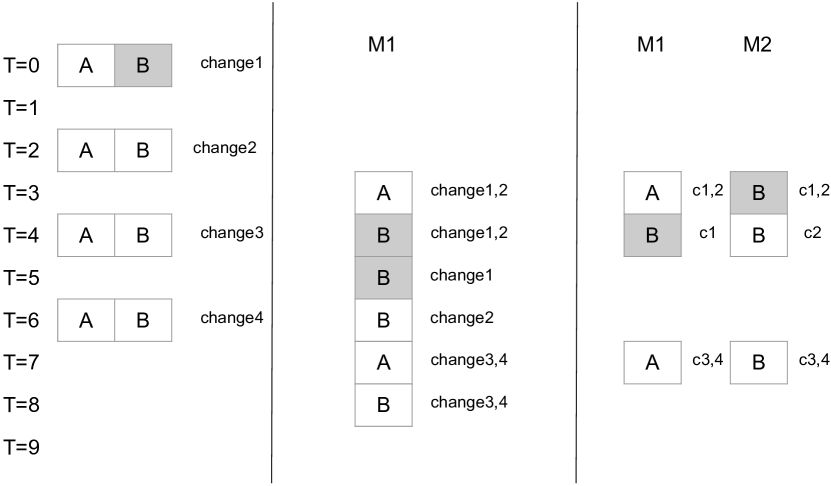
Prior works have selected a constant batch size for testing (Najafi et al., 2019a; Beheshtian et al., 2021). In the ConstantBatching technique, we group changes together and test them in a batch. For example, with , we batch every 8 changes together for testing. Figure 3 shows an example of Batch2 using a single machine as well as having two parallel machines. There are in total 4 changes. The time of committing the changes is equal to T=0, T=2, T=4, and T=6 respectively. For simplicity, we assume each test execution takes 1 unit of time. In a single machine configuration, the feedback time for each build would be 5, 4, 4, and 2 units of time respectively. By using two machines, the feedback time would be 4, 2, 3, and 1 unit of time respectively. We can see when using two parallel machines, there is a time when machines are free and no test has been assigned to them for execution as they have to wait for 2 changes to be available. This affects the feedback time for Change 3.
3.4. BatchAll
The assumption of a constant batch size introduces problems. First, the rate of committed changes varies over time. For example, during the peak of the workday, there may be 1000’s more commits than at night. We need to vary the batch size based on the change queue. In BatchAll, when there are resources available, all the waiting changes, are grouped and the union of required tests is run for the batch. When the testing process of the batch finishes and the corresponding resources are free, another batch is created using all the current waiting changes and the resources are allocated to the new batch.
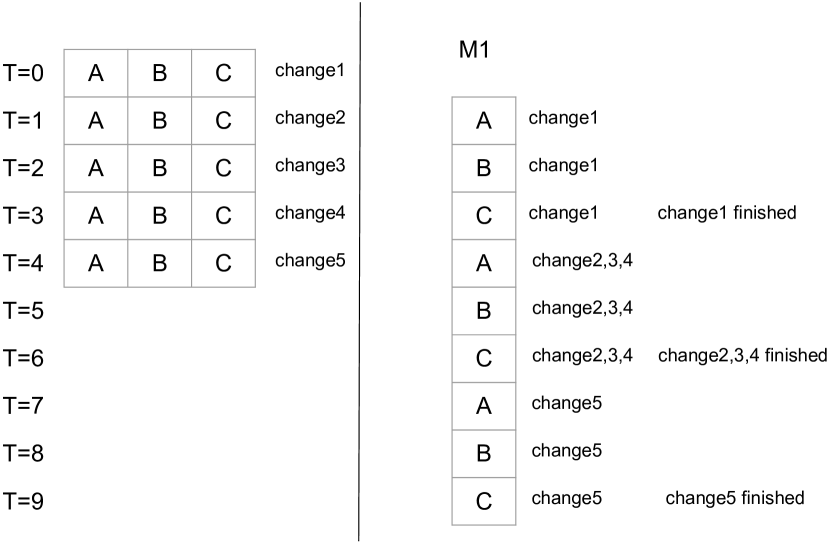
Figure 4 shows an example of BatchAll with a single machine. We assume that there is no failure and all the changes pass the tests. Using BatchAll, after committing the first change, the resources are immediately allocated to it for testing. Change 1 arrives first, and only after it finishes testing Change 1, it batches all the changes that are now waiting, i.e. changes 2, 3, and 4. After testing the second batch of size 3, it runs the tests for Change 5 in a batch of size 1 because no other changes are waiting for testing. The feedback time for each change will be 3, 5, 4, 3, and 5 respectively.
3.5. TestCaseBatching
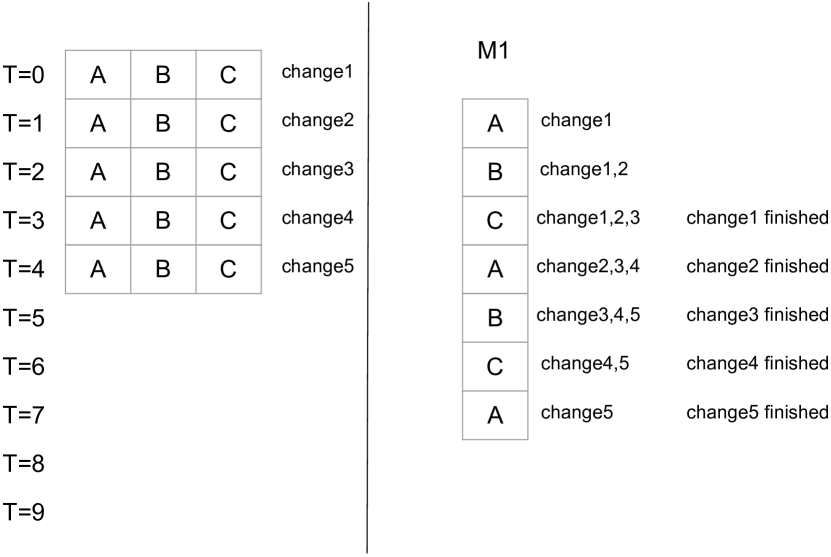
BatchAll can decrease the feedback time by reducing the idle time of resources. However, when all resources are utilized for testing, new changes must be queued until all the tests for the current batch are complete. With TestCaseBatching new changes are added to the batch when any test finishes rather than having to wait for all the tests to finish. This approach requires the requested tests to be queued. To manage the test queue, the requested test cases for each change are added to the queue, i.e. the ChangeID, and TestID. When a test finishes, any new changes are added to the batch and the next test in the queue is run. Once a change has had all its tests run, the results are reported.
In Figure 5 we provide an example of TestCaseBatching. After each test finishes, TestCaseBatching includes any waiting builds and runs the next requested test in the test queue. TestCaseBatching has to run Test A three times because it has finished for Change 1 before Changes 2, 3, and 4 and the algorithm has to run it independently for Change 5. In contrast, TestCaseBatching must only run B and C twice as they overlap when more changes are available. We see that the average feedback time is reduced to 3 compared to the 4 needed for BatchAll, meaning that we get feedback to developers 25% sooner.
4. Results
This section presents the results of our evaluation, comparing the performance of different batching algorithms in terms of feedback time, the number of machines utilized, and the extent of execution reduction achieved. We conduct these evaluations using the Ericsson and Chrome datasets, considering various numbers of machines.
4.1. RQ1: Parallelization with TestAll
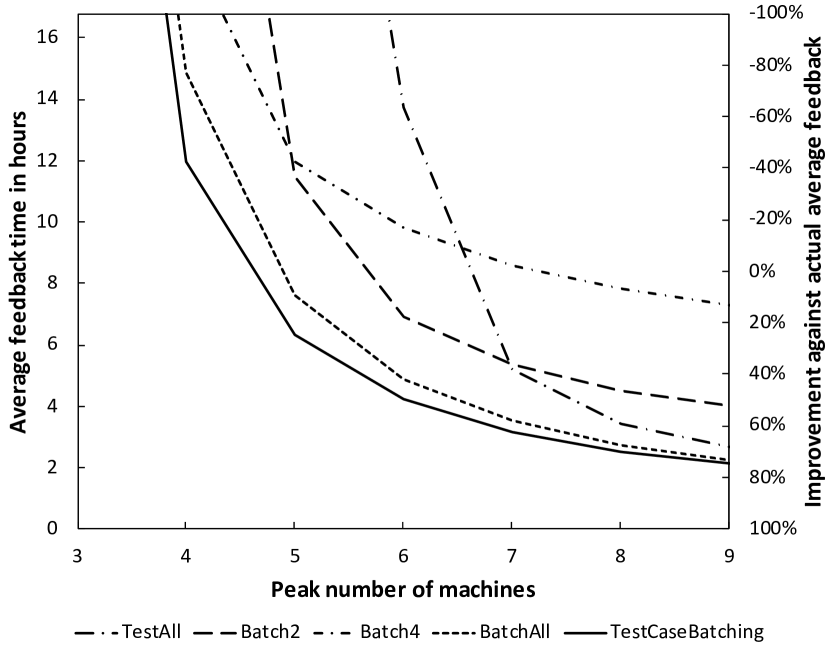
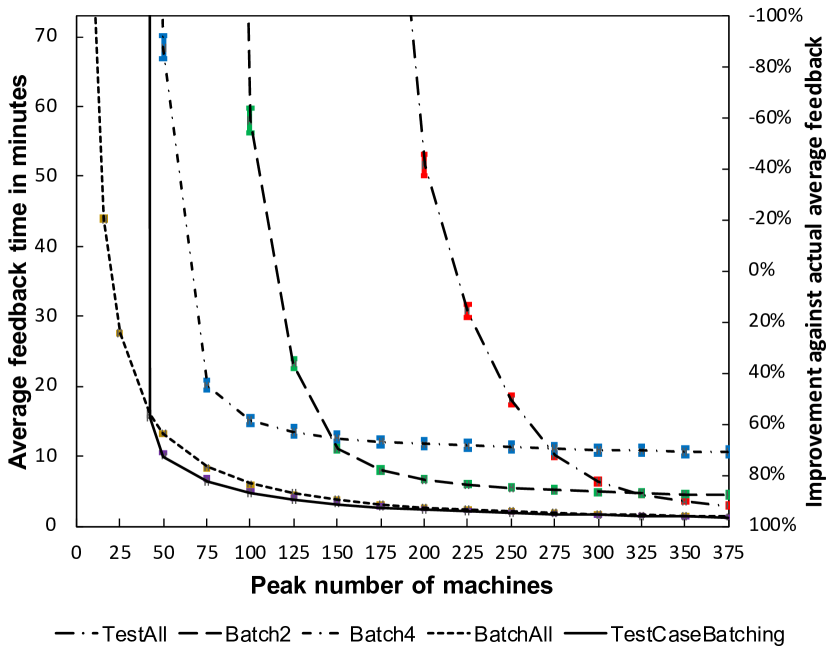
In the TestAll approach, we simulate testing each change individually to understand the impact of parallelization on the testing process. The curves in Figure 6 and 7 show that increasing the number of machines has a nonlinear impact on feedback time. We see that TestAll needs 7 machines to achieve the actual average feedback time of 8.33 hours for Ericsson. For Chrome, we see TestAll needs 217 available machines to achieve the 36.48 minutes average feedback time that is actually observed on Chrome.
Substantial improvement is seen by adding additional parallel machines, but the return on investment diminishes at some point. For instance, in Ericsson, when we increase from 6 to 7 machines there is a speedup of 2.65 times in TestAll algorithm, but the increase from 7 to 8 machines only adds 1.5 times of improvement in feedback time. In Chrome, TestAll algorithm runs 49 times faster when we use 200 machines instead of 100 machines, while when we increase it from 200 to 300 machines it only gets 8.11 times faster. We see that TestAll with 9 machines has plateaued for Ericsson, and we see TestAll with 350 machines has plateaued for Chrome.
Figure 7 displays the 95% confidence intervals for the average feedback time values of all the algorithms analyzed in Chrome.111We are unable to add confidence intervals or compute statistical tests because we no longer have access to the Ericsson data.For the TestAll algorithm, the confidence interval range becomes narrower, decreasing from 4% to less than 1% of the actual average feedback time, as the number of machines increases from 200 to 275 and beyond. This reduction in the width of the confidence interval indicates a decrease in the range of the feedback time distribution.
To compare the feedback time distributions of different batching algorithms for Chrome, we utilize the Wilcoxon Rank-Sum test, which is suitable for comparing two independent samples without relying on distribution assumptions. To address the issue of multiple comparisons, we apply the Bonferroni correction by dividing the desired overall p-value of 0.05 by the number of comparisons. This adjustment results in a p-value cutoff of 0.0003 for each comparison, ensuring a stringent threshold for statistical significance.
The obtained p-values are all significantly lower than the cutoff value, indicating significant differences in the feedback time distributions between most algorithm comparisons. However, the comparison between TestAll and Batch2 at 300 machines yields a p-value of 0.06, suggesting a lack of significant difference in only this case.
We also calculate Cliff’s delta effect size to measure the magnitude and direction of differences between feedback time distributions. In Table 4, we present the effect sizes between various algorithms at different machine counts. This data further supports the observed trend and the significance of the differences depicted in the average feedback time plot shown in Figure 7.
4.2. RQ2: ConstantBatching
Batching reduces the number of test executions when the changes request the same tests. Prior works (Najafi et al., 2019a; Beheshtian et al., 2021) used a constant batch size, and we replicate the state-of-the-art approach on a project at Ericsson. We report the results for batch sizes 2 and 4 in this paper.
When large batches pass, common tests requested by changes are only run one time, dramatically reducing the amount of testing. As noted by prior work (Beheshtian et al., 2021), the reduction is limited by the number of failing tests because a failure requires additional executions to find the culprit changes. However, on most large projects there are relatively few test failures, making batching highly effective (Fallahzadeh and Rigby, 2022).
Prior works have focused on resource savings and largely ignored or simplified feedback time (Najafi et al., 2019a; Beheshtian et al., 2021). If we strictly follow a constant batch size, then we see that commits can wait for extended periods of time. Figure 6 and 7 clearly reveal that constant batching algorithms, Batch2 and Batch4, outperform TestAll in the majority of cases, except in highly resource-available environments where the number of machines significantly exceeds the baseline. As the number of resources increase, they plateau with a relatively high feedback time and TestAll outperforms them. However, they are simpler to implement than other batching algorithms.
Table 1 shows that Batch2 effectively maintains the actual average feedback baseline of 8.33 hours for Ericsson using 6 machines, resulting in a 14.29% reduction in machine usage compared to the baseline. However, Batch4 achieves the same average feedback time using 8 machines, resulting in a negative reduction (-14.29%) in machine usage compared to the baseline. For Chrome, Batch2 can maintain the actual average feedback baseline of 36.48 minutes using 113 machines, resulting in a 47.93% reduction in machine usage compared to the baseline. Similarly, Batch4 achieves the same average feedback time using 61 machines, resulting in a 71.89% reduction in machine usage compared to the baseline.
Table 2 shows that Batch2 and Batch4 plateau for Ericsson at 4.52 and 7.86 hours by using 8 machines respectively. This means that Batch2 and Batch4 reach a plateau with 70% and 195% longer average feedback time compared to the baseline, respectively. Consequently, increasing the number of machines for both algorithms provides a limited scope for improvement compared to the baseline. For Chrome, Table 3 displays that Batch2 and Batch4 plateau at 5.88 and 12.6 minutes using 225 and 150 machines. This results in 31% and 255.93% longer plateaued feedback time compared to the baseline, respectively, indicating limited room for improvement relative to the baseline.
The confidence interval values displayed in Figure 7 for the Batch2 algorithm and Chrome reveal that the average feedback time has a range of around 5% when utilizing 100 machines. Notably, as the number of machines increases to 150, this range significantly decreases to less than 1%. Conversely, for the Batch4 algorithm, the confidence interval values indicate a range of about 5% when using 50 machines. While increasing the number of machines reduces the range, this reduction is constrained, and even with 375 machines, the range remains at 2%.
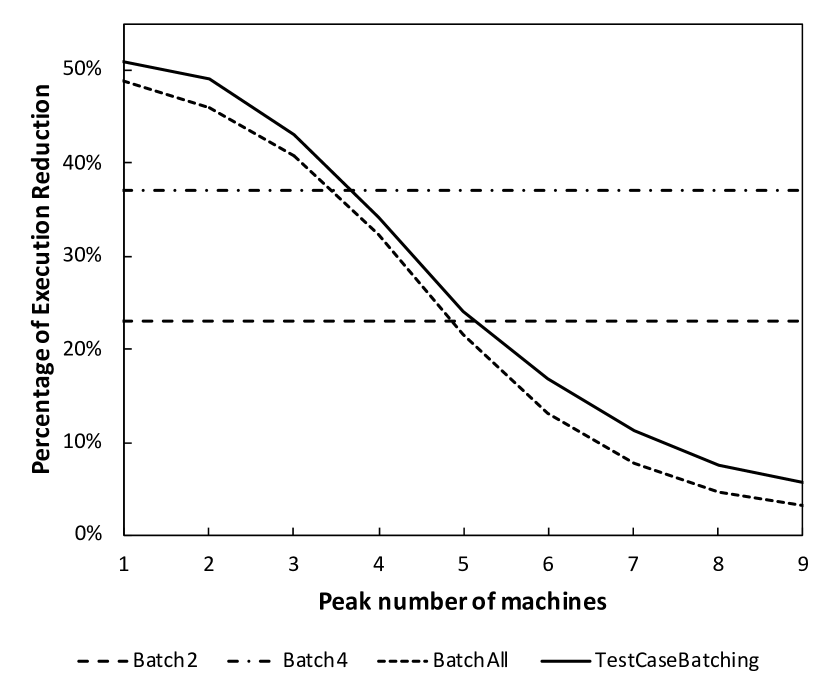
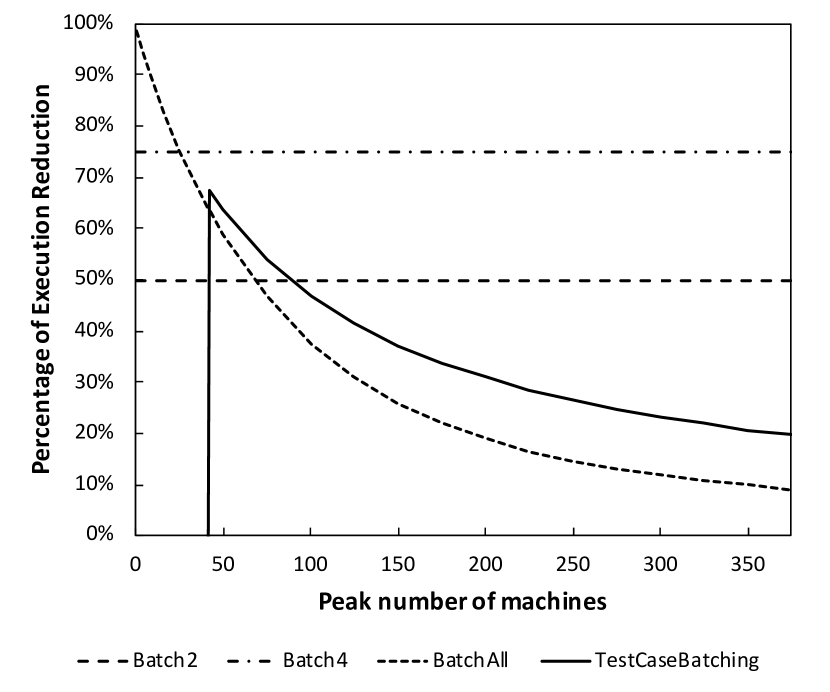
Figures 8 and 9 illustrate the percentage of ExecutionReduction achieved by various batching algorithms on Ericsson and Chrome, respectively. It is worth noting that the ExecutionReduction for the constant batching algorithms remains constant irrespective of the number of machines used. For Ericsson, Batch2 achieves an ExecutionReduction of 23%, while for Chrome, it achieves an ExecutionReduction of 50%. Similarly, Batch4 achieves a ExecutionReduction of 37% for Ericsson and 75% for Chrome.
| Algorithm | TestAll | Batch2 | Batch4 | BatchAll |
|
||
|---|---|---|---|---|---|---|---|
| Ericsson | 7 (0%) | 6 (14.29%) | 8 (-14.29%) | 5 (28.57%) | 5 (28.57%) | ||
| Chrome | 217 (0%) | 113 (47.93%) | 61 (71.89%) | 20 (90.78%) | 42 (80.65%) |
| Algorithm |
|
BatchAll | TestAll | Batch2 | Batch4 | ||
|---|---|---|---|---|---|---|---|
| Feedback time | 2.53 | 2.75 | 2.66 | 4.52 | 7.86 | ||
| Machines | 8 | 8 | 9 | 8 | 8 |
| Algorithm |
|
BatchAll | TestAll | Batch2 | Batch4 | ||
|---|---|---|---|---|---|---|---|
| Feedback time | 3.96 | 3.78 | 3.54 | 5.88 | 12.6 | ||
| Machines | 125 | 150 | 350 | 225 | 150 |
| Machines | TA vs B2 | TA vs B4 | TA vs BA | TA vs TCB | B2 vs B4 | B2 vs BA | B2 vs TCB | B4 vs BA | B4 vs TCB | BA vs TCB |
|---|---|---|---|---|---|---|---|---|---|---|
| 8 | 0.53 | 0.79 | 1.00 | -0.05 | 0.57 | 0.99 | -0.30 | 0.98 | -0.51 | -0.92 |
| 16 | 0.57 | 0.84 | 0.99 | -0.04 | 0.68 | 0.98 | -0.30 | 0.97 | -0.53 | -0.87 |
| 25 | 0.63 | 0.90 | 0.98 | 0.08 | 0.83 | 0.97 | -0.17 | 0.94 | -0.48 | -0.67 |
| 50 | 0.83 | 0.94 | 0.96 | 0.97 | 0.84 | 0.93 | 0.95 | 0.65 | 0.80 | 0.51 |
| 75 | 0.90 | 0.94 | 0.95 | 0.96 | 0.62 | 0.78 | 0.85 | 0.52 | 0.73 | 0.43 |
| 100 | 0.83 | 0.87 | 0.91 | 0.92 | 0.33 | 0.63 | 0.75 | 0.50 | 0.70 | 0.35 |
| 125 | 0.65 | 0.69 | 0.80 | 0.84 | 0.12 | 0.55 | 0.67 | 0.54 | 0.70 | 0.29 |
| 150 | 0.60 | 0.58 | 0.74 | 0.78 | -0.08 | 0.49 | 0.62 | 0.58 | 0.70 | 0.24 |
| 175 | 0.48 | 0.40 | 0.66 | 0.71 | -0.19 | 0.46 | 0.59 | 0.61 | 0.71 | 0.20 |
| 200 | 0.34 | 0.20 | 0.59 | 0.64 | -0.25 | 0.45 | 0.56 | 0.63 | 0.71 | 0.16 |
| 225 | 0.24 | 0.06 | 0.52 | 0.58 | -0.28 | 0.45 | 0.55 | 0.65 | 0.72 | 0.14 |
| 250 | 0.16 | -0.06 | 0.47 | 0.53 | -0.30 | 0.45 | 0.54 | 0.67 | 0.73 | 0.12 |
| 275 | 0.06 | -0.20 | 0.42 | 0.49 | -0.32 | 0.46 | 0.53 | 0.68 | 0.73 | 0.11 |
| 300 | -0.02 | -0.31 | 0.39 | 0.45 | -0.33 | 0.46 | 0.53 | 0.69 | 0.73 | 0.10 |
| 325 | -0.09 | -0.39 | 0.35 | 0.42 | -0.34 | 0.46 | 0.52 | 0.70 | 0.74 | 0.09 |
| 350 | -0.14 | -0.45 | 0.33 | 0.39 | -0.34 | 0.47 | 0.52 | 0.70 | 0.74 | 0.08 |
| 375 | -0.18 | -0.49 | 0.30 | 0.36 | -0.35 | 0.47 | 0.52 | 0.71 | 0.74 | 0.08 |
*Please refer to the following abbreviations used in this table: TA: TestAll, B2: Batch2, B4: Batch4, BA: BatchAll, TCB: TestCaseBatching.
4.3. RQ3: BatchAll
ConstantBatching excels in conserving resources and reducing feedback time in highly resource-constrained environments characterized by limited machine availability compared to the baseline and a significant backlog of commits. However, the queue size varies over time, with peak changes happening during working hours. To better utilize the available resources, we suggest BatchAll which batches all available changes in the queue.
Figure 6 and Figure 7 show that BatchAll approach always outperforms TestAll and ConstantBatching algorithms in both Ericsson and Chrome cases. This algorithm performs promisingly both in high resource-constrained and high resource-available conditions compared to the baseline number of machines.
Table 1 illustrates that BatchAll is capable of maintaining the feedback baseline at 8.33 hours for Ericsson by utilizing 5 machines, leading to a 28.57% reduction in machine usage. Similarly, for Chrome, BatchAll achieves the feedback baseline at 36.48 minutes with 20 machines, resulting in an impressive 90.78% reduction in machine utilization.
Table 2 shows that BatchAll approach plateaus for Ericsson at 2.75 hours by using 8 machines. This represents a 12.5% resource reduction relative to the plateaued feedback baseline. For Chrome, Table 3 displays that BatchAll plateaus for Chrome at 3.78 minutes using 150 machines. This is a 54.14% reduction in resources to reach the plateaued feedback baseline.
The confidence interval for the average feedback time values depicted in Figure 7 for the BatchAll algorithm and Chrome indicates a range of approximately 1% compared to the actual average feedback time when using 16 machines. As the number of machines increases to 25, this range narrows significantly, approaching zero, which suggests a more concentrated distribution of the feedback time values.
Figure 8 and 9 demonstrate that the BatchAll algorithm’s ExecutionReduction varies with the number of machines used, decreasing as the number of machines increases. For Ericsson, the ExecutionReduction ranges from 49% to 3% when utilizing 1 to 9 machines. Similarly, for Chrome, the ExecutionReduction ranges from 99% to 9% when employing 1 to 375 machines.
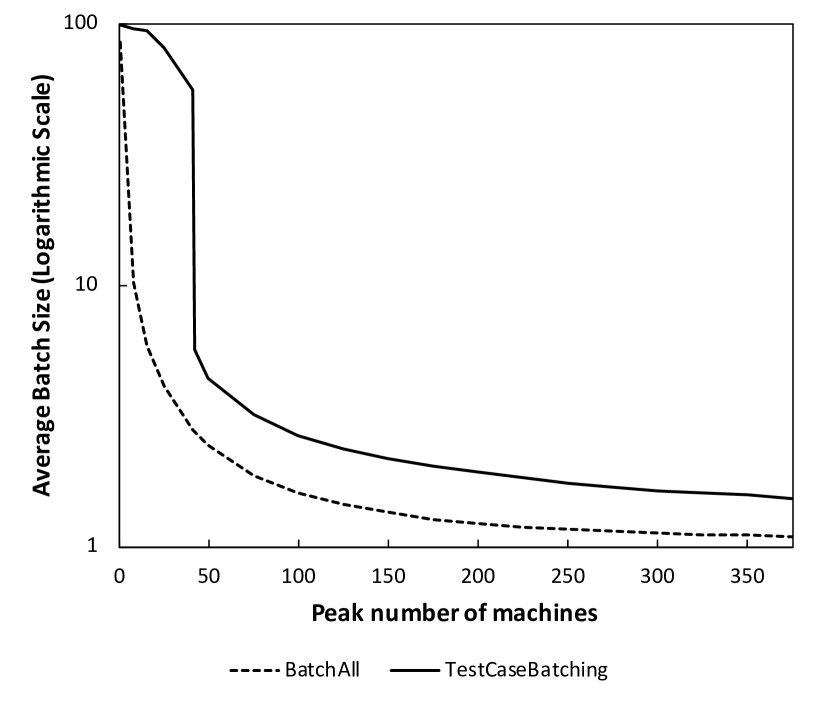
Figure 10 depicts the average batch sizes utilized by the BatchAll and TestCaseBatching algorithms in Chrome, with varying numbers of machines. The figure is displayed on a logarithmic scale to accommodate the substantial difference in batch sizes between a few machines and larger numbers of machines. The average batch sizes for the BatchAll algorithm range from approximately 85 batches to nearly 1 batch as the number of machines increases from 1 to 375. Notably, a significant reduction in average batch sizes is observed when the number of machines increases from 1 to 8, resulting in a drop from 85 to 10 batches for BatchAll.
4.4. RQ4: TestCaseBatching
BatchAll processes all available changes. However, any change that arrives has to wait until all the tests for a batch have been completed. In background Section 3.5, we introduced TestCaseBatching that queues the requested tests across all changes and includes any new change after each test completes (rather than waiting for all tests to complete).
Except when there is an extreme resource constraint, the TestCaseBatching approach performs more effectively than other algorithms in terms of feedback time as shown in for Ericsson in Figure 6 and Chrome in Figure 7. The reasons for the algorithm’s poor performance under high resource constraints, as depicted by the parallel line in Figure 7 at 42 machines, will be discussed in detail in the discussion section.
Table 1 presents that TestCaseBatching achieves the feedback baseline at 8.33 hours for Ericsson by utilizing 5 machines, resulting in a 28.57% reduction in machine usage. Similarly, for Chrome, TestCaseBatching achieves the feedback baseline at 36.48 minutes using 42 machines, leading to a remarkable 80.65% reduction in machine utilization.
Table 2 shows that the TestCaseBatching approach plateaus for Ericsson at 2.53 hours by using 8 machines. This presents a 12.5% resource reduction to reach the plateaued feedback baseline. For Chrome, Table 3 displays that the TestCaseBatching plateaus for Chrome at 3.96 minutes using 125 machines. This is a 61.28% reduction in resources to reach the plateaued feedback baseline.
The confidence interval ranges depicted in Figure 7 for the TestCaseBatching algorithm and Chrome tend to stabilize at approximately 1% of the actual average feedback time as the number of machines increases to 50. Beyond this threshold, the range of confidence intervals decreases significantly, approaching nearly zero. This narrowing range suggests a more concentrated distribution of feedback time values.
Figures 8 and 9 illustrate the varying percentages of ExecutionReduction achieved by the TestCaseBatching algorithm using different numbers of machines. In the context of Ericsson, TestCaseBatching achieves an ExecutionReduction ranging from 51% to 6% when employing 1 to 9 machines. On the other hand, in the case of Chrome, TestCaseBatching initially exhibits negative performance in ExecutionReduction with fewer than 42 machines, as further discussed in the subsequent section. However, with 42 to 375 machines, TestCaseBatching achieves an ExecutionReduction ranging from 67% to 20%, outperforming the results of BatchAll.
Figure 10 illustrates the batch size utilization of the TestCaseBatching algorithm on Chrome, covering a range of 1 to 375 machines. The average batch sizes vary from approximately 95 to 1.5. In the range of 1 to 41 machines, the average batch size remains relatively high, ranging from 98 to 56. However, at 42 machines, a significant drop occurs, resulting in an average batch size of around 6. Beyond this point, the number of average batch sizes continues to decrease gradually, reaching 1.5 at 375 machines.
5. Discussion
Regarding the impact of parallelization on testing with resource constraints, an increase in machine count non-linearly improves feedback time. Initially, limited resources lead to significant delays, as subsequent changes compound the delay. For instance, with just one machine, the queue grows substantially, causing wait times to surpass processing times. As the queue size decreases, improvements become smaller, with test execution time becoming the key factor. Eventually, feedback time plateaus, offering negligible gains from further machine increases due to the small queue size.
The results for the ConstantBatching algorithms of Batch2 and Batch4 reveal that running these algorithms in a highly resource-constrained environment can boost their feedback time in comparison with the TestAll approach. Moreover, the more resource-constrained the environment is, the more effective larger batch sizes would be. However, in a highly resource-available situation, using a larger constant batch size will deteriorate the feedback time. This is because of the fewer changes remaining in the queue as a result of the faster processing time of the changes. Consequently, ConstantBatching with large batch sizes becomes a disadvantage since it increases the wait time for processing the changes. This is also the reason why ConstantBatching algorithms reach a plateau at higher feedback time values, leaving little room for improvement with the utilization of additional machines.
BatchAll on the other hand uses the fast unloading advantage of a bigger batch size in a high resource-constrained environment and the low wait time benefit of a smaller batch size in a high resource-available environment. When we simulate a high resource-constrained environment with few machines, it makes large batches that can rapidly reduce the queue, leading to a higher ExecutionReduction. Conversely, being in a high resource-available condition with enormous machines, it may reduce the batch size to 1, eliminating build waiting time but resulting in a lower ExecutionReduction. This makes BatchAll highly effective in terms of feedback time in both of these scenarios.
TestCaseBatching algorithm has the highest performance in terms of feedback time, except in an extremely high resource-constrained environment with few machines, specifically in the Chrome case with fewer than 42 machines. This is because the BatchAll algorithm puts some changes in the queue while it is running the current batch, and then it runs all its tests as a batch. Still, the TestCaseBatching method always accepts new changes and does not adopt a queue. Since it runs the tests of a change in the absence of potential subsequent changes, when the next changes become available, it has to run some of these tests again as a penalty. When there are enormous overlapping builds, these penalties add up and deteriorate the feedback time and the ExecutionReduction of the TestCaseBatching algorithm in comparison with the BatchAll method. This specifically is the case in Chrome test results, as there are more overlapping builds in the dataset.
The implications of these results for practitioners would be as follows. We recommend using BatchAll and TestCaseBatching as the best batching algorithms among all the approaches under the study. In a very high resource-constrained environment, BatchAll produces a better feedback time and ExecutionReduction, otherwise, TestCaseBatching performs the best. Despite the testing approach being used, there is a threshold in which increasing the number of machines does not improve the feedback significantly. Hence, it makes sense to recognize this plateau point by exercising the batching approach being used on the corresponding project. This way they can reduce feedback time while saving the number of machines being used.
6. Threats to validity
External Validity. The outcomes from this study are from applying various batching techniques on the test results of two real large-scale Ericsson and Chrome projects, and we may not be able to generalize them to all other applications. The performance of these batching algorithms might differ by applying them to various other projects and using different numbers of machines. This is because they probably have different numbers of changes, builds, and test cases. However, the algorithms adopted in this study are not tied to a specific project, and the non-linear relationship between the number of machines and the feedback time in other projects would likely be the same.
Another issue that may threaten the external validity of this work is the failure rate. The failure rate can be different among various applications, and the higher the failure rate is, the higher the cost of culprit finding would become which in turn, can make the batching algorithms ineffective. However, Beheshtian et al. (Beheshtian et al., 2021) show that the batching algorithms can produce savings on the projects with a build failure ratio of below 40%, and among 9 Travis CI projects under their study, 85.5% of them could take advantage of batching techniques. The build failure rate in Chrome dataset is 8.5%, which is well below the 40% threshold, making batching an effective approach for this project. Meanwhile, the focus of this study is more on the impact of parallelism on various batching algorithms and on two very large-scale Ericsson and Chrome projects. At the time of this study, we could not recognize any other available testing datasets for the experiment which are comparable in testing scale with these datasets.
Internal Validity. One of the aspects of test optimization which can compromise the process is test dependencies. Reordering or running tests in parallel when they were not designed to be run in this manner can introduce dependency flaky failures (Lam et al., 2019). Therefore, we only batch tests that Ericsson guarantees are independent. In the case of Chrome, we only run tests in parallel and independently if Chrome developers were already running these in parallel on multiple shards.
The historical simulation simplified parts of the Ericsson’s and Chrome’s testing processes. For example, developers can stop testing a build or manually batch-select changes for testing. Since we cannot model these manual interventions, we exclude them from our simulation.
In our experiment, we assumed that all changes can be batched and none lead to merge conflict. Since each must be ultimately merged into the main branch, we do not introduce any new conflicts because any conflict would have been dealt with when the developer ensures that the code can be merged. However, the batching process may bring this conflict to the developer’s attention earlier as we batch different combinations of changes.
Construct Validity. To simplify the measurement of the feedback time we ignored the compile times of the changes. This is because we could not have any assumptions for the compile time of the batches. In the case that the batch contains no failing change, this can save on compile time. Otherwise, it might cause some extra compile time for the failing changes. Considering the failure rates in our study, we can suggest that calculating the compile time can even save more on the feedback time of the batching techniques. We leave this simulation parameter to future work.
Using the average value to compare the feedback time of the different batching algorithms can be a threat to the construct validity of this study. Although the feedback time distribution of each test batching experiment is a more accurate way of showing the results, for each batching algorithm and for each number of machines, we need a single value to compare the performance. This along with having an approximately normal distribution, lead us to determine the average feedback time to compare the outcomes.
7. Related Work
Continuous integration and delivery (CI/CD) is a crucial part of modern software development (Jin and Servant, 2021). It enables developers to automatically build and test changes, ensuring software functionality remains intact (Poth et al., 2018; Hilton, 2016; Soni, 2015; Leppänen et al., 2015). However, testing every commit individually in large software systems is often impractical (Herzig et al., 2015; Elbaum et al., 2014). In the following, we investigate approaches to accelerate CI.
Test Selection and Prioritization. To reduce both resource consumption and provide earlier feedback, test selection has been widely adopted in the industry and extensively studied (Rothermel and Harrold, 1996; Engström et al., 2010; Chen et al., 2011; Machalica et al., 2019; Parthasarathy et al., 2022; Arrieta, 2022; Elsner et al., 2022; Verma et al., 2023; Birchler et al., 2023). However, test selection’s inherent trade-off is that not all tests are run, and some test failures may be missed. In contrast, test prioritization guarantees that all tests will be run, but those that are more likely to reveal faults will be run first, reducing feedback time on test failures, but not reducing the resource consumption in testing (Bagherzadeh et al., 2022; Zhu et al., 2018; Rothermel et al., 2001; Jahan et al., 2020; Sharif et al., 2021; Huang et al., 2022; Mahdieh et al., 2022; Nayak et al., 2022; Bajaj et al., 2022; Yaraghi et al., 2023).
However, batching offers both feedback and execution reduction without missing any failures. To provide an industrial comparison, we contrast our results with those obtained at Microsoft. Herzig et al. (Herzig et al., 2015) reported improvements of 40.31%, 40.10%, and 47.45% in testing feedback time for Windows, Office, and Dynamics using association rule mining for selection. However, they noted slip-through rates of 71% and 91% at the first branch level, 21% and 3% at the second, and 8% and 0% at the third branch level. At Ericsson, the same approach resulted in a 42.78% reduction but with 34.65% slip-throughs (Najafi et al., 2019b). In contrast, BatchAll and TestCaseBatching reduced testing time by 57.44% and 61.87%, respectively, at Ericsson without allowing any slip-throughs.
Test parallelization. Tests are distributed across machines using this technique to reduce feedback time. Previous works widely studied the impact of test parallelization on software testing and introduced algorithms to run tests in parallel (Jones et al., 2002; Misailovic et al., 2007; Bagies, 2020; Landing et al., 2020). For example, Arabnejad et al. (Arabnejad et al., 2018) investigated using GPUs for running tests in parallel. The most popular algorithms for parallelizing tests are scheduling tests across the machines based on their IDs and their historical execution time (shashban, 2022).
Candido et al. (Candido et al., 2017) analyzed over 450 Java projects, discovering that less than 20% of major projects utilize test parallelization due to concurrency concerns. They recommended strategies like test refactoring and grouping based on dependencies to aid parallel testing. Bell et al. (Bell et al., 2015) investigated test dependency’s impact on parallelization, introducing the ElectricTest approach. Ding et al. (Ding et al., 2007) proposed behavior-oriented test parallelization. Nagy et al. (Nagy et al., 2022) designed a parallel architecture for test case dispatching to reduce idle nodes and enhance execution time. In the context of Ericsson and Chrome, we exclusively batch tests at levels designed for parallel execution. Notably, none of these prior studies explored test parallelization within batch testing.
Build Prediction and Skip. Another line of work aimed at expediting Continuous Integration (CI) processes includes build prediction and build skip techniques. Build prediction techniques leverage machine learning methods to predict the result of a build, with a particular focus on reducing the cost of builds that are likely to pass (Finlay et al., 2014; Hassan and Zhang, 2006; Hassan and Wang, 2017; Kwan et al., 2011; Ni and Li, 2017; Schröter, 2010; Wolf et al., 2009; Xie and Li, 2018; Chen et al., 2020; Saidani et al., 2020). On the other hand, build skip techniques aim to identify builds that do not require execution, typically due to the absence of source code changes. There are different approaches for build skip, including manual configuration (n.d., nda, ndb) and rule-based or learning-based methods (Abdalkareem et al., 2021a, b; Jin and Servant, 2020, 2022, 2023; Gallaba et al., 2022; Saidani et al., 2022).
While build prediction and build skip techniques offer potential benefits for accelerating CI processes, they have limitations. Build prediction techniques struggle with accurately predicting failing builds, leading to costly misidentifications, and their practical use cases are often ill-defined (Chen et al., 2020). On the other hand, build skip techniques risk skipping builds that may contain relevant changes or introduce failures. In contrast, batching combines multiple changes into a single build, eliminating the risk of skipping builds entirely. It enables efficient debugging and failure resolution within the batch, providing a reliable approach for managing complex software changes in continuous integration, as employed by major companies like Google.
Batch Testing. This technique, employed in resource-constrained environments (Cho et al., 2017; Chang et al., 2009), reduces feedback time. Instead of testing each change individually, changes are batched and tested simultaneously. GitBisection (n.d., 2015), a well-known culprit-finding technique, conducts a binary search to identify the culprit, typically requiring executions. However, when multiple culprits exist, GitBisection finds only the first. To address this, Najafi et al. (Najafi et al., 2019a) introduced a bisection with a divide-and-conquer algorithm, capable of identifying all culprits. The total executions range from to when all batch changes are culprits. Beheshtian et al. (Beheshtian et al., 2021) showed that for batches of 4 or fewer, bisection increases executions. They propose BatchStop4, testing each change individually in batches of 4 or fewer. BatchStop4 consistently outperforms batch bisection mathematically. Their study also examines failure rate effects on various batching algorithms.
Bavand et al. (Bavand and Rigby, 2021) implemented a complex dynamic batch size approach based on historical failure rates, resulting in a modest 5.17% reduction in test execution time compared to Batch4 with a single machine. In the Ericsson context, BatchAll and TestCaseBatching achieved more significant ExecutionReduction, with 11.87% and 13.92% reductions respectively compared to Batch4. For Chrome, BatchAll showed a substantial 23.88% improvement over Batch4 with a single machine, while TestCaseBatching had negative results with less than 42 machines. Overall, BatchAll and TestCaseBatching consistently outperformed ConstantBatching in feedback time across different machine configurations.These previous works focused on batch testing at the change level and with a single machine, without exploring the effects of parallel testing. In our study, we investigate the combined impact of batching and parallel testing for the first time, examining how varying the number of parallel machines affects two extensive projects: Ericsson and Chrome.
8. Conclusions and Future Work
In this study, we aimed to investigate the impact of parallelization on different batching techniques, addressing the limitations of prior single-machines studies. Our evaluation yielded the following findings. TestAll experience compounded delays in subsequent builds, and the effect of changing the number of machines on feedback time is non-linear. The performance of ConstantBatching is better in high resource-constrained setups, and it plateaus at a longer feedback time. It provides a consistent ExecutionReduction across different machine counts. BatchAll is effective in both high resource-constrained and highly available resource environments, being able to maintain actual average feedback time and attain plateaued feedback baseline with 90.78% and 54.14% fewer machines than the baseline respectively. TestCaseBatching performs poorly in extreme resource constraint conditions but effectively in high resource available environments, utilizing 80.65% of baseline machines to maintain the actual average feedback time and 64.28% to reach the plateaued feedback baseline. Both BatchAll and TestCaseBatching exhibit variable ExecutionReduction. Notably, this study utilized simulated parallel test execution based on historical test results. Future research should confirm and extend these findings through experiments conducted in practical settings.
9. Data availability
The data for Ericsson is not available as this is a proprietary project and cannot be released due to confidentiality. The data for Chrome is publicly available from Fallahzadeh et al. (Fallahzadeh and Rigby, 2022). We provide our scripts used to simulate the batching algorithms for Chrome at https://github.com/emadfallahzadeh/BatchTesting.
Acknowledgements.
We acknowledge the support of the Natural Sciences and Engineering Research Council of Canada (NSERC) Discovery Grant and Concordia University FRS Funding.References
- (1)
- Abdalkareem et al. (2021a) Rabe Abdalkareem, Suhaib Mujahid, and Emad Shihab. 2021a. A Machine Learning Approach to Improve the Detection of CI Skip Commits. IEEE Transactions on Software Engineering 47, 12 (Dec. 2021), 2740–2754. https://doi.org/10.1109/TSE.2020.2967380 Conference Name: IEEE Transactions on Software Engineering.
- Abdalkareem et al. (2021b) Rabe Abdalkareem, Suhaib Mujahid, Emad Shihab, and Juergen Rilling. 2021b. Which Commits Can Be CI Skipped? IEEE Transactions on Software Engineering 47, 3 (March 2021), 448–463. https://doi.org/10.1109/TSE.2019.2897300 Conference Name: IEEE Transactions on Software Engineering.
- Arabnejad et al. (2018) Hamid Arabnejad, João Bispo, Jorge G. Barbosa, and João M.P. Cardoso. 2018. AutoPar-Clava: An Automatic Parallelization source-to-source tool for C code applications. In Proceedings of the 9th Workshop and 7th Workshop on Parallel Programming and RunTime Management Techniques for Manycore Architectures and Design Tools and Architectures for Multicore Embedded Computing Platforms (PARMA-DITAM ’18). Association for Computing Machinery, New York, NY, USA, 13–19. https://doi.org/10.1145/3183767.3183770
- Arrieta (2022) Aitor Arrieta. 2022. Multi-objective metamorphic follow-up test case selection for deep learning systems. In Proceedings of the Genetic and Evolutionary Computation Conference (GECCO ’22). Association for Computing Machinery, New York, NY, USA, 1327–1335. https://doi.org/10.1145/3512290.3528697
- Bagherzadeh et al. (2022) Mojtaba Bagherzadeh, Nafiseh Kahani, and Lionel Briand. 2022. Reinforcement Learning for Test Case Prioritization. IEEE Transactions on Software Engineering 48, 8 (Aug. 2022), 2836–2856. https://doi.org/10.1109/TSE.2021.3070549 Conference Name: IEEE Transactions on Software Engineering.
- Bagies (2020) Taghreed Omar S Bagies. 2020. Parallelizing unit test execution on GPU. Ph. D. Dissertation. Iowa State University.
- Bajaj et al. (2022) Anu Bajaj, Om Prakash Sangwan, and Ajith Abraham. 2022. Improved novel bat algorithm for test case prioritization and minimization. Soft Comput 26, 22 (Nov. 2022), 12393–12419. https://doi.org/10.1007/s00500-022-07121-9
- Bavand and Rigby (2021) Amir Hossein Bavand and Peter C. Rigby. 2021. Mining Historical Test Failures to Dynamically Batch Tests to Save CI Resources. In 2021 IEEE International Conference on Software Maintenance and Evolution (ICSME). IEEE, Luxembourg, 217–226. https://doi.org/10.1109/ICSME52107.2021.00026 ISSN: 2576-3148.
- Beheshtian et al. (2021) Mohammad Javad Beheshtian, Amir Bavand, and Peter Rigby. 2021. Software Batch Testing to Save Build Test Resources and to Reduce Feedback Time. IEEE Transactions on Software Engineering 48, 8 (2021), 1–1. https://doi.org/10.1109/TSE.2021.3070269 Conference Name: IEEE Transactions on Software Engineering.
- Bell et al. (2015) Jonathan Bell, Gail Kaiser, Eric Melski, and Mohan Dattatreya. 2015. Efficient Dependency Detection for Safe Java Test Acceleration. In Proceedings of the 2015 10th Joint Meeting on Foundations of Software Engineering (Bergamo, Italy) (ESEC/FSE 2015). Association for Computing Machinery, New York, NY, USA, 770–781. https://doi.org/10.1145/2786805.2786823
- Birchler et al. (2023) Christian Birchler, Nicolas Ganz, Sajad Khatiri, Alessio Gambi, and Sebastiano Panichella. 2023. Cost-effective simulation-based test selection in self-driving cars softwareImage 1. Science of Computer Programming 226 (March 2023), 102926. https://doi.org/10.1016/j.scico.2023.102926
- Candido et al. (2017) Jeanderson Candido, Luis Melo, and Marcelo d’Amorim. 2017. Test suite parallelization in open-source projects: a study on its usage and impact. In Proceedings of the 32nd IEEE/ACM International Conference on Automated Software Engineering (ASE ’17). IEEE Press, Urbana-Champaign, IL, USA, 838–848.
- Chang et al. (2009) Fangzhe Chang, Jennifer Ren, and Ramesh Viswanathan. 2009. Optimal Resource Allocation for Batch Testing. In 2009 International Conference on Software Testing Verification and Validation. IEEE, Denver, CO, USA, 91–100. https://doi.org/10.1109/ICST.2009.25 ISSN: 2159-4848.
- Chen et al. (2020) Bihuan Chen, Linlin Chen, Chen Zhang, and Xin Peng. 2020. BUILDFAST: History-Aware Build Outcome Prediction for Fast Feedback and Reduced Cost in Continuous Integration. In 2020 35th IEEE/ACM International Conference on Automated Software Engineering (ASE). IEEE, Melbourne, VIC, Australia, 42–53. ISSN: 2643-1572.
- Chen et al. (2011) Songyu Chen, Zhenyu Chen, Zhihong Zhao, Baowen Xu, and Yang Feng. 2011. Using semi-supervised clustering to improve regression test selection techniques. In Verification and Validation 2011 Fourth IEEE International Conference on Software Testing. IEEE, Berlin, Germany, 1–10. https://doi.org/10.1109/ICST.2011.38 ISSN: 2159-4848.
- Cho et al. (2017) Chihyun Cho, Byonggon Chun, and Jihwan Seo. 2017. Adaptive Batching Scheme for Real-Time Data Transfers in IoT Environment. In Proceedings of the 2017 International Conference on Cloud and Big Data Computing (ICCBDC 2017). Association for Computing Machinery, New York, NY, USA, 55–59. https://doi.org/10.1145/3141128.3141145
- Ding et al. (2007) Chen Ding, Xipeng Shen, Kirk Kelsey, Chris Tice, Ruke Huang, and Chengliang Zhang. 2007. Software behavior oriented parallelization. ACM SIGPlan Notices 42, 6 (2007), 223–234.
- Dorfman (1943) Robert Dorfman. 1943. The Detection of Defective Members of Large Populations. Ann. Math. Statist. 14, 4 (12 1943), 436–440. https://doi.org/10.1214/aoms/1177731363
- Elbaum et al. (2014) Sebastian Elbaum, Gregg Rothermel, and John Penix. 2014. Techniques for Improving Regression Testing in Continuous Integration Development Environments. In Proceedings of the 22Nd ACM SIGSOFT International Symposium on Foundations of Software Engineering (FSE 2014). ACM, New York, NY, USA, 235–245. https://doi.org/10.1145/2635868.2635910 event-place: Hong Kong, China.
- Elsner et al. (2022) Daniel Elsner, Roland Wuersching, Markus Schnappinger, Alexander Pretschner, Maria Graber, René Dammer, and Silke Reimer. 2022. Build system aware multi-language regression test selection in continuous integration. In Proceedings of the 44th International Conference on Software Engineering: Software Engineering in Practice (ICSE-SEIP ’22). Association for Computing Machinery, New York, NY, USA, 87–96. https://doi.org/10.1145/3510457.3513078
- Engström et al. (2010) Emelie Engström, Per Runeson, and Mats Skoglund. 2010. A systematic review on regression test selection techniques. Information and Software Technology 52, 1 (2010), 14–30. https://doi.org/10.1016/j.infsof.2009.07.001
- Fallahzadeh and Rigby (2022) Emad Fallahzadeh and Peter C. Rigby. 2022. The impact of flaky tests on historical test prioritization on chrome. In Proceedings of the 44th International Conference on Software Engineering: Software Engineering in Practice (ICSE-SEIP ’22). Association for Computing Machinery, New York, NY, USA, 273–282. https://doi.org/10.1145/3510457.3513038
- Finlay et al. (2014) Jacqui Finlay, Russel Pears, and Andy M. Connor. 2014. Data stream mining for predicting software build outcomes using source code metrics. Information and Software Technology 56, 2 (Feb. 2014), 183–198. https://doi.org/10.1016/j.infsof.2013.09.001
- Gallaba et al. (2022) Keheliya Gallaba, John Ewart, Yves Junqueira, and Shane McIntosh. 2022. Accelerating Continuous Integration by Caching Environments and Inferring Dependencies. IEEE Transactions on Software Engineering 48, 6 (June 2022), 2040–2052. https://doi.org/10.1109/TSE.2020.3048335 Conference Name: IEEE Transactions on Software Engineering.
- Hassan and Zhang (2006) Ahmed E. Hassan and Ken Zhang. 2006. Using Decision Trees to Predict the Certification Result of a Build. In 21st IEEE/ACM International Conference on Automated Software Engineering (ASE’06). IEEE, Tokyo, Japan, 189–198. https://doi.org/10.1109/ASE.2006.72 ISSN: 1938-4300.
- Hassan and Wang (2017) Foyzul Hassan and Xiaoyin Wang. 2017. Change-Aware Build Prediction Model for Stall Avoidance in Continuous Integration. In 2017 ACM/IEEE International Symposium on Empirical Software Engineering and Measurement (ESEM). IEEE, Toronto, ON, Canada, 157–162. https://doi.org/10.1109/ESEM.2017.23
- Herzig et al. (2015) Kim Herzig, Michaela Greiler, Jacek Czerwonka, and Brendan Murphy. 2015. The Art of Testing Less without Sacrificing Quality. In 2015 IEEE/ACM 37th IEEE International Conference on Software Engineering, Vol. 1. IEEE Press, Florence, Italy, 483–493. https://doi.org/10.1109/ICSE.2015.66 ISSN: 1558-1225.
- Hilton (2016) Michael Hilton. 2016. Understanding and improving continuous integration. In Proceedings of the 2016 24th ACM SIGSOFT International Symposium on Foundations of Software Engineering (FSE 2016). Association for Computing Machinery, New York, NY, USA, 1066–1067. https://doi.org/10.1145/2950290.2983952
- Huang et al. (2022) Rubing Huang, Dave Towey, Yinyin Xu, Yunan Zhou, and Ning Yang. 2022. Dissimilarity-based test case prioritization through data fusion. Software: Practice and Experience 52, 6 (2022), 1352–1377. https://doi.org/10.1002/spe.3068 _eprint: https://onlinelibrary.wiley.com/doi/pdf/10.1002/spe.3068.
- Jahan et al. (2020) Hosney Jahan, Ziliang Feng, and S. M. Hasan Mahmud. 2020. Risk-Based Test Case Prioritization by Correlating System Methods and Their Associated Risks. Arab J Sci Eng 45, 8 (Aug. 2020), 6125–6138. https://doi.org/10.1007/s13369-020-04472-z
- Jin and Servant (2020) Xianhao Jin and Francisco Servant. 2020. A cost-efficient approach to building in continuous integration. In Proceedings of the ACM/IEEE 42nd International Conference on Software Engineering (ICSE ’20). Association for Computing Machinery, New York, NY, USA, 13–25. https://doi.org/10.1145/3377811.3380437
- Jin and Servant (2021) Xianhao Jin and Francisco Servant. 2021. What helped, and what did not? An Evaluation of the Strategies to Improve Continuous Integration. arXiv:2102.06666 [cs.SE]
- Jin and Servant (2022) Xianhao Jin and Francisco Servant. 2022. Which builds are really safe to skip? Maximizing failure observation for build selection in continuous integration. Journal of Systems and Software 188 (June 2022), 111292. https://doi.org/10.1016/j.jss.2022.111292
- Jin and Servant (2023) Xianhao Jin and Francisco Servant. 2023. HybridCISave: A Combined Build and Test Selection Approach in Continuous Integration. ACM Trans. Softw. Eng. Methodol. 32, 4 (May 2023), 93:1–93:39. https://doi.org/10.1145/3576038
- Jones et al. (2002) James A. Jones, Mary Jean Harrold, and John Stasko. 2002. Visualization of Test Information to Assist Fault Localization. In Proceedings of the 24th International Conference on Software Engineering (Orlando, Florida) (ICSE ’02). Association for Computing Machinery, New York, NY, USA, 467–477. https://doi.org/10.1145/581339.581397
- Kwan et al. (2011) Irwin Kwan, Adrian Schroter, and Daniela Damian. 2011. Does Socio-Technical Congruence Have an Effect on Software Build Success? A Study of Coordination in a Software Project. IEEE Transactions on Software Engineering 37, 3 (May 2011), 307–324. https://doi.org/10.1109/TSE.2011.29 Conference Name: IEEE Transactions on Software Engineering.
- Lam et al. (2019) W. Lam, R. Oei, A. Shi, D. Marinov, and T. Xie. 2019. iDFlakies: A Framework for Detecting and Partially Classifying Flaky Tests. In 2019 12th IEEE Conference on Software Testing, Validation and Verification (ICST). IEEE Computer Society, Los Alamitos, CA, USA, 312–322. https://doi.org/10.1109/ICST.2019.00038
- Landing et al. (2020) Cristina Landing, Sahar Tahvili, Hugo Haggren, Martin Langkvis, Auwn Muhammad, and Amy Loufi. 2020. Cluster-Based Parallel Testing Using Semantic Analysis. In 2020 IEEE International Conference On Artificial Intelligence Testing (AITest). IEEE, Oxford, UK, 99–106. https://doi.org/10.1109/AITEST49225.2020.00022
- Leppänen et al. (2015) Marko Leppänen, Simo Mäkinen, Max Pagels, Veli-Pekka Eloranta, Juha Itkonen, Mika V Mäntylä, and Tomi Männistö. 2015. The highways and country roads to continuous deployment. Ieee software 32, 2 (2015), 64–72.
- Machalica et al. (2019) Mateusz Machalica, Alex Samylkin, Meredith Porth, and Satish Chandra. 2019. Predictive Test Selection. In 2019 IEEE/ACM 41st International Conference on Software Engineering: Software Engineering in Practice (ICSE-SEIP). IEEE, Montreal, QC, Canada, 91–100. https://doi.org/10.1109/ICSE-SEIP.2019.00018
- Mahdieh et al. (2022) Mostafa Mahdieh, Seyed-Hassan Mirian-Hosseinabadi, and Mohsen Mahdieh. 2022. Test case prioritization using test case diversification and fault-proneness estimations. Autom Softw Eng 29, 2 (Aug. 2022), 50. https://doi.org/10.1007/s10515-022-00344-y
- Misailovic et al. (2007) Sasa Misailovic, Aleksandar Milicevic, Nemanja Petrovic, Sarfraz Khurshid, and Darko Marinov. 2007. Parallel Test Generation and Execution with Korat. In Proceedings of the the 6th Joint Meeting of the European Software Engineering Conference and the ACM SIGSOFT Symposium on The Foundations of Software Engineering (Dubrovnik, Croatia) (ESEC-FSE ’07). Association for Computing Machinery, New York, NY, USA, 135–144. https://doi.org/10.1145/1287624.1287645
- Nagy et al. (2022) Sarah M. Nagy, Huda A. Maghawry, and Nagwa L. Badr. 2022. An Enhanced Parallel Automation Testing Architecture for Test Case Execution. In 2022 5th International Conference on Computing and Informatics (ICCI). IEEE, New Cairo, Cairo, Egypt, 369–373. https://doi.org/10.1109/ICCI54321.2022.9756109
- Najafi et al. (2019a) Armin Najafi, Peter C. Rigby, and Weiyi Shang. 2019a. Bisecting commits and modeling commit risk during testing. In Proceedings of the 2019 27th ACM Joint Meeting on European Software Engineering Conference and Symposium on the Foundations of Software Engineering (ESEC/FSE 2019). Association for Computing Machinery, Tallinn, Estonia, 279–289. https://doi.org/10.1145/3338906.3338944
- Najafi et al. (2019b) Armin Najafi, Weiyi Shang, and Peter C. Rigby. 2019b. Improving Test Effectiveness Using Test Executions History: An Industrial Experience Report. In 2019 IEEE/ACM 41st International Conference on Software Engineering: Software Engineering in Practice (ICSE-SEIP). IEEE, Montreal, QC, Canada, 213–222. https://doi.org/10.1109/ICSE-SEIP.2019.00031
- Nayak et al. (2022) Soumen Nayak, Chiranjeev Kumar, and Sachin Tripathi. 2022. Analytic hierarchy process-based regression test case prioritization technique enhancing the fault detection rate. Soft Comput 26, 15 (Aug. 2022), 6953–6968. https://doi.org/10.1007/s00500-022-07174-w
- n.d. (2015) n.d. 2015. git-bisect Manual Page. https://git-scm.com/docs/git-bisect
- n.d. (nda) n.d. n.d.a. Travis CI Documentation. https://docs.travis-ci.com/user/customizing-the-build/
- n.d. (ndb) n.d. n.d.b. Using the Skip Next Build plugin. https://docs.huihoo.com/jenkins/enterprise/14/user-guide-14.5/skip-sect-using.html
- Ni and Li (2017) Ansong Ni and Ming Li. 2017. Cost-Effective Build Outcome Prediction Using Cascaded Classifiers. In 2017 IEEE/ACM 14th International Conference on Mining Software Repositories (MSR). IEEE, Buenos Aires, Argentina, 455–458. https://doi.org/10.1109/MSR.2017.26
- Parthasarathy et al. (2022) Ganapathy Parthasarathy, Aabid Rushdi, Parivesh Choudhary, Saurav Nanda, Malan Evans, Hansika Gunasekara, and Sridhar Rajakumar. 2022. RTL Regression Test Selection using Machine Learning. In 2022 27th Asia and South Pacific Design Automation Conference (ASP-DAC). IEEE, Taipei, Taiwan, 281–287. https://doi.org/10.1109/ASP-DAC52403.2022.9712550 ISSN: 2153-697X.
- Poth et al. (2018) Alexander Poth, Mark Werner, and Xinyan Lei. 2018. How to Deliver Faster with CI/CD Integrated Testing Services?. In Systems, Software and Services Process Improvement (Communications in Computer and Information Science), Xabier Larrucea, Izaskun Santamaria, Rory V. O’Connor, and Richard Messnarz (Eds.). Springer International Publishing, Cham, 401–409. https://doi.org/10.1007/978-3-319-97925-0_33
- Rothermel and Harrold (1996) G. Rothermel and M.J. Harrold. 1996. Analyzing regression test selection techniques. IEEE Transactions on Software Engineering 22, 8 (1996), 529–551. https://doi.org/10.1109/32.536955
- Rothermel et al. (2001) G. Rothermel, R. H. Untch, Chengyun Chu, and M. J. Harrold. 2001. Prioritizing test cases for regression testing. IEEE Transactions on Software Engineering 27, 10 (Oct 2001), 929–948. https://doi.org/10.1109/32.962562
- Saidani et al. (2020) Islem Saidani, Ali Ouni, Moataz Chouchen, and Mohamed Wiem Mkaouer. 2020. On the prediction of continuous integration build failures using search-based software engineering. In Proceedings of the 2020 Genetic and Evolutionary Computation Conference Companion (GECCO ’20). Association for Computing Machinery, New York, NY, USA, 313–314. https://doi.org/10.1145/3377929.3390050
- Saidani et al. (2022) Islem Saidani, Ali Ouni, and Mohamed Wiem Mkaouer. 2022. Detecting Continuous Integration Skip Commits Using Multi-Objective Evolutionary Search. IEEE Transactions on Software Engineering 48, 12 (Dec. 2022), 4873–4891. https://doi.org/10.1109/TSE.2021.3129165 Conference Name: IEEE Transactions on Software Engineering.
- Schröter (2010) Adrian Schröter. 2010. Predicting build outcome with developer interaction in Jazz. In Proceedings of the 32nd ACM/IEEE International Conference on Software Engineering - Volume 2 (ICSE ’10). Association for Computing Machinery, New York, NY, USA, 511–512. https://doi.org/10.1145/1810295.1810456
- Sharif et al. (2021) Aizaz Sharif, Dusica Marijan, and Marius Liaaen. 2021. DeepOrder: Deep Learning for Test Case Prioritization in Continuous Integration Testing. In 2021 IEEE International Conference on Software Maintenance and Evolution (ICSME). IEEE, Luxembourg, 525–534. https://doi.org/10.1109/ICSME52107.2021.00053 ISSN: 2576-3148.
- shashban (2022) shashban. 2022. Run VSTest tests in parallel - Azure Pipelines. https://learn.microsoft.com/en-us/azure/devops/pipelines/test/parallel-testing-vstest?view=azure-devops
- Soni (2015) Mitesh Soni. 2015. End to End Automation on Cloud with Build Pipeline: The Case for DevOps in Insurance Industry, Continuous Integration, Continuous Testing, and Continuous Delivery. In 2015 IEEE International Conference on Cloud Computing in Emerging Markets (CCEM). IEEE, Bangalore, India, 85–89. https://doi.org/10.1109/CCEM.2015.29
- Verma et al. (2023) Abhishek Singh Verma, Ankur Choudhary, and Shailesh Tiwari. 2023. A novel chaotic archimedes optimization algorithm and its application for efficient selection of regression test cases. Int. j. inf. tecnol. 15, 2 (Feb. 2023), 1055–1068. https://doi.org/10.1007/s41870-022-01031-7
- Wolf et al. (2009) Timo Wolf, Adrian Schroter, Daniela Damian, and Thanh Nguyen. 2009. Predicting build failures using social network analysis on developer communication. In 2009 IEEE 31st International Conference on Software Engineering. IEEE, Vancouver, BC, Canada, 1–11. https://doi.org/10.1109/ICSE.2009.5070503 ISSN: 1558-1225.
- Xie and Li (2018) Zheng Xie and Ming Li. 2018. Cutting the software building efforts in continuous integration by semi-supervised online AUC optimization. In Proceedings of the 27th International Joint Conference on Artificial Intelligence (IJCAI’18). AAAI Press, Stockholm, Sweden, 2875–2881.
- Yaraghi et al. (2023) Ahmadreza Saboor Yaraghi, Mojtaba Bagherzadeh, Nafiseh Kahani, and Lionel C. Briand. 2023. Scalable and Accurate Test Case Prioritization in Continuous Integration Contexts. IEEE Transactions on Software Engineering 49, 4 (April 2023), 1615–1639. https://doi.org/10.1109/TSE.2022.3184842 Conference Name: IEEE Transactions on Software Engineering.
- Zhu et al. (2018) Yuecai Zhu, Emad Shihab, and Peter C. Rigby. 2018. Test Re-Prioritization in Continuous Testing Environments. In 2018 IEEE International Conference on Software Maintenance and Evolution (ICSME). IEEE, Madrid, Spain, 69–79. https://doi.org/10.1109/ICSME.2018.00016 ISSN: 1063-6773.
- Ziftci and Reardon (2017) Celal Ziftci and Jim Reardon. 2017. Who broke the build? Automatically identifying changes that induce test failures in continuous integration at Google Scale. In 2017 IEEE/ACM 39th International Conference on Software Engineering: Software Engineering in Practice Track (ICSE-SEIP). IEEE, Buenos Aires, Argentina, 113–122. https://doi.org/10.1109/ICSE-SEIP.2017.13