Devouring The Centaurus A Satellites: Modeling Dwarf Galaxies with Galacticus
Abstract
For the first time, systematic studies of dwarf galaxies are being conducted throughout the Local Volume, including Centaurus A (NGC 5128), which is the nearest elliptical galaxy. Given Centaurus A’s mass (roughly ten times that of the Milky Way), AGN activity, and recent major mergers, investigating these dwarfs and their star formation physics is imperative. However, simulating the faintest dwarfs in a massive galaxy like Centaurus A with sufficient resolution in a hydrodynamic simulation is computationally expensive and currently unfeasible. In this study, we seek to reproduce Centaurus A dwarfs using the same star formation physics as the Milky Way. We employ the semi-analytic model Galacticus to model dwarfs within a 600 kpc region. Utilizing astrophysical prescriptions and parameters matching the Milky Way satellites, we explore predictions for various properties and star formation histories (SFHs) to investigate environmental effects. We also reproduce cumulative luminosity and luminosity-metallicity relations consistent with observations for the overall Centaurus A satellite population, while predicting half-light radii, velocity dispersion, and SFHs for the dwarf galaxies in Centaurus A. The agreement between our predicted SFHs for Centaurus A dwarfs and those of the Milky Way implies the presence of universal processes governing star formation in these galaxies. Overall, our findings shed light on the star formation physics of dwarf galaxies in the Centaurus A system, revealing insights into their properties and dependence on the host environment.
1 Introduction
Dwarf galaxies are the fundamental building blocks of larger structures. They are the most abundant type of galaxies in the universe at all redshifts (e.g., Binggeli et al., 1988; Ferguson & Binggeli, 1994; Marzke & da Costa, 1997). Sensitivity to their host environments makes them excellent objects to study the effects of the surrounding environment and its role in dwarf galaxy physics, as shallow gravitational potentials make them extremely sensitive to environmental feedback (e.g., Dekel & Silk, 1986; Thoul & Weinberg, 1996; Benson et al., 2002; Okamoto et al., 2010). The dwarf galaxies of the Local Group are well studied both observationally (Albareti et al., 2017; Aguado et al., 2019; Martin et al., 2016; Abbott et al., 2018; McConnachie, 2012; York et al., 2012) and theoretically (Hopkins et al., 2018; Applebaum et al., 2021; Pandya et al., 2020; Shipp et al., 2022; Weerasooriya et al., 2023).
While Milky Way dwarfs have been simulated hydrodynamically, simulations of massive systems outside our Galactic neighborhood up to do not meet the resolution required to resolve star formation physics of fainter dwarfs. For example hydrodynamic simulations like TNG50 (Nelson et al., 2019) can only resolve dwarf galaxies down to . Studies of dwarfs in the Local Group alone cannot give a clear picture of the role environment plays in the physics of their evolution. With the upcoming unprecedented amount of observations through soon to be available from facilities like the Nancy Grace Roman telescope and Rubin Observatory, it is essential that we explore dwarfs beyond the Local Group with theoretical models. One method of investigation is through the luminosity- metallicity relation, which captures the stellar feedback physics of dwarf galaxies. Studies show that the mass–metallicity relationships of both Milky Way and M31 follow similar trends (Kirby et al., 2020). Thus, it is imperative that we look beyond the Local Group (LG) to understand whether or not properties in dwarf galaxies are independent of the environment.
Observational and theoretical studies have focused on dwarf galaxies that are hosted by Milky Way and Andromeda-like environments or cluster scale environments such as Virgo and Fornax (McConnachie, 2012; Richardson et al., 2011; Ferrarese et al., 2012; Eigenthaler et al., 2018). Centaurus A provides the most accessible opportunity to study dwarf galaxies within a higher mass host and in an environment which sits between group and cluster scales. But, few have explored dwarfs of Centaurus A (Müller et al., 2015, 2017, 2019). Thus, the question of how dwarf galaxy physics are affected by different mass hosts needs further exploration in these intermediate mass host environments. Centaurus A is the closest, easily observable giant elliptical galaxy located 3.8 Mpc from the Milky Way (Harris et al., 2010) with poorly constrained mass of - (Pearson et al., 2022; van den Bergh, 2000).
In recent years the halo of Centaurus A has been targeted by several surveys including the Survey of Centaurus A’s Baryonic Structures (SCABS; Taylor et al., 2016, 2017, 2018) and the Panoramic Imaging Survey of Cen & Sculptor (PISCeS; Sand et al., 2014; Crnojević et al., 2014; Crnojevic et al., 2016). These are the first systematic surveys of the dwarf satellites of Centaurus A. In addition, studies by Müller et al. (2015, 2017, 2019, 2021, 2022) have also covered both M83 and Centaurus A with DECam. As a result of these surveys the number of known or suspected dwarf galaxies has almost doubled over the past 5-10 years.
The mass of Centaurus A is currently not well constrained. Several studies have predicted the virial mass of Centaurus A using a variety of methods. For example Woodley et al. (2007) has estimated the mass of Centaurus A (pressure supported and rotational supported mass) using a globular cluster population within kpc (). van den Bergh (2000) has calculated the mass of Centaurus A using the virial theorem () and projected mass method out to kpc (). Müller et al. (2022) estimates a dynamical mass of within kpc. Pearson et al. (2022) has constrained the lower limit () on the mass of Centaurus A using stellar stream models. The upper range of virial masses measured for Centaurus A is (van den Bergh, 2000; Peng et al., 2004; Woodley et al., 2007; Łokas, 2008; Harris et al., 2015), which falls between the masses of Milky Way and large clusters such as Virgo and Fornax.
To date, few theoretical studies of the Centaurus A system have been carried out. Bovill et al. (2016) used a high-resolution N-body simulation that did not include baryons to study the Centaurus A globular clusters, and Müller et al. (2019) compares the luminosity function within 200 kpc to Centaurus A analogs in the TNG100 of Illustris-TNG simulations. TNG100 has a resolution of and resolving galaxies with (Pillepich et al., 2018). However, this mass is only softly below an SMC-like halo mass and is inadequate to resolve fainter dwarfs. Therefore, we need to explore more computationally efficient techniques, such as semi-analytic models (SAMs) that provide an efficient method to explore the star formation physics of dwarf galaxies.
In this work, we run the SAM Galacticus (Benson, 2012) on merger trees generated with Extended Press-Schechter (EPS) and from -body simulations of Centaurus A analogs. We use the same star formation physics that reproduces the properties of observed dwarfs of the Milky Way down to ultra-faint dwarfs (Weerasooriya et al., 2023). The goal of this work is to test whether the same astrophysical prescriptions and parameters of the Milky Way can reproduce the observed cumulative luminosity function and the luminosity-metallicity relation of the Centaurus A satellites, and if it can, make predictions for their properties and SFHs, in an effort to investigate the effects of host environment on these dwarfs. In Section 2, we describe the details of the simulation and modeling. In Section 3, we describe the sample of observational data taken from the literature. Next, in Section 4, we compare our models to the observed properties of the known Centaurus A dwarfs before exploring their potential star formation histories. Lastly, we present our discussions and conclusions in Section 6.
2 Simulation
We use a high-resolution cosmological N-body simulation of an isolated Centaurus A halo from Bovill et al. (2016). This simulation is run from to with WMAP9 cosmology (). Initial conditions were generated with MUSIC (Hahn & Abel, 2011) and the simulation run with Gadget 2 (Springel, 2005) and analyzed with the AMIGA (Knollmann & Knebe, 2009) and CONSISTENT_TREES (Behroozi et al., 2013b). The Centaurus A analog is selected to be a halo with no halos within at .
2.1 Semi-Analytic Model (SAM)
Despite the influx of observational data, high-resolution hydrodynamic simulations of Centaurus A analogs have not yet been run to . They are on the edge of current computational capabilities. Note that the studies such as van den Bergh (2000); Peng et al. (2004); Woodley et al. (2007); Łokas (2008); Harris et al. (2015); Pearson et al. (2022) use a variety of methods to determine the mass of Centaurus A, while in this work we defined the virial mass of a halo in terms of the spherical overdensity given by Bryan & Norman (1998). Thus they are not necessarily consistent with the methods used in our models. Due to significant uncertainties in these mass estimates of Centaurus A, we investigate a wide range of possible halo masses within virial radius for Centaurus A using 30 EPS trees with different merger histories.
We model the baryonic properties of the Centaurus A system using the Semi-Analytic Model (SAM) Galacticus (Benson, 2012). We apply the same astrophysical prescriptions and parameters that reproduced the Milky Way satellites in Weerasooriya et al. (2023). These include a reionization redshift of 9, filtering velocity (the scale below which halos are unable to accrete gas efficiently from the IGM after reionization) of 25 , cooling velocity (the scale below which cooling becomes inefficient in the circumgalactic medium) of 19 . Please refer to Weerasooriya et al. (2023) for further details. Of these parameters, quenching from ram pressure, and tidal stripping primarily determine how dwarf satellites are affected by a host environment. For example, ram pressure stripping can strip gas out of galaxies resulting in a shortage of gas supply and eventually quench star formation. However, we would like to remind the reader that the effect of ram pressure stripping efficiency was negligible for the Milky Way satellites (Weerasooriya et al., 2023). Regardless, we implement a ram pressure with the same high efficiency as in Weerasooriya et al. (2023).
We apply the astrophysical prescriptions and parameters which reproduce the star formation physics and star formation histories of the Milky Way satellites (Weerasooriya et al., 2023) to the N-body merger trees and Extended Press Schechter (EPS) merger trees of the Centaurus A analog. We make this assumption because there are very few studies exploring the star formation histories of Centaurus A dwarfs (Côté et al., 2009; Crnojević et al., 2011). The models run with merger trees from the N-body simulation probe only one possible mass of Centaurus A. Therefore, we run several EPS trees with different mass Centaurus A analogs spanning the full range of possible Centaurus A halo masses. While the EPS trees allow us to efficiently probe a range of for the Centaurus A halo, they do not provide positional information on the satellites. As such, EPS trees do not allow us to look at the dependence of satellite populations on their distance from the host.
3 Observational Sample
Observations of the Centaurus A dwarfs are inhomogeneous, therefore in this section we describe the sample of Centaurus A dwarfs taken from the literature that we will compare to our models. We use observational data for Centaurus A satellites from a variety of sources including Crnojević et al. (2010, 2014); Crnojevic et al. (2016); Crnojević et al. (2019); Karachentsev et al. (2013); Müller et al. (2015, 2017, 2019); Taylor et al. (2016, 2018). In Table 1, we present a compilation of observations from a variety of sources used in this study along with their references. In addition to the dwarfs in the above sample, we also include 38 new dwarf galaxy candidates from Taylor et al. (2023, in prep.) in our overall analysis, but do not list their properties in Table 1. Table 1 only includes galaxies with distance or velocity measurements that verify them as members of Centaurus A with distances (Table 1).
The current sample of observations of Centaurus A is incomplete due to three major reasons: 1.) Lack of systematic sky coverage that leads to spatial incompleteness. For example the PISCeS survey is spatially incomplete, and biased toward coverage of the Northeastern region of Centaurus A’s halo. These non-uniformities in design or analysis could make completeness calculations more complex. 2.) The detectability limits of different surveys, e.g. SCABS is limited to within kpc covering an area of 50 square degrees and surface brightness limit of in the g band (Leahy et al., private communication), while PISCeS can detect dwarfs down to within kpc and surface brightness limit of in the g band (Crnojević et al., 2014, 2019). 3.) The lack of distance measurements in the outskirts also hinders the determination of membership (Müller et al., 2017; Taylor et al., 2018). Distances are essential to determine the membership of satellites, their shape, and their brightness. Thus higher uncertainties in distances can cause these data to have higher errors in their sizes and magnitude measurements. Note that while the virial radius of Centaurus A is kpc, most of these satellites are beyond that limit, yet within Centaurus A’s ‘splashback radius’ of . The splashback radius is a physically motivated halo boundary that eliminates spurious evolution of radius and mass caused by standard definitions of virial radius (Diemer & Kravtsov, 2014).
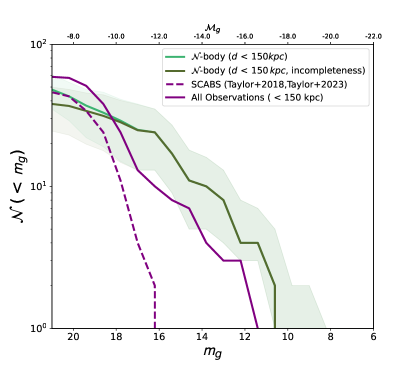
The observational properties of Centaurus A satellites are still largely unknown. Thus our knowledge of these galaxies and their properties is nowhere near as complete as our knowledge of the Milky Way system. Quantitative estimates of the incompleteness of Centaurus A dwarfs have not been made by previous studies, and such exploration is beyond the scope of our current work. A preliminary quantitative exploration of the completeness limits in SCABS Centaurus A satellites is underway by Leahy et al. (private communication). Their exploration of completeness using 5000 Monte Carlo dwarf galaxy realizations reveals completeness of for dwarf galaxies of in the g-band. They report completeness at g-band magnitudes of 20.01 and completeness at surface brightness of . In Figure 1, we compare our models within 150 kpc to the total number of galaxies expected in the region based on these preliminary artificial galaxy experiments. We note here that given the unconfirmed natures of the Taylor et al. 2023 dwarf candidates, this estimate should be considered as an upper limit with results interpreted in that context. Based on the comparison, our galaxy models agree with the observed luminosity function. However note that the observed luminosity function is slightly steeper.
| Name | Distance | References | ||||||||
|---|---|---|---|---|---|---|---|---|---|---|
| (h) | (min) | s | (deg) | (arcmin) | (arcsec) | (mag) | (mag) | (Mpc) | ||
| NGC4945 | 13 | 05 | 26.1 | -49 | 28 | 16.0 | -20.34 | -20.6 | 3.47 | 1,7 |
| NGC5102 | 13 | 21 | 57.8 | -36 | 37 | 47.0 | -18.24 | -20.37 | 3.66 | 1,7 |
| E274-01 | 15 | 14 | 13.5 | -46 | 48 | 45.0 | -17.35 | -19.2 | 3.09 | 2,7 |
| NGC5253 | 13 | 37 | 5.0 | -31 | 23 | 30.0 | -17.33 | -17.7 | 3.9 | 1,7 |
| E383-087 | 13 | 49 | 17.5 | -36 | 03 | 48.4 | -16.83 | -17.17 | 3.19 | 1,7 |
| NGC5206 | 13 | 30 | 41.0 | -47 | 53 | 42.0 | -16.43 | -16.97 | 3.6 | 1,7 |
| NGC5408 | 14 | 00 | 18.0 | -41 | 08 | 11.0 | -15.91 | -17.3 | 4.81 | 2,7 |
| E324-24 | 13 | 27 | 37.4 | -41 | 28 | 50.0 | -15.49 | -15.6 | 3.78 | 2,7 |
| E26958 | 13 | 07 | 38.0 | -46 | 43 | 30.0 | -14.99 | -16.8 | 4.78 | 6,7 |
| NGC5237 | 13 | 37 | 38.9 | -42 | 50 | 51.0 | -14.82 | -15.08 | 3.33 | 3,5,7 |
4 Properties of Centaurus A dwarfs
In this section, we compare different properties of the modeled Centaurus A dwarfs with observational data described in Section 3. We start by exploring the properties of the Centaurus A dwarfs including luminosities, half-light radii, and velocity dispersions.
4.1 Luminosity Function
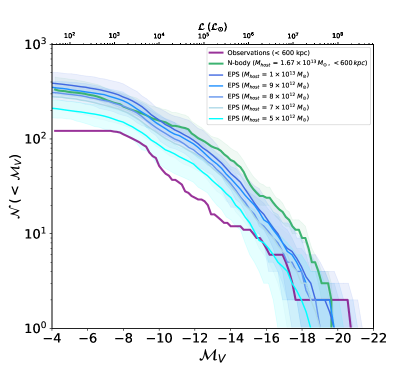
In Figure 2, we plot the cumulative luminosity function of Centaurus A satellites for observations within kpc of the projected radius and for dwarfs modeled with Galacticus out to 600 kpc in the y-z plane. For the purpose of comparison of Centaurus A dwarfs, we analyze satellites viewed in projection, as they would be observed. We remind the reader that this selection can be made only when using N-body trees since positional information is available. Since we do not know the viewing angle of our modeled Centaurus A, we rotate the line of sight relative to the direction of the simulation in 5-degree steps (note that the step size used here is arbitrary). This accounts for uncertainty in the luminosity functions. The median luminosity function over all potential viewing angles is shown in green, while the maximum and minimum is shown by the shaded envelope.
We also run models using merger trees generated by Extended Press Schechter (EPS) to explain the mass range of Centaurus A’s halo. We build the EPS merger tree using the method of Cole et al. (2000) with an accretion limit of 0.1, merge probability of 0.1, and mass resolution and recalibrated merger rates from Parkinson et al. (2008). Then we generate the EPS merger tree halo mass functions by implementing the method by Tinker et al. (2008) available in Galacticus. These halo mass distributions are then used to simulate galaxies. EPS models for different mass merger trees are shown in shades of blue. These models inherently do not have positional information. We run EPS models for and halos with 30 merger trees for each halo mass. The solid curves show the median per bin with shaded areas indicating the minimum and maximum over 30 EPS trees. All of these models follow the general shape of the luminosity function for observations within 600 kpc. However, there is some variation in the shape of the luminosity functions between N-body and EPS merger trees.
While we cannot constrain the mass of Centaurus A from the models due to poorly understood completeness in the observations for fainter dwarfs, comparison with models at the bright end of the luminosity function suggests that Centaurus A is likely to have a higher mass (). We find our models slightly overproduce the number of dwarfs at all luminosities, but the observed luminosity function within 600 kpc is still likely to be incomplete. However, our modeled dwarfs reproduce the overall shape of the observed cumulative luminosity function for N-body merger trees and EPS trees traced at all modeled host masses. Note that any such inference on the mass of Centaurus A halo from this approach is subject to the caveat that Galacticus predictions could be inaccurate.
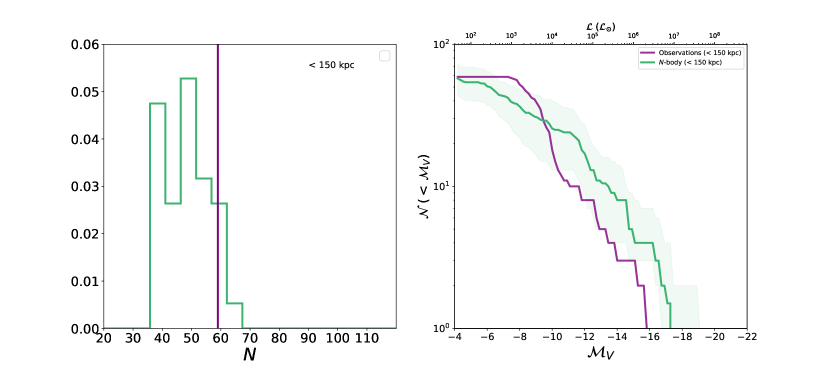
Poorly understood completeness limits of the observations within 600 kpc of Centaurus A make exploration of these satellites and their properties limited. However, the observational sample is relatively complete within 200 kpc (Müller et al., 2019) down to . SCABS and PISCeS surveys cover a spatial region within a projected radius of 150 kpc down to dwarfs as faint as (Crnojević et al., 2014; Crnojevic et al., 2016; Taylor et al., 2016) and we can assume completeness within 200 kpc down to (see section 3 for a detailed completeness discussion). We plot the luminosity function within 150 kpc and match the number of luminous satellites within 150 kpc in Figure 3 . The left panel shows the number of luminous satellites in our model in green and observed number of satellites in purple, and the right panel shows the luminosity function within 150 kpc for both our -body model (green) and observations (purple). Our current model predicts a median that is lower than the observed number of dwarf galaxies located within 150 kpc of Centaurus A, but the observed number is well within the distribution predicted by our model (refer to the left panel in Figure 3). The observed luminosity function demonstrates a slightly steeper slope within the 150 kpc radius. Nevertheless, our dwarf galaxy models are consistent with the lower boundary of the luminosity function envelope (see Figure 3). This is consistent with other studies of the inner 200 kpc of the Centaurus A halo (Müller et al., 2019).
4.2 Half Light Radii
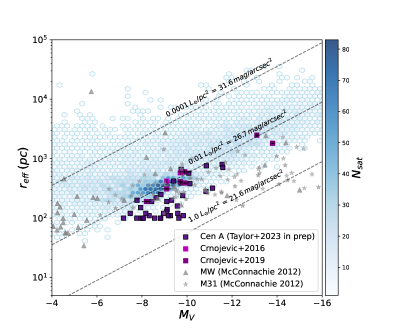
In Figure 4, we show the luminosity and half-light radii for the observed Centaurus A dwarfs and dwarfs modeled with 30 EPS merger trees with . We compare our results with available Centaurus A dwarfs (Crnojevic et al., 2016; Crnojević et al., 2019), Milky Way dwarfs, and M31 dwarfs (McConnachie, 2012). Note, the majority of observations beyond the Local Group do not go below . Galaxy sizes are computed by finding the radius at which the galaxy is rotationally supported against the combined gravitational potential of itself and the dark matter halo, given the computed angular momentum content of the galaxy. The half-light radii of the modeled Centaurus A satellite galaxies are computed in the band. Galacticus determines the half-light radii using the dark matter profile of halos. Dark matter profile is determined from a NFW profile. The scale radii for trees based on simulations are set from the N-body simulations while for trees based on EPS trees, the concentrations are calculated using the model by (Gao et al., 2008). We use SDSS filters since SCABS data are calibrated to the SDSS photometric system (Taylor et al., 2016).
At high luminosities, the modeled sizes of the dwarfs agree with observations of the Centaurus A dwarfs. However, modeled sizes for the fainter dwarfs are larger than the observed values. This is consistent with the systematically larger sizes of the fainter modeled dwarfs compared to observations of the Milky Way satellites (Weerasooriya et al., 2023). Galacticus tends to overpredict the half-light radii with merger trees generated from EPS and N-body simulations. EPS trees are unreliable for halos with due to dynamic range limitations of EPS (Somerville & Kolatt, 1999; Zhang et al., 2008). This may lead to inaccuracies in halo masses and/or formation time, which may subsequently affect the sizes of the galaxies which they contain. N-body trees over estimate half-light radii if a halo has particles (Weerasooriya et al., 2023). A study of how the resolution affects the size of the modeled dwarfs will be a subject of future study.
4.3 Metallicity
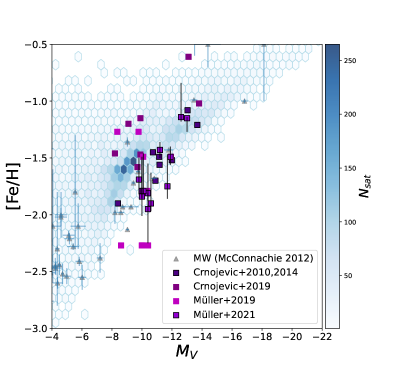
The currently available metallicities of the Centaurus A dwarfs are limited. In Figure 5 we have shown the observations of [Fe/H] for Centaurus A satellites from Crnojević et al. (2010, 2014, 2019) and Müller et al. (2019, 2021). Notice that Müller et al. (2019) finds a [Fe/H] - 2.25 dex metallicity floor between -8 to -10. However, their measurement errors are , consistent with our modeled values. While spectroscopic measurements of metallicities by Müller et al. (2021) agree well with Milky Way dwarfs, their photometric measurements are reported to have a larger scatter. The authors state that the scatter might be due to the age-metallicity degeneracy and incorrect assumptions of uniformly old ( Gyr) stellar populations. Using the same astrophysical prescriptions and parameters as those that reproduced the luminosity-metallicity relations of the Milky Way dwarfs, we present the modeled metallicities of the Centaurus A dwarfs in 30 EPS trees. The metallicities of the modeled dwarfs in this work agree well with currently available observations of Centaurus A satellites (Crnojević et al., 2010, 2019; Müller et al., 2019). This could potentially mean that the Centaurus A satellites have a similar enrichment history to that of the Milky Way’s satellites and/or that dwarf metallicities are independent of their local environment. In Weerasooriya et al. (2023), we show that ram pressure does not significantly affect the luminosity-metallicity relation of the Milky Way satellites. Therefore, we do not expect a significant change in luminosity metallicity relation as a function of halo mass.
4.4 Velocity Dispersion
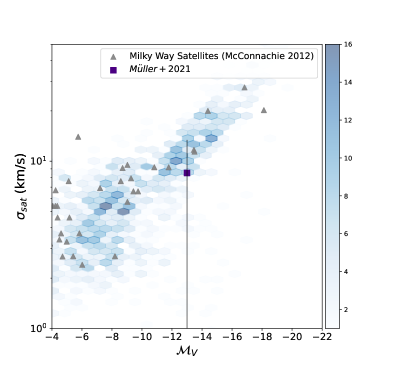
The velocity dispersion of satellite galaxies probes the dark matter mass of the host (Wake et al., 2012; Bogdán & Goulding, 2015; Schechter, 2015), and consequently its gravitational potential. However, velocity dispersions of Centaurus A satellites are unknown with the exception of KK197. As such, additional data is required to comment on the dwarfs population as a whole. In Figure 6, we show the velocity dispersion of KK197 (Müller et al., 2021), and those of the Milky Way satellites (McConnachie, 2012). We calculate the velocity dispersion of the modeled dwarfs () at stellar half-mass radii for the modeled dwarfs using the N-body tree. While no theoretical studies have looked at the velocity dispersions of the Centaurus A dwarfs, most of our modeled sample falls within the observed velocity dispersions of the Milky Way satellites (McConnachie, 2012). Given that velocity dispersion probes dark matter halo mass and the evolution of these galaxies, this suggests that Centaurus A dwarfs occupy similar halos, at a given stellar mass, as their Milky Way counterparts.
5 Star Formation Histories
Next we explore the modeled star formation histories (SFHs) of dwarfs. We remind the reader that due to the dearth of SFHs for the known Centaurus A satellites, we have used the star formation physics from Weerasooriya et al. (2023). Given the lack of observations of properties, SFHs of the Centaurus A dwarfs are even harder to come by. Thus, we make the assumption that astrophysical prescriptions and parameters of the Milky Way satellites could be applied to Centaurus A as well. Given our success reproducing the star formation history of the Milky Way satellites in Weerasooriya et al. (2023), overall shape of the luminosity function, and properties at of Centaurus A satellites, we consider it worthwhile to examine predicted SFHs for the Centaurus A dwarfs.
Unlike the Milky Way satellites, extensive observational studies on star formation histories of Centaurus A satellites are not available, with the exception of KK197, ESO-269066, ESO-381018 (Makarova et al., 2007) and five dwarf irregulars KK182 (Cen6), ESO269-58, KK196 (AM1318-444), HIPASS J1348-37, ESO384-16 (Crnojević et al., 2012). Both KK197 and ESO-269066 are dwarf spheroidals, while ESO-269066 is dwarf irregular. Dwarf spheroidals typically have old stellar populations whose light is dominated by their red giant branches, while dwarf irregulars are metal-poor and have varying levels of current star formation Crnojević et al. (2012). states KK197 and ESO-269066 have unusual RGB color scatter, which shows active star formation with high metallicity, while ESO-381018 is a typical dwarf irregular. Two of the dwarf irregulars (KK196 and ESO269-58) studied are within kpc (see Figure 6 of Crnojević et al. (2012)). Positioned in the middle of Centaurus A’s southern radio lobe, KK196 has a star formation rate of and has formed more than of stars more than 5 Gyrs ago (Crnojević et al., 2012). Meanwhile, ESO269-58, located kpc from Centaurus A, has few blue loop, red supergiants and a very broad red giant branch stars, and dense asymptotic giant branch zone. This dwarf has a higher star formation rate compared to KK196 with , and has formed of stars more than 5 Gyrs ago. While its star formation activity has been enhanced between 3-5 Gyrs ago, Crnojević et al. (2012) also find that Centaurus A has lowered its star formation rate in the last 1 Gyr.
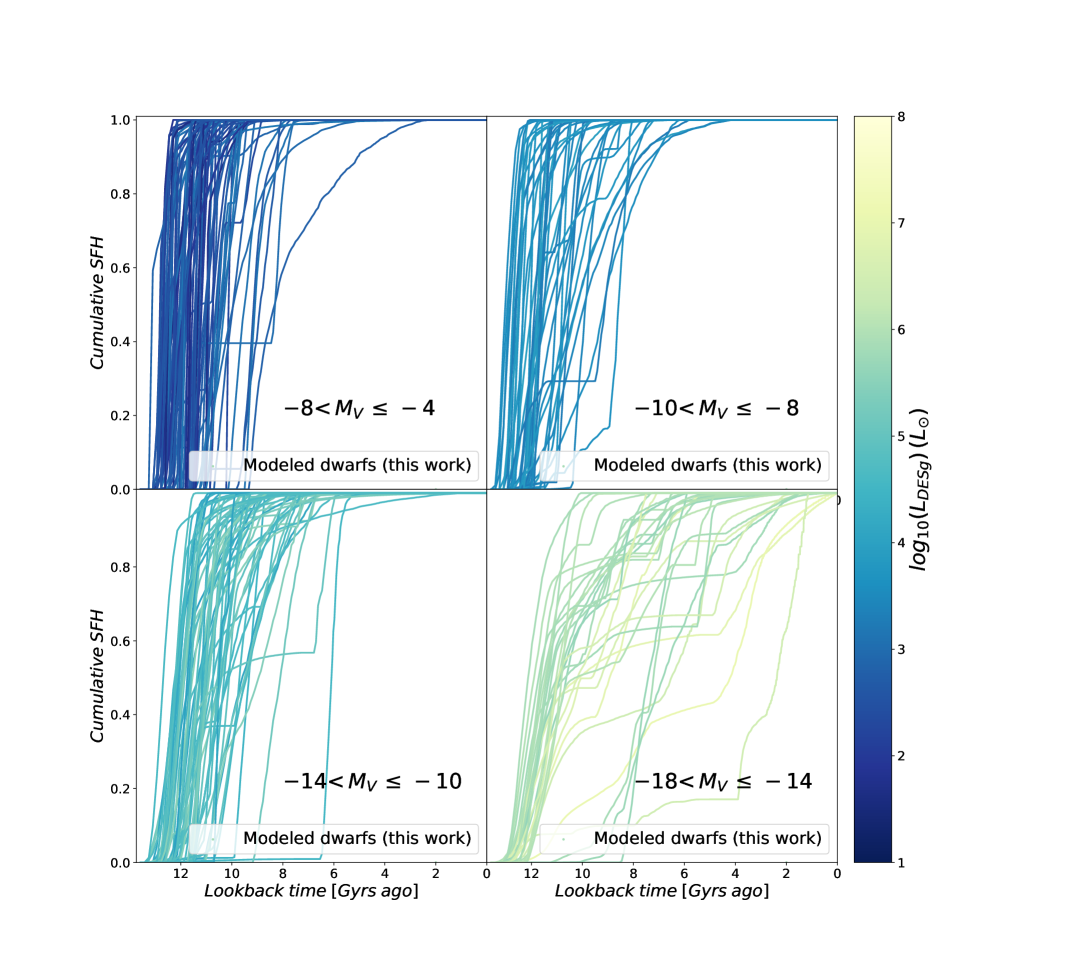
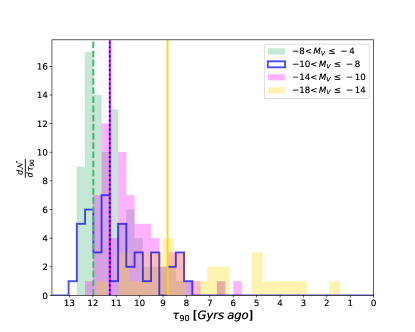
In Figure 7, we show the modeled cumulative star formation histories of the Centaurus A satellites as a function of look-back time colored by their absolute V band magnitude at for our N-body model. As expected, our Centaurus A modeled SFHs are similar to that of the Milky Way satellites in Weerasooriya et al. (2023). Their corresponding distributions for time taken to gain 90% of the stellar mass observed at z=0 () are given in Figure 8. In the upper left panel, we show dwarfs with . These are the faintest galaxies. Most ultra-faint dwarfs quenched 8–12 Gyrs ago as expected since the faintest observed Milky Way satellites are the fossils of the first galaxies (Bovill & Ricotti, 2011; Brown et al., 2012). The upper right panel shows the satellites in the range ; the majority of these satellites reached 90% of their present stellar mass 12 Gyrs ago. Most dwarfs in the upper right () and lower left panel () reached 90% of their present-day stellar mass Gyrs ago. Known SFHs from observations of Centaurus A dwarfs discussed earlier would fall in the lower left panel of Figure 7. However, our model overpredicts the quenching times in comparison to the two known quenching times. Most of the brightest galaxies in the lower right panel () acquired 90% of their stellar mass 8.8 Gyrs ago.
6 Summary & Conclusions
We have presented models of dwarf galaxies around Centaurus A analogs using the SAM Galacticus with astrophysical prescriptions and parameters calibrated to match the observed properties of Milky Way dwarf galaxies. In this study, we apply the best-fit parameter space chosen to reproduce the properties of the Milky Way satellites (Weerasooriya et al., 2023) to several N-body and EPS realizations of Centaurus A analogs in order to study the predicted satellite population. Our models are able to reproduce the overall properties of the dwarf population reasonably well.
We have explored properties such as the cumulative luminosity function, luminosity-metallicity, and half-light radii with respect to observations of the Centaurus A system. We also predict their velocity dispersions, star formation histories, etc. We summarize our results as follows,
-
•
The same astrophysical prescriptions and parameters that allow Galacticus to reproduce the Milky Way are used for the global properties of the Centaurus A satellites. While being cognizant of the lack of observations in the Centaurus A system, we conclude that the overall properties and trends of the Centaurus A satellite population is similar to the dwarf galaxies around the Milky Way.
-
•
Our N-body models within 600 kpc and EPS trees of Centaurus A reproduce luminosity functions that follow the overall shape of observations.
-
•
Centaurus A satellites follow a similar metal enrichment/stellar feedback to the Milky Way satellites. That is we obtain similar luminosity-metallicity relations for both the Milky Way and Centaurus A as expected. This suggests that the physics that governs the metal enrichment of dwarf galaxies is largely independent of the environment.
-
•
Assuming identical star formation physics of the Milky Way satellites for the Centaurus A satellites, SFHs and quenching times of the Centaurus A satellites also follow a similar trend to the Milky Way satellites.
References
- Abbott et al. (2018) Abbott, T. M. C., Abdalla, F. B., Alarcon, A., et al. 2018, Phys. Rev. D, 98, 043526, doi: 10.1103/PhysRevD.98.043526
- Aguado et al. (2019) Aguado, D. S., Ahumada, R., Almeida, A., et al. 2019, ApJS, 240, 23, doi: 10.3847/1538-4365/aaf651
- Albareti et al. (2017) Albareti, F. D., Allende Prieto, C., Almeida, A., et al. 2017, ApJS, 233, 25, doi: 10.3847/1538-4365/aa8992
- Applebaum et al. (2021) Applebaum, E., Brooks, A. M., Christensen, C. R., et al. 2021, ApJ, 906, 96, doi: 10.3847/1538-4357/abcafa
- Behroozi et al. (2013a) Behroozi, P. S., Wechsler, R. H., & Wu, H.-Y. 2013a, ApJ, 762, 109, doi: 10.1088/0004-637X/762/2/109
- Behroozi et al. (2013b) Behroozi, P. S., Wechsler, R. H., Wu, H.-Y., et al. 2013b, ApJ, 763, 18, doi: 10.1088/0004-637X/763/1/18
- Benson (2011) Benson, A. 2011, Galacticus: A Semi-Analytic Model of Galaxy Formation. http://ascl.net/1108.004
- Benson (2012) Benson, A. J. 2012, New A, 17, 175, doi: 10.1016/j.newast.2011.07.004
- Benson et al. (2002) Benson, A. J., Lacey, C. G., Baugh, C. M., Cole, S., & Frenk, C. S. 2002, MNRAS, 333, 156, doi: 10.1046/j.1365-8711.2002.05387.x
- Binggeli et al. (1988) Binggeli, B., Sandage, A., & Tammann, G. A. 1988, ARA&A, 26, 509, doi: 10.1146/annurev.aa.26.090188.002453
- Bogdán & Goulding (2015) Bogdán, Á., & Goulding, A. D. 2015, ApJ, 800, 124, doi: 10.1088/0004-637X/800/2/124
- Bovill et al. (2016) Bovill, M. S., Puzia, T. H., Ricotti, M., & Taylor, M. A. 2016, ApJ, 832, 88, doi: 10.3847/0004-637X/832/1/88
- Bovill & Ricotti (2011) Bovill, M. S., & Ricotti, M. 2011, ApJ, 741, 17, doi: 10.1088/0004-637X/741/1/17
- Brown et al. (2012) Brown, T. M., Tumlinson, J., Geha, M., et al. 2012, ApJ, 753, L21, doi: 10.1088/2041-8205/753/1/L21
- Bryan & Norman (1998) Bryan, G. L., & Norman, M. L. 1998, ApJ, 495, 80, doi: 10.1086/305262
- Cole et al. (2000) Cole, S., Lacey, C. G., Baugh, C. M., & Frenk, C. S. 2000, MNRAS, 319, 168, doi: 10.1046/j.1365-8711.2000.03879.x
- Côté et al. (2009) Côté, S., Draginda, A., Skillman, E. D., & Miller, B. W. 2009, AJ, 138, 1037, doi: 10.1088/0004-6256/138/4/1037
- Crnojević et al. (2011) Crnojević, D., Grebel, E. K., & Cole, A. A. 2011, A&A, 530, A59, doi: 10.1051/0004-6361/201015474
- Crnojević et al. (2012) —. 2012, A&A, 541, A131, doi: 10.1051/0004-6361/201218898
- Crnojević et al. (2010) Crnojević, D., Grebel, E. K., & Koch, A. 2010, A&A, 516, A85, doi: 10.1051/0004-6361/200913429
- Crnojević et al. (2014) Crnojević, D., Sand, D. J., Caldwell, N., et al. 2014, ApJ, 795, L35, doi: 10.1088/2041-8205/795/2/L35
- Crnojevic et al. (2016) Crnojevic, D., Caldwell, N., Guhathakurta, P., et al. 2016, Resolving the faint end of the satellite luminosity function for the nearest elliptical Centaurus A, HST Proposal. Cycle 22, ID. #13856
- Crnojević et al. (2019) Crnojević, D., Sand, D. J., Bennet, P., et al. 2019, ApJ, 872, 80, doi: 10.3847/1538-4357/aafbe7
- de Vaucouleurs et al. (1991) de Vaucouleurs, G., de Vaucouleurs, A., Corwin, Herold G., J., et al. 1991, Third Reference Catalogue of Bright Galaxies
- Dekel & Silk (1986) Dekel, A., & Silk, J. 1986, ApJ, 303, 39, doi: 10.1086/164050
- Diemer & Kravtsov (2014) Diemer, B., & Kravtsov, A. V. 2014, ApJ, 789, 1, doi: 10.1088/0004-637X/789/1/1
- Doyle et al. (2005) Doyle, M. T., Drinkwater, M. J., Rohde, D. J., et al. 2005, MNRAS, 361, 34, doi: 10.1111/j.1365-2966.2005.09159.x
- Eigenthaler et al. (2018) Eigenthaler, P., Puzia, T. H., Taylor, M. A., et al. 2018, ApJ, 855, 142, doi: 10.3847/1538-4357/aaab60
- Ferguson & Binggeli (1994) Ferguson, H. C., & Binggeli, B. 1994, A&A Rev., 6, 67, doi: 10.1007/BF01208252
- Ferrarese et al. (2012) Ferrarese, L., Côté, P., Cuillandre, J.-C., et al. 2012, ApJS, 200, 4, doi: 10.1088/0067-0049/200/1/4
- Gao et al. (2008) Gao, L., Navarro, J. F., Cole, S., et al. 2008, MNRAS, 387, 536, doi: 10.1111/j.1365-2966.2008.13277.x
- Hahn & Abel (2011) Hahn, O., & Abel, T. 2011, MNRAS, 415, 2101, doi: 10.1111/j.1365-2966.2011.18820.x
- Harris et al. (2020) Harris, C. R., Millman, K. J., van der Walt, S. J., et al. 2020, Nature, 585, 357, doi: 10.1038/s41586-020-2649-2
- Harris et al. (2010) Harris, G. L. H., Rejkuba, M., & Harris, W. E. 2010, PASA, 27, 457, doi: 10.1071/AS09061
- Harris et al. (2015) Harris, W. E., Harris, G. L., & Hudson, M. J. 2015, ApJ, 806, 36, doi: 10.1088/0004-637X/806/1/36
- Hopkins et al. (2018) Hopkins, P. F., Wetzel, A., Kereš, D., et al. 2018, MNRAS, 480, 800, doi: 10.1093/mnras/sty1690
- Hunter (2007) Hunter, J. D. 2007, Computing in Science & Engineering, 9, 90, doi: 10.1109/MCSE.2007.55
- James et al. (2004) James, P. A., Shane, N. S., Beckman, J. E., et al. 2004, A&A, 414, 23, doi: 10.1051/0004-6361:20031568
- Karachentsev et al. (2013) Karachentsev, I. D., Makarov, D. I., & Kaisina, E. I. 2013, AJ, 145, 101, doi: 10.1088/0004-6256/145/4/101
- Karachentsev et al. (2003) Karachentsev, I. D., Makarov, D. I., Sharina, M. E., et al. 2003, A&A, 398, 479, doi: 10.1051/0004-6361:20021566
- Kirby et al. (2020) Kirby, E. N., Gilbert, K. M., Escala, I., et al. 2020, AJ, 159, 46, doi: 10.3847/1538-3881/ab5f0f
- Kluyver et al. (2016) Kluyver, T., Ragan-Kelley, B., Pérez, F., et al. 2016, in Positioning and Power in Academic Publishing: Players, Agents and Agendas, ed. F. Loizides & B. Scmidt (IOS Press), 87–90. https://eprints.soton.ac.uk/403913/
- Knollmann & Knebe (2009) Knollmann, S. R., & Knebe, A. 2009, ApJS, 182, 608, doi: 10.1088/0067-0049/182/2/608
- Lauberts & Valentijn (1989) Lauberts, A., & Valentijn, E. A. 1989, The surface photometry catalogue of the ESO-Uppsala galaxies
- Łokas (2008) Łokas, E. L. 2008, ApJ, 680, L101, doi: 10.1086/589943
- Makarova et al. (2007) Makarova, L., Makarov, D., Dolphin, A., et al. 2007, in Galaxy Evolution across the Hubble Time, ed. F. Combes & J. Palouš, Vol. 235, 320–320, doi: 10.1017/S1743921306006855
- Martin et al. (2016) Martin, N. F., Ibata, R. A., Lewis, G. F., et al. 2016, ApJ, 833, 167, doi: 10.3847/1538-4357/833/2/167
- Marzke & da Costa (1997) Marzke, R. O., & da Costa, L. N. 1997, AJ, 113, 185, doi: 10.1086/118243
- McConnachie (2012) McConnachie, A. W. 2012, AJ, 144, 4, doi: 10.1088/0004-6256/144/1/4
- Müller et al. (2015) Müller, O., Jerjen, H., & Binggeli, B. 2015, A&A, 583, A79, doi: 10.1051/0004-6361/201526748
- Müller et al. (2017) —. 2017, A&A, 597, A7, doi: 10.1051/0004-6361/201628921
- Müller et al. (2022) Müller, O., Lelli, F., Famaey, B., et al. 2022, A&A, 662, A57, doi: 10.1051/0004-6361/202142351
- Müller et al. (2019) Müller, O., Rejkuba, M., Pawlowski, M. S., et al. 2019, A&A, 629, A18, doi: 10.1051/0004-6361/201935807
- Müller et al. (2021) Müller, O., Fahrion, K., Rejkuba, M., et al. 2021, A&A, 645, A92, doi: 10.1051/0004-6361/202039359
- Nelson et al. (2019) Nelson, D., Pillepich, A., Springel, V., et al. 2019, MNRAS, 490, 3234, doi: 10.1093/mnras/stz2306
- Okamoto et al. (2010) Okamoto, T., Frenk, C. S., Jenkins, A., & Theuns, T. 2010, MNRAS, 406, 208, doi: 10.1111/j.1365-2966.2010.16690.x
- Pandya et al. (2020) Pandya, V., Somerville, R. S., Anglés-Alcázar, D., et al. 2020, ApJ, 905, 4, doi: 10.3847/1538-4357/abc3c1
- Parkinson et al. (2008) Parkinson, H., Cole, S., & Helly, J. 2008, MNRAS, 383, 557, doi: 10.1111/j.1365-2966.2007.12517.x
- Pearson et al. (2022) Pearson, S., Price-Whelan, A. M., Hogg, D. W., et al. 2022, arXiv e-prints, arXiv:2205.12277. https://arxiv.org/abs/2205.12277
- Peng et al. (2004) Peng, E. W., Ford, H. C., & Freeman, K. C. 2004, ApJ, 602, 705, doi: 10.1086/381236
- Pillepich et al. (2018) Pillepich, A., Nelson, D., Hernquist, L., et al. 2018, MNRAS, 475, 648, doi: 10.1093/mnras/stx3112
- Richardson et al. (2011) Richardson, J. C., Irwin, M. J., McConnachie, A. W., et al. 2011, ApJ, 732, 76, doi: 10.1088/0004-637X/732/2/76
- Sand et al. (2014) Sand, D. J., Crnojević, D., Strader, J., et al. 2014, ApJ, 793, L7, doi: 10.1088/2041-8205/793/1/L7
- Schechter (2015) Schechter, P. L. 2015, arXiv e-prints, arXiv:1508.02358. https://arxiv.org/abs/1508.02358
- Sharina et al. (2008) Sharina, M. E., Karachentsev, I. D., Dolphin, A. E., et al. 2008, MNRAS, 384, 1544, doi: 10.1111/j.1365-2966.2007.12814.x
- Shipp et al. (2022) Shipp, N., Panithanpaisal, N., Necib, L., et al. 2022, arXiv e-prints, arXiv:2208.02255. https://arxiv.org/abs/2208.02255
- Somerville & Kolatt (1999) Somerville, R. S., & Kolatt, T. S. 1999, MNRAS, 305, 1, doi: 10.1046/j.1365-8711.1999.02154.x
- Springel (2005) Springel, V. 2005, MNRAS, 364, 1105, doi: 10.1111/j.1365-2966.2005.09655.x
- Taylor et al. (2018) Taylor, M. A., Eigenthaler, P., Puzia, T. H., et al. 2018, ApJ, 867, L15, doi: 10.3847/2041-8213/aae88d
- Taylor et al. (2016) Taylor, M. A., Muñoz, R. P., Puzia, T. H., et al. 2016, arXiv e-prints, arXiv:1608.07285. https://arxiv.org/abs/1608.07285
- Taylor et al. (2017) Taylor, M. A., Puzia, T. H., Muñoz, R. P., et al. 2017, MNRAS, 469, 3444, doi: 10.1093/mnras/stx1021
- Thoul & Weinberg (1996) Thoul, A. A., & Weinberg, D. H. 1996, ApJ, 465, 608, doi: 10.1086/177446
- Tinker et al. (2008) Tinker, J., Kravtsov, A. V., Klypin, A., et al. 2008, ApJ, 688, 709, doi: 10.1086/591439
- van den Bergh (2000) van den Bergh, S. 2000, Cambridge Astrophysics Series, 35
- Virtanen et al. (2020) Virtanen, P., Gommers, R., Oliphant, T. E., et al. 2020, Nature Methods, 17, 261, doi: 10.1038/s41592-019-0686-2
- Wake et al. (2012) Wake, D. A., Franx, M., & van Dokkum, P. G. 2012, arXiv e-prints, arXiv:1201.1913. https://arxiv.org/abs/1201.1913
- Weerasooriya et al. (2023) Weerasooriya, S., Bovill, M. S., Benson, A., Musick, A. M., & Ricotti, M. 2023, ApJ, 948, 87, doi: 10.3847/1538-4357/acc32b
- Woodley et al. (2007) Woodley, K. A., Harris, W. E., Beasley, M. A., et al. 2007, AJ, 134, 494, doi: 10.1086/518788
- York et al. (2012) York, D. G., Straka, L. A., Bishof, M., et al. 2012, MNRAS, 423, 3692, doi: 10.1111/j.1365-2966.2012.21166.x
- Zhang et al. (2008) Zhang, J., Fakhouri, O., & Ma, C.-P. 2008, MNRAS, 389, 1521, doi: 10.1111/j.1365-2966.2008.13671.x