The MUSE Ultra Deep Field (MUDF). IV. A pair of X-ray weak quasars at the heart of two extended Ly nebulae
Abstract
We present the results obtained from follow-up observations of the MUSE Ultra Deep Field (MUDF) at X-ray energies with XMM–Newton. The MUDF is centred on a unique field with two bright, physically associated quasars at , separated by 500 kpc in projection. Both quasars are embedded within extended Ly nebulae ( at a surface brightness flux level of ), whose elongated morphology is suggestive of an extended filament connecting the quasar haloes. The new X-ray observations presented here allow us to characterise the physical properties (e.g. X-ray slope, luminosities, gas column densities) in the innermost region of the MUDF quasars. We find that both quasars are X-ray underluminous compared to objects at similar ultraviolet luminosities. Based on our X-ray spectral analysis, absorbing columns of 1023 cm-2 appear unlikely, therefore such a weakness is possibly intrinsic. When also including literature data, we do not observe any detectable trend between the area of the nebulae and nuclear luminosities at both the rest-frame 2 keV and 2500 Å. The area is also not correlated with the X-ray photon index nor with the integrated band flux in the hard band (2–10 keV). We also do not find any trend between the extended Ly emission of the nebulae and the nuclear X-ray luminosity. Finally, the properties of the MUDF quasars’ nebulae are consistent with the observed relation between the Ly integrated luminosity of the nebulae and their area. Our results suggest that the quasar ionization power is not a strong driver of the morphology and size of the nebulae.
keywords:
galaxies: formation – galaxies: haloes – galaxies: high-redshift – X-rays: galaxies – X-rays: general – quasars: general1 Introduction
The current cosmological concordance model (CDM) predicts that galaxies form in overdensities at the intersection of filaments, which compose the cosmic web (e.g. Bond et al. 1996; Dayal & Ferrara 2018). This prediction is supported indirectly by observations of the large scale structures traced with galaxy surveys (e.g. Reid et al., 2012; Anderson et al., 2014; Wisotzki et al., 2018; Malavasi et al., 2020) and by studies of the Ly forest in absorption (e.g. McDonald et al., 2005). A valuable technique to map the gas distribution in the circumgalactic medium (CGM) has been through the direct imaging of the fluorescent Ly line in emission around bright quasars (e.g. Cantalupo et al. 2014; Hennawi et al. 2015; Borisova et al. 2016; Arrigoni Battaia et al. 2018, 2019a, 2019b; Farina et al. 2019; Cai et al. 2019; O’Sullivan et al. 2020; Fossati et al. 2021) and galaxies (Leclercq et al., 2017; Wisotzki et al., 2018), where the integral field spectrographs positioned at the largest observing facilities, such as the Multi-Unit Spectroscopic Explorer (MUSE; Bacon et al., 2010) at the Very Large Telescope and the Keck Cosmic Web Imager (KCWI; Morrissey et al., 2018) at the Keck telescope, have been key to significantly improve the detection of this extended Ly emission (see also e.g. Umehata et al., 2019; Bacon et al., 2021; Kusakabe et al., 2022; Lujan Niemeyer et al., 2022).
Understanding the ionising source of extended Ly nebulae requires multi-wavelength data as obscured AGN, for instance, can be missed at UV energies (e.g. Geach et al., 2009). Indeed, rest-frame UV-based surveys are blind to dust obscured quasars, whilst X-rays (together with radio wavelengths) can help to constrain the presence (or not) of possible sources associated to extended Ly emission (see Cantalupo, 2017, for a review on the topic).
Ly nebulae have not yet been systematically targeted with deep X-ray observations, as the presence of a hard ionising source, the quasar, is usually given for granted. However, X-ray explorations have been conducted to understand the nature of the so-called Ly blobs (LABs; Steidel et al., 2001) in which the identification of the powering sources turned out to be difficult. To our knowledge, the only field with deep X-ray coverage in the literature is the Small Selected Area 22h (SSA22) field (Lilly et al., 1991; Steidel et al., 1998). SSA22 is an overdense region at known to host several LABs (e.g., Matsuda et al., 2004). The field has been extensively studied at several wavelengths. First evidence of embedded powering sources in the LABs came from the detection of bright submillimetre objects with a bolometric luminosity in excess of L⊙ (e.g. Chapman et al., 2001; Geach et al., 2005). No evidence from deep Chandra X-ray observations of a clear X-ray counterpart was found (Chapman et al., 2004), yet the possibility of a luminous but heavily obscured AGN along our line of sight was not excluded. By analysing the same data, Basu-Zych & Scharf (2004) discovered a hard-band X-ray source in a second giant Ly emission nebula in the SSA22 region. They confirmed that the nebula with significant submillimetre output is undetected at the X-ray energies, whilst the other is a factor of 2–10 times less bright in the submillimetric but appears to contain a highly obscured AGN. Neither of these two Ly nebulae were associated with conspicuous radio emission. With even deeper Chandra observations (400 ks), Lehmer et al. (2009) found a total of five X-ray detected sources in 158 Ly emitters in the SSA22 field, implying a larger fraction of AGN activity than in lower density environments (see also Monson et al. 2023).
Nilsson et al. (2006) published the discovery of a Ly nebula at in the Great Observatories Origins Deep Survey (GOODS) South field, which is rich in multiwavelength data from the X-rays with Chandra to the infrared with Spitzer. Intriguingly, unlike other known Ly extended nebulae, the deep GOODS imaging of the nebulae displayed no associated continuum counterparts in any band, from the X-rays to the infrared, suggesting that the most probable origin of the extended Ly emission could be cold accretion onto a dark matter halo rather than an AGN. This scenario, however, was later disproved by the detection of six continuum sources associated with the nebula and a nearby obscured AGN (Prescott et al., 2015), which actually turns out to be located at the center of a larger Ly structure (Sanderson et al., 2021).
LABs are also found at much lower redshifts. Kawamuro et al. (2017) presented NuSTAR hard X-ray (3–30 keV) observations, complemented with Chandra and Swift data, of the two X-ray brightest sources at that show extended Ly emission, SDSS J011341.11+010608.5 and SDSS J115544.59014739.9 (Schirmer et al., 2016). NuSTAR data revealed the presence of bright X-ray emission in both sources, with 2–10 keV luminosity erg s-1 and moderate obscuration ( cm-2).
In this framework, our group designed an observational campaign to acquire very deep observations with MUSE in a arcmin2 region centred at RA=21:42:24 and Dec=44:19:48 (hereafter the MUSE Ultra Deep Field or MUDF). The MUDF hosts several astrophysical structures at different redshifts, including two physically associated quasars at , J214225.78442018.3 and J214222.17441929.8 (hereafter J21424420 and J21424419, respectively), with a projected separation of arcmin (or at ). Another quasar with similar redshift lies at 8 arcmin separation (LBQS 21384427), making this system a quasar triplet (Francis & Hewett, 1993). In the first paper of this series, Lusso et al. (2019a) studied the morphology of the extended Ly nebulae surrounding the quasars, observing that the ionized gas is elongated along the line connecting the two sources. In the second paper, Fossati et al. (2019) studied of the galaxy environment and gaseous properties of the seven galaxy groups detected at redshifts with halo mass in the interval . The absorption strength associated with these groups is higher to that of near isolated galaxies at similar mass and impact parameters. Additionally, no evidence was found for widespread cool gas that could be associated to a diffuse intra-group medium. In the third paper, Revalski et al. (2023) utilised the extensive wavelength coverage of MUSE and WFC3 to measure spectroscopic redshifts for 419 sources down to galaxy stellar masses of at , and publicly released the calibrated Hubble Space Telescope (HST) observations, catalogues, and associated data products111https://archive.stsci.edu/hlsp/mudf.
In this paper, we present the XMM–Newton observation of the MUDF, which provides the first view at high energies of the assembly of a potentially massive overdensity in this field. Our main goal is to characterise the physical properties (e.g. X-ray slope, luminosities, gas column densities) in the innermost region of quasars with physically associated and extended Ly nebulae.
The paper is structured as follows: in Section 2 we present the MUDF and XMM–Newton observations and data reduction, whilst the X-ray and the UV spectral analyses are discussed in Section 3 and Section 4, respectively. Section 5 is devoted to the presentation of the results and their discussion, with conclusions drawn in Section 6. Whenever luminosity values are reported, we have assumed a standard flat CDM cosmology with and km s-1 Mpc-1.
2 Observations and data reduction
2.1 The MUSE Ultra Deep Field data
The MUDF is covered by 140 h of MUSE data (ESO PID 1100.A0528, see Fossati et al. 2019, for details about the survey design, the MUSE observations and data reduction; Fossati et al. in preparation for the presentation of the final dataset), with 100 h in the centremost region. This programme is complemented by deep high resolution spectroscopy of the quasars with UVES (Ultraviolet Visual Echelle Spectrograph; Dekker et al. 2000) at the VLT (ESO PIDs 65.O0299, 68.A0216, 69.A0204, 102.A0194; D’Odorico et al. 2002), and by a very deep spectroscopic survey (90 orbits in a single field) in the near-infrared with the Wide Field Camera 3 (WFC3) instrument on board the HST (Revalski et al., 2023), together with deep eight-orbit near UV imaging (program IDs: 15637, PI: M. Rafelski; and 15968, PI: M. Fossati). Specifically, the MUDF has been observed with the WFC3/IR with the G141 grism and the F140W filter, which covers a spectral range of 10750–17000 Å, and thus extends the MUSE spectroscopic data in the rest-frame UV, with a resolving power of at 14000 Å. We refer to Revalski et al. (2023) for details on the program design and acquisition of the HST observations.
2.2 The X-ray data
XMM–Newton targeted the MUDF for a full orbit (revolution 3731, duration 139 ks; PI: E. Lusso) on 2020 April 22, with the three EPIC (European Photon Imaging Camera) cameras (Strüder et al., 2001; Turner et al., 2001) operating in Full Frame mode with thin optical filter. The event files were reprocessed with the Science Analysis System (sas) v19.1.0, following the standard procedures and using the latest calibration files. The final part of the observation was affected by background flares, hence the good time intervals have been created by imposing a count rate threshold for high-energy single-pixel events of 0.4 s-1 (10–12 keV) and 0.35 s-1 (10 keV) over the whole pn and MOS detectors222https://www.cosmos.esa.int/web/xmm-newton/technical-details-epic, respectively. After the dead-time correction and background filtering, the net exposures are 94.8 ks for pn, 128.5 ks for MOS1, and 128.6 ks for MOS2.
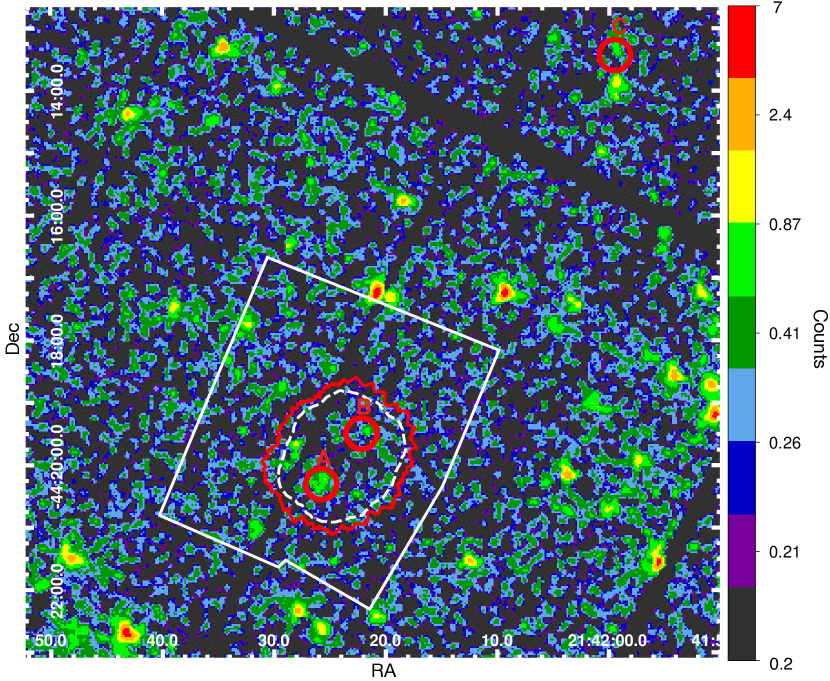
The source spectra were extracted from circular regions centred at the nominal optical coordinates of each target of interest, with radii of 15 for J21424420 (and LBQS 21384427) and 12 for J21424419, corresponding to an encircled energy fraction of 70 %. Although a non negligible fraction of counts might be lost,333Note that this ‘aperture loss’ is corrected for at the spectral analysis stage by the ancillary response files, which store all the geometrical information relative to the source extraction position on each detector (e.g. effective area, quantum efficiency, vignetting). such apertures are required due to the presence of nearby point-like or diffuse emission structures that would otherwise contaminate the source spectra (see Figure 1 and Section 3.1). The background was evaluated on nearby regions free of excess emission, with radii of 40–60 depending on the target and detector. The total number of collected net counts is provided for each source in Table 1. We note that LBQS 21384427 falls outside the MOS1 field of view, while in the pn image J21424420 partly falls on the gap between two adjacent chips, thus reducing the actual effective area. The appropriate response files were generated with the sas tasks rmfgen and arfgen.
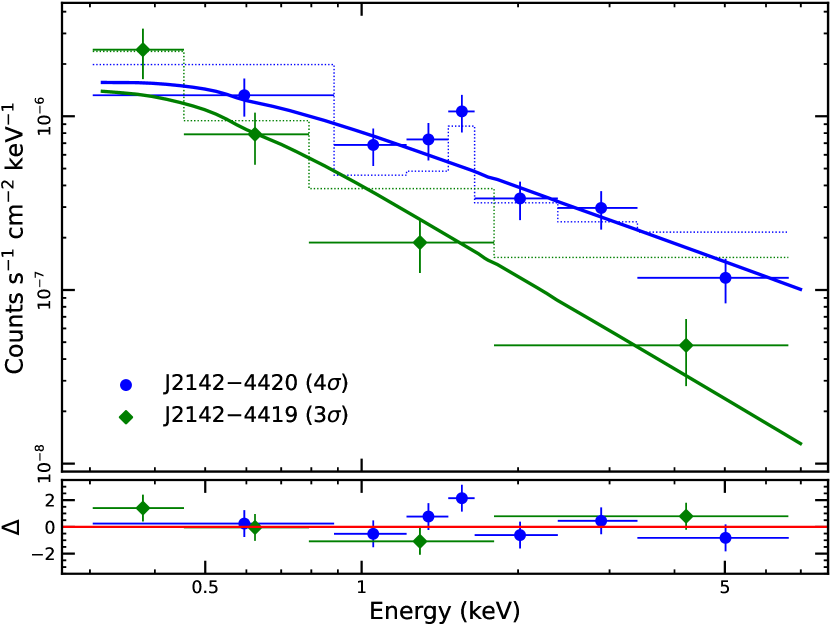
The spectral analysis was performed over the 0.3–7 keV band with the xspec v12.12.0 fitting package (Arnaud, 1996). The spectra are fully background-dominated at higher energies, and changing the upper end of the fitting range has no effect on the results. Given the limited statistics, the spectra were binned to ensure a minimum of one count per energy channel and a modified version of the Cash statistic was adopted (cstat, or W-statistic in xspec; Cash, 1979; Kaastra, 2017), as appropriate for source and background data in the Poissonian regime. The uncertainties we provide on the model parameters, including fluxes, correspond to , unless stated otherwise. The fits were simultaneously carried out on the individual spectra from the three EPIC detectors. Yet, for visual purposes, we also generated a merged EPIC spectrum with the sas task epicspeccombine (see Figure 2).
| Object | Ctsd | ||||||||
|---|---|---|---|---|---|---|---|---|---|
| (A) J21424420 | 3.2290.003 | 22423 | 1.060.14 | 0.66 | 403/433 | 15.5 | |||
| (B) J21424419 | 3.2210.004 | 6718 | 1.73 | 0.38 | 240/263 | 2.9 | |||
| (C) LBQS 21384427 | 3.170 | 13620 | 1.110.17 | 0.75 | 316/301 | - |
3 X-ray spectral analysis
Before embarking on the analysis of the X-ray spectra of the quasar pair, we note that both sources are significantly fainter (by roughly an order of magnitude) than expected. In fact, as no deep X-ray observation of this field was available before the current XMM–Newton programme, we had estimated preliminary count rates by converting the rest-frame monochromatic luminosities at 2500 Å (Table 1), from the WFC3 spectra, into those at 2 keV through the correlation of Lusso & Risaliti (2016). Based on this, we should have collected at least several hundred net counts also from the fainter object, thus allowing a robust determination of the X-ray spectral parameters. This is clearly not the case, even considering the unfortunate position of J21424420 near a gap on the pn detector (see Figure 1 and Section 2). As a consequence, the components of the quasar pair must be either highly absorbed or intrinsically weak in the X-rays.
Given the limited data quality, we first modelled the spectra with a simple power law modified by Galactic absorption, fixed at cm-2 (HI4PI Collaboration et al., 2016). The fit is statistically acceptable for both quasars (Table 1), and the photon index of for J21424419 is fully consistent with the typical values found in AGN with negligible X-ray absorption (e.g. Young et al., 2009; Scott et al., 2011), although the nominal 1 confidence range is rather large ( 1.3–2.3). The spectral slope of J21424420 is remarkably flat instead, at . The two spectra are shown in Figure 2 with the best-fit power-law models, and illustrate how J21424420 is detected also below 1 keV at the 3.5 level, ruling out the presence of a strong low-energy cut-off at keV in the rest frame.
We also conducted another model fit by adding an additional parameter to account for any possible column density in the source frame, preserving the overall number of degrees of freedom by fixing the continuum photon index to . The absorbed power-law model returns a nearly identical fit statistics for J21424419, and only an upper limit of cm-2 can be placed on the local column density. Conversely, for J21424420 the fit actually worsens by , as tilting the continuum slope from the intrinsic to the observed requires a column density cm-2, which leaves clear positive residuals below 1 keV. A simple absorption-based model therefore fails to reproduce the X-ray spectrum of J21424420.
Alternatively, one might suspect that the direct X-ray continuum from J21424420 is completely attenuated by a Compton-thick foreground screen, and that the observed emission is dominated by reflection from distant material. The latter interpretation is supported by a tentative line-like excess around 1.5–1.6 keV (which can be noticed in Figure 2 despite the coarse binning), suggesting the presence of a Fe K feature (6.4–7 keV in the rest frame, depending on the ionisation state). When an unresolved Gaussian profile is added to the baseline power-law model, the fit improves by with the loss of two degrees of freedom. The line would have a rest energy of keV and a rest equivalent width of 1 keV. This scenario, however, appears unlikely for the following reasons. First, reflection spectra from neutral matter are characterised by a much flatter continuum than observed here, if not inverted (i.e., ). Indeed, the spectrum of J21424420 can be accounted for by a reflection model that self-consistently includes continuum and emission lines (e.g. García et al., 2013) only allowing for a relatively high ionisation of the gas, as also implied by the centroid energy of the putative Fe K feature. This poses several problems in terms of gas location and scattering geometry. Second, and even more importantly, the line-like excess is nearly coincident with one of the strongest features of the EPIC internal quiescent background, due to Al K fluorescence (e.g. Nevalainen et al., 2005).
We therefore believe that the 1.6-keV line is an artifact associated with an imperfect background subtraction or calibration inaccuracies (or a combination of the two). Such a conclusion is corroborated by the fact that a similar feature, although with lower significance, seems to be present also in the spectrum of LBQS 21384427 444The spectrum of J21424419 is too faint to appreciate this effect.. We finally note that, in the absence of a direct continuum, no sensible combination of reflected and scattered (e.g. Gupta et al., 2021, and references therein) emission can account for the observed spectral slope of J21424420, whose origin remains unclear. For completeness, we also analysed with the same approach the spectrum of LBQS 21384427. The X-ray properties of this source are similar to those of J21424420. The continuum is flat, with , yet this time the absorbed power-law model results in a marginal statistical improvement ( for ), suggesting a local column of cm-2.
| detida | RA | Dec | detmld | HST IDe | redshift | ||
|---|---|---|---|---|---|---|---|
| 108405501010054 | 325.617301 | 44.333479 | 2.26 0.23 | 15.10 1.97 | 232 | 20557 | 1.286 |
| 108405501010056 | 325.636933 | 44.296718 | 2.98 0.24 | 1.76 0.97 | 204 | 2764 | |
| 108405501010083 | 325.631084 | 44.352039 | 2.06 0.23 | 7.71 1.82 | 110 | 273 | |
| 108405501010091† | 325.607981 | 44.338811 | 1.57 0.20 | 3.21 1.08 | 79 | 20405 | 3.223 |
| 108405501010122 | 325.622778 | 44.313822 | 0.21 0.10 | 8.46 1.60 | 43 | 22682208 | 1.249 |
| 108405501010159 | 325.605758 | 44.307890 | 0.58 0.13 | 4.79 1.46 | 31 | 2604 | |
| 108405501010159 | 2606 | ||||||
| 108405501010159 | 2622 | ||||||
| 108405501010222†† | 325.593378 | 44.324168 | 0.47 0.13 | 0.35 0.44 | 7 | 1535 | 3.230 |
3.1 Source detection within and beyond the MUDF field
Given the presence of nearby point-like or extended (i.e. more than the XMM–Newton point spread function) emission structures in the MUDF, we searched for additional X-ray detections within the F140W/HST field of view. As the XMM–Newton field is far larger than the F140W/HST coverage, we extended this search to a distance of 10′ to provide a detection list that roughly matches the distance of the quasar LBQS 21384427 from the MUDF field. We considered the centre of the MUDF/HST field at the coordinates degrees and we cross-matched them with the 4XMM–DR12 source catalogue (Webb et al., 2020). 4XMM–DR12 is the fourth generation catalogue of serendipitous X-ray sources available online and contains 939,270 X-ray source detections (630,347 unique X-ray sources) made public on or before 2021 December 31555http://xmmssc.irap.omp.eu/Catalogue/4XMM-DR12/4XMM_DR12.html. The net sky area covered when accounting for overlaps between observations is 1283 deg2, for a net exposure time 1 ks. To define a reasonably clean sample, we have applied the following quality cuts from the 4XMM–DR12 catalogue: sum_flag3 (low level of spurious detections), and confused0 (low probability of being associated with two or more distinct sources)666For more details, the interested reader should refer to the 4XMM catalogue user guide at the following website http://xmmssc.irap.omp.eu/Catalogue/4XMM-DR12/4XMM-DR12_Catalogue_User_Guide.html.. For the cross-match between the HST/MUDF and the 4XMM catalogues, we considered the corrected RA and Dec listed in the 4XMM catalogue after the application of a statistical correlation of the emldetect coordinates with the USNO B1.0, 2MASS or SDSS (DR8) optical/IR source catalogues using the sas task catcorr (i.e. field rectification)777http://xmmssc.irap.omp.eu/3XMM-DR4/UserGuide_xmmcat.html#Astrom. Therefore, the centroid is not necessarily the same as the one defined by the X-ray peak flux. This is also consistent with the source extraction performed by hand, as we considered the optical coordinates since the X-ray data are such that we cannot clearly identify the X-ray source position. The above search led to a sample of 119 X-ray detections, about 80% of which are flagged as “good” (94 detections with sum_flag=0, i.e. no warnings raised in any of the EPIC bands), whilst the remaining 25 detections have at least one warning flag raised, although the detection is considered reliable.
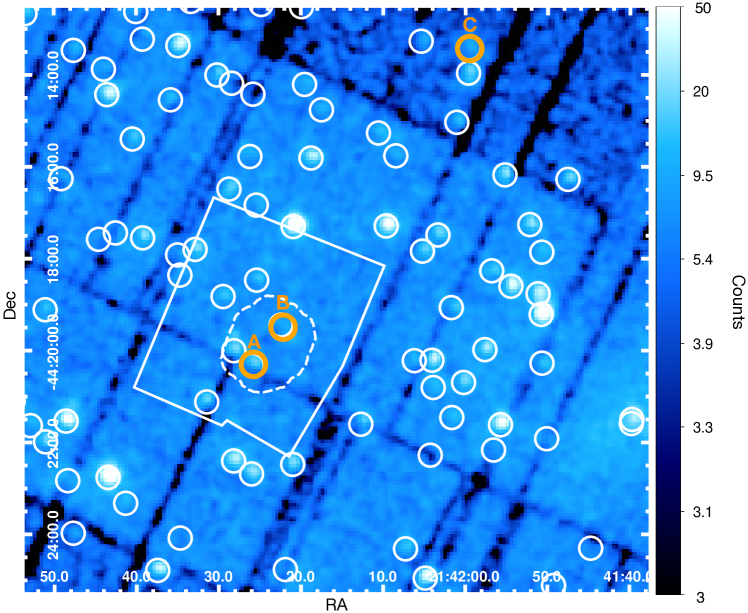
Inside the MUDF/HST field we found seven detections (see Figure 3), three of which fall within the narrower MUSE field: J21424420 and J21424419 (although the identification with the latter is more controversial, see below), and a lower redshift quasar at (cyan cross in Figure 8 by Fossati et al. 2019), which lies close to the edge of the MUSE FoV in close spatial proximity to a galaxy group (see Section 6.2 in Fossati et al. 2019 for more details). The low number of detected sources within the field is expected given the poorer XMM–Newton angular resolution (6 arcsec FWHM, or equivalently 15 arcsec half-energy width) as compared to HST.
Table 2 summarises the properties of the seven X-ray detected sources within the HST field: the unique number (detid), which identifies a detection as listed in the 4XMM–DR12 catalogue (column 1); RA and Dec relative to the X-ray position (columns 2 and 3); the observed flux with uncertainties in the 0.5–2 keV band (column 4), computed as the sum of the EPIC 0.5–1 and 1–2 keV energy bands (flagged in the catalogue as band 2 and 3, respectively); the observed flux with uncertainties in the 2–12 keV band (column 5), computed as the sum of the EPIC 2–4.5 and 4.5–12 keV energy bands (flagged in the catalogue as band 4 and 5, respectively); the EPIC detection maximum likelihood (ep_8_det_ml) value in the 0.2–12.0 keV band (column 6). We also included the HST catalogue IDs (column 7) for objects covered by the F140W and the redshift (column 8).
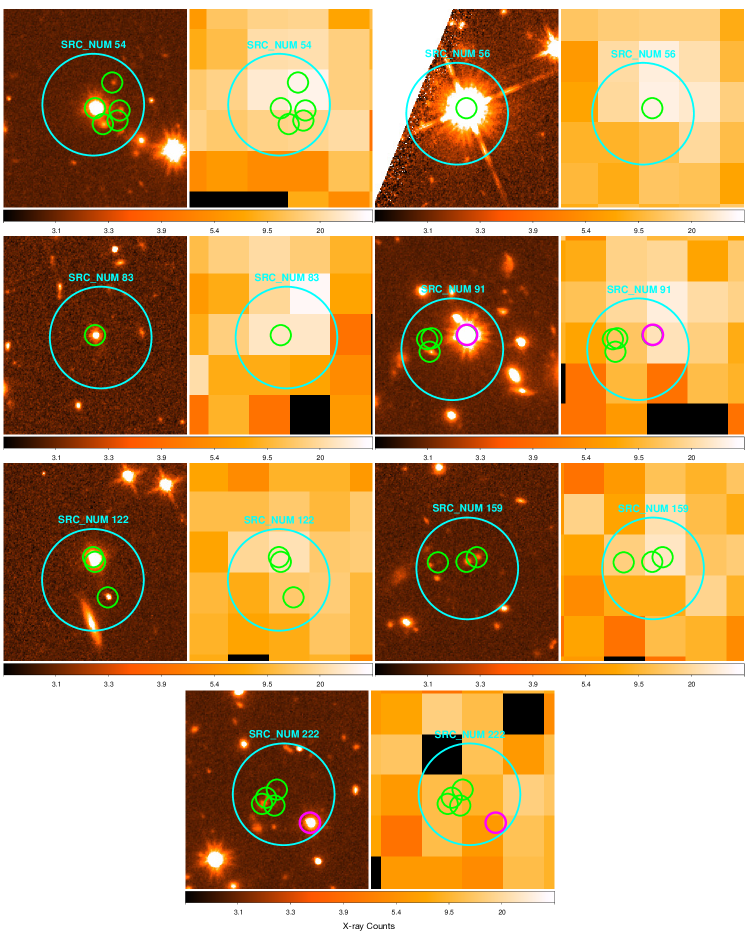
Of the seven X-ray detections within the HST field, only two have a single HST counterpart within from the XMM–Newton location, i.e. src_num888The src_num represents the (decimal) source number in the individual source list for the relative XMM–Newton observation (i.e. the last digits of detid).=56 and 83 (see Figure 4). We do not have any spectral coverage for these two objects. src_num=83 shows slightly extended emission as well as faint, possibly offset emission in F336W, so it could be either a star or another AGN, but the correct classification requires additional spectroscopy. The object with src_num=56, located at the extreme edge of the F140W coverage, is a foreground Milky Way star (probably a Wolf-Rayet). Counterparts for the X-ray detections flagged with src_num=54, 91, 222 and 122 are, with different degrees of confidence, the quasar in close spatial proximity to a galaxy group, J21424420, J21424419, and another quasar, respectively, although the emission of the latter is closely blended with another HST object (HST ID=2208). In particular, the association of src_num=222 with J21424419 is not straightforward, as several other optically detected sources lie closer to the coordinates of the X-ray detection. We recall that the spectral extraction region of radius definitely encompasses any X-ray emission from J21424419, but it possibly includes also some contribution from these nearby objects. We therefore conclude that the X-ray fluxes we have derived for J21424419 from the spectral analysis, despite being already anomalously low, should be likely treated as upper limits. Depending on the actual level of contamination to its spectrum (Fig. 5), we cannot even exclude that J21424419 is heavily obscured in the X-rays. Sub-arcsecond accurate X-ray positions would be required to clarify this issue but, to date, no Chandra observations of the MUDF exist. Also for the remaining detection (src_num=159), there is ambiguity on the most probable counterpart.
As a consistency check, we compared the flux values obtained for J21424420 and J21424419 from the spectral analysis with the catalogued ones. Based on the best-fit power-law model of J21424420 (Table 1), we obtain a flux of erg s-1 cm-2 with statistical 1 uncertainty of 18% over the 0.3–7 keV band, whilst we have erg s-1 cm-2 with 1 uncertainty of 30% for J21424419. These spectral fluxes are larger by factors of 1.5 (J21424420) and 1.1 (J21424419) than the catalogued values relative to the full EPIC band (0.2–12 keV, band 8). Given the large uncertainties, for J21424419 the agreement remains good (i.e., within 1) even after extrapolating the flux computed through our spectral analysis to the 0.2–12 keV EPIC band. For J21424420, instead, there is a formal inconsistency at the 2.2 level with respect to the 4XMM catalogue, almost entirely arising above 2 keV. There are several possible explanations to alleviate this apparent discrepancy. Although we performed the spectral fits over the 0.3–7 keV energy range, almost no counts are detected beyond 5 keV for both quasars. Therefore, extrapolating the best-fit power law at higher energies (especially for a very flat as found for J21424420) clearly leads to an overestimate of the hard-band flux. On the other hand, the catalogued band-8 fluxes for all the X-ray detected objects assume a fixed power-law source spectrum (; Webb et al., 2020) irrespective of the actual broadband spectral shape. The EPIC total-band flux is then computed as the weighted average between the three detectors. This procedure, however, can introduce some systematic uncertainty at low fluxes. Indeed, the band-8 flux of J21424420 derived from the pn image is more than two times larger than those obtained from the MOS ones. This difference is entirely due to band 5 (4.5–12 keV), where no source counts are detected by either MOS camera, for a nominal zero flux. This brings down the combined EPIC band-5 (hence band-8) flux of J21424420. Incidentally, the catalogued band-8 pn flux for this quasar is erg s-1 cm-2, which is broadly consistent with our spectral estimate.
We finally note that, for a simple pivot effect, the above hard-band-related systematics have little impact on the determination of the monochromatic flux at rest-frame 2 keV. In fact, the fit anchors the continuum power law to the soft band, where most of the counts are found, so that the 2-keV flux is barely sensitive to the actual spectral slope. If anything, if we were to adopt the broadband 4XMM fluxes as reference, both quasars would be even fainter in the X-rays than assumed in the following discussion, so our main results are completely unaffected.
4 Ultraviolet spectral analysis
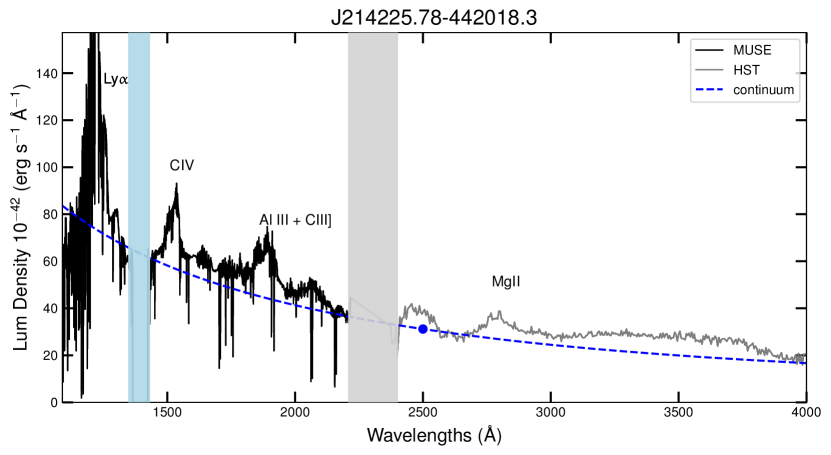
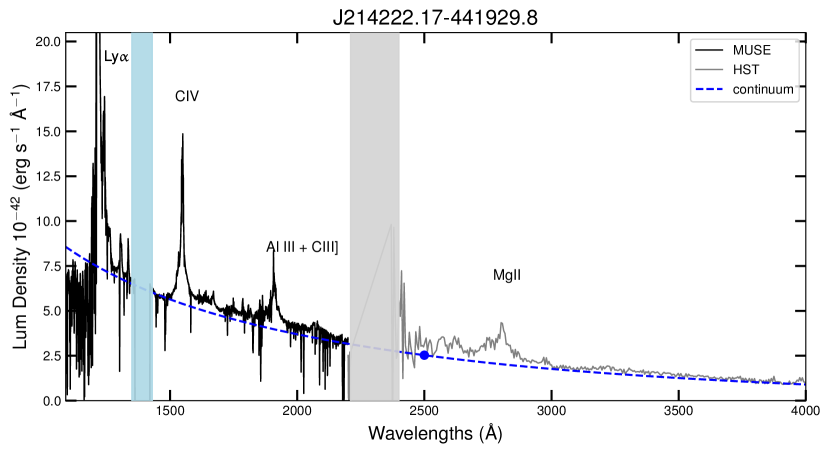
The MUSE and HST spectra are fitted by using the publicly available package for spectral fitting QSFit (Calderone et al., 2017). The observed emission lines in quasar spectra are reproduced by a broad (FWHM 2,000 km s-1) profile and, when required, an additional narrow component (FWHM 2,000 km s-1) is included, whilst the continuum considers contributions from both the iron UV complex and the nuclear ionising continuum (i.e. disc emission). To improve the residuals, we also considered a set of “unknown” emission lines, i.e. emission not associated with any known line (see Section 2.7 in Calderone et al. 2017). These components account for the lack of an iron template in the wavelength range 3100–-3500 Å, or for possible asymmetric profiles in known emission lines. The spectra were corrected for Galactic extinction by using the value of 0.017 from Schlafly & Finkbeiner (2011) and the parametrisation by Cardelli et al. (1989) and O’Donnell (1994), with a total to selective extinction parameter 3.1 (Calderone et al., 2017).
At rest-frame wavelengths bluer than Å, absorption from intergalactic H i attenuates the quasar flux, both in the Lyman series, and in the Lyman continuum (e.g. Prochaska et al., 2009). A correction for IGM absorption is thus required to properly retrieve both the Ly and the continuum emission (e.g. Lusso et al., 2015). We also have a gap in the range 1362–1421 Å due to the blocking filter that avoids the light of the sodium laser of the adaptive optics system. Therefore, to perform the spectral fit, we conservatively neglected all the wavelengths shorter than 1450 Å at rest in the MUSE data.
The first few hundred angstroms of the HST spectrum are also neglected, as the extreme blue edge of the detector has some artifacts that produce erratic changes at the shortest wavelengths (i.e. around 2500 Å, see Figure 5).
Regarding the flux calibration, the MUSE detector has been extremely well calibrated over the last several years. Data have an absolute flux calibration accuracy of 5–10% per single exposure, leading to uncertainties of a few per cent (dominated by systematics) on the final co-addition of several hundred exposures. Therefore, we adopted the MUSE data as a reference to match the HST spectra. On average, the HST and MUSE data are both well matched for all the sources observed in the MUDF, with flux differences within . Given the very few emission-line free windows in the HST data, we prefer to adopt the same slope of the MUSE spectra for the HST data, although the slopes agree within uncertainties when fitted separately. Moreover, the MUSE and HST continuum level was the same in the case of the brighter quasar, whilst an offset was applied to the HST data of J21424419 to better match the underlying MUSE continuum. This offset is nonetheless very small, less than a factor of 1.2 in flux. Figure 5 presents the MUSE and HST spectra of the two quasars in the MUDF. Missing data in the MUSE spectrum are marked with a cyan shaded region. Grey shaded regions mask the gap between the MUSE and the HST spectra. The best-fit nuclear continuum is shown with the blue dashed line ( and for J21424420 and J21424419, respectively), whilst the blue point refers to the rest-frame continuum luminosity at 2500 Å.
5 Results and Discussion
Figure 6 shows the rest-frame monochromatic luminosity against for the two quasars in the MUDF. The blue arrow is the X-ray flux for J21424420 when an intrinsic column density and a fixed are assumed. We recall that the latter spectral fit is statistically worse than the case where no intrinsic absorption is allowed for (see Section 3 for details), yet we adopt the resulting X-ray flux as a conservative upper limit. Likewise, the flux of J21424419 should be likely considered as an upper limit due to the possible contamination from nearby objects (Section 3.1). Figure 6 also shows the sample of quasars from Lusso et al. (2020), with the relative best-fit regression line (with a slope 0.667 0.007 and intercept 6.25 0.23) for comparison. The dashed lines trace the 1 dispersion, 0.24 dex. The Lusso et al. (2020) sample is composed by 2,421 optically-selected quasars (the majority from SDSS) with X-ray data from XMM–Newton and Chandra, and it spans a redshift range 0.01 7.54, with a mean (median) redshift of 1.4 (1.3). These sources were selected to represent typical quasars, thus to have minimal host-galaxy contamination (especially important for the 0.7 AGN) and minimal gas and dust absorption. The Eddington bias is also taken into account. Details about the sample selection are provided in their Section 5.
From an observational perspective, the relationship provides a robust estimate of the quasar expected X-ray luminosity for any given UV luminosity, thus determining the range of soft X-ray emission for typical (i.e., non-broad absorption line, non-jetted, with minimal dust and gas absorption) quasars or, vice-versa, pinpointing peculiar objects (e.g. X-ray weak, with strong radio jets, or extremely red). Physically, this relation indicates a strong link between the accretion disc (emitting in the UV) and the X-ray corona (e.g. Tananbaum et al., 1979; Zamorani et al., 1981; Vignali et al., 2003; Steffen et al., 2006; Just et al., 2007; Lusso et al., 2010; Martocchia et al., 2017). This non-linear correlation is tight ( 0.24 dex of scatter; Lusso & Risaliti, 2016), with a slope independent of redshift, suggesting that the connection between the disc and the corona must exist in AGN across cosmic time (e.g. Nicastro, 2000; Merloni, 2003; Lusso & Risaliti, 2017; Arcodia et al., 2019).
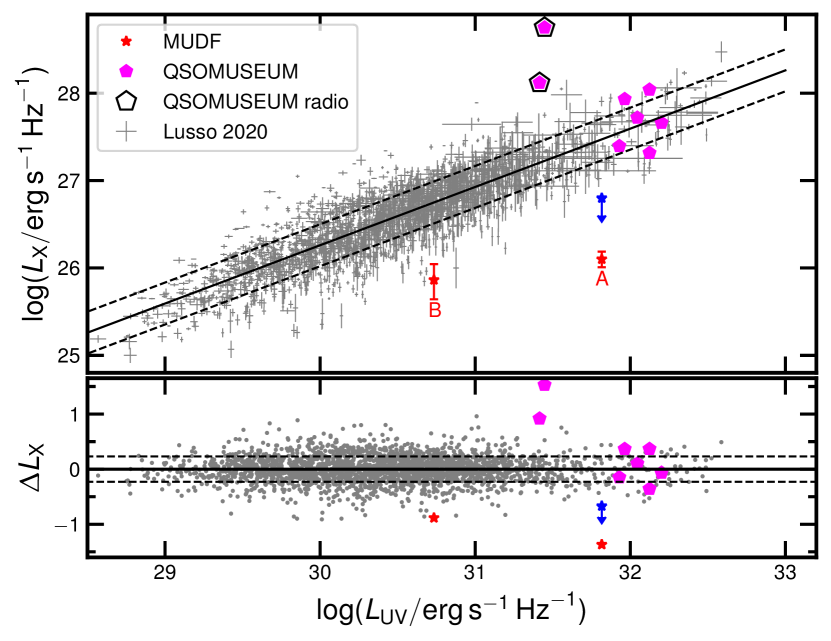
Both J21424420 and J21424419 deviate from the relation, with faint X-rays with respect to quasars at similar UV luminosities. This is even more striking for J21424420, whose X-ray emission lies at 3 below the relation. This source shows an X-ray bahaviour similar to the X-ray weak quasars at published by Nardini et al. (2019), who discovered that 25% of the quasars in their sample present an X-ray emission much weaker than expected, by factors of 3 or higher. Such an X-ray weak fraction is significantly larger than those previously reported for radio-quiet, non-broad absorption line (BAL) quasars at lower redshift and luminosity ( 8%, e.g. Gibson et al. 2008; Pu et al. 2020, see also Timlin et al. 2020a). Their X-ray weak quasars display a flat photon index () with no clear evidence of X-ray absorption in the XMM–Newton spectra. The expected fluxes at rest-frame 2 keV, if the MUDF quasars were to follow the relationship published by Lusso et al. (2020), are listed in Table 1. The observed X-ray fluxes at 2 keV are fainter by a factor of 23.5 and 7.6 than the expectations for J21424420 and J21424419, respectively.
We also included in Figure 6 all quasars within the QSO MUSEUM survey (Arrigoni Battaia et al., 2019a) with an X-ray observation available. The QSO MUSEUM (Quasar Snapshot Observations with MUse: Search for Extended Ultraviolet eMission) sample consists of 61 quasars at (median redshift ) with absolute band magnitude normalized at (Ross et al., 2013) in the range and different strengths of radio emission. All these quasars have been observed with MUSE to characterise the physical properties of the CGM and IGM in emission (chiefly through the Ly transition) associated to these bright quasars.
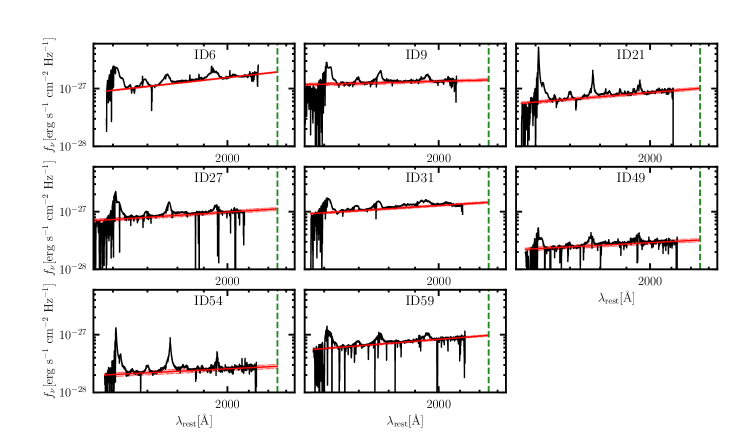
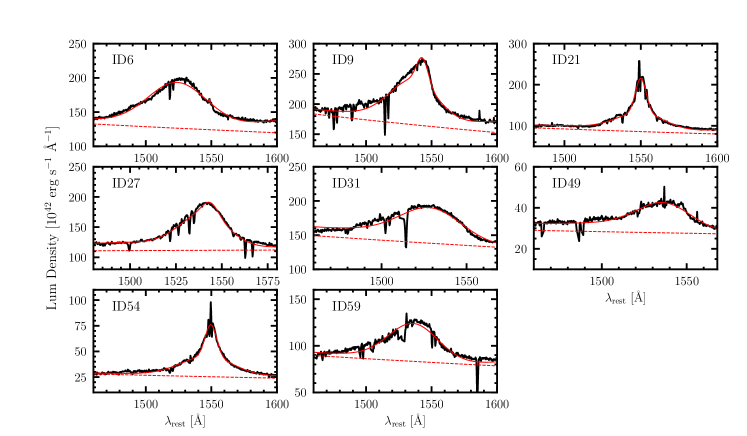
We have searched for any X-ray observations (either pointed or serendipitous) of all the QSO MUSEUM sources in the XMM–Newton and Chandra archives. Besides J21424420 and LBQS 21384427, which are also part of the sample, we found other eight objects with publicly available X-ray data. Two sources belong to the Nardini et al. (2019) sample, and are not re-analysed here. For the remaining six quasars, we retrieved and reduced the archival data with the standard procedures, and analysed the extracted spectra as described in Section 3. More details on the targets and on the observations are provided in Appendix A. Their rest-frame luminosities at 2500 Å are computed from the extrapolation of the continuum best fit of the MUSE spectra with a similar methodology as discussed in Section 4 (no HST data are available for this sample).
The majority of quasars lie in agreement with the relation. ID49 and ID54 are bright radio sources, therefore their X-ray emission includes an additional synchrotron component due to the radio jet. Only J21424420 (i.e. ID22) and J21424419 appear to be X-ray weak, leading to an X-ray weak fraction of 20%, which raises to 25% if we exclude the radio-bright quasars. Given the current data, we thus conclude that the fact that both quasars in the MUDF are X-ray weak is likely to be serendipitous and mostly driven by the higher probability to observe an X-ray weak quasar at these redshifts.
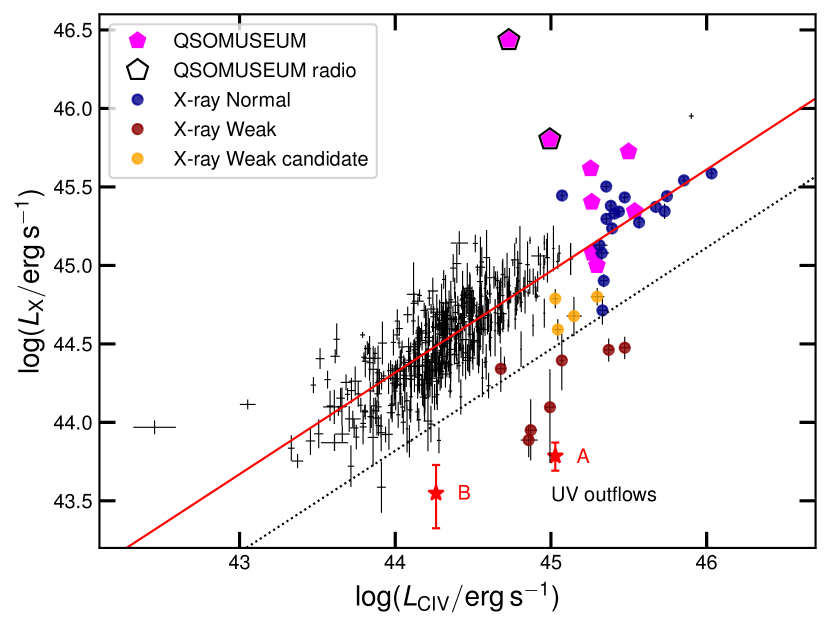
The MUDF quasars are located in the lower right corner of the plane, as shown in Figure 7, consistently to what is observed by Nardini et al. (2019) and Lusso et al. (2021) in their X-ray weak quasar sample. By analysing the properties of the high-ionisation C iv 1549 broad emission line in connection with the X-ray emission, Lusso et al. (2021) observed a tight correlation (with a slope of 0.6470.001 and an observed dispersion of dex), between the X-ray luminosity at rest-frame keV and the total integrated C iv line luminosity (see their Figure 14), in a sample of 1,800 quasars. Their sample was selected to fulfil all the quality criteria discussed by Lusso et al. (2020), thus non-broad absorption line, non-jetted, with minimal deviation due to absorption at both UV and X-rays, so it is representative of typical blue quasars in the redshift range . The observed relation implies a strong link between the relative strength of the X-rays with respect to both the UV continuum and the C iv line emission (see their Figure 15, their Section 4.5 and relative discussion for more details). Trefoloni et al. (2023, see also ) argue that X-ray weakness could also be interpreted in a starved X-ray corona picture, connected with an ongoing wind phase that may extend to kpc scales (e.g. Bischetti et al. 2017; Vietri et al. 2018; Zappacosta et al. 2020; Temple et al. 2023, and references therein). If the wind is ejected in the vicinity of the black hole, the UV light that reaches the corona will be depleted, depriving the corona of seed photons and eventually generating an X-ray weak quasar. Yet, in the quasar luminosity regime, there will still be an ample reservoir of ionising photons that produce the C iv emission observed in the X-ray weak quasars with respect to typical sources of similar X-ray luminosities (see Section 5 in Lusso et al. 2021).
We also note that the MUDF is not covered by any radio facility, at present. We searched in the FIRST, NVSS, ALMA, NRAO (EVLA, GBT, GMVA, VLA, VLBA), and LOFAR archives finding no matches, so we do not have any information regarding whether MUDF quasars are radio bright or not. Radio data may help in the interpretation of the X-ray data, since synchrotron emission may emit at X-ray energies as well (see e.g. Page et al., 2005; Zhu et al., 2020). Yet, since both MUDF quasars are X-ray weak, we may guess that they are also radio quiet, even accounting for possible X-ray variability. While possible X-ray obscuration of the coronal emission can occur at circumnuclear scales (broad line region and/or torus), a Compton-thick column at host-galaxy scales would be required to fully absorb the emission of an extended jet, which seems highly unlikely.
Summarising, we found that both MUDF quasars are intrinsically X-ray underluminous with respect to typical quasars at similar UV and C iv luminosities and redshifts. We do not know whether extreme X-ray variability (e.g. Timlin et al. 2020b) may play a role, as multiple X-ray observations are not available, but this is very unlikely to occur in phase for both sources. We cannot thus exclude that the observed, simultaneous X-ray deficit could have instead a causal, common physical origin for both MUDF quasars. This might be related to the SMBH growth history (i.e. duty cycle), the environment, and/or the small-scale accretion physics of the two quasars, but we cannot investigate these scenarios any further at this stage, until more data are collected (e.g. deeper X-ray and radio observations). Nonetheless, we found consistent results with previous works in the literature that observed a high fraction (%) of X-ray weak quasars at (e.g. Nardini et al., 2019; Zappacosta et al., 2020; Lusso et al., 2021) with respect to lower redshift AGN samples (%, see e.g. Gibson et al. 2008; Pu et al. 2020; Timlin et al. 2020a). These works point towards a high incidence of outflowing gas in the X-ray weak population with respect to the X-ray normal one at high redshifts. Alternatively to starving the corona, such outflows could also provide an additional source of X-ray obscuration (e.g. Huang et al. 2023), although absorption does not clearly emerge from our spectral analysis.
5.1 The nebula-quasar connection
Mackenzie et al. (2021) found a statistically significant correlation between the surface brightness (SB) of the nebula observed in Ly emission at the redshift of quasars and the luminosity of the quasar in both UV continuum and Ly. Specifically, they observed that fainter quasars in the UV have on average smaller, less-luminous nebulae, with lower outer SBs (see their Figure 6). They defined the size of a nebula as the largest projected distance (maximum extent) between pixels within the 3D mask of the optimally extracted MUSE images. This mask comprises all the voxels (volume pixels) identified as part of the Ly nebulae, which is then used to define the size and properties of the nebulae (see their Section 3.1 for more details). This definition represents a good metric of the morphology of the nebulae only if the asymmetry in the extended Ly emission is limited, which is often not the case (see e.g. Borisova et al., 2016; Arrigoni Battaia et al., 2016).
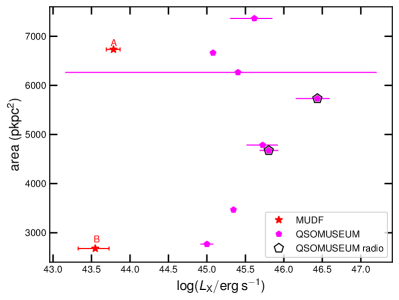
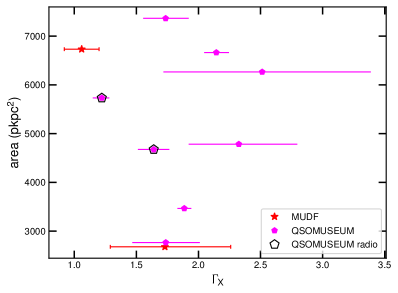
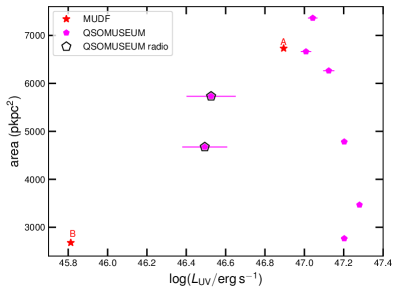
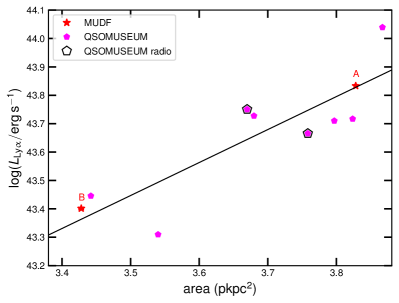
To quantify the scale of the nebulae, here we computed the area of the extended Ly emission as the sum of pixels above a given Ly SB level, which is less sensitive to possible asymmetries of the nebulae. To define a common SB value for both the MUDF and QSO MUSEUM datasets, we considered the shallowest MUSE datacube (i.e. ID21), finding a SB of erg s-1 cm-2 arcsec-2 (at the statistical level) at , which we consider as a reference (). We then corrected this value for the cosmological dimming as . For the bright MUDF quasar, J21424420, we obtain 114 arcsec2, which translates into 6732 proper kpc2 (with a conversion of kpc per arcsec at ). For J21424419, we obtain 45 arcsec2, or equivalently 2679 proper kpc2. This value may be slightly underestimated because of the presence of a bright star to the South of the nebula. Figures 8 and 9 present the area of the extended Ly emission as a function of the nuclear luminosity at rest-frame 2 keV and 2500 Å. We do not observe any statistically significant correlation of the area with either of these two luminosities: small and large nebulae are equally distributed within a similar range of nuclear ionising powers. The absence of a trend between area and nuclear luminosity is also confirmed if we exclude the X-ray weak and the two radio bright quasars. The area of the nebulae is also not correlated with the X-ray photon index, as shown in the upper right panel of Figure 8.
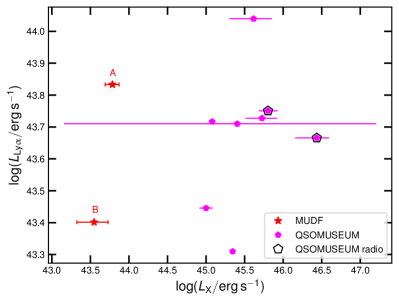
For completeness, we also considered whether there is any trend between the Ly emission of the nebulae () and the quasar rest-frame 2 keV luminosity, but we found none (Figure 8). The luminosity values for the extended Ly emission have been taken directly from the relevant papers (i.e., Table 1 in Lusso et al. 2019b and Table 2 in Arrigoni Battaia et al. 2019a). For the MUDF data, even if the field has now reached a much deeper MUSE exposure than that considered in the original work, the extended emission at the edge of the SB tails is negligible with respect to the total one. Therefore, the values for have not changed significantly even considering the deeper data. The values for the QSO MUSEUM sample have been computed by employing much shallower data instead. For the quasar in common between the MUDF and QSO MUSEUM (ID22, i.e., J21424420), the value in the latter analysis is higher by a factor of (in flux) than the one reported in Lusso et al. (2019b). This 0.2 dex difference is likely caused by the fact that, to identify the Ly extended emission around the quasars, in the QSO MUSEUM analysis a minimum “volume” of 1000 connected voxels above S/N 2 was considered, against 2500 connected voxels at S/N 2.5 in Lusso et al. (2019b). This implies that some noise could be included in the QSO MUSEUM flux measurements, but changing the thresholds would just introduce a systematic shift that does not change the main result, that is the absence of a trend between and . Finally, Figure 9 also shows the integrated emission of the nebulae as a function of their area. These two quantities are correlated, with the area increasing with increasing Ly emission, in broad agreement with what found by Mackenzie et al. (2021). The best fit regression line is
| (1) |
with a dispersion of 0.12 dex. The observed relation is in agreement with what found by Arrigoni Battaia et al. (2023, see their Table 1 for the resulting relationships with the physical area), who argue that host-galaxy inclination could be the main driver for the shape of the nebulae and their brightness, and thus for the relation itself (see their Section 5).
Overall, our results are qualitatively at odds with the interpretation by Mackenzie et al. (2021) that the quasar ionising power is the main driver of the nebulae properties (i.e. luminosity and size; see also Cen & Zheng 2013). Yet, given all the caveats discussed above, we caution that a one-to-one comparison of the sizes and areas with the luminosities measured in MUDF and QSO MUSEUM datacubes and other studies is not straightforward, because of the different sensitivity limits, techniques, and definition of the extent of the diffuse Ly emission. Additionally, the geometry of the host galaxy may also play a role (edge-on versus face-on), giving rise to different nebular morphologies (e.g. Costa et al., 2022; Arrigoni Battaia et al., 2023; Cen & Zheng, 2013). The absence of any correlation between the quasar and the nebular properties (if confirmed with larger samples), combined with the fact that there is a tight correlation between the emission of the nebulae and their size, imply that the main drivers the extent of the nebulae could be host galaxy inclination and the physical properties of the environment, such as its density and radiation (assuming the emission is due to photoionization and perhaps scattering). Whilst the quasars provide the main reservoir of ionising photons (see the discussion in Section 4.1 in Mackenzie et al. 2021) that ultimately powers the nebulae, our results suggest that the actual extent of the diffuse emission and its morphology (e.g. asymmetries) seem to be the result of scattering processes in the CGM (e.g. Arrigoni Battaia et al., 2019a; Costa et al., 2022). As the fraction of X-ray emission to optical/UV is less than 1% for both J21424420 and J21424419 (see appendix C), this implies that the X-ray emission is not contributing significantly to the overall photon budget. We caution, however, that this fraction is computed by assuming that the X-ray emission that illuminates the Ly nebulae of the MUDF quasars is the same as observed.
6 Conclusions
We present XMM–Newton observations of the MUSE Ultra Deep Field (MUDF), a unique region of the sky that hosts two quasars at with close separation ( kpc). Observations at high energy characterise the innermost region of these quasars with physically associated extended Ly nebulae, and provide imaging the MUDF and the environment of this pair at much larger scales than those covered by either MUSE or HST. Thus, MUSE+XMM–Newton observations represent the first view of the assembly of a potentially massive overdensity. We searched for additional X-ray detections within the F140W/HST field of view around the MUDF. We extended this search to a distance of 10′ to provide a detection list that roughly matches the distance of the third quasar LBQS 21384427. We find 119 X-ray detections, with seven detections inside the MUDF/HST field. The three already known quasars (i.e., J21424420, J21424419, and a lower redshift quasar in close spatial proximity to a foreground galaxy group) within the MUSE coverage are all detected. These sources are the only ones detected within the MUSE footprint. For the additional sources in the HST field, only one has an ambiguous counterpart (src_num=159), for which a sub-arcsecond accurate X-ray position is required. Given the richness of the HST field, the Chandra sub-arcsecond spatial resolution and low background are essential to further disentangle multiple sources that are blurred in the large XMM–Newton point-spread function.
We find that both quasars in the MUDF are X-ray weak, outliers of the relation, with a C iv line emission in agreement with other X-ray weak quasars in the literature at and matching UV luminosities. This result is compatible with the higher probability to observe an X-ray weak quasar at these redshifts, as suggested by previous works analysing quasar samples at similar redshift and UV luminosities (e.g. Nardini et al., 2019; Zappacosta et al., 2020), and it might be interpreted in a starved X-ray corona scheme associated with an ongoing wind phase. If the wind starts off in the vicinity of the super massive black hole, the accretion rate – and thus the UV light that reaches the X-ray corona – will diminish, depriving the hot coronal plasma of seed photons and resulting in an X-ray weak quasar. Yet, at high UV luminosities there will still be sufficient ionising photons to produce a strong C iv line emission as detected in X-ray weak quasars, which have higher compared to normal quasars at similar X-ray luminosities (Lusso et al., 2021; Trefoloni et al., 2023).
We do not observe any trend between the area of the Ly nebulae and nuclear luminosities at either the rest-frame 2 keV or 2500 Å. The area of the nebulae does not correlated with the X-ray photon index nor with the integrated band flux in the hard band (2–10 keV). Quasars with similar luminosities can have very diverse Ly areas. The absence of a relation between the extent of the nebula and the quasar ionising power is at variance with what is observed by Mackenzie et al. (2021), who found a correlation between the size of the nebula (defined as the maximum extent) and the luminosity of the quasar in both UV continuum and Ly. We also do not find any statistically significant trend between and . Finally, the MUDF quasars are in agreement with the relation between the integrated emission of the nebulae and their area recently published by Arrigoni Battaia et al. (2023), suggesting that host-galaxy inclination could be amongst the main drivers for the morphology and brightness of the nebulae. However, a direct comparison of the sizes and areas with luminosities between different studies is challenging, due to e.g. different sample statistics, sensitivity limits, techniques, and definition of the extent of the diffuse Ly emission). Our findings, if confirmed with larger samples, suggest that the nebular morphology is mainly driven by the physical properties of the environment in the host galaxy (e.g. geometry, density, temperature, column density, and filling factor or clumpiness), rather than the quasar power.
Acknowledgements
We thank the anonymous reviewer for their thorough reading and for useful comments and suggestions that have improved the clarity of the paper. E.L. acknowledges the support by the Fondazione Cassa di Risparmio Firenze (grant No 45780). S.C. acknowledges financial support of the Italian Ministry of Education, University, and Research with PRIN 201278X4FL and the “Progetti Premiali” funding scheme. P.D. acknowledges support from the NWO grant 016.VIDI.189.162 (“ODIN") and from the European Commission’s and University of Groningen’s CO-FUND Rosalind Franklin program. Based on observations with the NASA/ESA Hubble Space Telescope obtained from the MAST Data Archive at the Space Telescope Science Institute, which is operated by the Association of Universities for Research in Astronomy, Incorporated, under NASA contract NAS5-26555. Support for program numbers 15637 and 15968 was provided through a grant from the STScI under NASA contract NAS5-26555. These observations are associated with program numbers 6631, 15637, and 15968. The MUSE portion of this project has received funding from the European Research Council (ERC) under the European Union’s Horizon 2020 research and innovation programme (grant agreement No 757535) and by Fondazione Cariplo (grant No 2018-2329).
Data Availability
Raw X-ray data are available via the XMM–Newton Science Archive (XSA). The processed HST and XMM–Newton observations are available at https://archive.stsci.edu/hlsp/mudf:(doi:10.17909/81fp-2g44).
References
- Anderson et al. (2014) Anderson L., et al., 2014, MNRAS, 441, 24
- Arcodia et al. (2019) Arcodia R., Merloni A., Nandra K., Ponti G., 2019, A&A, 628, A135
- Arnaud (1996) Arnaud K. A., 1996, in Jacoby G. H., Barnes J., eds, Astronomical Society of the Pacific Conference Series Vol. 101, Astronomical Data Analysis Software and Systems V. p. 17
- Arrigoni Battaia et al. (2016) Arrigoni Battaia F., Hennawi J. F., Cantalupo S., Prochaska J. X., 2016, ApJ, 829, 3
- Arrigoni Battaia et al. (2018) Arrigoni Battaia F., Prochaska J. X., Hennawi J. F., Obreja A., Buck T., Cantalupo S., Dutton A. A., Macciò A. V., 2018, MNRAS, 473, 3907
- Arrigoni Battaia et al. (2019a) Arrigoni Battaia F., Hennawi J. F., Prochaska J. X., Oñorbe J., Farina E. P., Cantalupo S., Lusso E., 2019a, MNRAS, 482, 3162
- Arrigoni Battaia et al. (2019b) Arrigoni Battaia F., et al., 2019b, A&A, 631, A18
- Arrigoni Battaia et al. (2023) Arrigoni Battaia F., Obreja A., Costa T., Farina E. P., Cai Z., 2023, arXiv e-prints, p. arXiv:2306.14334
- Bacon et al. (2010) Bacon R., et al., 2010, in Ground-based and Airborne Instrumentation for Astronomy III. p. 773508, doi:10.1117/12.856027
- Bacon et al. (2021) Bacon R., et al., 2021, A&A, 647, A107
- Basu-Zych & Scharf (2004) Basu-Zych A., Scharf C., 2004, ApJ, 615, L85
- Bischetti et al. (2017) Bischetti M., et al., 2017, A&A, 598, A122
- Bond et al. (1996) Bond J. R., Kofman L., Pogosyan D., 1996, Nature, 380, 603
- Borisova et al. (2016) Borisova E., et al., 2016, ApJ, 831, 39
- Cai et al. (2019) Cai Z., et al., 2019, ApJS, 245, 23
- Calderone et al. (2017) Calderone G., Nicastro L., Ghisellini G., Dotti M., Sbarrato T., Shankar F., Colpi M., 2017, MNRAS, 472, 4051
- Cantalupo (2017) Cantalupo S., 2017, in Fox A., Davé R., eds, Astrophysics and Space Science Library Vol. 430, Gas Accretion onto Galaxies. p. 195 (arXiv:1612.00491), doi:10.1007/978-3-319-52512-9_9
- Cantalupo et al. (2014) Cantalupo S., Arrigoni-Battaia F., Prochaska J. X., Hennawi J. F., Madau P., 2014, Nature, 506, 63
- Cardelli et al. (1989) Cardelli J. A., Clayton G. C., Mathis J. S., 1989, ApJ, 345, 245
- Cash (1979) Cash W., 1979, ApJ, 228, 939
- Cen & Zheng (2013) Cen R., Zheng Z., 2013, ApJ, 775, 112
- Chapman et al. (2001) Chapman S. C., Lewis G. F., Scott D., Richards E., Borys C., Steidel C. C., Adelberger K. L., Shapley A. E., 2001, ApJ, 548, L17
- Chapman et al. (2004) Chapman S. C., Scott D., Windhorst R. A., Frayer D. T., Borys C., Lewis G. F., Ivison R. J., 2004, ApJ, 606, 85
- Costa et al. (2022) Costa T., Arrigoni Battaia F., Farina E. P., Keating L. C., Rosdahl J., Kimm T., 2022, MNRAS, 517, 1767
- D’Odorico et al. (2002) D’Odorico V., Petitjean P., Cristiani S., 2002, A&A, 390, 13
- Dayal & Ferrara (2018) Dayal P., Ferrara A., 2018, Phys. Rep., 780, 1
- Dekker et al. (2000) Dekker H., D’Odorico S., Kaufer A., Delabre B., Kotzlowski H., 2000, in Iye M., Moorwood A. F., eds, Society of Photo-Optical Instrumentation Engineers (SPIE) Conference Series Vol. 4008, Optical and IR Telescope Instrumentation and Detectors. pp 534–545, doi:10.1117/12.395512
- Farina et al. (2019) Farina E. P., et al., 2019, ApJ, 887, 196
- Fossati et al. (2019) Fossati M., et al., 2019, MNRAS, 490, 1451
- Fossati et al. (2021) Fossati M., et al., 2021, MNRAS, 503, 3044
- Francis & Hewett (1993) Francis P. J., Hewett P. C., 1993, AJ, 105, 1633
- García et al. (2013) García J., Dauser T., Reynolds C. S., Kallman T. R., McClintock J. E., Wilms J., Eikmann W., 2013, ApJ, 768, 146
- Geach et al. (2005) Geach J. E., et al., 2005, MNRAS, 363, 1398
- Geach et al. (2009) Geach J. E., et al., 2009, ApJ, 700, 1
- Gibson et al. (2008) Gibson R. R., Brandt W. N., Schneider D. P., 2008, The Astrophysical Journal, 685, 773
- Gupta et al. (2021) Gupta K. K., et al., 2021, MNRAS, 504, 428
- HI4PI Collaboration et al. (2016) HI4PI Collaboration et al., 2016, A&A, 594, A116
- Hennawi et al. (2015) Hennawi J. F., Prochaska J. X., Cantalupo S., Arrigoni-Battaia F., 2015, Science, 348, 779
- Huang et al. (2023) Huang J., et al., 2023, ApJ, 950, 18
- Just et al. (2007) Just D. W., Brandt W. N., Shemmer O., Steffen A. T., Schneider D. P., Chartas G., Garmire G. P., 2007, ApJ, 665, 1004
- Kaastra (2017) Kaastra J. S., 2017, A&A, 605, A51
- Kawamuro et al. (2017) Kawamuro T., Schirmer M., Turner J. E. H., Davies R. L., Ichikawa K., 2017, ApJ, 848, 42
- Kusakabe et al. (2022) Kusakabe H., et al., 2022, A&A, 660, A44
- Leclercq et al. (2017) Leclercq F., et al., 2017, A&A, 608, A8
- Lehmer et al. (2009) Lehmer B. D., et al., 2009, ApJ, 691, 687
- Lilly et al. (1991) Lilly S. J., Cowie L. L., Gardner J. P., 1991, ApJ, 369, 79
- Lujan Niemeyer et al. (2022) Lujan Niemeyer M., et al., 2022, ApJ, 934, L26
- Lusso & Risaliti (2016) Lusso E., Risaliti G., 2016, ApJ, 819, 154
- Lusso & Risaliti (2017) Lusso E., Risaliti G., 2017, A&A, 602, A79
- Lusso et al. (2010) Lusso E., et al., 2010, A&A, 512, A34
- Lusso et al. (2013) Lusso E., et al., 2013, ApJ, 777, 86
- Lusso et al. (2015) Lusso E., Worseck G., Hennawi J. F., Prochaska J. X., Vignali C., Stern J., O’Meara J. M., 2015, MNRAS, 449, 4204
- Lusso et al. (2019a) Lusso E., et al., 2019a, MNRAS, 485, L62
- Lusso et al. (2019b) Lusso E., Piedipalumbo E., Risaliti G., Paolillo M., Bisogni S., Nardini E., Amati L., 2019b, A&A, 628, L4
- Lusso et al. (2020) Lusso E., et al., 2020, A&A, 642, A150
- Lusso et al. (2021) Lusso E., et al., 2021, A&A, 653, A158
- Mackenzie et al. (2021) Mackenzie R., et al., 2021, MNRAS, 502, 494
- Malavasi et al. (2020) Malavasi N., Aghanim N., Douspis M., Tanimura H., Bonjean V., 2020, A&A, 642, A19
- Martocchia et al. (2017) Martocchia S., et al., 2017, A&A, 608, A51
- Matsuda et al. (2004) Matsuda Y., et al., 2004, AJ, 128, 569
- McDonald et al. (2005) McDonald P., et al., 2005, ApJ, 635, 761
- Merloni (2003) Merloni A., 2003, MNRAS, 341, 1051
- Monson et al. (2023) Monson E. B., et al., 2023, ApJ, 951, 15
- Morrissey et al. (2018) Morrissey P., et al., 2018, ApJ, 864, 93
- Nardini et al. (2019) Nardini E., et al., 2019, A&A, 632, A109
- Nevalainen et al. (2005) Nevalainen J., Markevitch M., Lumb D., 2005, ApJ, 629, 172
- Nicastro (2000) Nicastro F., 2000, ApJ, 530, L65
- Nilsson et al. (2006) Nilsson K. K., Fynbo J. P. U., Møller P., Sommer-Larsen J., Ledoux C., 2006, A&A, 452, L23
- O’Donnell (1994) O’Donnell J. E., 1994, ApJ, 422, 158
- O’Sullivan et al. (2020) O’Sullivan D. B., Martin C., Matuszewski M., Hoadley K., Hamden E., Neill J. D., Lin Z., Parihar P., 2020, ApJ, 894, 3
- Page et al. (2005) Page K. L., Reeves J. N., O’Brien P. T., Turner M. J. L., 2005, MNRAS, 364, 195
- Prescott et al. (2015) Prescott M. K. M., Momcheva I., Brammer G. B., Fynbo J. P. U., Møller P., 2015, ApJ, 802, 32
- Prochaska et al. (2009) Prochaska J. X., Worseck G., O’Meara J. M., 2009, ApJ, 705, L113
- Pu et al. (2020) Pu X., Luo B., Brandt W. N., Timlin J. D., Liu H., Ni Q., Wu J., 2020, ApJ, 900, 141
- Reid et al. (2012) Reid B. A., et al., 2012, MNRAS, 426, 2719
- Revalski et al. (2023) Revalski M., et al., 2023, ApJS, 265, 40
- Ross et al. (2013) Ross N. P., et al., 2013, ApJ, 773, 14
- Sanderson et al. (2021) Sanderson K. N., Prescott M. K. M., Christensen L., Fynbo J., Møller P., 2021, ApJ, 923, 252
- Schirmer et al. (2016) Schirmer M., et al., 2016, MNRAS, 463, 1554
- Schlafly & Finkbeiner (2011) Schlafly E. F., Finkbeiner D. P., 2011, ApJ, 737, 103
- Scott et al. (2011) Scott A. E., Stewart G. C., Mateos S., Alexand er D. M., Hutton S., Ward M. J., 2011, MNRAS, 417, 992
- Shang et al. (2011) Shang Z., et al., 2011, ApJS, 196, 2
- Steffen et al. (2006) Steffen A. T., Strateva I., Brandt W. N., Alexander D. M., Koekemoer A. M., Lehmer B. D., Schneider D. P., Vignali C., 2006, AJ, 131, 2826
- Steidel et al. (1998) Steidel C. C., Adelberger K. L., Dickinson M., Giavalisco M., Pettini M., Kellogg M., 1998, ApJ, 492, 428
- Steidel et al. (2001) Steidel C. C., Pettini M., Adelberger K. L., 2001, ApJ, 546, 665
- Strüder et al. (2001) Strüder L., et al., 2001, A&A, 365, L18
- Tananbaum et al. (1979) Tananbaum H., et al., 1979, ApJ, 234, L9
- Temple et al. (2023) Temple M. J., et al., 2023, MNRAS, 523, 646
- Timlin et al. (2020a) Timlin J. D., Brandt W. N., Ni Q., Luo B., Pu X., Schneider D. P., Vivek M., Yi W., 2020a, MNRAS, 492, 719
- Timlin et al. (2020b) Timlin John D. I., Brandt W. N., Zhu S., Liu H., Luo B., Ni Q., 2020b, MNRAS, 498, 4033
- Trefoloni et al. (2023) Trefoloni B., et al., 2023, arXiv e-prints, p. arXiv:2305.07699
- Turner et al. (2001) Turner M. J. L., et al., 2001, A&A, 365, L27
- Umehata et al. (2019) Umehata H., et al., 2019, Science, 366, 97
- Vietri et al. (2018) Vietri G., et al., 2018, A&A, 617, A81
- Vignali et al. (2003) Vignali C., Brandt W. N., Schneider D. P., 2003, AJ, 125, 433
- Webb et al. (2020) Webb N. A., et al., 2020, arXiv e-prints, p. arXiv:2007.02899
- Wisotzki et al. (2018) Wisotzki L., et al., 2018, Nature, 562, 229
- Young et al. (2009) Young M., Elvis M., Risaliti G., 2009, ApJS, 183, 17
- Zamorani et al. (1981) Zamorani G., et al., 1981, ApJ, 245, 357
- Zappacosta et al. (2020) Zappacosta L., et al., 2020, A&A, 635, L5
- Zhu et al. (2020) Zhu S. F., Brandt W. N., Luo B., Wu J., Xue Y. Q., Yang G., 2020, MNRAS, 496, 245
Appendix A X-ray observations of QSO MUSEUM
| Object | ID | b | Area | |||||
|---|---|---|---|---|---|---|---|---|
| erg s-1 cm-2 | erg s-1 Hz-1 | erg s-1 | pkpc2 | |||||
| QSO B01140857 | 3.204 | 31 | 55/65 | 2767 | ||||
| QSO B0537286 | 3.139 | 49 | 5757/6344 | 5732 | ||||
| 4598/4639 | ||||||||
| 404/425 | ||||||||
| SDSS J0947+1421 | 3.039 | 6 | 643/680 | 3467 | ||||
| QSO J0958+1202 | 3.306 | 9 | 8/21 | 4784 | ||||
| 7C 1013+2053 | 3.108 | 54 | 113/132 | 4675 | ||||
| LBQS 1244+1129 | 3.155 | 59 | 449/504 | 6663 | ||||
| CTQ 669 | 3.219 | 21 | 129/137 | 7364 | ||||
| QSO B2348404 | 3.332 | 27 | 11/15 | 6265 |
As mentioned in the main text, neglecting J21424420 and LBQS 21384427 (ID22 and ID23, respectively), other eight out of the 61 sources in the QSO MUSEUM sample (Arrigoni Battaia
et al., 2019a) have been observed in the X-rays by XMM–Newton and/or Chandra. We list below the observations that have been considered in this work. For each target, the key properties relevant to the present discussion, including those inferred from the X-ray analysis, are summarized in Table 3.
QSO B01140857 was serendipitously observed by Chandra on 2020 October 16 and two days later, for a cumulative exposure of 37.7 ks. The source lies about 3 arcmin off-axis, and the spectra were extracted from a circular region with radius of 5 arcsec. The analysis was carried out simultaneously on the two data sets, and the spectral fits were performed over the 0.6–6 keV band, where 74 net counts are collected.
QSO B0537286 was targeted several times, first by XMM–Newton on 2000 March 19, with net exposures of 19.4 ks for the pn and 38.8 ks for both MOS cameras. Another observation was performed on 2005 March 20. Neglecting a short snapshot on the same day, the on-source times are 31.8 ks, 51.0 ks, and 49.7 ks for pn, MOS1, and MOS2, respectively. The spectra were extracted from circular regions with radii of 35 (30) arcsec in the first (second) epoch for all the detectors. No exposure is affected by significant background flares, and about 31 and 45 kilo-counts are available over the entire 0.3–10 keV EPIC band. In between the two XMM–Newton visits, QSO B0537286 was also observed by Chandra on 2003 July 21 for 30 ks. The extraction region is 8 arcsec wide as the source is 5 arcmin away from the nominal aimpoint and PSF distortion effects are non negligible. The spectral analysis was performed over the 0.5–7 keV band, where 3600 counts are collected with a 0.1 per cent background level. In order to take into account the source variability, we considered in the plot the average flux of these three observations, whilst the error covers the min-to-max flux range.
SDSS J094734.19+142116.9 is part of the sample of luminous blue quasars at with pointed XMM–Newton observations discussed by Nardini
et al. (2019). The source was observed on 2017 April 28, with good-time exposures of 24.2 ks (pn), 30.1 ks (MOS1), and 30.0 ks (MOS2). Over 1,000 net counts were cumulatively obtained by the three EPIC detectors. The relevant X-ray properties have been directly retrieved from the spectral analysis of Nardini
et al. (2019). An earlier Chandra snapshot (1.6 ks) provides much looser constraints and is neglected.
QSO J0958+1202 can instead rely only on one such Chandra observation, performed on 2012 April 22. Despite the short exposure (1.6 ks), the source is robustly detected, with 21 counts at 0.5–7 keV within a radius of 3 arcsec (estimated background 0.06), allowing a basic spectral analysis.
7C 1013+2053 was observed by Chandra on 2018 January 24 for 10 ks. The spectrum was extracted from a circular region with radius of 3 arcsec, and the source and estimated background counts in the 0.5–7 keV band are, respectively, 205 and 0.4.
LBQS 1244+1129 is also included in the study by Nardini
et al. (2019), to which we refer for the details on the spectral analysis. The XMM–Newton observation took place on 2017 July 03, with exposures of 32.6 ks for the pn and 38.5 ks for both MOS cameras. About 560 source counts were collected at 0.5–8 keV.
CTQ 669 was serendipitously observed by XMM–Newton on 2011 October 11, with exposures of 8.8 ks for the pn and 11.5 ks for both MOS detectors. The spectra were extracted from circular regions with radius of 20 arcsec, with 112 source counts at 0.3–8 keV. The pn spectrum, however, turned out to be inconsistent with the two MOS ones in terms of intensity, being brighter by about a factor of 3. A similar effect is noticed also in the relative fluxes of the three EPIC instruments reported in the latest XMM–Newton catalogue (4XMM–DR12; Webb
et al., 2020) of serendipitous X-ray sources, and its origin is unclear. The observation is not affected by background flares, so a possible explanation could be the proximity of the target to the edge of the chip in the pn field of view, which might result in some problem with the effective-area correction in the auxiliary response file. We conservatively assumed the average flux of the pn and MOS observations, whilst the error is the half-difference between the two values.
QSO B2348404 was serendipitously observed by XMM–Newton on 2017 May 14, and is marginally detected in 4.4 ks only with the pn with 15 counts at 0.3–5 keV. The source is not detected with MOS1, and falls outside the MOS2 field of view.
Appendix B Ultraviolet observations of QSO MUSEUM
Appendix C Spectral energy distributions of the MUDF quasars
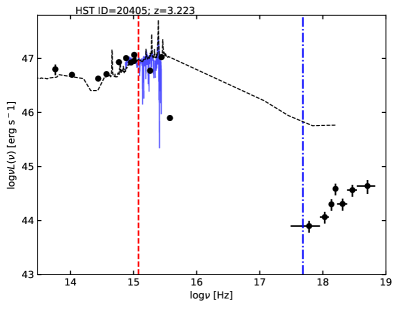
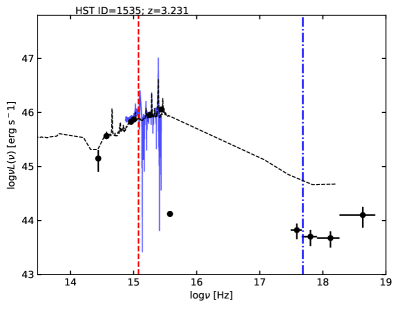
For completeness, we also compiled the broadband photometric SEDs, from the near-infrared to the X-rays, for the two MUDF quasars (Figure 12). J21424420 has a rather good photometric coverage, from the rest-frame near-infrared with WISE (with a S/N 3) and 2MASS, to the optical/UV with HST (F140W, F125W, F702W, F450W, F336W, see Revalski et al. 2023 for details), for a total of 12 photometric data points. J21424419 is instead detected in WISE/W1 and W2 (with a S/N 2) only, but not in 2MASS. Together with the HST photometry, the rest-frame near-infrared to optical/UV SED has 7 data points. The X-ray data are also included, which have been corrected for Galactic absorption. Following a simplified approach as in Lusso et al. (2013, see their Section 4.2), we computed the bolometric luminosity as the integrated emission from 1 m up to 1 keV999The monochromatic luminosity at the rest-frame energy of 1 keV is about erg s-1 for both quasars., as the quasar emission below and above this range is considered to be reprocessed. We find and erg s-1 for J21424420 and J21424419, respectively. As the rest-frame 2–10 keV luminosity is and for the brighter and the fainter quasar in MUDF, we obtain an X-ray-to-optical/UV ratio less than 1% for both sources, thus implying that the X-ray emission is a negligible fraction of the total one for the two MUDF quasars.