Dancing raisins: levitation and dynamics of bodies in supersaturated fluids
Abstract
A body immersed in a supersaturated fluid like carbonated water can accumulate a dynamic field of bubbles upon its surface. If the body is mobile, the attached bubbles can lift it upward against gravity, but arrival at a free surface can clean the body of these lifting agents and the body may plummet. The process then begins anew, and continues for as long as the concentration of gas in the fluid supports it. In this work, experiments using fixed and free immersed bodies reveal fundamental features of force development and gas escape. A continuum model which incorporates the dynamics of a surface buoyancy field is used to predict the ranges of body mass and size, and fluid properties, for which the system is most dynamic, and those for which body excursions are suppressed. Simulations are then used to probe systems which are dominated by a small number of large bubbles. Body rotations at the surface are found to be critical for driving periodic vertical motions of large bodies, which in turn can produce body wobbling, rolling, and damped surface ’bouncing’ dynamics.
I Introduction
A fluid containing dissolved gas may become supersaturated upon a rapid change in temperature or pressure, leading to bubble formation and eventual gas escape. This phenomenon is most commonly observed when opening a can of sparkling water, or other carbonated beverages. When the fluid is under sufficient pressure, gas accumulation is inhibited, preventing bubble formation Scriven (1959). Upon a rapid reduction of pressure, bubbles form on any containing or immersed surfaces, then detach and depart towards the free surface, leading to the eventual escape of the gas to the environment Barker et al. (2002); Zhang and Xu (2008); Liger-Belair et al. (2015). The coalescence of diffusively growing bubbles itself presents a classical modeling challenge Soto et al. (2018); Fardin et al. (2022), as is the process by which coalescing bubbles depart from a wall Lv et al. (2021); Iwata et al. (2022); Zhao et al. (2022); Hooshanginejad et al. (2022). See in particular the reviews by Liger-Belair Liger-Belair (2012) and Lohse Lohse (2018).
Supersaturated fluids also appear in geophysical settings. Explosive fragmentation of particulate matter in magma can lead to volcanic eruptions. A Strombolian eruption is caused by bubbles which coalesce into rising ‘gas slugs’, transporting gas and entraining magma flow towards the surface Gilbert and Sparks (1998); Lensky et al. (2004). Such liquids also appear in industrial processes like deacidification and fractionation of oils G. et al. (1991); Markom et al. (2001), and in biological settings (e.g. blood and tissues during decompression) Harvey et al. (1944); Papadopoulou et al. (2014). Large scale flows associated with bubble motion depend on the geometry of the container, and can result in peculiar downward bubble motion and even bubble waves and cascades in fluids from stout beers to magma Manga (1996); Robinson et al. (2008); Watamura et al. (2019).
When a free body is introduced into a supersaturated environment it presents new sites at which bubbles can nucleate and grow - a field of such bubbles on a body surface can result in surprising dynamics. Using nothing more than carbonated water and raisins (Fig. 1), periodic vertical body motions can be observed for nearly two hours, though the time between excursions slows considerably after the first 20 minutes (see Movie S1). This phenomenon has earned numerous playful names by a variety of fizziologists Planinsic (2004), from dancing raisins, to divers Cordry (1998); Derr et al. (2000) and fizz balls Moinester et al. (2012). Similar body oscillations can also be generated by reactions in chemical gardens Maselko et al. (2014); Wang and Steinbock (2023). Recently, this phenomenon has been investigated using peanuts and beer, based on a common practice in Argentinian drinking establishments Pereira et al. (2023). Different contact angles of individual attached bubbles show the importance of surface roughness on bubble formation Pereira et al. (2023). Such effects add to a growing list of fundamental scientific findings which have emerged from the kitchen Zenit and Rodríguez-Rodríguez (2018); Mathijssen et al. (2023).

In this paper we explore these oscillating dynamics using experiments, simulations, and theory. Experiments are used to measure the force development on a spherical body fixed in carbonated water, and its oscillatory dynamics when free. Using a discrete bubble model, and a continuum model which incorporates the dynamics of a surface buoyancy field, ranges of body and fluid properties are provided for which the system is most dynamic, and those for which body excursions are suppressed. Simulations are used to explore the dependence on system parameters in a more controlled setting. Body rotations are found to be critical for the onset of periodic vertical motions of large bodies, which in turn can produce body wobbling, rolling, and multi-period surface return in a damped bouncing dynamics.
II Experiments
Mass loss of a supersaturated fluid. We first measured the change in gas concentration in a supersaturated fluid upon depressurization by examining the fluid’s mass loss over time. An empty glass vessel with a square cross-section of side length cm was filled with a just-opened can of Klarbrunn-brand carbonated water which was stored at room temperature ( C). The fluid was poured into the vessel and then left alone for two hours at the same room temperature. Time, denoted by , is measured in minutes, and corresponds to the time just after depressurization (the moment when the can was opened). The mean mass loss across five experiments at each time is shown in Fig. 2(a) as a thin red curve. In each experiment the initial volume of fluid, , was approximately cm3 ( oz); the total mass loss, , over the course of two hours was roughly of the initial mass.
Rapid mass loss over the first minutes was due to the growth and detachment of bubbles on the container surface, and diffusive transport of gas from the free surface, as discussed below. The remaining 100 minutes revealed linear behavior due to water evaporation Hisatake et al. (1993). At long times we observed that for relatively large , where g/min (the same value was found using only tap water). The solid blue curve in Fig. 2(a) shows , expected to be the mass loss of CO2 , and the standard deviation at each time across experiments is shown using error bars.
Denoting the volume-averaged gas concentration at time by , with units of g/cm3, the mass of CO2 in the vessel is given by (an adjustment due to evaporative volume change is negligible). The mass loss from the empty vessel is written as , where is the initial concentration of CO2 . The supersaturation ratio, , measures the gas concentration level compared to a critical value , an equilibrium concentration corresponding to a partial pressure of gaseous CO2 of 1 atm Lubetkin and Blackwell (1988); Liger-Belair (2012). At room temperature in water this value is g/L Carroll et al. (1991); Sander (2015). is expected to decay to a minimum value at which point bubbles no longer form on the container walls. The difference may then be inferred from the mass loss data, and is plotted in Fig. 2(b). The dynamics of are modeled by a Riccati equation, with the dot denoting a time derivative, for reasons to be discussed, which results in a predicted evolution of the form
| (1) |
where . This function is plotted in Fig. 2(b) as a dashed curve using fitted parameters , , and min. With , the observations here are in line with carbonation levels reported in other sparkling beverages Liger-Belair et al. (2015); Ashurst (2016), particularly given the substantial gas loss while pouring Liger-Belair et al. (2015); Liger-Belair (2017).
Surface buoyancy growth with a fixed body. Next, a body was held fixed in the fluid, and we measured the force development due to bubble growth on its surface. A sphere of radius 1 cm composed of Polylactic acid (PLA) was printed with an Ultimaker 3+ 3D-printer using a 0.15mm nozzle. A schematic of the experimental setup is shown in Fig. 3(a). The fluid was depressurized and poured gently into the container, and placed upon the digital scale. The test sphere was then lowered into the carbonated water at different insertion times, denoted by , and affixed to the table below. As bubbles grew on the surface (see Fig. 3(e)) they imposed an upward vertical force on the stationary sphere, and the opposing downward force was registered by the scale. The sphere was briefly removed from the fluid every 4 minutes, then reinserted while still wet. Videos of bubble growth, coalescence, and arrival at a fluctuating steady state at insertion times min and min are included as Movies S2-S3.
The scale-registered weight of the system, denoted by , was decomposed as . includes a constant buoyancy force due to the volume of the displaced fluid; is the mass change of a body-free fluid previously described; and is the surface buoyancy force, the contribution to the buoyancy by the bubbles since the insertion time, . The weight loss due to gas escape from an empty vessel is small, but it is of comparable magnitude to the force on the body for roughly the first 10 minutes, and must be accounted for here. was measured directly, which then provided an indirect measurement of the added buoyancy force, .
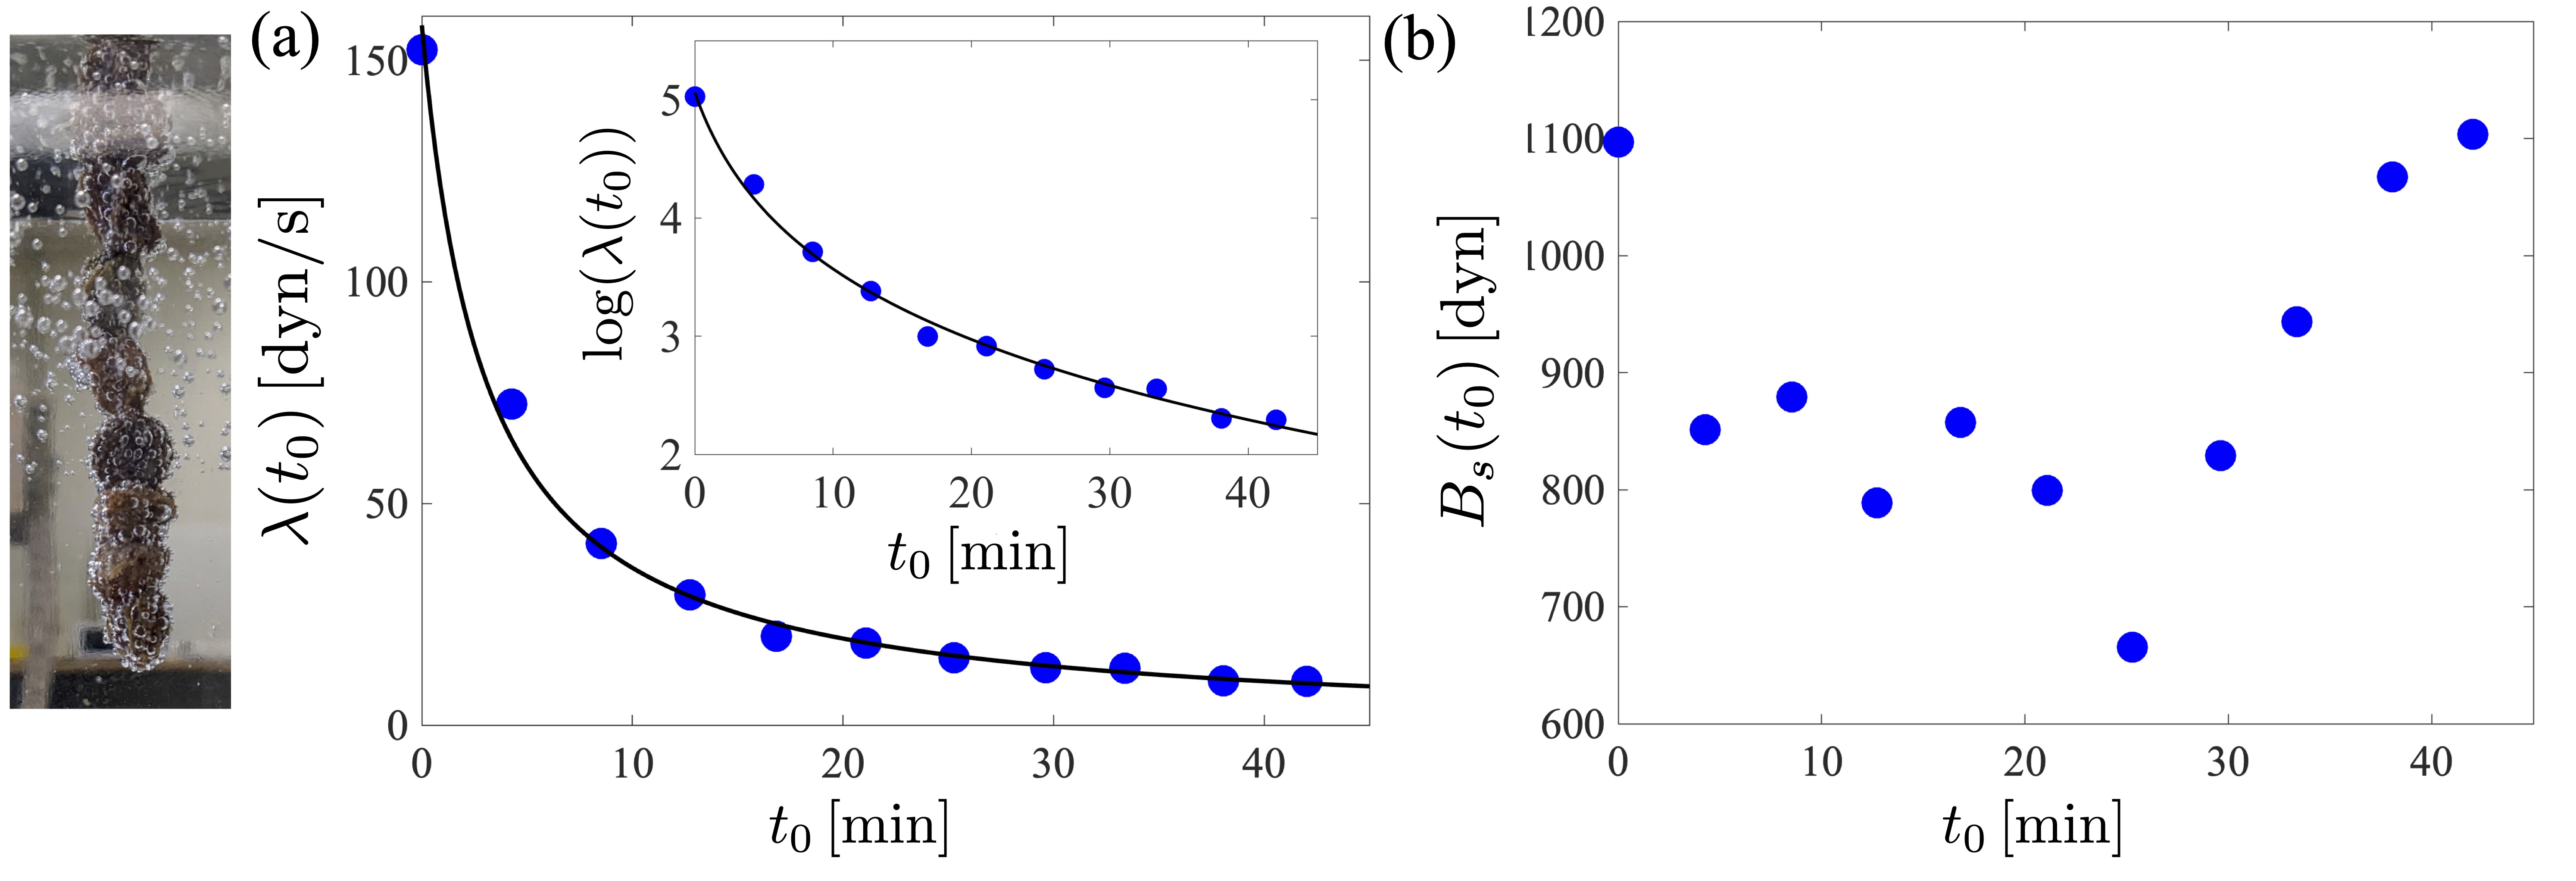
Figure 3(b) shows the surface buoyancy force as a function of time since insertion, , for insertion times up to 60 minutes. Upon insertion the force increases, at a rate which diminishes as the insertion time becomes larger and the fluid becomes calmer. Treating the growth as approximately linear, the growth rate, denoted by , is shown in Fig. 3(c). Solid curves correspond to , where is a proportionality constant, and is the minimum supersaturation ratio below which no bubbles form on the body. This model is consistent with the bubble growth law discussed below. Writing the growth rate as
| (2) |
where , and using from the experiment with no immersed body, the model best fits the data using dyn/s and . That (or ) suggests that bubbles continue to form on the body long after they cease to form on the container walls. Inserting the 3D-printed body or a raisin into an apparently motionless carbonated fluid which has been left out for hours did result in bubble growth and steady body rising events.
The surface buoyancy force eventually stabilized to a value measured four minutes after reinsertion time . This value is shown in Fig. 3(d) along with a linear fit, dyn-( dyn/min). The saturated value diminished far more slowly than did the growth rate - roughly, at later insertion times, bubbles merely take longer to accumulate and grow until reaching a critical size, at which time they pinch off and depart alone. Whether the slow decay was due to surface wetting or other phenomena remains unclear. A simple method for estimating is included as Appendix A.
After the buoyancy force stabilized, large fluctuations were observed. They were most apparent at smaller insertion times due to large bubble surface sliding and detachment events, which carry numerous other bubbles away at the same time. This surface cleaning effect has recently seen more specific attention Hooshanginejad et al. (2022). Detachment is expected beyond a critical ’Fritz radius’ where buoyancy overwhelms capillary forces Fritz (1935); Oguz and Prosperetti (1993); Pereira et al. (2023). Bubbles have other opportunities to depart during merging events via self-propelled detachment Lv et al. (2021).
The same force development measurement was performed using a skewer of 8 Sunmaid raisins, as reported in the Supplemental Information. The initial maximum force per raisin due to bubbles was dyn, and the initial growth rate per raisin was dyn/s.
Levitation and dynamics of a freely moving sphere. In a final set of experiments, the printed sphere was placed into the fluid, free to move. The body, with radius cm and mass g, was inserted into the fluid just after depressurization and pouring, and its motion was recorded with a Nikon D7000 DSLR camera with a 24 fps framerate for two hours (see Movies S4-S6). The body’s vertical position at each time, denoted by (with the fluid surface at ), was recovered using an image tracking code written in Matlab. The experiment was performed five times.
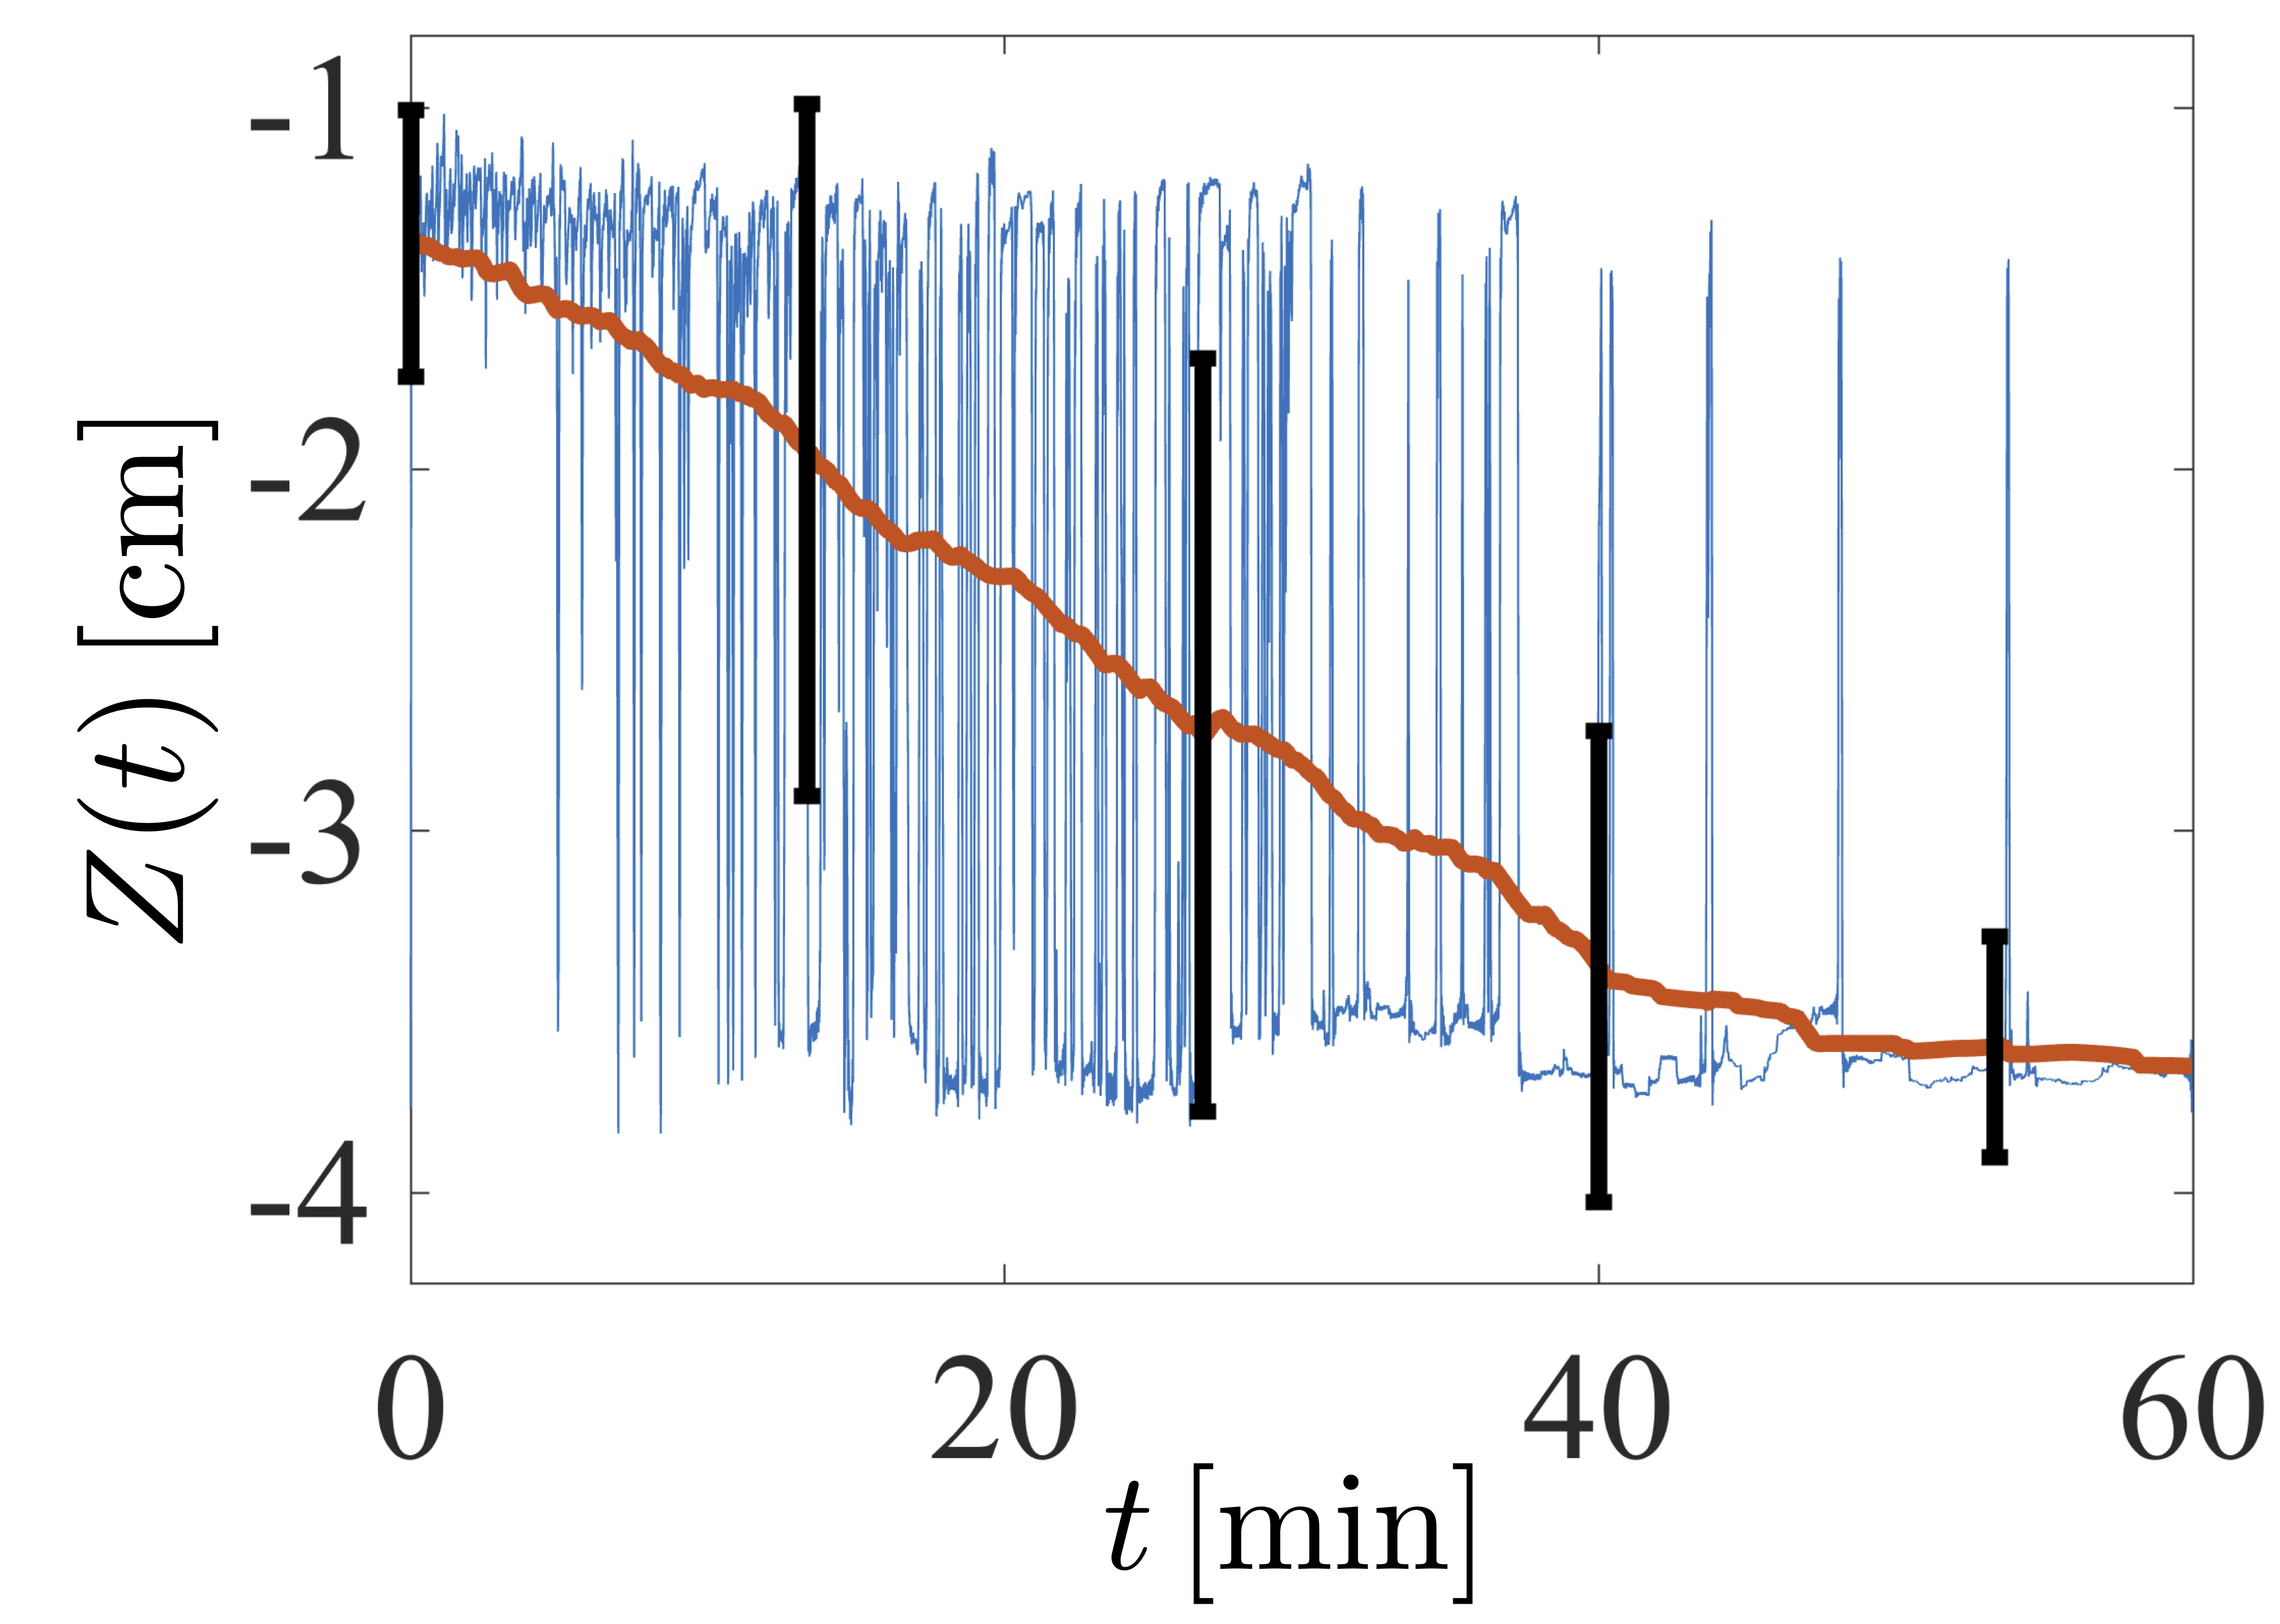
A slow decay of the highly oscillatory dynamics is observed upon locally averaging the vertical position. Figure 4(a) shows the mean vertical position at time over a window [ min, min] during one experimental run (see the Supplementary Information). The free surface is located at , and the body is just touching the surface when . For the first 5 minutes the body spends most of its time near the free surface - bubbles cleaned from the body are rapidly replaced. Eventually, the body begins to spend more time in the bulk fluid and on the container floor, where the body resides for longer and longer ’charging’ times before rising again.
The instantaneous vertical position starting at min is shown in Fig. 4(c), revealing a type of damped ‘bouncing’ dynamics from the free surface. Multiple visits to the free surface in succession are commonly observed; each visit clears different parts of the body surface, resulting eventually in a longer excursion into the bulk. Figure 4(d) shows common late-stage behavior: long periods on the container floor, punctuated by increasingly rare rising events. Rising often ends prematurely due to the detachment and departure of single large bubbles. The late-stage surface forces tend to be dominated by such individuals, and the body’s fate can be dictated by their singular activity.
An excursion is defined as having occurred if the body’s center of mass drops below one diameter beneath the free surface before returning upward and crossing the same vertical threshold. The times at which the excursion begins and ends are denoted respectively by ( and ), and ( and ). The excursion time is given by , for . The body undergoes roughly 300-700 excursions during the two hour experiment, so we define a smoothed excursion time which is again a moving average using 5 minutes on either side of time . The dancing frequency, , is shown in Fig. 4(e), and on a log-linear scale in the inset, including error bars representing one standard deviation at that time across three independent experiments. A clear monotonic decrease in the frequency is observed with nearly exponential decay over time. The dashed curve corresponds to a theoretical prediction discussed below.
For bodies with a dense surface bubble coverage, body rotation at the surface plays a critical role. Early experiments, not shown here, constrained the motion to translation along and rotation about the vertical axis only. This dramatically inhibited surface bubble removal and associated dancing. Only a rare event of a large bubble leaving the surface could result in an excursion. Rather, if the body is free to rotate, then upon reaching the surface and losing a portion of the surface-bound bubbles, the body becomes unstable to rotation due to the remaining bubbles on the underbelly of the sphere. Once the body starts to rotate, the surface is cleared of a larger number of buoyancy-conferring bubbles and an excursion becomes far more likely (see Movie S4). The previously noted surface bouncing is an additional consequence. Fluctuations from the active fluid, or other immersed bodies (Movie S5), which nudge the rotational instability to develop appear to be important as well. For bodies like raisins, whose trajectories are dictated more by individual bubble growth and lift, such rotations are less important.
III Mathematical model
Gas escape. There are a number of mechanisms by which gas may escape from the system: formation of bubbles on the container walls and on the immersed body, which eventually exit into the surrounding environment, and by diffusive transport through the free surface Liger-Belair (2012). For the first mechanism, assuming simply that the frequency of surface bubble growth and bubble volume upon exit each to be linear in the supersaturation ratio, the gas loss from this process follows , where is a constant which encapsulates the number of bubble growth sites and their geometrical features, and is the minimum value below which bubbles do not form on the container walls. This mechanism dominates gas loss at early times (Fig. 2). Gas loss due to growth on the immersed body and direct delivery to the surface is neglected (see the Supplementary Materials).
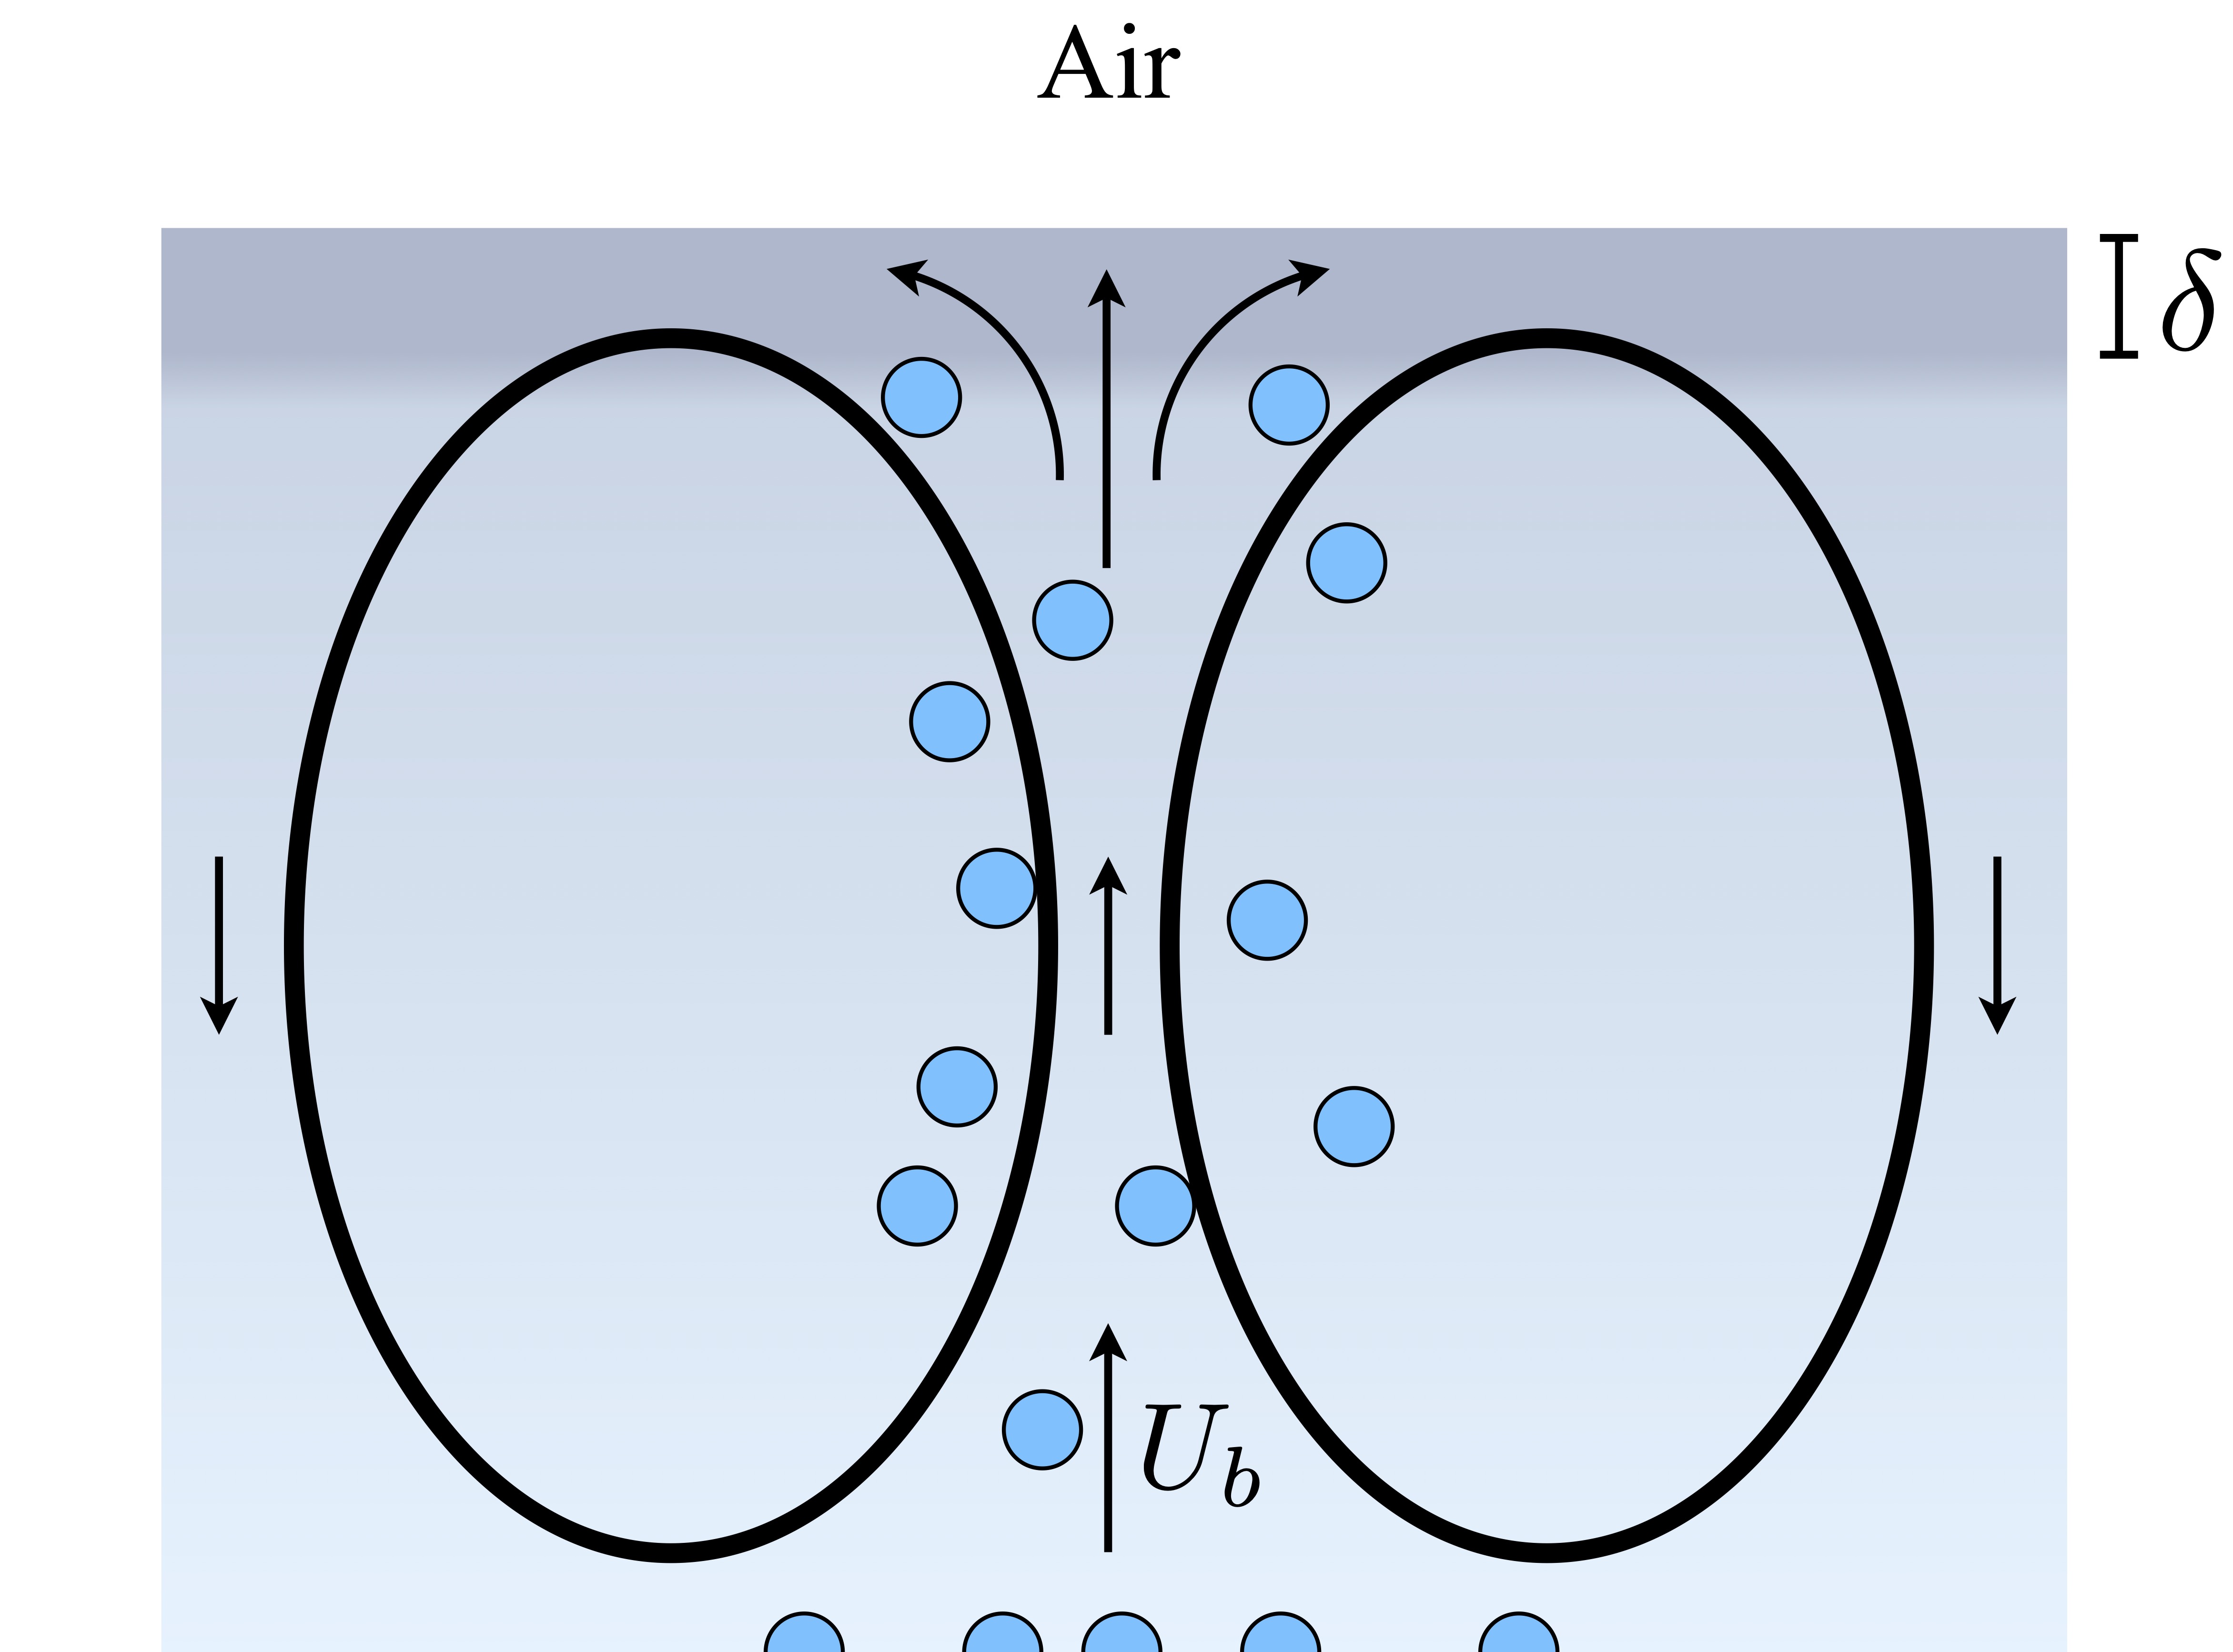
The steady stream of rising bubbles from the container walls drives a large-scale circulation flow on the scale of the container’s lateral measure akin to intrisic convection in particle sedimentation Peysson and Guazzelli (1998); Guazzelli and Morris (2011); Liger-Belair (2017). Such a flow is expected to continually replenish the region near the fluid-air interface with the well-mixed concentration from the bulk fluid. Considering a dominant balance between advection and diffusion, the concentration is predicted to decay from a mean value to zero across a small boundary layer of size near the surface, where , with the fluid depth and the velocity of bubble rise (see Supplementary Materials). This motivates a model for the supersaturation ratio, , where is a relaxation timescale, with the free surface area and the fluid volume. Using the dimensions of the experiment, cm and cm, the diffusion constant for CO2 in water cm2/s Liger-Belair et al. (2003), and an observed bubble rise velocity of cm/s, gives m. Then with cm2, and fluid volume cm3, the predicted relaxation time is min, within range of the best fit value used in Fig. 2. Combining the mechanisms above, , produces the expression in (1).
Discrete and continuum buoyancy growth models. We consider two models of bubble/buoyancy growth, a discrete model and a continuum model, as each can be more appropriate depending on the body size and surface properties. In the discrete model, each of bubbles are assumed to grow independently according to the bubble growth law attributed to Scriven, which builds upon the Rayleigh-Plesset equation: for an isolated bubble of radius , we have
| (3) |
where is the surface tension of water (mN/m = dyn/cm at room temperature), and is the pressure near the bubble ( 1 atm dyn/cm2) Rayleigh (1917); Plesset (1949); Epstein and Plesset (1950); Scriven (1959). The force conferred to the body is the buoyancy experienced by the bubble. In the discrete model, a bubble is removed from the surface when its position on the body exits the fluid, or when it reaches a critical size for pinch-off, , at which time it is immediately rebirthed (once in the fluid) with size , a characteristic scale of surface roughness. Of particular importance at longer times, there is a supersaturation ratio below which bubbles are overwhelmed by pressure and surface tension and cease to form, namely when . In the experiments, the resolution of the 3D-printer of mm motivates the estimate cm, and we fix . The accompanying estimate is that , so that the surface roughness (or remnant material) scale on the container wall is m, consistent with related measurements Liger-Belair (2012).
The second model considered is a continuum model, more appropriate when the body is covered in a large number of bubbles which are continually growing, merging, and detaching. With the local maximum of the added traction given by , the instantaneous portion of this local contribution is defined as , where and is a point on the body surface. The evolution of this fraction is then modeled as
| (4) |
For , holding the supersaturation ratio fixed and neglecting surface tension and pressure, the bubble growth law suggests a bubble radius growth . Since the contributed buoyancy is proportional to , this suggests a growth rate which scales as , consistent with the measured data, but vanishing when . This leads to the model for the growth rate given in (2).
In both models, the instantaneous lifting force in the lab frame is written as . In the continuum model, , with an infinitessimal surface area element in the reference frame, and the torque by , where . Or, writing and , the torque may be written as . For more details on both models, see the Supplementary Materials.
Equations of motion. Taking to be a characteristic time and to be a characteristic speed, we write the position of the body centroid as , the vertical velocity as , and the body rotation rate as . Force and torque balance, with the dimensionless time , are expressed as
| (5) | |||
| (6) | |||
| (7) |
where , and
| (8) |
with given in (1). Here, is the body volume, is the submerged volume, is the moment of inertia, and . Hydrodynamic drag and torque coefficients, respectively, are given by , and , with the Reynolds number111The Reynolds number is defined as , with the fluid density, a characteristic speed, a characteristic length scale, and the fluid viscosity, and gives a measure of the importance of inertia relative to viscous dissipation..
The system is thus characterized by a mass ratio, , the relative lifting force , which we term the fizzy lifting number222“Fizzy lifting drinks! They fill you with bubbles, and the bubbles are full of a special kind of gas, and this gas is so terrifically lifting that it lifts you right off the ground just like a balloon, and up you go until you’re bumping against the ceiling!” -Charlie and the Chocolate Factory, by Roald Dahl., bubble growth rate, , and relaxation time, , minimal supersaturation ratios for bubble growth, and , and the Reynolds number. The system is closed by tracking the body’s position and orientation: and where for vector . For the 3D-printed body used above, using cm, g, dyn, dyn/s, and min, and for water g/cm3 and g/(cm s), we find . For a raisin, using a prolate spheroidal body with semi-major axis length cm and semi-minor axis lengths cm, mass g, dyn, and dyn/s, we find . These values of and make raisins particularly strong dancers.
The body is positively buoyant and floats without bubbles if . If , the body can only be lifted upward against gravity if the fizzy lifting number is sufficiently large; namely must be positive. This gives a range of masses for which oscillatory dynamics are expected to reside: if , and if . The 3D-printed bodies are predicted to dance with density ratios ; raisins are expected to dance in a similar range, .
Dancing frequency. We approximate the solution to (7) by neglecting the early period of rapid gas escape, and by assuming . Taking , with , we find
| (9) |
The dimensionless ’charging time’ before the total buoyancy overcomes gravity is given by such that , which from (9) is given by
| (10) |
where . For a sufficiently small container the charging time serves as a proxy for the excursion time, with transit from one surface to another playing only a small role. Two curves corresponding to (with ) are included in Fig. 3(e), one with and one which best fits the data with . The frequency is sensitive to , which points yet again to the importance of rotations, and how many bubbles are removed upon each surface visit.
For insertion times , where , the charging time in (10) is infinite. Using the values from the experiments the associated dimensionless time is min. A separate approximation starting from (7) is more appropriate at long times when . As , with we have , leading to a constant charging time of . Using the experimental parameters this gives a final dimensional charging time of between s and 3 min, for and , respectively. Since , the bubbles cease forming on the walls before they cease forming on the body; with the primary mechanism driving gas escape removed, the body can continue to form bubbles and perform its low frequency dance even in an otherwise quiescent fluid. Since we neglect the days-long timescale of pure diffusive transport, and convective diffusion affected by the body motion, this low frequency dancing is predicted to carry on indefinitely. Dancing with a mean frequency of min-1 was indeed observed in one experimental run for the last 4 hours of a 5-hour run.

Simulations. To examine the dynamics in a more controlled environment we solve (5)-(7) numerically. Figure 5 shows the dynamics of a body with bubbles at the vertices of a regular icosahedron (), using the discrete bubble model, with . The rebirth and pinch-off radii used are and , respectively. The bubbles first grow to sufficient stature to lift the body to the surface, where the topmost bubbles are released. The body begins to descend slowly before undergoing a rotation, returning soon after to the surface. Each visit to the surface includes bubble removal, a body rotation, additional bubble removal, and then a plummeting to deeper waters.
Figure 6(a) shows the dimensionless vertical dancing frequency, , using the discrete bubble model as a function of the number of bubbles, all placed at the vertices of a regular polyhedron, all with . To isolate the role of bubble position we adjust the maximum bubble size so that each body achieves the same maximal surface buoyancy () if all bubbles are at their maximal (pinch-off) size. The frequency increases with , as bodies with a greater number of bubbles can begin their descent while still maintaining partial surface coverage, and less bubble growth is needed before the body becomes positively buoyant again.
To further explore body rotations, Fig. 6(b) shows the mean body rotation rate as a function of the growth rate, , using both the discrete bubble model (shown as symbols) and the continuum model (as a solid curve). With increasing the body spends more time at the surface, and experiences opportunities to rotate more frequently, if not more rapidly. The growth is approximately logarithmic in , and for small there is close agreement between the discrete and continuum models. The discontinuity in the discrete model is due to the onset of premature bubble detachment at large bubble growth rates (see Movie S7).
Figure 6(c) shows the mean rotation rate instead as a function of for a selection of growth rates, , using the discrete bubble model, while Fig. 6(d) shows the same using the continuum model. Generally, larger values of are associated with larger torques, and thus faster body spinning. The discrete model shows again the importance of premature bubble pinch-off and departure at large bubble growth rates. For , if is small, it is common for most of the bubbles to pinch off before the body traverses the full length of the container. For large , the body emerges completely out of the fluid in a dramatic jump, and all bubbles are removed leaving none to generate a torque.
Wobbling and rolling. For bodies which are large relative to the maximum bubble size, body rotations are commonly observed, as are a related dynamics: wobbling. As a coarse approximation we consider bubbles to have been removed from one half of the spherical surface, which then regrow with rate . Writing the first surface buoyancy moment in the body frame as , with , then with and , the (dimensionless) torque in the lab frame is . Writing , and neglecting the nonlinear part of the hydrodynamic moment, we arrive at , where and , the equation for a damped nonlinear oscillator with diminishing torque.
Wobbling diminishes either by viscous damping or by bubble (re)growth. A characteristic initial wobbling frequency from the above is . For the 3D-printed body, using , the initial frequency is roughly Hz. A raisin, meanwhile, due to its larger value of , oscillates with a higher frequency of just over Hz. These values are consistent with the experimental observations (see Movies S1, S4, and S5). This effect is similar to that seen in Quincke rotor dynamics, where surface charging is driven by electrohydrodynamics Quincke (1896); Jones (1984); Turcu (1987); Lemaire and Lobry (2002); Peters et al. (2005); Vlahovska (2019); Zhang et al. (2021).
A transient rolling mode was also observed. Bubbles on the surface of a rolling body begin to grow upon reentry and are larger just before they exit, producing a sustained rolling torque. For this we consider a cylindrical body and a two-dimensional cross-section. If the body is fixed at a vertical position , with , then the steady state lifting distribution assuming (and using ) is , where . The resulting dimensionless torque is . Balancing with a viscous drag yields a steady rotation rate , where , since part of the body sits outside of the water. A more detailed study of this rotational drag, like that performed by Hunt et al. Hunt et al. (2023), is needed.
IV Discussion
Supersaturated fluids present an accessible playground for exploring the dynamics of bodies and their relationship to a complex fluid environment. In the framework proposed by Spagnolie & Underhill Spagnolie and Underhill (2023) this would appear as either a Type I or Type II system - the body is much larger than the ‘obstacles’ (be they bubbles or gas molecules), and the fluid exhibits a natural relaxation time. Among the unexpected findings in this system, we have observed a critical dependence of the dynamics on body rotations for large body to bubble size ratios, and multi-period oscillatory dynamics when a single surface interaction is insufficient to clean the body surface of its lifting agents. Another intriguing feature is that bubbles may continue to form on the body long after they cease to form on the container walls when (when the surface roughness or fibrous material scale is smaller on the container walls than on the body). Raisins inserted into a fluid which was left out for hours and appeared motionless were indeed observed to dance, albeit at a leisurely pace. Preliminary results also suggest that the body’s presence can affect fluid degassing, even potentially slowing it by disturbing the large-scale convective flow responsible for gas escape, reminiscent of how moving boundaries affect flows which promote heat transport Zhong and Zhang (2005); Liu et al. (2008); Lappa (2009); Ahlers et al. (2009).
Additional constraints on the dynamics are expected in general. At greater depths, bubbles are less likely to grow due to the increase in hydrostatic pressure. Should a body plummet sufficiently far below the surface, bubble-assisted levitation may vanish and the plummeting will continue unresisted. Surfactants may also adjust the range of bodies possible to levitate in this manner, since their presence can affect the nature of bubble pinch-off and coalescence, in competition with the pressure and surface roughness scale via King and Sadhal (2014); Raza et al. (2016). The shape of the container and temperature can also affect the rate of CO2 loss Liger-Belair et al. (2012). Another uncharacterized but potentially important feature is wetting. A return to the surface releases bubbles from the body surface, but interaction with the air above may also help to nucleate other bubbles by drawing additional gas into small cavities. Initially dry bodies danced for far longer than initially wet bodies. The interaction with the free surface appears to damp rotations as well, and as we have seen, any inhibition of the rotation of large bodies tends to inhibit vertical dancing.
A number of directions lie ahead based on additional observations not described above. Preliminary studies suggest a substantial encouragement of excursions for more elongated and asymmetric body shapes. Also, the behavior of multiple bodies in the system can result in stable rafts of bubble-sharing bodies at the surface. Since rotation is critical for triggering an excursion from the surface, and sharing bubbles inhibits rotation, the system transitions from exhibiting oscillatory to overdamped behavior with increased particle volume fraction. Additional bodies, however, also increase the fluctuations in the system, which can encourage the rolling and plummeting of others. Exploration of the optimal number of dancing partners is under current investigation. A more detailed study of the fluid flow itself will be highly informative regarding the nature of degassing and the effect of the immersed body.
Theoretical advances are also needed. Models of growing arrays of bubbles date back to classical works by Lifschitz and Slyozov Lifshitz and Slyozov (1961) and Wagner Wagner (1961). Coupling the local growth rate and bubble size distribution dynamics to the motion of the body, however, presents a substantial new challenge. Future work exploring body shape, multi-body dynamics, and fluid-structure interactions is likely to prove… fruitful.
Appendix A A simple method to estimate the lifting force
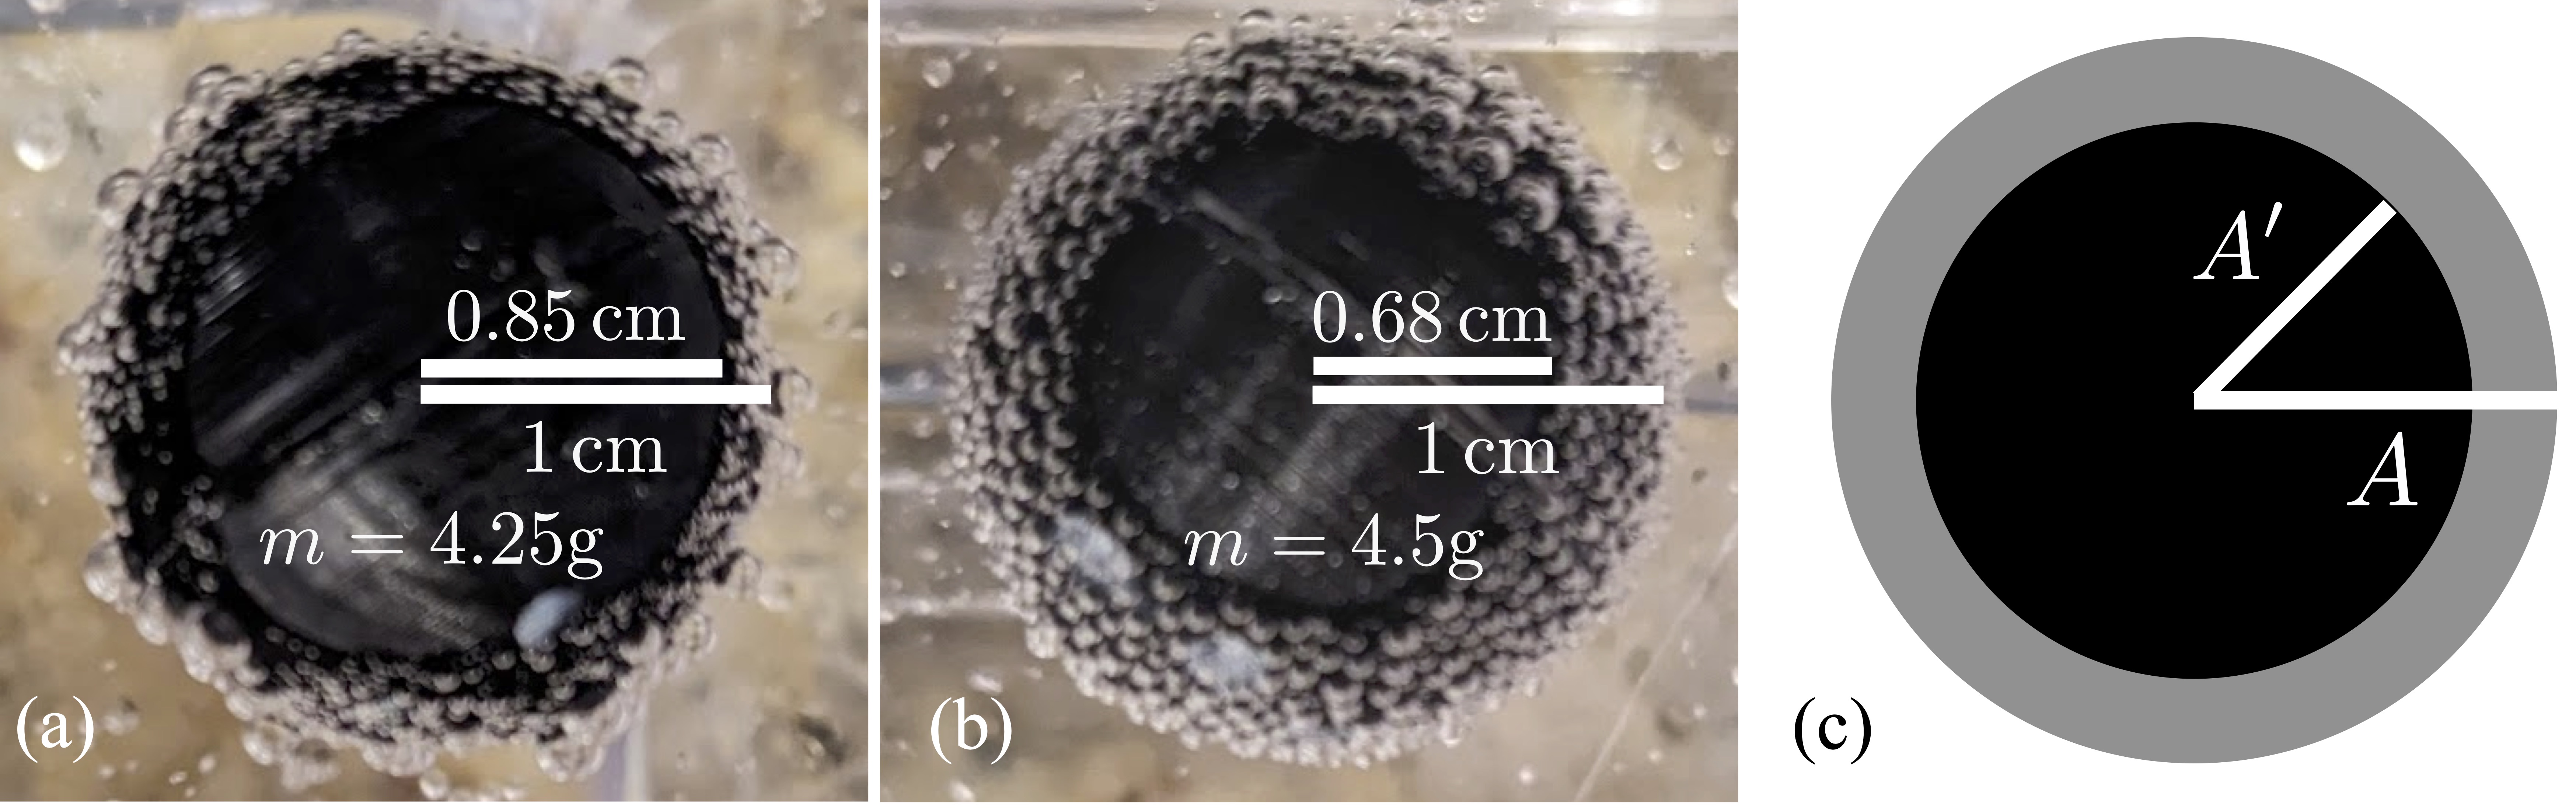
The saturated surface buoyancy force, , can be estimated by observing the portion of the body which sits outside the fluid while it temporarily resides at the free surface. Figure 7(a,b) show two spherical bodies of radius cm briefly sitting at the fluid-air interface. The lighter body ( g) is pushed further out of the water than the heavier body ( g). Making the rough approximation that the rest of the surface below has reached its maximal gas capacity, we need only balance the gravitational force with the volumetric and surface buoyancy forces, , where is the submerged body volume and is the submerged surface area. In terms of the body radius , and the radial distance of the emerged surface when viewed from above, (see Fig. 7c), the top of the body has emerged a distance from the surface. With the basic geometric expressions and , we find
| (11) |
The lighter body in Fig. 7(a), using cm, produces the estimate dyn. Using the heavier body in Fig. 7(b) (which would ideally give a similar estimate), using cm, we find dyn. The latter estimate, taken at approximately min, is not far from the measured value shown in Fig. 3(d).
Support for this research was provided by the Office of the Vice Chancellor for Research and Graduate Education with funding from the Wisconsin Alumni Research Foundation, and by donations to the AMEP program (Applied Math, Engineering, and Physics), at the University of Wisconsin-Madison. S.E.S. gratefully acknowledges conversations with Hongyi Huang, Thomas G. J. Chandler, and Jean-Luc Thiffeault, and preliminary work with Carina Spagnolie.
References
- Scriven (1959) L. E. Scriven, Chem. Eng. Sci. 10, 1 (1959).
- Barker et al. (2002) G. S. Barker, B. Jefferson, and S. J. Judd, Chem. Eng. Sci. 57, 565 (2002).
- Zhang and Xu (2008) Y. Zhang and Z. Xu, Elements 4, 47 (2008).
- Liger-Belair et al. (2015) G. Liger-Belair, F. Sternenberg, S. Brunner, B. Robillard, and C. Cilindre, J. Food Eng. 163, 60 (2015).
- Soto et al. (2018) Á. M. Soto, T. Maddalena, A. Fraters, D. Van Der Meer, and D. Lohse, J. Fluid Mech. 846, 143 (2018).
- Fardin et al. (2022) M. A. Fardin, M. Hautefeuille, and V. Sharma, Soft Matter (2022).
- Lv et al. (2021) P. Lv, P. Peñas, J. Eijkel, A. Van Den Berg, X. Zhang, D. Lohse, et al., Phys. Rev. Lett. 127, 235501 (2021).
- Iwata et al. (2022) R. Iwata, L. Zhang, Z. Lu, S. Gong, J. Du, and E. N. Wang, Langmuir 38, 4371 (2022).
- Zhao et al. (2022) P. Zhao, Z. Hu, P. Cheng, R. Huang, and S. Gong, Langmuir 38, 10558 (2022).
- Hooshanginejad et al. (2022) A. Hooshanginejad, T. Sheppard, P. Xu, J. Manyalla, J. Jaicks, E. Esmaili, and S. Jung, arXiv preprint arXiv:2206.03309 (2022).
- Liger-Belair (2012) G. Liger-Belair, Euro. Phys. J. Special Topics 201, 1 (2012).
- Lohse (2018) D. Lohse, Phys. Rev. Fluids 3, 110504 (2018).
- Gilbert and Sparks (1998) J. S. Gilbert and R. S. J. Sparks (Geological Society of London, 1998).
- Lensky et al. (2004) N. G. Lensky, O. Navon, and V. Lyakhovsky, J. Volcanology Geothermal Res. 129, 7 (2004).
- G. et al. (1991) M. G., A. M. P. Vasconcelos, E. J. S. Gomes de Azevedo, H. J. Chaves das Neves, and M. Nunes da Ponte, Journal of the American Oil Chemists Society 68, 474 (1991).
- Markom et al. (2001) M. Markom, H. Singh, and M. Hasan, The Journal of Supercritical Fluids 20, 45 (2001).
- Harvey et al. (1944) E. N. Harvey, D. K. Barnes, W. McElroy, A. H. Whiteley, D. C. Pease, and K. W. Cooper, J. Cellular and Comparative Physiol. 24, 1 (1944).
- Papadopoulou et al. (2014) V. Papadopoulou, M.-X. Tang, C. Balestra, R. J. Eckersley, and T. D. Karapantsios, Adv. Colloid Interface Sci. 206, 239 (2014).
- Manga (1996) M. Manga, J. Geophys. Res.: Solid Earth 101, 17457 (1996).
- Robinson et al. (2008) M. Robinson, A. C. Fowler, A. J. Alexander, and S. B. G. O’Brien, Phys. Fluids 20, 067101 (2008).
- Watamura et al. (2019) T. Watamura, F. Iwatsubo, K. Sugiyama, K. Yamamoto, Y. Yotsumoto, and T. Shiono, Sci. Rep. 9, 5718 (2019).
- Planinsic (2004) G. Planinsic, Phys. Educ. 39, 65 (2004).
- Cordry (1998) S. M. Cordry, The Physics Teacher 36, 82 (1998).
- Derr et al. (2000) B. J. Derr, H. R. Derr, and T. Lewis, J. Chem. Educ. 77, 171 (2000).
- Moinester et al. (2012) M. Moinester, L. Gerland, G. Liger-Belair, and A. Ocherashvili, Phys. Teacher 50, 284 (2012).
- Maselko et al. (2014) J. Maselko, M. Kiehl, J. Couture, A. Dyonizy, V. Kaminker, P. Nowak, and J. Pantaleone, Langmuir 30, 5726 (2014).
- Wang and Steinbock (2023) Q. Wang and O. Steinbock, Soft Matter 19, 2138 (2023).
- Pereira et al. (2023) L. Pereira, F. B. Wadsworth, J. Vasseur, M. Schmid, S. Thivet, R. B. Nuernberg, and D. B. Dingwell, Roy. Soc. Open Sci. 10, 230376 (2023).
- Zenit and Rodríguez-Rodríguez (2018) R. Zenit and J. Rodríguez-Rodríguez, Phys. Today 71, 44 (2018).
- Mathijssen et al. (2023) A. J. T. M. Mathijssen, M. Lisicki, V. N. Prakash, and E. J. L. Mossige, Rev. Mod. Phys. 95, 025004 (2023).
- Hisatake et al. (1993) K. Hisatake, S. Tanaka, and Y. Aizawa, J. Appl. Phys. 73, 7395 (1993).
- Lubetkin and Blackwell (1988) S. Lubetkin and M. Blackwell, J. Colloid Inter. Sci. 126, 610 (1988).
- Carroll et al. (1991) J. J. Carroll, J. D. Slupsky, and A. E. Mather, J. Phys. Chem. Ref. Data 20, 1201 (1991).
- Sander (2015) R. Sander, Atmos. Chem. Phys. 15, 4399 (2015).
- Ashurst (2016) P. R. Ashurst, Chemistry and technology of soft drinks and fruit juices (John Wiley & Sons, 2016).
- Liger-Belair (2017) G. Liger-Belair, Euro. Phys. J. Spec. Top. 226, 3 (2017).
- Fritz (1935) W. Fritz, Physik. Z. 36, 379 (1935).
- Oguz and Prosperetti (1993) H. N. Oguz and A. Prosperetti, J. Fluid Mech. 257, 111 (1993).
- Peysson and Guazzelli (1998) Y. Peysson and É. Guazzelli, Phys. Fluids 10, 44 (1998).
- Guazzelli and Morris (2011) E. Guazzelli and J. F. Morris, A Physical Introduction to Suspension Dynamics, Vol. 45 (Cambridge University Press, 2011).
- Liger-Belair et al. (2003) G. Liger-Belair, E. Prost, M. Parmentier, P. Jeandet, and J.-M. Nuzillard, J. Agric. Food Chem. 51, 7560 (2003).
- Rayleigh (1917) L. Rayleigh, Lond. Edinb. Dublin Philos. Mag. J. Sci. 34, 94 (1917).
- Plesset (1949) M. S. Plesset, (1949).
- Epstein and Plesset (1950) P. S. Epstein and M. S. Plesset, J. Chem. Phys. 18, 1505 (1950).
- Note (1) The Reynolds number is defined as , with the fluid density, a characteristic speed, a characteristic length scale, and the fluid viscosity, and gives a measure of the importance of inertia relative to viscous dissipation.
- Note (2) “Fizzy lifting drinks! They fill you with bubbles, and the bubbles are full of a special kind of gas, and this gas is so terrifically lifting that it lifts you right off the ground just like a balloon, and up you go until you’re bumping against the ceiling!” -Charlie and the Chocolate Factory, by Roald Dahl.
- Quincke (1896) G. Quincke, Ann. Phys. Chem 59, 417 (1896).
- Jones (1984) T. B. Jones, IEEE Trans. Ind. Appl. , 845 (1984).
- Turcu (1987) I. Turcu, J. Phys. A 20, 3301 (1987).
- Lemaire and Lobry (2002) E. Lemaire and L. Lobry, Physica A 314, 663 (2002).
- Peters et al. (2005) F. Peters, L. Lobry, and E. Lemaire, Chaos 15 (2005).
- Vlahovska (2019) P. M. Vlahovska, Annu. Rev. Fluid Mech. 51, 305 (2019).
- Zhang et al. (2021) Z. Zhang, H. Yuan, Y. Dou, M. O. De La Cruz, and K. J. Bishop, Phys. Rev. Lett. 126, 258001 (2021).
- Hunt et al. (2023) R. Hunt, Z. Zhao, E. Silver, J. Yan, Y. Bazilevs, and D. Harris, arXiv preprint arXiv:2305.19447 (2023).
- Spagnolie and Underhill (2023) S. E. Spagnolie and P. T. Underhill, Annu. Rev. Condens. Mat. Phys. 14, 381 (2023).
- Zhong and Zhang (2005) J.-Q. Zhong and J. Zhang, Phys. Fluids 17 (2005).
- Liu et al. (2008) B. Liu, J. Zhang, et al., Phys. Rev. Lett. 100, 244501 (2008).
- Lappa (2009) M. Lappa, Thermal Convection: Patterns, Evolution and Stability (John Wiley & Sons, 2009).
- Ahlers et al. (2009) G. Ahlers, S. Grossmann, and D. Lohse, Rev. Mod. Phys. 81, 503 (2009).
- King and Sadhal (2014) L. King and S. S. Sadhal, Heat and Mass Transfer 50, 373 (2014).
- Raza et al. (2016) M. Q. Raza, N. Kumar, and R. Raj, Sci. Rep. 6, 19113 (2016).
- Liger-Belair et al. (2012) G. Liger-Belair, M. Bourget, H. Pron, G. Polidori, and C. Cilindre, PLoS One 7, e30628 (2012).
- Lifshitz and Slyozov (1961) I. M. Lifshitz and V. V. Slyozov, J. Phys. Chem. Solids 19, 35 (1961).
- Wagner (1961) C. Wagner, Elektrochemie 655, 81 (1961).
Supporting Information
Experiments
Sublinear force development on a 3D-printed sphere at late insertion times
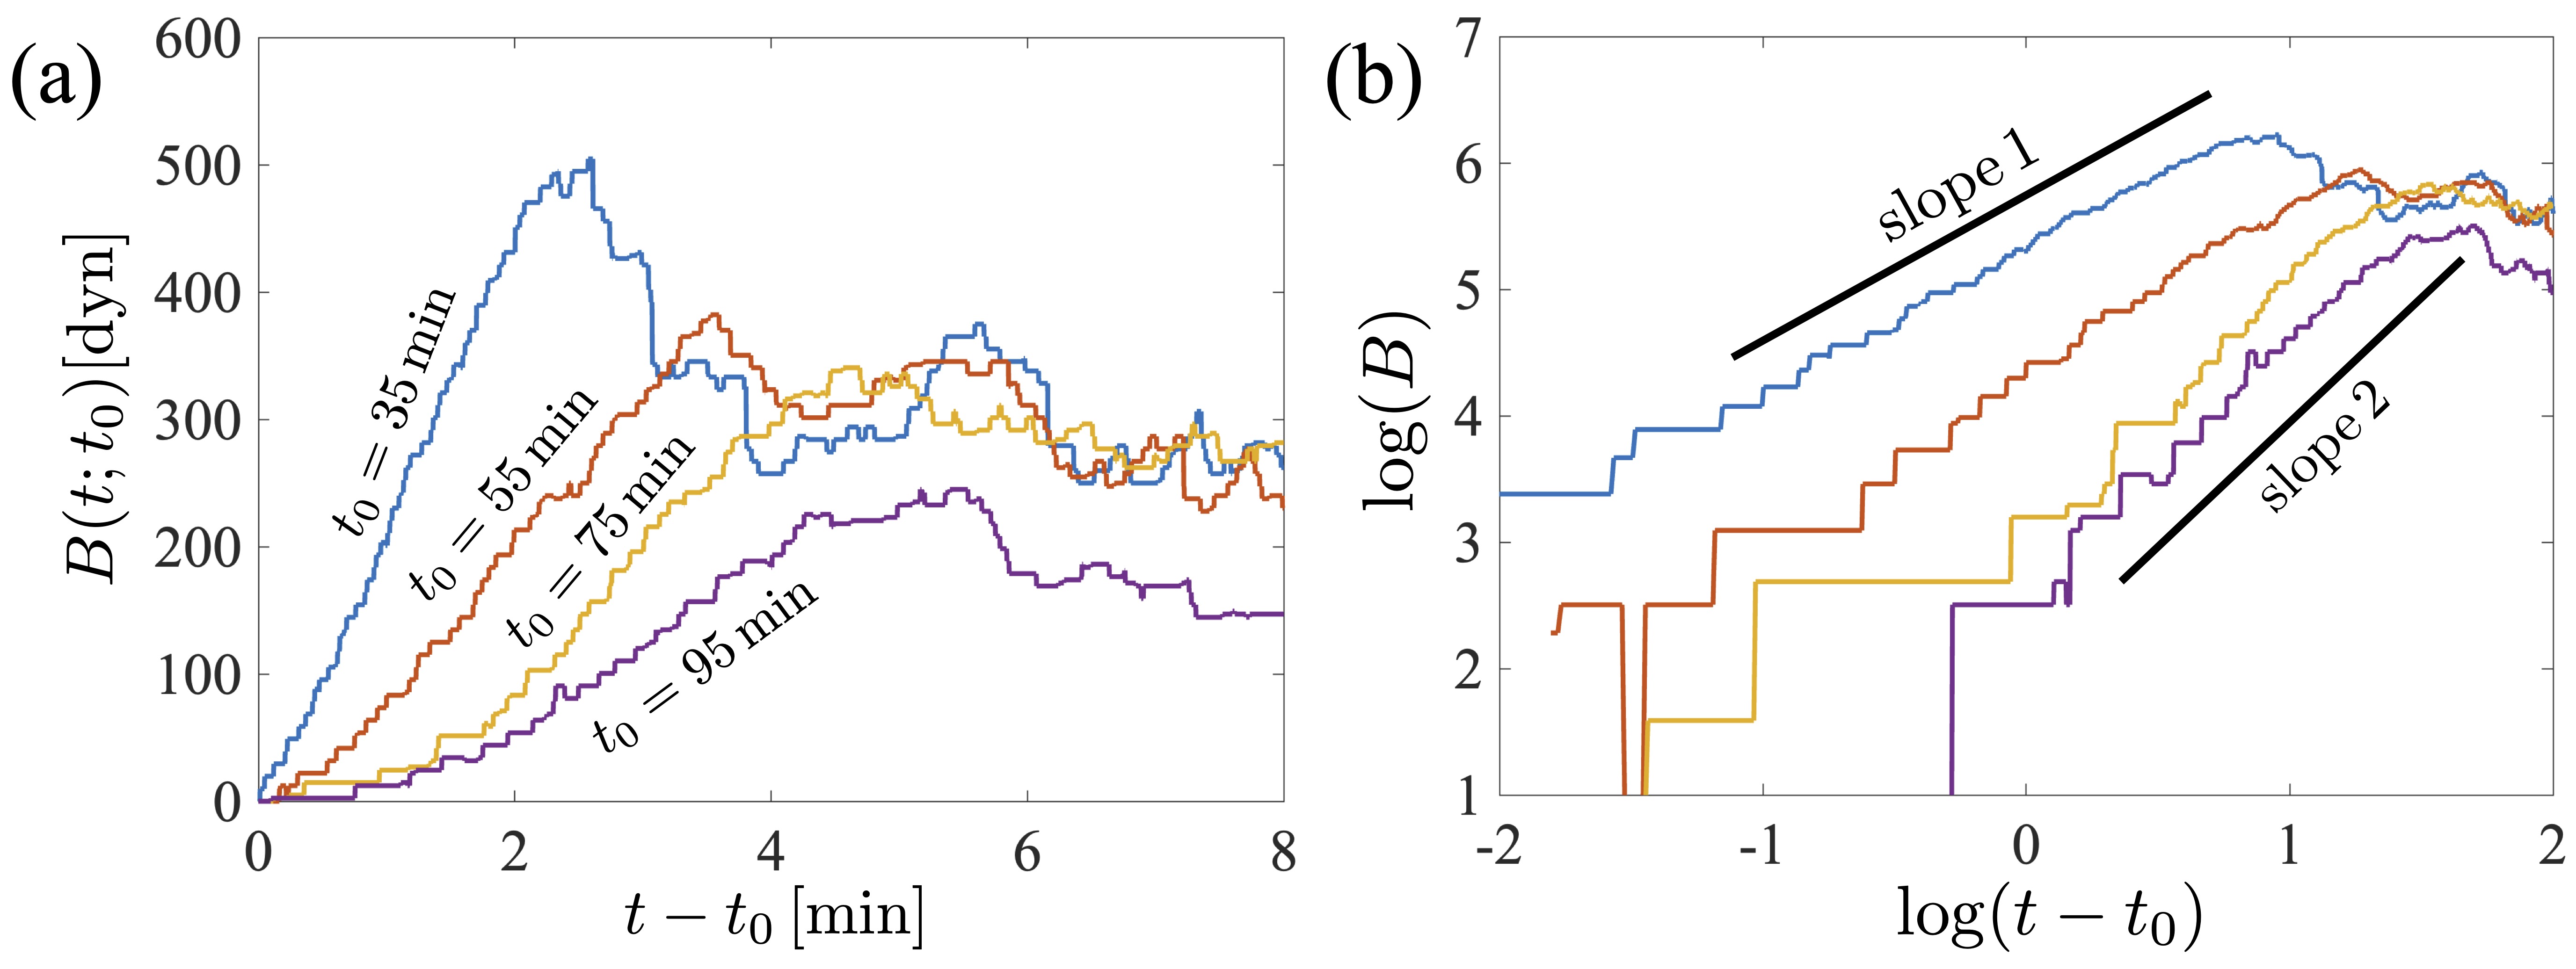
We continued carrying out the (fixed body position) experiment described in the main text to measure the force development on the same 3D-printed spherical body for insertion times longer than an hour. The results, shown in Fig. 8 on linear and logarithmic scales, suggest sublinear force growth for insertion times close to an hour and beyond. Power law behavior is observed, , with a slowly varying exponent which is approximately unity for small and grows to 2 at larger .
Vertical body position
A more detailed time series of a 3D-printed body’s vertical position, is shown in Fig. 9, along with the min windowed average as a darker curve.
Force development on a skewer of raisins
We performed the same (fixed body position) experiment as described in the main text using a skewer of 8 Sunmaid raisins, but using two cans (24 oz) of water in the same container. The results are shown in Fig. 10. The raisin cylinder had approximate length cm and diameter cm. Each raisin was fresh, weighing close to g; its surface properties appeared to the eye as unchanged over the course of the experiment (significant changes, however, were noted after the raisins were left in the water for 12 hours). To measure the force on the skewer due to bubbles alone, shown in Fig. 10(a), in the weight loss for two cans of water with no immersed bodies was subtracted off. As in the experiment with the 3D-printed body, insertion times began just after depressurizing the fluid and then once again every four minutes.
With the stabilized surface buoyancy force measured to be roughly dyn, this gives a per-raisin value of dyn. An estimated growth rate curve is shown in Fig. 10(a) which uses the same form as that described in the main text, but with fitted parameter dyn/min/raisin. Figure 10(b) shows the steady state mean force, measured 4 minutes after insertion. At later insertion times the force growth is slower and smoother, and the stabilized force is non-monotonic in the insertion time, which was observed for some but not all trials using the 3d-printed body as well. This may be due to the cylindrical shape of the raisin skewer, which suffers more dramatically from bubble departure events which may in turn disrupt a greater portion of the exposed body surfaces. A statistical analysis which includes bubble departure and strong nonlocal interactions may be required to account for this effect. Separately, the bubbles which formed on the raisins, compared to the 3D-printed bodies, were of a rather different character. Due to their rough surfaces, bubbles which formed were fewer and farther between than those observed on the more regular surface of the 3D-printed body, and the lifting force grew over twice as fast. See Movie S8.
Mathematical Modeling
Gas escape
With bubbles rapidly detaching from the container surface, a large scale circulation is set up, as seen in champagne Liger-Belair (2012) and beer glasses. We can estimate the gas loss in such a flow as follows. With gas assumed to behave according to an advection-diffusion equation, , with the velocity field, the natural boundary conditions are on the bottom and side walls of the container, with the outward-pointing normal vector, and at the top surface, an approximation due to the negligibly small concentration of CO2 in the air. Regardless of the flow field, the flux of gas from the fluid volume out of the top surface is given by (upon integration by parts and use of the boundary conditions),
| (12) |
The velocity field enters indirectly but is of critical importance. Consider a flow field which spans the horizontal measure of the container, , and depth , as observed in a large-scale circulation. Such a flow includes a stagnation point and nearby stagnation flow (see Fig. 11). With the container assumed to support a single circulation cell, we approximate the flow as an axisymmetric circulation field of the form , where and . is a characteristic velocity scale driven by bubble detachment and rise from the container walls.
Near the stagnation point the flow has locally the form . We now consider the advection-diffusion equation in the inner region where is for some small boundary layer thickness . Assuming a steady concentration field, , the dominant balance in this inner region matches advection and diffusion, giving , where taking and gives the solution
| (13) |
from which we find , with . Writing , (12) then gives approximately , where the dot denotes a time derivative and is a relaxation time, with the free surface area and the fluid volume. Using the dimensions of the cubic vessel, cm2, and cm3, and an observed free bubble speed of cm/s, this time is min.
The decay of the supersaturation ratio, , where , is desired. Since the velocity field is driven by bubble growth and detachment from the container walls, it diminishes to zero when , a minimum value associated with the container walls (or remnant particulate matter). We are thus motivated to model this period of gas loss instead by , so that further decay of the gas concentration is instead by other means. Namely, after bubbles are no longer forming and detaching from the surface, the process tends towards a purely diffusive process, assumed to be governed by approximately one-dimensional dynamics, . Taking the container depth as the linear dimension of interest, the natural timescale from this equation is ; using experimental values cm and cm2/s, the timescale of gas loss is on the order of hrs, over 12 days.
The full picture of gas loss involves a change from the mixing performed by large scale circulation to a diffusively-dominated regime. This very rich problem deserves a more substantial investigation.
Discrete and continuum buoyancy growth models
We consider two models of bubble/buoyancy growth, a discrete model and a continuum model, as each can be more appropriate depending on the body size and surface properties. In the discrete model, each of bubbles are assumed to grow independently according to the growth law attributed to Scriven: for an isolated bubble of radius , we have
| (14) |
where is a diffusion constant (cm2/s for CO2 in water Liger-Belair et al. (2003)), is the supersaturation ratio, is the surface tension of water (mN/m = dyn/cm at room temperature), and is the pressure near the bubble ( 1 atm dyn/cm2) Rayleigh (1917); Plesset (1949); Epstein and Plesset (1950); Scriven (1959). Bubbles smaller than a critical size, m/S, vanish due to surface tension, while larger bubbles grow, which points to the importance of the length-scale of surface roughness. If , fixing on the timescale of bubble growth, we have , or .
We denote by a point in space on the body surface, and the body center in the lab frame as . It is convenient to work in a reference frame of a fixed unit sphere, where the surface is denoted by with surface points . We then write , where is an orthogonal orientation matrix, with . The force conferred by the bubble onto the body, with radius , is then , with the density of water and the gravitational constant, where we have assumed a hemispherical bubble shape (generally the volume depends on surface roughness and chemistry Pereira et al. (2023)). The bubbles are assumed to nucleate with a size , based on the length scale of surface roughness, and pinch off above a critical size . The maximum lifting force which can be provided by bubbles is then
| (15) |
Writing the instantaneous lifting force as , we then have
| (16) |
and then
| (17) |
so that the bubble geometry appears unimportant outside of its affect on . The surface buoyancy torque is similarly given by , where is the position of the bubble in the lab frame. Here, and are dimensionless.
The second model considered is a continuum model, more appropriate when the body is covered in a large number of bubbles which are continually growing, merging, and detaching. During this time, the entire body surface presents as a singular large bubble to the surrounding environment. The force growth on the entire surface, if treated uniformly, is given by , where . The proportionality constant is expected to scale with , but also incorporates the more complex behavior of the distribution of bubbles in the neighborhood of each point. is the minimum supersaturation below which bubbles do not form on the body itself, and . With varying slowly relative to bubble growth, this suggests a linear increase in the total force over time before reaching saturation. Later, when is decaying on a timescale relevant to bubble growth, we expect power-law behavior. This transition is seen in Fig. 10.
Arrival at a steady state value, , is modeled using the modified form . The force per area in the lab frame due to bubbles in this case is modeled as a lifting traction, , where is the proportion of the maximal local lifting contribution.
Supplementary videos
Movies
-
•
Movie S1: Sunmaid-brand raisins in a glass container, filled with Klarbrunn-brand carbonated water, perform vertical dancing and wobbling.
-
•
Movie S2: Bubble growth and coalescence, and arrival at a fluctuating steady state, on a fixed 3D-printed sphere, at an early insertion time, min. At 10x speed.
-
•
Movie S3: Bubble growth and coalescence, and arrival at a fluctuating steady state, on a fixed 3D-printed sphere, at an intermediate insertion time, min. At 10x speed.
-
•
Movie S4: For bodies with a dense array of surface bubbles, rotational freedom can be of critical importance for vertical dancing. When the body rotates at the fluid-air interface, the surface is cleared of a larger number of buoyancy-conferring bubbles, and a vertical excursion becomes far more likely.
-
•
Movie S5: The motion of nearby bodies can provide a perturbation, nudging the body to rotate and plummet.
-
•
Movie S6: The 3D-printed body dancing in carbonated water for two hours, at 4x speed.
-
•
Movie S7: Numerical simulations using the discrete bubble model explore the role of the number of bubbles, the dimensionless bubble growth rate, , and the dimensionless maximum lifting force, .
-
•
Movie S8: Bubble growth on a skewer of raisins, at 100x speed.