XXXX-XXXX
Development of fast-response PPAC with strip-readout for heavy-ion beams
Abstract
A strip-readout parallel-plate avalanche counter (SR-PPAC) has been developed aiming at the high detection efficiency and good position resolution in high-intensity heavy-ion measurements. The performance was evaluated using 115 MeV/u 132Xe, 300 MeV/u 132Sn, and 300 MeV/u 48Ca beams. A detection efficiency beyond 99% for these beams is achieved even at an incident beam intensity of 0.7 billion particles per second. The best position resolution achieved is 235 µm (FWHM).
xxxx, xxx
1 Introduction
Radioactive isotope (RI) beams are powerful tools in experimental nuclear physics. The intensity of RI beams provided by accelerator facilities such as RIBF in RIKEN riken and FRIB at Michigan State University frib , is improved year by year. The highest beam intensity is more than 106 counts per second and more exotic phenomena are now within our scope of study thanks to high-intensity RI beams. To take full advantage of these advances, the detectors used in beam experiments must have the stability to maintain high performance under the high-counting conditions.
Position-sensitive detectors play important roles not only in measuring the beam profile but also in measuring the beam momentum at a momentum-dispersive focal plane on an event-by-event basis. For in-flight position measurement of heavy ions, gas-filled detectors are widely used as beam-line detectors. A parallel-plate avalanche counter (PPAC) operated with low-pressure gas contains only counter gas and thin metal-coated electrodes, and its material thickness is quite thin and uniform. Delay-line readout of the position-sensitive PPAC dl1 ; dl2 is commonly used, and in particular, the standard for most experiments performed in RIBF. The advantage of delay-line readout is that the number of readout channels is as few as five per one set of position determination (in vertical and horizonral). In the delay-line readout PPAC (DL-PPAC), each strip is connected to the delay line and the position of a particle is proportional to the time difference between the signals read from the two ends of the delay line. Since the maximum delay time is approximately 100 ns in the standard detectors at RIBF dl2 , the non-negligible signal pileup occurs and results in lower detection efficiency for high-intensity beams such as 106 cps (counts per second), especially widely spread beams like at the momentum-dispersive focal plane.
PPAC itself has an inherently quick response time because they amplify the electrons drifting between two electrodes a few millimeters apart and the drift time of electrons is within 30 ns for the typical drift lentgh of 4 mm in the standard DL-PPAC at RIBF. Therefore, by reading signals from each strip electrode individually without using delay lines, the reduction in detection efficiency under high counting can be mitigated. In this paper, the development of the strip-readout type PPAC (SR-PPAC) is described. The goal of the development is to achieve greater than 99% detection efficiency even for the high-intensity heavy-ion beam near 106 cps, while keeping the typical position and timing resolution obtained by DL-PPACs, namely a few hundreds µm and a few hundreds ps, respectively.
The design of SR-PPAC is presented in Sec. 2. In Sec. 3 and 4, the performances evaluated in two experiments are described. The summary and conclusion are given in Sec. 5.
2 Design for strip-readout method
To achieve the required resolutions and high-counting rate simultaneously, the charge of each strip should be collected with a good charge resolution for a position determination within a strip as described below. Furthermore the charge collection and conversion should be fast enough. In general, the Charge-to-Digital Converter is adopted for obtaining charge information, but the conversion time limits the counting rate of the whole system. Pulse shape analysis of fast sampling signals is an option for an ultra-fast conversion technique. However, the cost of such conventional fast digitizers is still high. For these reasons, the Time-over-Threshold (ToT) method tot has been used in this development. The ToT method is a technique that extracts the pulse width at a certain threshold voltage, which is a monotonically increasing function of a pulse height or charge. The maximum output time duration is adjusted to be several tens of nanoseconds optimizing the pulse height threshold in an experiment.
In this section, the components and the configuration of the SR-PPAC including the readout electronics and the analysis method for the position extraction are described.
2.1 Configuration of SR-PPAC
The SR-PPAC is developed by remodeling the DL-PPAC. Table 1 shows the configurations of SR-PPACs. Two types of SR-PPAC were constructed. One is called a prototype for element development, and the other is called a standard type with a larger sensitive area which can cover the typical beam distribution at a dispersive focal plane. The electrodes and the layout is the same as a typical delay-line PPAC dl2 used in BigRIPS, RIKEN.
| Prototype | Standard | |
|---|---|---|
| Sensitive area [mm2] | 150 (X) 150 (Y) | 240 (X) 150 (Y) |
| Gap between anode and cathode [mm] | 4 | 4.3 |
| Strip width [mm] | 2.57 (X, Y) | 2.55 (X), 2.58 (Y) |
| Number of strips (channels) | 58 (X, Y) | 94 (X), 58 (Y) |
Figure 1 (a) shows a schematic view of the standard SR-PPAC’s inner structure. Newly-designed printed circuit boards (PCB) for readout from each strip are attached to the cathode foil such that metal-striped leads on the surface of the PCB are in contact with the cathode strip. Connectors for flexible printed circuits (FPC) instead of delay-line readout are mounted on the readout PCB for dealing with up to 94 ch and 58 ch for horizontal (X) and vertical (Y) directions perpendicular to the beam direction, respectively.
A signal feed-through PCB was also designed to extract the signals from the gas volume of the SR-PPAC to the outside. The feed-through PCB has surface-mounted connectors on both sides and the connectors are electrically connected using the pad-on-via technique ensuring this feed-through PCB holds vacuum. The standard-type SR-PPAC has eight surface-mount connectors (FH39A-67S-0.3HW) inside and four surface-mount connectors (QSE040-01-F-D) outside.
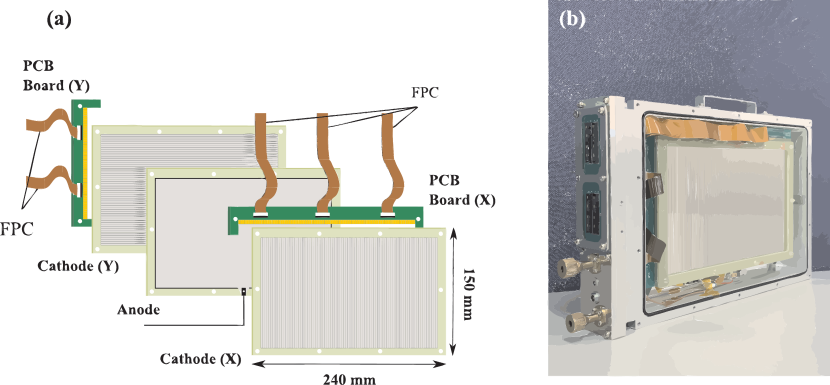
The photograph in Fig. 1 (b) shows an external view of standard-type SR-PPAC. An entrance window is removed so that the inside is visible. On the left side of the detector, there are a feed-through PCB, gas inlet and outlet, and connectors for bias voltage and the signal from the anode electrode.
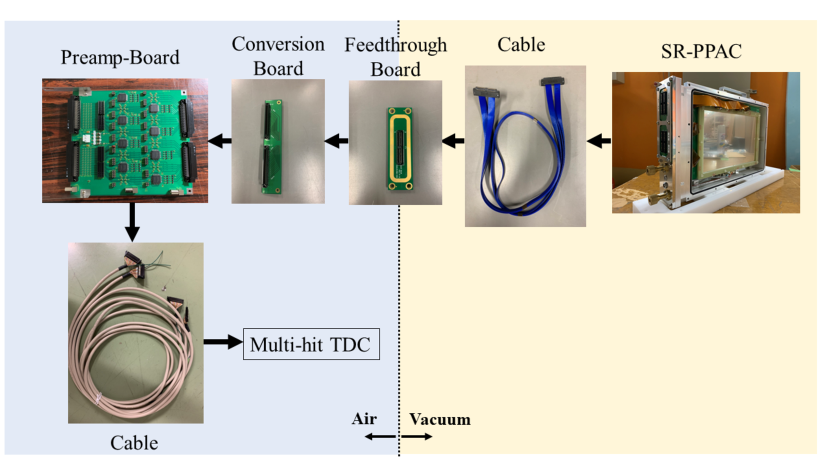
One or two SR-PPACs are typically located in large vacuum chambers. Typical signal transmission from SR-PPAC to the outside of the vacuum chamber is shown in Fig. 2. Electrical signals are transmitted to preamplifier-shaper-discriminator (ASD) boards REPIC RPA-132, products of HAYASHI-REPIC Co., Ltd repic through a feed-through flange which is mounted on the vacuum chamber at each detector site. The specification of the ASD board is provided in Table 2. A pitch convertion board was designed to adapt the ASD board to the cable connector. The analog signals are converted to logic signals by the discriminator using the ToT method. The leading and trailing edges are acquired by multihit-TDC (CAEN V1190). The threshold voltage for ToT is adjusted considering the noise level in the experimental site.
| Number of channels | 64 ch |
|---|---|
| Input charge | 0.1 pC |
| Analog output | GAIN 0.8 V/pC |
| Time constant of integrator 16 ns | |
| Threshold control voltage | - 0.6 V + 0.6 V |
| Size | 160 mm x 180 mm |
2.2 Method of position extraction
A method was developed to derive the hit position using the amount of charge, in contrast to a DL-PPAC which uses timing information.
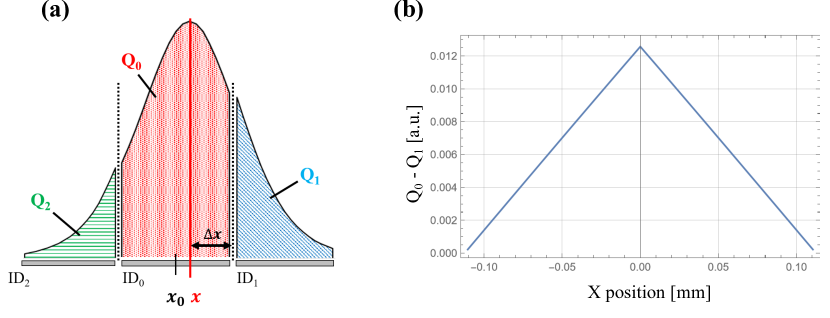
When a particle enters a PPAC, electron and ion pairs are generated along the trajectory of the particle and those electrons immediately generate an avalanche drifting from the cathode to the anode. Figure 3 (a) shows an illustration of a distribution of the induced charge on the striped cathode. ID0, ID1 and ID2 denote the index of the strip having the highest-, the second-highest, and the third-highest charged respectively. , , and denote the amount of charge of ID0, ID1, and ID2 respectively. The difference of the charges induced on two adjacent strips has a correlation with the center of mass of the charge distribution. A beam position can be determined more precisely than the strip size of about 2.6 mm by using the charge difference between two strips (). On the basis of the Townsend theory of electron avalanchetownsent , we estimated the charge distribution induced by a single point charge drifting from the cathode to the anode to illustrate this method. Figure 3 (b) shows the charge difference of and as a function of the position of the center of mass of the calculated distribution. Generally, this correlation between the position and charge difference is non-linear.
Assuming the uniform distribution of the particles hitting a strip, the integration of the distribution of can be written down as a single-valued function of the position distribution between the center of a strip and an edge of a strip. The distance between the beam position and the edge of a strip () can be calculated as follows:
| (1) |
| (2) |
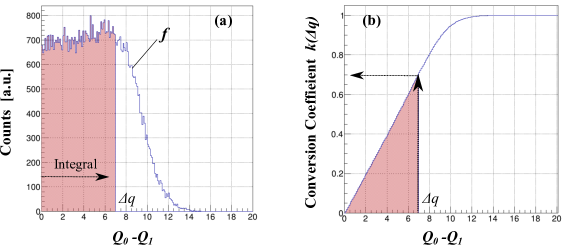
where is strip width, is a conversion coefficient which is a function of , is the maximum value of the charge difference, and is a distribution of charge differences between two strips, which is practically obtained from a measurement in the analysis. Figure 4 (a) shows distribution obtained from the measured charge of all strips hit by particles. The conversion coefficient shown in Fig. 4 (b) provides a lookup table for position information from the charge information. In the case that a beam arrives at the center of a strip, will be or will be zero, and when a beam arrives at the edge of a strip, will be zero or will be the half size of a strip. Using Eq. (1) and (2), the beam position can be numerically obtained without considering an exact form of the function to convert from charge to position. Finally, the beam position will be given by the following equation:
| (3) |
where is the central position of a strip which has the highest charge . The plus or minus sign in Eq. (3) is determined depending on which side of ID0 a beam passed through, namely the position of the ID1.
The charge difference used to deduce the position does not have to be . For example, it is possible to use the charge difference between and the charge on the left or right side of ID0. The impact of the charge difference on position resolution is discussed in Sec. 3.4.
3 Proof of the principle in the position extraction method for SR-PPAC
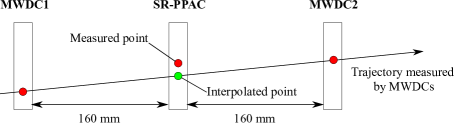
The first attempt to extract the charge from each strip and to evaluate the performance of the position extraction method was performed by bombarding the prototype SR-PPAC with a beam of 132Xe at 115 MeV/u at HIMAC in Chiba, Japan (the experiment number 15H307). Counter gas was -C4H10 and the two different pressure, 10 Torr and 5 Torr, were tested to evaluate the efficiency. The experimental setup is shown in Fig. 5. Two low-pressure multi-wire drift chambers (LP-MWDCs) lpmwdc were placed as reference detectors and the prototype SR-PPAC was placed between them. We evaluated the detector performance, in particular detection efficiency, position resolution, and tracking efficiency.
Note that notations of charge such as and described in Sec. 3 and Sec. 4 represent a time duration of a signal measured using ToT method and the units are nanoseconds.
3.1 Detection efficiency
The detection efficiency of SR-PPAC was defined by the following equations:
| (4) |
| (5) |
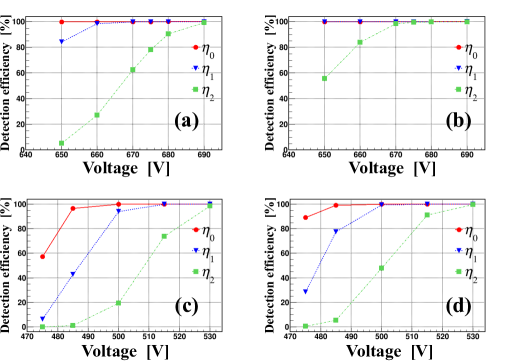
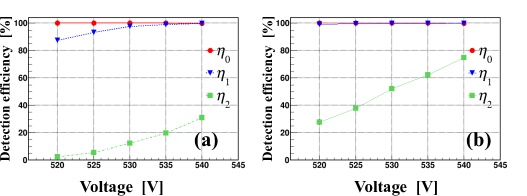
where , , and represent number of events in plane and plane in SR-PPAC, and number of events in two LP-MWDCs, respectively. The index correnponds to ID0, ID and ID2. For instance, is the ratio of the number of hits in strips with the highest charge to the number of hits in the MWDCs. Figure 6 shows the detection efficiency as a function of applied anode bias. As mentioned in Sec. 2.1, and are necessary for position extraction in SR-PPAC. The detection efficiency of is more than 99 % at an anode bias of 670 V in 10 Torr and 515 V in 5 Torr.
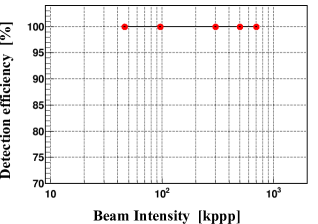
In Fig. 7, the detection efficiency of (which requires the existence of the ) is plotted as a function of the beam intensity. The SR-PPAC was operated at 525 V in 5 Torr. Even for a beam of 700 kppp (ppp: particles per pulse), the detection efficiency is more than 99%. Note that the beam size at the SR-PPAC was mm.
3.2 Position resolution
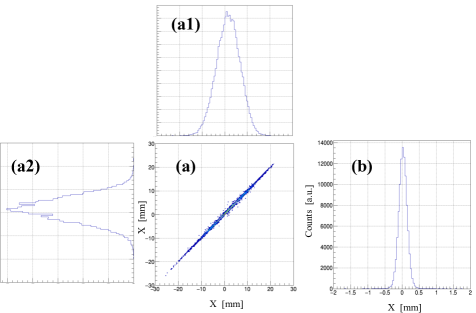
Position resolution of SR-PPAC was evaluated by using the difference of a beam position measured by SR-PPAC and a position interpolated by tracking using two LP-MWDCs as illustrated in Fig. 5. Figure 8 shows the distributions of the position measured by SR-PPAC, interpolated position, and their difference. The position resolution of SR-PPAC is calculated by the following equation:
| (6) |
where , , and means the position resolution of SR-PPAC and LP-MWDC, and standard deviation of the distribution of the difference, respectively. was deduced by using the average value of the unbiased variance of the position at each plane of LP-MWDC.
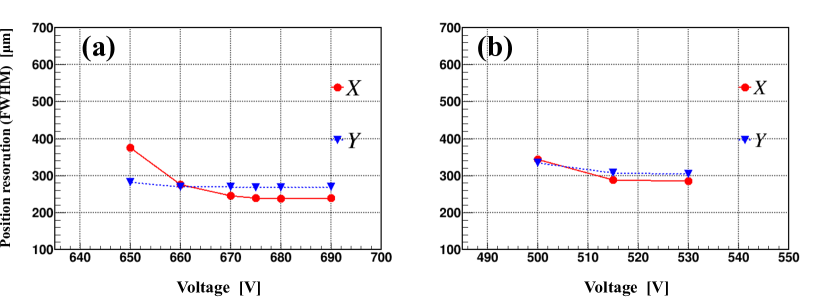
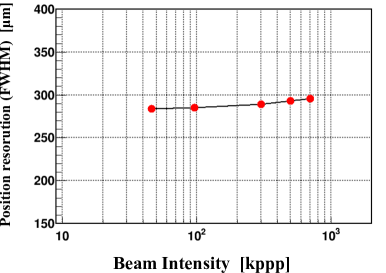
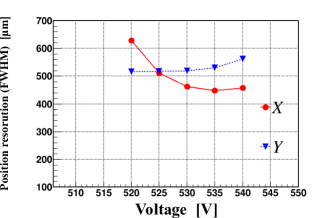
The position resolution of SR-PPAC as a function of applied anode bias is shown in Fig. 9. The bias dependence of the position resolution is similar to that of the detection efficiency of . The resolution is almost constant at the bias region where efficiency is greater than 99%. The best position resolution was 239 µm (FWHM) for 10 Torr, and 285 µm (FWHM) for 5 Torr. Figure 11 shows the beam intensity dependence of the position resolution. The position resolution for 700 kppp achieved 295 µm (FWHM).
3.3 Tracking efficiency
The tracking efficiency was defined as follows:
| (7) |
where and represent effective number of events within 3 for position resolution of SRPPAC ( = standard deviation) and number of events in two LP-MWDCs, respectively.
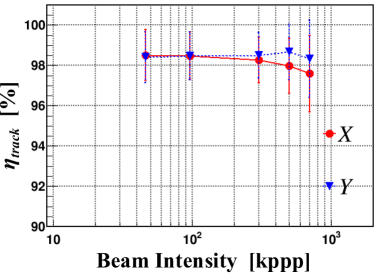
Fig. 11 shows the beam intensity dependence of the tracking efficiency. For a beam with an intensity of 700 kppp, tracking efficiency was 97% for a single cathode plane.
3.4 Position dependence of the resolution
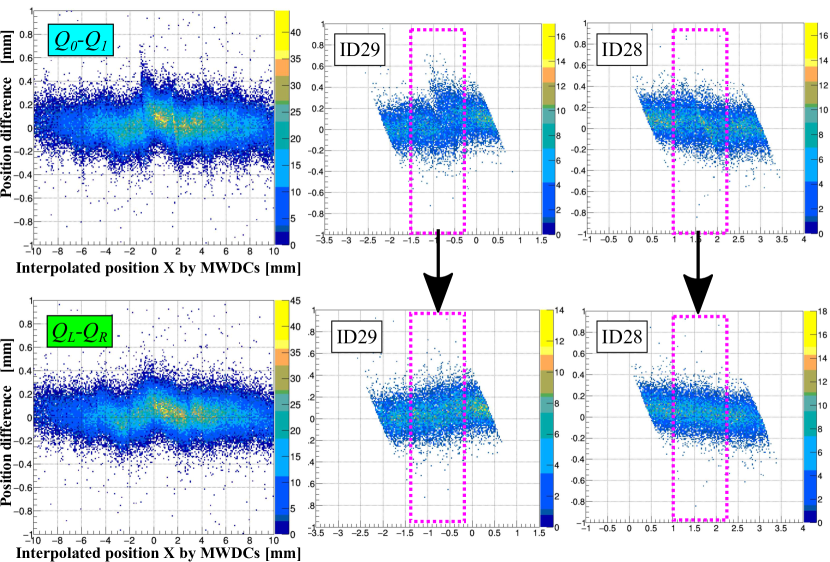
The average resolution was mentioned in the previous section, however the position resolution was not uniform across the entire strip width. In Fig. 12, the horizontal axis represents the interpolated position by tracking using LP-MWDCs and the vertical axis represents the position difference between SR-PPAC and the interpolated position. The width of the distribution along the vertical axis corresponds to the position resolution. The middle and right figures are distributions of selected strips around the central axis. The top three figures are the results calculated using the method described in Sec. 2.1, which uses the difference between and . As seen in the figure, the resolution at the center of a strip is poorer than the edge of a strip, and the distribution is not continuous. When a beam bombards close to the center of a strip, and are almost equal. Therefore, it is difficult to determine the true strip of owing to the fluctuations.
This problem can be improved by selecting proper combination of strips to take the charge difference. The charge deposited in the strip to the left (right) of the central strip shall be denoted as (). The charge difference between and () is useful. When a hit position goes from the right to left of a strip, the amount of charge of the strip on the left side is small and the resolution gets worse in the case that the position calclated by using . Using the difference between the charge of the central strip and the right side strip (), the position dependence of the resolution is reverse. Therefore, taking the average of position determined using the charge of the left strip and the right strip, weighted by charge, the position dependence of the resolution will be improved.
| (8) |
where and represent the charge of a strip on the left and right side of strip with ID0. and represent position calculated using and , respectively. The lookup tables for calculating and were created separately for each. The three figures at the bottom of Fig. 12 show the distributions calculated by this method. The position dependence is improved and overall resolution improved by approximately 10 µm (). The futher correction to improve the position dependence of the accuracy will be required when the precise position determination is required by the specific physics case. That may be solved by the charge calibration of ToT, which is the future study.
3.5 Strip size dependence
We also tested the prototype SR-PPAC with strip width of 5.14 mm to investigate the strip size dependence. It is expected that the position resolution depends on the strip width. In this study, a PCB board to combine charge from two strips was made.
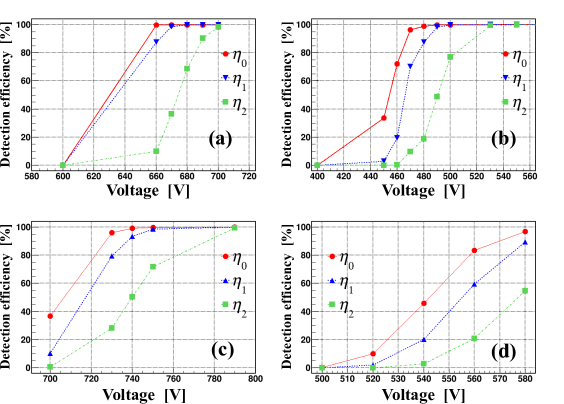
Figure 13 shows the detection efficiency of the strip size of 5.14 mm. The amount of charge collected from a strip depends on the strip size and the size of charge distribution on the cathode. efficiency is enough but efficiency is not sufficient because the amount of is dramatically decreased in the case of 5.14 mm.
Figure 14 shows the position resolution of the strip size of 5.14 mm as a function of applied bias. The best resolution achieved was 457 µm (FWHM) which is significantly worse than that with 2.57 mm strips.
Considering Eq. (1), the strip size explicitly propagates the position resolution thereby the smaller strip size has the better position resolution. However, the smaller strip size has the smaller induced charge on the strip and the signal-to-noise ratio gets poorer. To optimize the strip size for the strip-readout method, a simulation study will be desirable.
4 Test experiment for Standard SR-PPAC at RIBF
In this section, the performance of a standard SR-PPAC tested with continuous beams provided at the RI beam factory in RIKEN, japan was described. We implemented a standard SR-PPAC to BigRIPS separator in RIBF as a beamline detector for a physics experiment. Two SR-PPACs were installed at focal plane F5, which is a momentum-dispersive focal plane (the layout of the beamline is shown in Fig. 8 of Ref. bigrips ). The beams were 132Sn and 48Ca with energy of approximately 300 MeV/u. Counter gas was C4H10 and the pressure values to be tested were 10 and 4 Torr. For the evaluation of the detection efficiency, we used the number of events in CVD diamond detectors dia placed at F3 and F7 focal planes. The detection efficiency of SR-PPAC was calculated as following equations:
| (9) |
where mean number of events detected in SR-PPAC, and means the number of events in both diamond detectors at F3 and F7, respectively. The index correnponds to ID0, ID and ID2. Figure 15 shows the detection efficiency of X-plane as a function of an applied anode bias for 132Sn and 48Ca. For 132Sn, SR-PPAC can achieve more than 99% efficiency in both 10 Torr and 4 Torr. For 48Ca the pressure of 4 Torr was not enough for desired electron multiplication. Applying 600 V at pressure 4 Torr, the SR-PPAC discharged. Therefore we operated SR-PPACs in 10 Torr for the 48Ca beam.
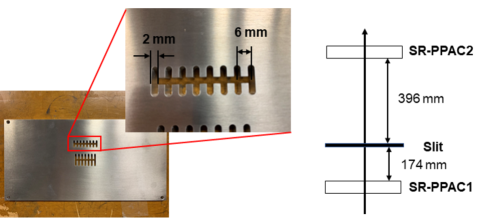
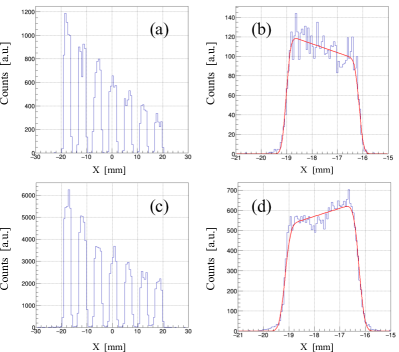
To evaluate the position resolution, we used a fishbone slied made of a stainless steel plate slit shown in Fig. 16 since the reference detectors cannot be installed due to the limitation by the physics experiment. The width and pitch of the slit were 2 mm and 6 mm, respectively. An image of the slit using the beam positions detected by the two SR-PPACs was reconstructed. The beam position at the interpolated position of the slit as shown in Fig. 17(a) and (c). The sharpness of the slit image is evaluated by the fitting the error function, i.e., the convolution of the rectangular distribution and the gauss distribution. The position resolutions of two SR-PPACs are assumed to be same.
Figure 17(b) and (d) show the fitting result for 132Sn and 48Ca beam distributions, respectively. The most left slit in each image has been used since it has the largest statistics. The operation bias was 515 V in 4 Torr for 132Sn, and 740 V in 10 Torr for 48Ca, which were required by the physics measurement. The evaluated spatial resolution was 318 µm (FWHM) for 132Sn and 400 µm (FWHM) for 48Ca. Considering the detection efficiency shown in Fig. 15, a better resolution is expected by applying 760 V for 48Ca beam.
The time resolution of the SR-PPAC was also evaluated. PPAC can determine the timing of beams unlike MWDC because the drift time between the cathode and anode is assumed to be common for all the particles and the resulting detection time has only a common offset. The rise time of the electron signal is about 10 ns and we expected a good time resolution for SR-PPAC owing to its fast response. Since the distances between SR-PPAC and each diamond detector placed at F3 and F7 focal planes are the same, the time resolution of SR-PPAC was calculated using the difference of timing in SR-PPAC and the averaged timing of two diamond detectors as the following equation:
| (10) |
where , , and represent the dispersion of the distribution of the difference of timings in SR-PPAC and diamond detector, the time resolution of the diamond detector, and the time resolution of SR-PPAC, respectively. We evaluated each electrode and the timing of SR-PPAC is determined as the timing of ID0 for the cathode. The diamond detector consists one pad on one side and four strip on the other side. In this measurment, the time resolution of each diamond detector was deduced by the difference between the timing collected from the four corners of the pad. The typical resolution of the diamond detector was 15 ps ().
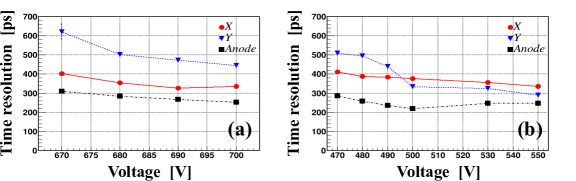
The time resolutions as a function of applied bias are shown in Fig. 18. When the bias is larger, the rise time of the analog signal gets sharp giving rise to the better time resolution. There is a difference in the resolution of each electrode. The time resolution of the anode plane, which has the largest deposited charge, was 260 ps ().
5 Summary and prespectives
We have developed a strip-readout PPAC (SR-PPAC) with a fast response and a good position resolution for heavy ions. The SR-PPAC realizes the high detection efficiency with direct readout of charge from each strip of cathode and the charge information is acquired by using the Time-over-Threshold method. The detection efficiency was 99% for 115 MeV/u 132Xe with the intensity of 700 kppp, 300 MeV/u 132Sn with 770 kHz and 300 MeV/u 48Ca with 770 kHz. SR-PPACs worked stably and kept high detection efficiency even for high-intensity beams with about 700 kHz over 120 hours.
By using a lookup table of the charge difference between two strips to the beam position, position resolution was considerably smaller than the strip size. The position resolution was 239 µm (FWHM) for 132Xe with intensity of 45 kppp, and 289 µm (FWHM) with intensity of 700 kppp. The results indicate that the position resolution of a SR-PPAC is comparable to a LP-MWDC for heavy-ion beams.
The dependence of strip size on the position resolution will be studied using a simulation, especially for smaller strip size. The time resolution of SR-PPAC was 260 ps (). Factors contributing to in the time resolution will also be evaluated by the simulation, important in accessing the timing applications of these detectors
Acknowledgment
The work was led as part of a research project with Heavy Ions at NIRS-HIMAC. A part of the experiments was performed at RI Beam Factory operated by RIKEN Nishina Center and CNS, the University of Tokyo. The authors acknowledge the accelerator staff at HIMAC and RIKEN for providing excellent quality beams and their stable operation of the accelerators. This work was supported by JSPS KAKENHI Grant Number JP16H06003, RIKEN Junior Research Associate Program, and Quantum Science and Technology Fellowship Program.
References
- (1) T.Kubo,et al., Prog. Theor. Exp. Phys. 2012, 03C003 (2012). https://doi.org/10.1093/ptep/pts064
- (2) M.Hausmann, et al., Nucl. Instrum. Meth. B, 317, (2013) 349-353. http://dx.doi.org/10.1016/j.nimb.2013.06.042
- (3) H.Kumagai, et al., Nucl. Instrum. Meth. A, 470, (2001) 561. https://doi.org/10.1016/S0168-9002(01)00804-X
- (4) H.Kumagai, et al., Nucl. Instrum. Meth. B, 317, (2013) 717. http://dx.doi.org/10.1016/j.nimb.2013.08.050
- (5) I.Kipnis, et al., IEEE Trans. On Nucl. Sci.,vol. 44, No. 3, 289-297. https://doi.org/10.1109/23.603658
- (6) H.Miya, et al., Nucl. Instrum. Meth. B, 312, (2013) 701. http://dx.doi.org/10.1016/j.nimb.2013.08.018
- (7) HAYASHI-REPIC,RPA-132 64ch CHAMBER PREAMP CARD, https://www.h-repic.co.jp/products/wirechamber/special_order/rpa_132.
- (8) J.S.Townsend, Phil. Mag. 6-1, (1901) 198. https://doi.org/10.1080/14786440109462605
- (9) T.Kubo, Nucl. Instrum. Meth B, 204, (2003) 97. https://doi.org/10.1016/S0168-583X(02)01896-7
- (10) M.Kanazawa, et al., Nucl. Phys A, 746, (2004) 393. https://doi.org/10.1016/j.nuclphysa.2004.09.083
- (11) S.Michimasa, et al., Nucl. Instrum. Meth. B 317, (2013) 710. http://dx.doi.org/10.1016/j.nimb.2013.08.055