Supplementary Information
I Variable Temperature NMR Probe
The NMR probe used for the cryogenic experiments is a dual channel probe designed by NMR Service GmbH for a resonance frequency of 457 MHz. The probe is constructed from non-magnetic stainless steel and brass, and is fitted with a Cernox temperature sensor. The circuit has a single RF coil in the form of a solenoid, wound from silver-coated copper wire. The broadband channel uses two Sprague-Goodman trimmer capacitors while the channel uses a Voltronics trimmer capacitor and a PTFE/air transmission line of variable length for the tuning and matching components. An additional high-frequency coil can be fitted to the broadband channel to increase its tuning range. A photograph of the probehead is presented in Figure S.1.
To test the performance of the NMR probe and cryogenic setup, reference NMR spectra were acquired at various temperatures between 15 and 260 K. No attempt was made to re-shim between temperature points. The sample used was 0.25 mbar of gas, flame sealed in a borosilicate tube of 4 mm outer diameter and 2 mm inner diameter. NMR spectra were acquired with 8 scans and a 60 s recycling delay and are shown in Figure S.2. The integrated areas display the expected Boltzmann temperature dependence. The spectra in the figure have been normalised with respect to peak height for clarity. A relatively narrow peak of 0.4 ppm in linewidth is obtained. Below 40 K, some distortion in the lineshape is seen and a shoulder develops near the base of the spectrum. The width of this shoulder increases as the temperature is further decreased, and reaches about 2 ppm at 15 K. This lineshape distortion is negligible compared to the widths of the spectra obtained at the corresponding temperatures. Note that the shift of 0.6 ppm observed for the gas signal between 15 K and 258 K is much less than the shift of 8 ppm observed for the resonance in (Figure 3 of the main manuscript).
II X-ray Diffraction
The crystallographic purity of the synthesised samples (with filling factor) was verified using powder X-ray diffraction. Measurements were carried out using a Rigaku X-ray diffractometer. Samples from the same synthesis batch as the NMR sample were packed in standard borosilicate capillaries and sealed with epoxy under inert atmosphere. Sample masses of mg were used, and a representative pattern is shown in Figure S.3. The measured pattern appears to match well with known literature [1] for with very few spurious peaks, indicating that the sample is of high purity and contains negligible amounts of residual and other impurities. The absence of an amorphous signature near of indicates the very high crystallinity of the sample. Since no significant difference was observed between the material containing endohedral and empty-cage material, the patterns were matched using Rigaku’s PDXL-2 software against data for empty-cage from a standard database.
III Rubidium-87 NMR
A NMR spectrum of the sample was acquired at 298 K using a Hahn echo sequence with a nutation frequency of 50 kHz and a full echo delay of 200 , and is presented in Figure S.4. The central transitions of the three sites known in [2], two tetrahedral (T, T’) and one octahedral (O), are marked on the spectrum. No additional features from other compositions of with x not equal to 3 are observed. The observed NMR spectrum is in good agreement with previous literature report for [2].
IV Magnetometry
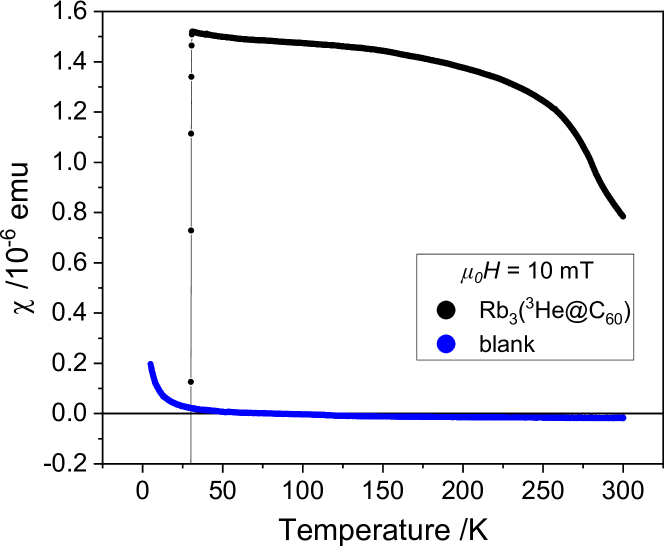
To ensure that the sample susceptibility as measured by MPMS is not significantly affected by contributions from the glass sample holder, a reference measurement was performed on a blank sample holder of the same geometry as the sample, sealed under 0.25 bar of gas. The resulting susceptibility is presented in Figure S.5 along with the sample susceptibility measured at the same applied field of 10 mT. While the glass has some measurable susceptibility, this is rather small when compared to the sample the normal state, and negligible when compared to the superconducting state.
V RAS NMR
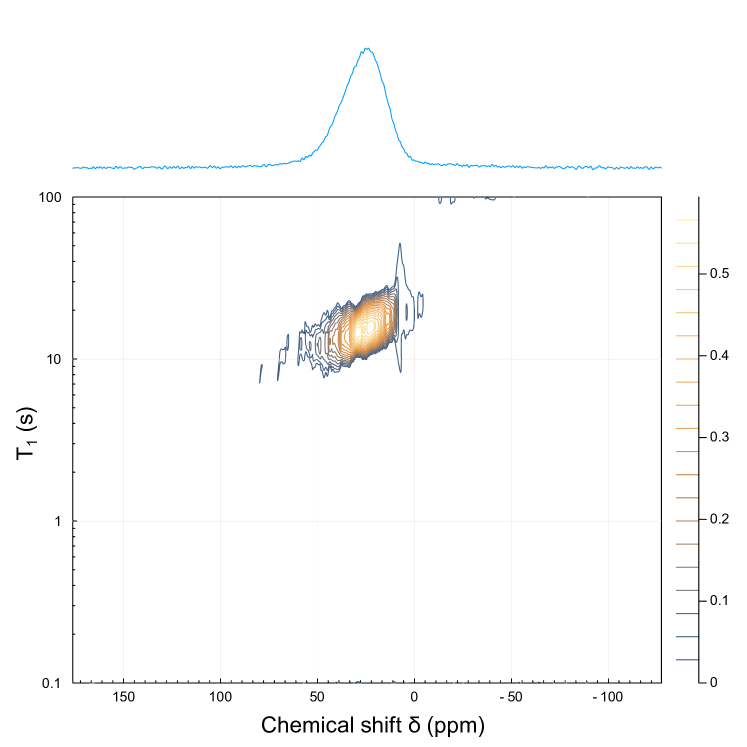
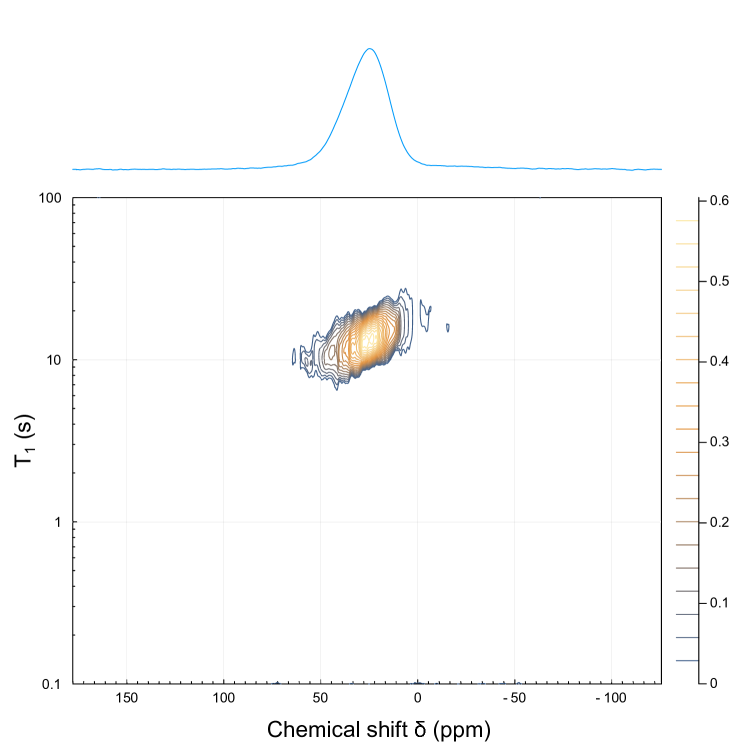
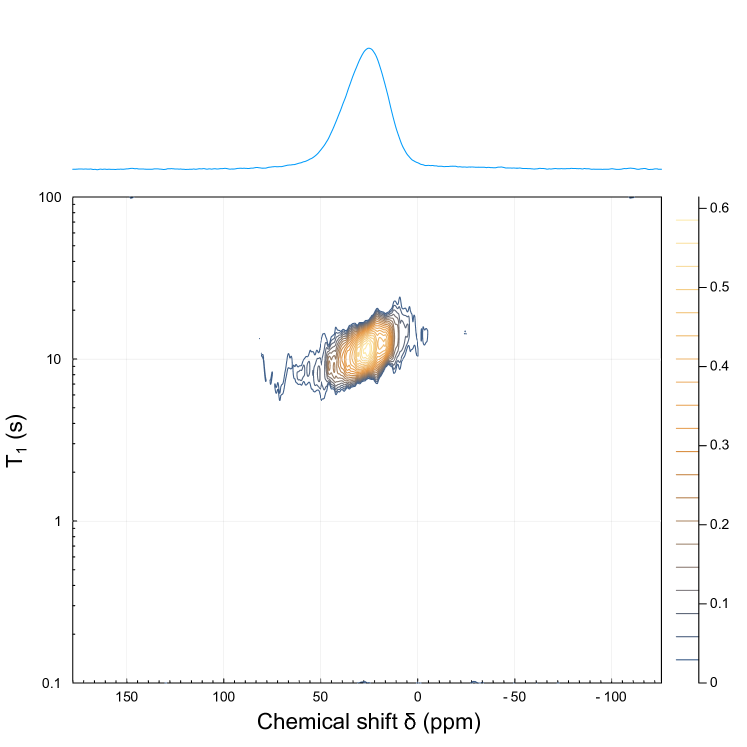
relaxation-assisted separation (RAS) NMR spectra of , as described in section 3.3 of the main text, are presented at 30 K, 35 K and 40 K below. The is seen to depend on spectral position, to a similar extent as seen at 60 K in figure 7 of the main text.
References
- [1] Zhou, O., Cox, D.E.: Structures of C60 intercalation compounds. Journal of Physics and Chemistry of Solids 53(11), 1373–1390 (1992). https://doi.org/10.1016/0022-3697(92)90233-4
- [2] Zimmer, G., Helmle, M., Mehring, M., Rachdi, F., Reichenbach, J., Firlej, L., Bernier, P.: Analysis of 87Rb and 13C Hyperfine Interaction in Rb3C60. Europhysics Letters (EPL) 24(1), 59–64 (1993). https://doi.org/10.1209/0295-5075/24/1/010