Ground-based and JWST Observations of SN 2022pul:
I. Unusual Signatures of Carbon, Oxygen, and Circumstellar Interaction in a Peculiar Type Ia Supernova
Abstract
Nebular-phase observations of peculiar Type Ia supernovae (SNe Ia) provide important constraints on progenitor scenarios and explosion dynamics for both these rare SNe and the more common, cosmologically useful SNe Ia. We present observations from an extensive ground-based and space-based follow-up campaign to characterize SN 2022pul, a “super-Chandrasekhar” mass SN Ia (alternatively “03fg-like” SN), from before peak brightness to well into the nebular phase across optical to mid-infrared (MIR) wavelengths. The early rise of the light curve is atypical, exhibiting two distinct components, consistent with SN Ia ejecta interacting with dense carbon-oxygen rich circumstellar material (CSM). In the optical, SN 2022pul is most similar to SN 2012dn, having a low estimated peak luminosity ( mag) and high photospheric velocity relative to other 03fg-like SNe. In the nebular phase, SN 2022pul adds to the increasing diversity of the 03fg-like subclass. From 168 to 336 days after peak -band brightness, SN 2022pul exhibits asymmetric and narrow emission from [O I] , 6364 ( km s-1), strong, broad emission from [Ca II] , 7323 ( km s-1), and a rapid Fe III to Fe II ionization change. Finally, we present the first-ever optical-to-mid-infrared (MIR) nebular spectrum of an 03fg-like SN Ia using data from JWST. In the MIR, strong lines of neon and argon, weak emission from stable nickel, and strong thermal dust emission (with K), combined with prominent [O I] in the optical, suggest that SN 2022pul was produced by a white dwarf merger within carbon/oxygen-rich CSM.
1 Introduction
Type Ia supernovae (SNe Ia) are standardizable candles via the strong and well-studied correlations of their luminosities with their light-curve shapes and colors (Phillips, 1993; Tripp, 1998). Because of this, and their intrinsically high luminosities, they are excellent cosmological distance indicators and have been used to show that the expansion of the Universe is accelerating (Riess et al., 1998; Perlmutter et al., 1999).
Despite their extensive cosmological use, no consensus exists as to what progenitor systems and explosion mechanisms can explain the majority of “normal” SNe Ia — those used for cosmological analyses. The debate is primarily centered around two broad classes of binary systems, the single-degenerate (SD) and double-degenerate (DD) channels. In an SD progenitor system, one possible pathway is when a carbon-oxygen (C/O) white dwarf (WD) reaches near the “Chandrasekhar mass” (, Chandrasekhar 1931) by accreting from a nondegenerate star such as a giant, subgiant, main-sequence, or subdwarf star (Whelan & Iben, 1973), achieving the central densities and temperatures needed to ignite runaway carbon burning (Seitenzahl et al., 2013; Branch & Wheeler, 2017; Kerzendorf et al., 2017). In a DD progenitor system, the explosion can occur via the merger of two WDs (Iben & Tutukov, 1984; Webbink, 1984). In the latter system, the explosion may occur “violently” during the merger (Pakmor et al., 2010, 2012) or be significantly delayed, resulting in an explosion long after disruption of the secondary WD (Raskin & Kasen, 2013; Dan et al., 2014). Schwab et al. (2016) showed that merger remnants in excess of may not achieve the densities necessary for an explosion and instead will collapse to a neutron star, and Dan et al. (2014) found that only the most massive mergers () would lead to a detonation.
An alternative explosion mechanism in either the SD or DD progenitor systems is a “double detonation” where a surface He layer explosively burns, causing a second explosion in the interior of the WD (Woosley & Kasen, 2011; Nomoto & Leung, 2018; Polin et al., 2019). This provides a potential pathway for the detonation of sub- WDs. Some studies have found that double detonations of sub- WDs in DD systems with little to no He on their surface can explain the observed properties of normal SNe Ia (Shen & Moore, 2014; Townsley et al., 2019; Leung & Nomoto, 2020).
Several WD explosions, including subclasses of SNe Ia, do not follow the tight relationships between luminosity, light-curve shape, and color (for reviews, see Taubenberger, 2017; Jha et al., 2019; Ashall et al., 2021). The unique characteristics of these extreme thermonuclear SN classes can inform progenitor models of normal SNe Ia, and potential sources of contamination in samples used to measure cosmological distances.
One particularly important peculiar class is the rare, carbon-strong, high-luminosity or “03fg-like” SNe that occupy the brightest end of SNe Ia (Howell et al., 2006; Hicken et al., 2007; Yamanaka et al., 2009; Tanaka et al., 2010; Scalzo et al., 2010; Silverman et al., 2011). This class is differentiated from normal SNe Ia by their relatively high luminosities (ranging from to mag), strong and persistent C II absorption at early phases, low photospheric velocities (Howell et al., 2006), rapidly evolving early-time light-curve bumps (Jiang et al., 2021; Srivastav et al., 2023; Dimitriadis et al., 2023), delayed times of -band peak brightness relative to -band peak brightness (Ashall et al., 2020), faster optical fading at late times coincident with excess emission in the near-infrared (NIR), and low-ionization-state nebular spectra including strong [Ca II] emission (and in some cases [O I]; Kromer et al. 2016; Dimitriadis et al. 2023; Siebert et al. 2023).
If powered by the radioactive decay of 56Ni alone, the optical light curves of these SNe suggest an explosion that produced an ejecta mass larger than (Howell et al., 2006; Scalzo et al., 2010; Dimitriadis et al., 2022). Like normal SNe Ia, both SD and DD channels have been proposed as potential origins of these events. In the SD scenario, a possible interpretation was the explosion of a WD that is supported by rapid rotation (Yoon & Langer, 2005). It is possible that the higher binding energy of a massive WD would result in lower ejecta velocities (Howell et al., 2006), but this has not yet been realized in simulations. In particular, the high ejecta velocities produced by models of rapidly-rotating massive WD progenitors (Maeda & Iwamoto, 2009; Hachinger et al., 2012a; Fink et al., 2018) are in conflict with the observed absorption velocities of 03fg-like SNe Ia at early times. In the DD scenario, a total ejecta mass greater than can be naturally explained by the merger of two sub- C/O WDs ( M☉ for each). In this scenario, the tidal disruption of the secondary WD could lead to the the formation of a disk or shell of C/O-rich material (Raskin & Kasen, 2013).
The presence of dense pre-existing or newly ejected material in the vicinity of the explosion can explain several observed properties of 03fg-like SNe Ia. The rapid early light-curve bumps seen for three events (Jiang et al., 2021; Srivastav et al., 2023; Dimitriadis et al., 2023) may result from the initial interaction with this circumstellar material (CSM). Alternatively, prolonged interaction can increase the peak luminosity beyond a typical SN Ia (Hicken et al., 2007; Hachinger et al., 2012a; Taubenberger et al., 2013b; Noebauer et al., 2016). The spectra of the 03fg-like SN 2020esm obtained only days after explosion displayed only C and O features, suggesting a predominantly C/O atmosphere in the outermost layers of the ejecta, consistent with swept-up C/O-rich CSM (Dimitriadis et al., 2022). The deceleration of the ejecta by C/O-rich CSM helps to explain the low ejecta velocities at peak and the persistent C II lines. Additionally, the rapid optical fading (Taubenberger et al., 2019; Dimitriadis et al., 2022) coincident with a NIR excess at late times was observed for SN 2012dn (Yamanaka et al., 2016; Nagao et al., 2017, 2018); it is potentially explained by the formation of dust in the SN ejecta, but the origin of the dust is still controversial.
Multiple avenues have been proposed to explain the presence of this CSM. In a DD scenario, H/He-poor (and C/O-rich) CSM could be produced via the dynamical interaction of two WDs (Raskin & Kasen, 2013). Tidal stripping of the secondary star during a merger could leave unburned, H/He-poor material in the vicinity of the progenitor system prior to explosion. This scenario has been favored in several studies of 03fg-like SNe Ia (Dimitriadis et al., 2022; Srivastav et al., 2023; Siebert et al., 2023). Alternatively, the CSM may be explained by the C-rich envelope of an asymptotic giant branch (AGB) star. The progenitor system proposed in this case (the “core-degenerate” scenario) instead requires the explosion of a near- C/O WD (Kashi & Soker, 2011; Hsiao et al., 2020; Lu et al., 2021).
Neither of these scenarios can provide a perfect match to all observed properties of 03fg-like SNe. In particular, a merger of two WDs is an inherently asymmetric scenario and is expected to produce large levels of continuum polarization (Bulla et al., 2016), in contrast to the low continuum polarization observed for both SN 2007if and SN 2009dc, suggesting more spherical explosions (Tanaka et al., 2010). An SN Ia explosion within the envelope of an AGB star should exhibit a prolonged interaction phase producing excess X-ray and ultraviolet (UV) luminosity at later times (Hsiao et al., 2020), which is not seen. Additionally, we have not yet observed narrow H/He emission which would be expected from the interaction of the ejecta with the envelope of the AGB star (Kashi & Soker, 2011; Hsiao et al., 2020; Lu et al., 2021). However, this may be possible if the H/He was lost in a superwind phase prior to the explosion. Another distinction between these models is that a Chandrasekhar-mass WD would be expected to undergo high-density burning and produce more stable nickel (Höflich et al., 1996; Iwamoto et al., 1999; Seitenzahl et al., 2013). The presence of [Ni II] is especially difficult to constrain in optical nebular spectra of 03fg-like SNe because this feature is heavily blended with the often very strong emission from [Ca II].
One important clue to the origin of these enigmatic SNe is the presence of [O I] emission in several of their nebular spectra. Understanding oxygen emission in WD SNe is difficult since it requires knowing whether the origin of the emitting material is from an unburned part of the WD or produced during carbon burning. Currently, late-time [O I] emission has only been observed in rare subclasses of SNe Ia. Specifically, narrow [O I] emission has been observed in the low-luminosity SN 2002es-like (Ganeshalingam et al., 2012) SNe 2010lp and iPTF14atg (Kromer et al., 2016). This was attributed to the violent merger of two WDs since the presence of oxygen at low velocities is a natural prediction of these models (Pakmor et al., 2012; Mazzali et al., 2022). [O I] emission has also been observed (Prentice et al., 2022) in low-luminosity “Ca-rich SNe” (Filippenko et al., 2003), which may also originate from DD scenarios (Shen et al., 2019; Jacobson-Galan et al., 2019; Zenati et al., 2023).
Finally, 03fg-like SNe are a diverse subclass. These SNe cover a large range of peak luminosities which are not correlated with their light-curve shapes (Ashall et al., 2021). Their late-time light curves experience faster decline rates that begin at various epochs, and emission features in their nebular spectra vary greatly in their strength, width, symmetry, and velocity offset (Siebert et al., 2023). A viable progenitor scenario should be able to explain this diversity.
Here, we present results from an extensive ground- and space-based follow-up campaign to observe the 03fg-like SN Ia 2022pul. This SN was discovered on 28 July 2022 (UTC dates are used throughout this paper) by the All-Sky Automated Survey for Supernovae (ASAS-SN; Shappee et al. 2014). The host galaxy, NGC 4415, has a redshift of (François et al., 2019) and a distance of 16 Mpc (see Section 2.2). Like other 03fg-like SNe, this SN has a large spatial offset from its host galaxy, possibly indicating that it could have originated in a low-metallicity environment (Khan et al., 2011). SN 2022pul was quickly classified as an SN Ia by the Spectroscopic Classification of Astronomical Transients (SCAT) Survey (Tucker et al., 2022b) on 1 Aug. 2022.
This paper is organized as follows. In Section 2 we present our photometric and spectroscopic time series of SN 2022pul. We then show the first continuous optical to mid-infrared (MIR) spectrum of an 03fg-like SN Ia achieved through observations from JWST (Cycle 1 GO-2072; PI S. W. Jha). In Section 3 we compare the properties of SN 2022pul to those of other peculiar SNe Ia and compare to models. This SN adds to the growing diversity of 03fg-like SNe Ia. Our early multiband light curves exhibit an initial rise that deviates from a smooth evolution, indicative of CSM interaction. Our late-time optical spectroscopic sequence reveals a quickly changing ionization state, strong and broad emission from [Ca II], and unprecedented narrow emission from [O I]. Asymmetric nebular emission profiles are observed in both the optical and NIR. In the MIR, we observe low-ionization nebular emission lines, and a strong thermal ( K) dust continuum. Our data are consistent with an asymmetric explosion that did not occur within a pristine environment. These results are discussed in detail in Paper II (Kwok et al., 2023a) and Paper III (Johansson et al., 2023).
2 Observations & Data Reduction
2.1 Photometry
We first gathered photometric observations of SN 2022pul through our own collaborations. This includes data obtained with the Sinistro cameras of the Las Cumbres Observatory (LCO; Brown et al. 2013) network of 1 m telescopes through the Global Supernova Project (GSP). The Sinistro images were processed with a dedicated python/pyraf pipeline (Valenti et al., 2016)111https://github.com/LCOGT/lcogtsnpipe.
We then obtained additional photometry from public databases. These sources include ASAS-SN (Shappee et al., 2014), forced photometry from the Asteroid Terrestrial impact Last Alert System (ATLAS; Tonry et al. 2018; Smith et al. 2020) in the cyan and orange bands, the Zwicky Transient Facility (ZTF; Bellm et al. 2019), and the American Association of Variable Star Observers (AAVSO; Observations from the AAVSO International Database222https://www.aavso.org). ZTF photometry was obtained with the wide-field camera on the 1.2 m Samuel Oschin (P48) Telescope in and filters. AAVSO photometry was obtained by the Remote Observatory Atacama Desert (ROAD), which consists of a 0.4 m /6.8 Optical Dall-Kirkham (ODK) telescope with an FLI ML16803 CCD and Astrodon photometric filters.
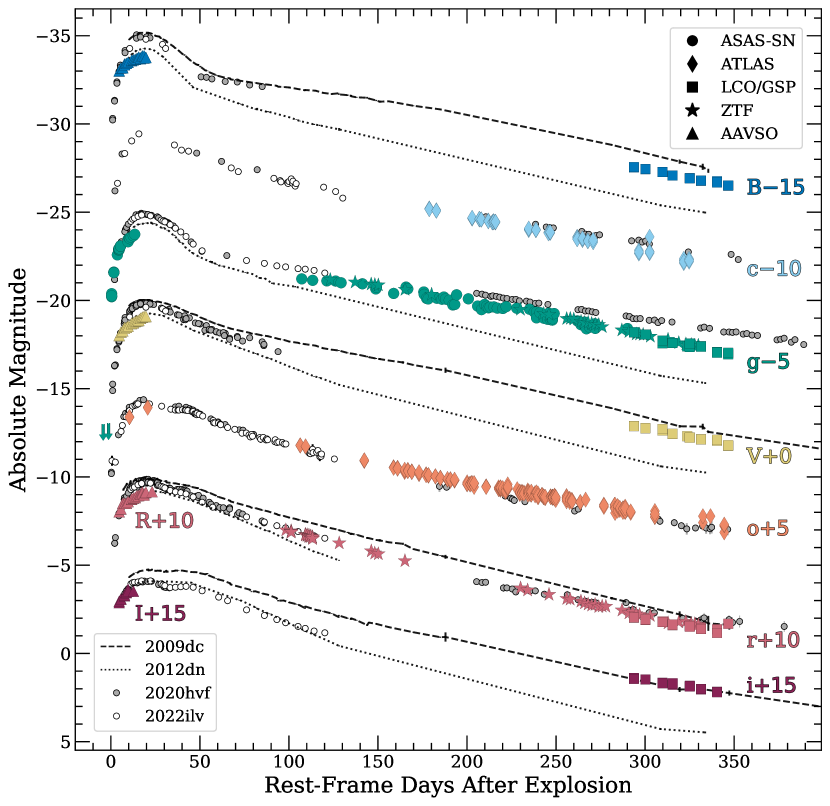
Our photometry is presented in Figure 1. Our data range from to days after explosion. Unfortunately, around the time of peak brightness, SN 2022pul was not observable, and this limits our ability to characterize its light-curve shape. All SN light curves were corrected for extinction (see Section 2.2). AAVSO observations from the international amateur astronomical community provided essential additional data, covering the rise with 4 additional bands.
By fitting a parabola to the ASAS-SN g-band rise points of the light curve and solving for the zero-point of the flux, we find MJD 59786.3 (2022 July 26.3 UTC). The most constraining ASAS-SN g-band nondetection was at 59785.00 MJD at a depth of 17.98 mag, and the first detection (ASAS-SN g-band) was at 59786.73 MJD. Using our -band light curve, we define peak brightness as days. Unless otherwise noted, throughout this work phases are defined relative to .
2.2 Extinction, Distance, and Luminosity
SN 2022pul is located in the outskirts of its elliptical host galaxy NGC 4415 in the Virgo cluster and its offset is 2.207 arcminutes (projected distance of 9 kpc). The SDSS -band Petrosian radius of NGC 4415 is 2.3 kpc (Adelman-McCarthy et al., 2008), so we assume that the extinction by dust from the host galaxy is minimal and the main source of extinction will come from the local environment of the SN itself. Therefore, we correct all spectra and photometry for Milky Way (MW) extinction of mag (Schlafly & Finkbeiner, 2011), but we do not correct for extinction from the host galaxy. We use the Python dust-extinction package (v. 1.1; Gordon et al., 2022). For our JWST spectroscopy, we deredden the NIRSpec spectrum blueward of 1.0 m using the F19 model from Fitzpatrick et al. (2019) and the NIRSpec spectrum redward of 1.0 m as well as the MIRI spectrum with the G21_MWavg model from Gordon et al. (2021).
The distance to NGC 4415 is somewhat uncertain; it is projected close to M49 and thus likely part of the Virgo B subcluster. Using the surface brightness fluctuation (SBF) method, Jerjen et al. (2004) find a distance of Mpc, whereas the fundamental plane (FP) gives Mpc ( mag; Tully et al., 2013). Combining these with a conservative uncertainty estimate, we adopt a distance of Mpc (distance modulus mag) for SN 2022pul.
Given the atypical behavior of the early-time light curve, and the lack of data immediately after peak brightness, it is difficult to obtain a precise peak brightness and light-curve shape for SN 2022pul. Using the distance above, and assuming that our latest early-phase photometry was near peak brightness, we estimate SN 2022pul had mag. This would make SN 2022pul the lowest-luminosity 03fg-like SN Ia (the previous lowest being ASASSN-15hy, mag; Lu et al. 2021). Even though the exact value is uncertain, based on comparisons to light curves of other 03fg-like SNe Ia (see Figure 1), it is unlikely that the SN increased in brightness considerably after our last early-phase photometry. By comparing with SN 2012dn, the data strongly suggest a conservative limit of mag.
2.3 Ground-based Spectroscopy
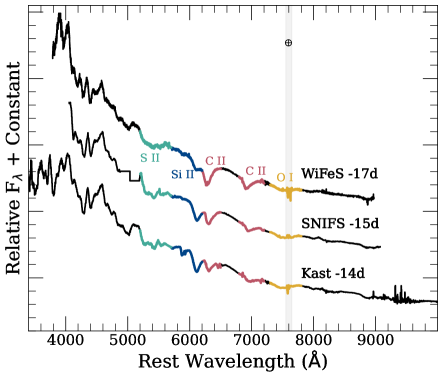
Our spectroscopic observations of SN 2022pul (listed in Section 5 in Table 3) cover a range from to days relative to peak -band brightness. The early-phase ( days) optical spectra are presented in the left panel of Figure 2, and the nebular-phase ( days) optical spectra are displayed in Figure 3. Ground-based NIR observations are shown in Figure 10. A complete log of spectroscopic observations is presented in Table 3. All spectra have been corrected for MW extinction.
We used the following ground-based telescopes and instruments to collect our spectroscopic sequence: the Wide-Field Spectrograph (WiFeS; Dopita et al. 2007) on the Australian National University (ANU) 2.3 m telescope at the Siding Spring Observatory, the Kast spectrograph (Miller & Stone, 1993) on the Shane 3 m telescope at Lick Observatory, the Echellette Spectrograph and Imager (ESI; Sheinis et al. 2002) mounted on the 10 m Keck II telescope at the W. M. Keck Observatory, the Near-Infrared Echellette Spectrometer (NIRES; Wilson et al. 2004) also on the Keck II telescope, the DEep Imaging Multi-Object Spectrograph (DEIMOS; Faber et al. 2003) also on the Keck II telescope, the Faint Object Camera And Spectrograph (FOCAS; Kashikawa et al. 2002 on the Subaru telescope, the Inamori-Magellan Areal Camera and Spectrograph (IMACS; Dressler et al. 2011) on the Magellan Baade Telescope, the Goodman High Throughput Spectrograph (Clemens et al., 2004) on the 4.1 m Southern Astrophysical Research (SOAR) telescope, the Robert Stobie Spectrograph (RSS; Smith et al. 2006) on the Southern African Large Telescope (SALT), the Binospec imaging spectrograph (Fabricant et al., 2019) on the MMT, and the Optical System for Imaging and low-Intermediate-Resolution Integrated Spectroscopy (OSIRIS) instrument mounted to the 10.4 m Gran Telescopio Canarias (GTC) at the Observatorio del Roque de Los Muchachos in La Palma.
Data from the Kast, ESI, and Goodman spectrographs were reduced using either the UCSC Spectral Pipeline333https://github.com/msiebert1/UCSC_spectral_pipeline or the KastShiv444https://github.com/ishivvers/TheKastShiv pipeline, which make use of standard iraf555IRAF is distributed by the National Optical Astronomy Observatory, which is operated by the Association of Universities for Research in Astronomy (AURA), Inc., under a cooperative agreement with the National Science Foundation (NSF)., Python, and IDL routines for bias/overscan corrections, flat fielding, flux calibration, and telluric-line removal, using spectrophotometric standard star spectra, obtained on the same night (Silverman et al., 2012).
The DEIMOS spectra were reduced using the DPipe spectral reduction pipeline (created as a modified version of LPipe; Perley 2019) and standard iraf routines. Low-order polynomial fits to comparison-lamp spectra were used to calibrate the wavelength scale, and small adjustments derived from night-sky lines in the target frames were applied. The spectra were flux calibrated and telluric corrected using observations of appropriate spectrophotometric standard stars observed on the same night, at similar airmasses, and with an identical instrument configuration.
NIRES spectra were obtained as part of the Keck Infrared Transient Survey (KITS), a NASA Keck Key Mission Strategy Mission Support program (PI R. Foley). We observed the SN at two positions along the slit (AB pairs) to perform background subtraction. An A0 V star was observed immediately before or after the science observation in order to remove telluric features. We reduced the NIRES data using spextool v.5.0.2 (Cushing et al., 2004); the pipeline performs flat-field corrections using observations of a standard lamp and wavelength calibration based on night-sky lines in the science data. We performed telluric correction using xtellcor (Vacca et al., 2003).
IMACS data were reduced with standard IRAF routines. Flux calibration was achieved through spectra of spectrophotometric standard stars obtained during the same observing nights. Telluric correction was performed using specific standards from Bessell (1999). Some residuals of saturated telluric bands are present.
Our SALT/RSS spectrum was reduced using a custom pipeline based on standard Pyraf (Science Software Branch at STScI, 2012) spectral reduction routines and the PySALT package (Crawford et al., 2010); we removed cosmic rays, host-galaxy lines and continuum, and telluric absorption. MMT/Binospec data were reduced using the Binospec IDL pipeline (Kansky et al., 2019).
The Subaru/FOCAS spectrum was reduced following standard procedures with IRAF, including bias subtraction, flat-fielding, cosmic-ray rejection, sky subtraction, one-dimensional (1D) spectral extraction, wavelength calibration using ThAr lamp and night-sky lines, and flux calibration with the standard star Feige 34 (e.g., Maeda & Kawabata, 2022).
OSIRIS observations were conducted using the R1000B and R1000R grisms with wavelength ranges 3630–7500 Å and 5100–10,000 Å, respectively. The reduction process was performed using version 1.11.0 of PypeIt (Prochaska et al., 2020)666https://github.com/pypeit/PypeIt
For absolute flux calibration, we matched the ground based optical spectra to available photometry. We lacked near-infrared photometry of SN 2022pul, so the Keck/NIRES data use spectroscopic flux standards only for calibration.
2.4 JWST Spectroscopy
| Setting | NIR | MIR |
|---|---|---|
| Instrument | NIRSpec | MIRI |
| Mode | FS | LRS |
| Wavelength Range | 0.6 5.3m | 5–14 m |
| Slit | S200A1 () | Slit |
| Grating/Filter | PRISM/CLEAR | P750L |
| R | 100 | –250 |
| Subarray | FULL | FULL |
| Readout Pattern | NRSIRS2RAPID | FASTR1 |
| Groups per Integration | 10 | 89 |
| Integrations per Exposure | 2 | 5 |
| Exposures/Nods | 3 | 2 |
| Total Exposure Time | 963 s | 2492 s |
| Target Acq. Exp. Time | 14 s | 89 s |
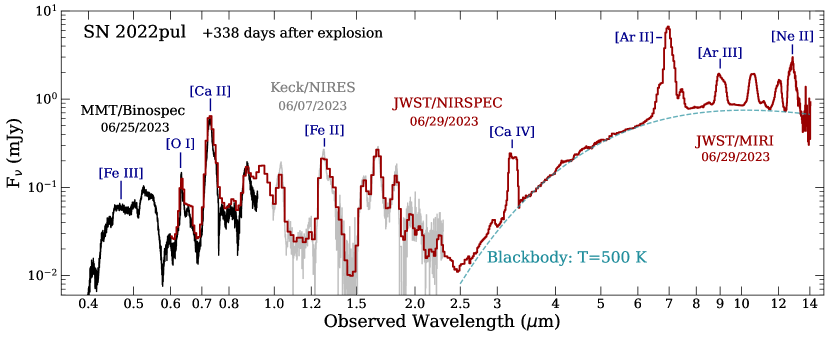
We observed SN 2022pul in the nebular phase on 2023 June 29 at 338 rest-frame days post-explosion with JWST, using both the Near Infrared Spectrograph (NIRSpec) in the Fixed Slits (FS) Spectroscopy mode (Jakobsen et al., 2022; Birkmann et al., 2022; Rigby et al., 2022) and MIRI in the Low Resolution Spectroscopy (LRS) mode (Kendrew et al., 2015, 2016; Rigby et al., 2022). These data are presented in Figure 4. Our NIRSpec observations used the S200A1 ( wide long) slit with the PRISM grating and CLEAR filter, and our MIRI observations used the LRS slit with the P750L disperser. Together the JWST spectra continuously span 0.6–14 m. Since the fluxes of the NIRSpec and MIRI spectra at 5 m agree with no scaling or modification, we choose to transition from the NIRSpec spectrum to the MIRI spectrum at this wavelength. Table 1 gives further details of the JWST observation settings.
We reduced the JWST data using the publicly available “jwst”777https://github.com/spacetelescope/jwst pipeline (version 1.11.1; Bushouse et al., 2022) routines for bias and dark subtraction, background subtraction, flat-field correction, wavelength calibration, flux calibration, rectification, outlier detection, resampling, and spectral extraction. To check the reduction of the automatic pipeline, we re-extracted both spectra by manually running Stage 3 of the pipeline (calwebb_spec3) from the Stage 2 (calwebb_spec2) data products; we found excellent agreement between the extractions so we use the automated pipeline reductions available on Mikulski Archive for Space Telescopes (MAST)888https://mast.stsci.edu/portal/Mashup/Clients/Mast/Portal.html. Upon inspection of the two-dimensional (2D) spectral image, the NIRSpec spectrum suffered from several reduction artifacts (potentially cosmic rays or bad pixels) not removed by the automated pipeline, so we manually clip these artifacts out in the spectrum. We take special care to remove a single-pixel artifact on the red side of the 3.2 m feature to preserve the underlying line profile shape.
The MIRI/LRS slit mode wavelength calibration has a known issue causing a 0.02–0.05 m uncertainty which is largest at the shortest wavelengths999Details at https://jwst-docs.stsci.edu/jwst-calibration-pipelinecaveats/jwst-miri-lrs-pipeline-caveats. Beiler et al. (2023) use observations of a Y-dwarf to make a further empirical correction to the wavelength solution given by
We applied this additional wavelength correction to our MIRI spectrum.
From the LRS verification image of SN 2022pul, we measured MIRI F1000W photometry of mJy, corresponding to mag AB (Oke & Gunn, 1983). The photometry was done on the F1000W data from the JWST pipeline using a 70% encircled energy aperture radius (4.3 pixels) and inner and outer sky radii of (respectively) 6.063 and 10.19 pixels (and a corresponding aperture correction was also applied). The measured photometry agreed with the flux from integrating the MIRI/LRS spectrum of SN 2022pul over the F1000W passband to within 7%, and we rescale the MIRI spectrum flux to match the photometry precisely. The NIRSpec spectrum does not have a verification image to measure photometry and check the spectral flux calibration; however, it matches both the optical and MIR spectra well, so we do not adjust its flux calibration.
3 Analysis
3.1 Spectroscopic Evolution
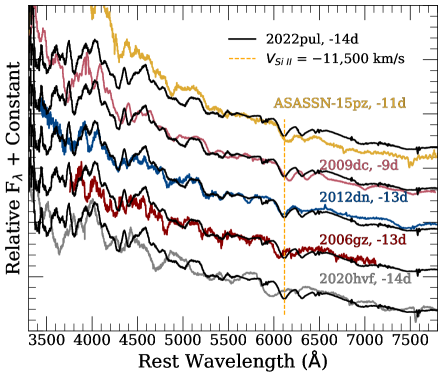
Our early photospheric spectra of SN 2022pul show several of the characteristic features of 03fg-like SNe Ia. In the left panel of Figure 2 we present our early-phase optical spectra of SN 2022pul, and in the right panel we compare our day optical spectrum of SN 2022pul to other 03fg-like SNe. Consistent with our comparisons to nebular spectra in Section 3.2, we find that SN 2022pul is most similar to SN 2012dn in the photospheric phase. We measure an Si II absorption velocity of km s-1 ( km s-1 for SN 2012dn). We also measure strong C II absorption at this phase, which is likely unburned carbon in the outer layers of the ejecta (consistent with other 03fg-like SNe). The higher velocity and low luminosity relative to the observed population 03fg-like SNe (Ashall et al., 2021) could indicate that SN 2022pul is the result of a lower total mass explosion.
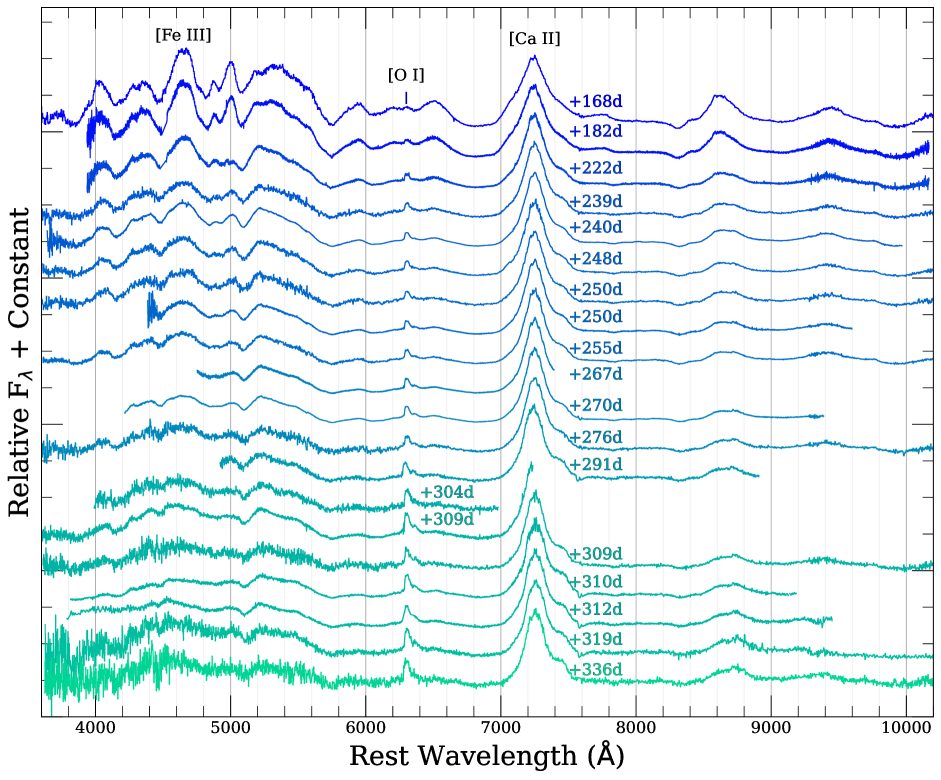
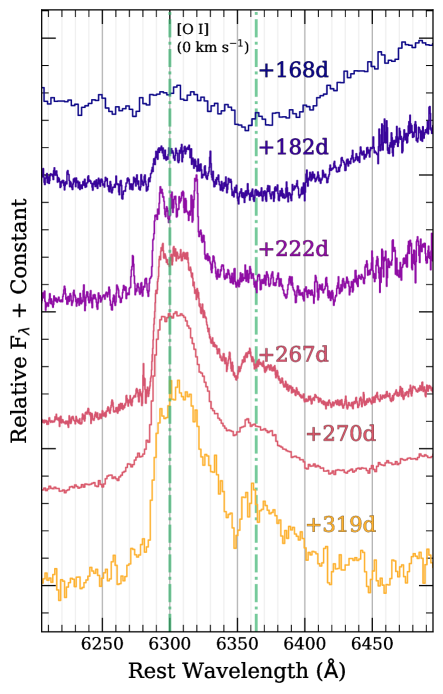
SN 2022pul is remarkably well observed at optical wavelengths during its transition into the nebular phase. In Figure 3, we present data from a variety of ground-based sources (described in Section 2.3) ranging from +168 to 336 days after peak -band brightness, highlighting the evolution that occurs in the nebular emission lines during this phase.
In our earliest nebular spectrum (+168 days), emission from [Fe III] 4701 is clearly present. This feature proceeds to weaken with time and is absent from the spectrum by +309 days. At days we detect emission from [O I] 6300, 6364, and in all spectra we detect strong emission from [Ca II] , 7324. The strength of [O I] increases relative to [Ca II] over this time period with the [Ca II]/[O I] peak-intensity ratio changing from 3.5 to 2.7. This ratio is similar to those observed in Ca-rich SNe and SNe II at days after peak brightness (Valenti et al., 2014; Milisavljevic et al., 2017; Prentice et al., 2022). Additionally, the strength of the emission component of the Ca II NIR triplet weakens with time relative to [Ca II]. The Ca II NIR triplet has a photospheric component with blueshifted absorption near 12,000 km s-1 at all phases.
In Figure 5, using a selection of spectra from Figure 3, we display the evolution of the [O I] emission. At all phases after +222 days, there is clear emission from both [O I] 6300 and 6364. The ratio of [O I] 6300 to [O I] 6364 in our +270 day IMACS spectrum is , consistent with what we would expect given the measured oscillator strengths of these lines ([O I] 6300/ [O I] 6364 = 3.1). [O I] might be present at +168 days, but since the continuum is significantly different at that phase, it is hard to say definitively. From +182 to +319 days, the peak of the [O I] emission is slightly redshifted ( km s-1) and appears to evolve from a flat-topped profile to a more Gaussian profile. Furthermore, this emission is asymmetric with a steeper blue edge and more shallow-sloped red edge. This kind of “sawtoothed” emission has been observed in the nebular-line profiles of other 03fg-like SNe (Taubenberger et al., 2013b; Siebert et al., 2023). From our highest S/N spectrum we measure a [O I] 6300 full width at half-maximum intensity (FWHM) km s-1 (Paper II: Kwok et al. 2023a).
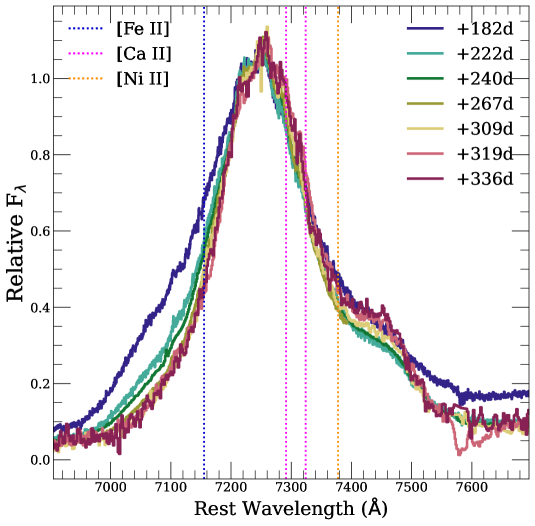
In addition to its strength, the morphology of the 7300 Å emission complex evolves during the nebular phase. In the left panel of Figure 6, we display nebular spectra normalized to the peak of this feature ranging from +182 to 336 days. Vertical dashed lines represent the rest wavelength of the strongest lines of [Fe II], [Ca II], and [Ni II]. Over 137 days, we observe a gradual increase in the slope of the blue edge of this feature and slight redward shift of the peak. The red “shoulder” also becomes more pronounced over time.
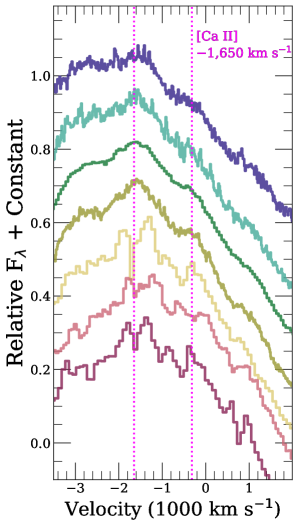
In the right panel of Figure 6, we show the same spectra zoomed-in on the peak emission from [Ca II] and offset by constant values. Several 03fg-like SNe show evidence for additional narrower velocity components of [Ca II] (Siebert et al., 2023). In a few of our spectra, there is additional structure centered near km s-1 (pink dashed line for reference). This structure could be coming from another component of [Ca II], but the resolution of our spectra limits our ability to characterize its shape.
The evolution of several of the emission features in the nebular phase of SN 2022pul shows the necessity for high-quality spectral time series of these events. In the following section, we examine the similarities of SN 2022pul with other SNe.
3.2 Spectroscopic Comparisons
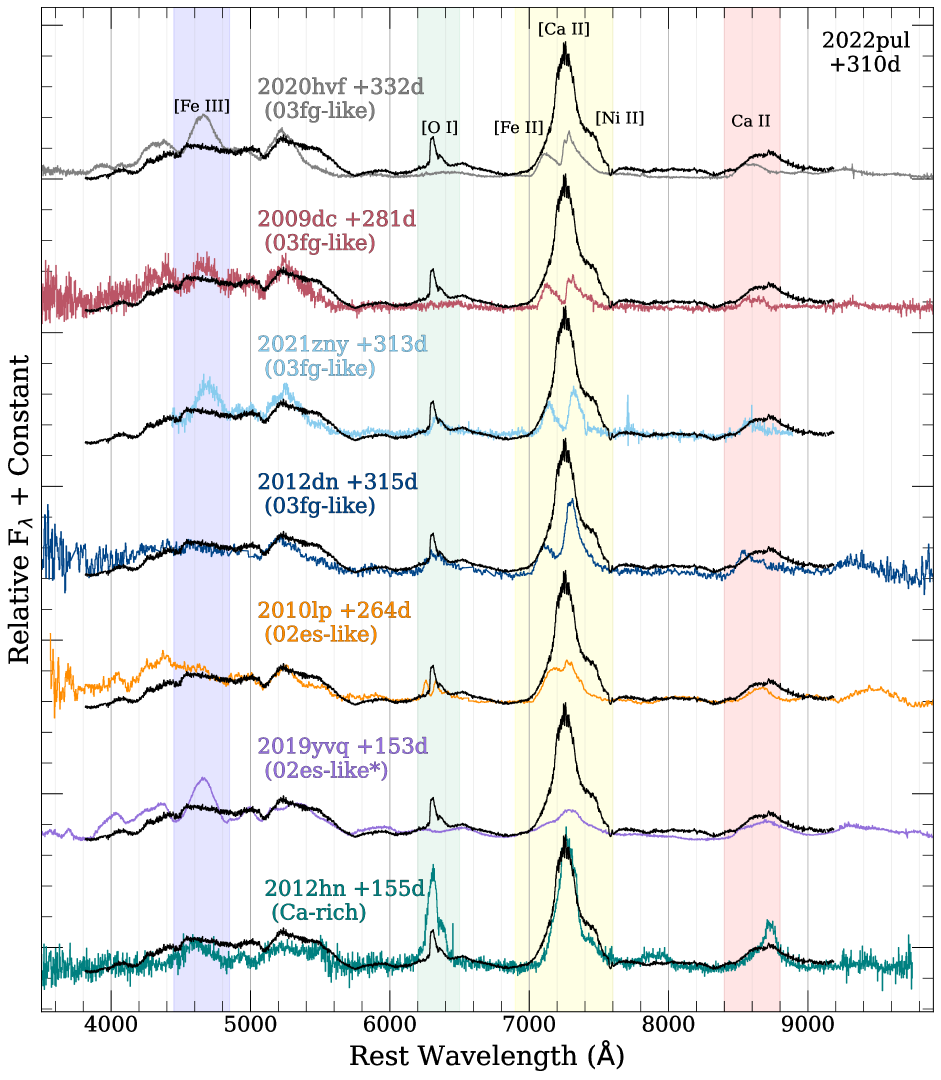
The nebular features of SN 2022pul add to the growing diversity present in the 03fg-like subclass of SNe Ia, and exhibit interesting similarities to other types of peculiar SNe Ia. In Figure 7, we show our +310 day nebular spectrum of SN 2022pul in comparison with four other 03fg-like SNe Ia (SN 2020hvf, Siebert et al. 2023; SN 2009dc, Silverman et al. 2011; SN 2021zny, Dimitriadis et al. 2023; and SN 2012dn, Taubenberger et al. 2019), two 02es-like SNe Ia (SN 2010lp, Kromer et al. 2013; and SN 2019yvq, Siebert et al. 2020), and one Ca-rich SN (SN 2012hn, Valenti et al. 2014; Lyman et al. 2014).
The 03fg-like SNe shown here demonstrate the varying ionization levels observed in this subclass. Of these SNe, both SN 2022pul and SN 2012dn lack emission from [Fe III]. Stronger [Fe III] emission in SN 2009dc, SN 2020hvf, and SN 2021zny at similar phases show that the ionization states of 03fg-like SNe can evolve on varying timescales, unlike normal SNe Ia. This could be related to the mass of 56Ni generated in the explosion, or the varying recombination rates caused by different densities. SN 2009dc and SN 2020hvf had higher peak brightnesses ( mag and mag, respectively), while SN 2012dn and SN 2022pul are fainter relative to the population of other 03fg-like SNe ( mag and mag, respectively).
The most striking nebular features of SN 2022pul are the strong [O I] and [Ca II] emission. So far, only two previous 03fg-like SNe display convincing [O I] emission, SN 2012dn and SN 2021zny (Taubenberger et al., 2019; Dimitriadis et al., 2023); however, in both cases the emission is significantly broader (see Figure 9). The width of [O I] in SN 2022pul is more similar to that seen in the much lower luminosity ( mag) 02es-like SN 2010lp. The [Ca II] emission is also the broadest observed in an 03fg-like SN Ia. Relative to [Fe III], the strength and width of this feature are most similar to the Ca-rich SN 2012hn.
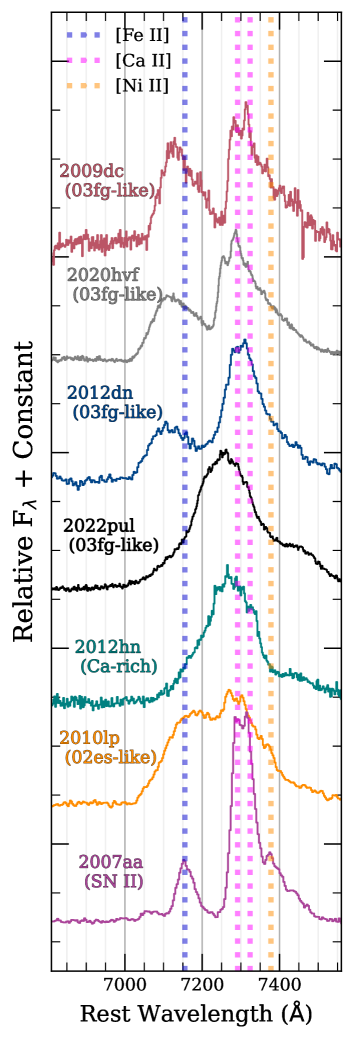
3.3 Ca II Emission
The [Ca II] emission is explored in detail in Figures 8. Here we compare the 7300 Å emission profile of SN 2022pul (black curve) with other 03fg-like SNe (SN 2009dc, SN 2020hvf, and SN 2012dn), a Ca-rich SN 2012hn, the low-luminosity 02es-like SN 2010lp, and SN II 2007aa. Rest wavelengths of [Fe II], [Ca II], and [Ni II] are shown with blue, pink, and orange dashed vertical lines, respectively.
The broad [Ca II] present in SN 2022pul is significantly affected by line overlap, complicating the interpretation of this feature. The other 03fg-like SNe presented here all show “sawtooth”-shaped emission in either one or both of the profiles of [Fe II] and [Ca II]. Given that an asymmetric [Fe II] line profile is present in the NIR and MIR (see Figure 10, and Kwok et al. 2023a), we should expect a similar underlying component in this feature of SN 2022pul. Furthermore, the emission peaks of [Ca II] observed in 03fg-like SNe all appear blueshifted. If the dust is formed in the SN (Johansson et al., 2023) and is obscuring part or all of the ejecta, one would expect the redshifted emission to be more heavily extinguished. This could give rise to the trend of the preferentially blueshifted [Ca II] emission observed in these SNe. 03fg-like SNe (and SN 2010lp) also display narrow components of [Ca II] and a similar component could be present in SN 2022pul (see the right panel of Figure 6).
The shoulder on the red side of the 7300 Å feature could be emission from [Ni II], but the emission profiles of the strong intermediate-mass elements (IMEs) seen in the MIR (Kwok et al., 2023a) might indicate that this is instead a contribution from a broader flat-topped component of [Ca II].
The broad [Ca II] is more similar to what is seen in Ca-rich SNe, which also have low-ionization nebular-phase spectra and [O I] emission. We estimate the broad component of [Ca II] in SN 2022pul to have FWHM km s-1, compared to km s-1for that of the Ca-rich SN 2012hn (Prentice et al., 2022), km s-1for the peculiar 02es-like SN 2019yvq (Siebert et al., 2020), and km s-1that we measure for SN 2012dn.
Lastly, since both [O I] and [Ca II] emission are typically present in the nebular phase of core-collapse SNe, we compare the 7300 Å emission of SN 2022pul to that of SN II 2007aa. The widths of these features vary greatly among SNe II, but if we select an SN with similar [O I] emission (see Figure 7), we see that its [Ca II] emission is quite narrow in comparison with that of SN 2022pul.
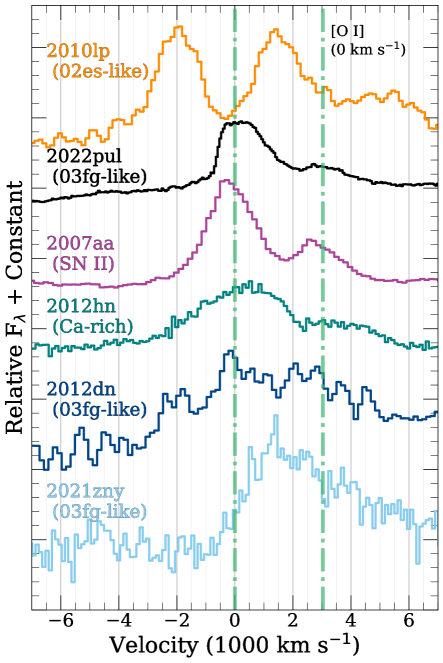
3.4 O I Emission
In Figure 9, we compare the [O I] emission profile in our highest signal-to-noise ratio (S/N) spectrum to those of other SNe where this emission feature is also detected. As previously discussed in Section 3.1, the [O I] emission in SN 2022pul is offset by 300 km s-1, flat-topped, and has two clear profiles corresponding to [O I] 6300 and [O I] 6364. We observe the most similar emission in an SN II, SN 2007aa at +336 days (purple curve), having a similar velocity and line ratio. SN 2010lp also shows clear and narrow [O I] emission, but offset by km s-1. Taubenberger et al. (2013a) attribute this type of emission as evidence for a violent merger like that presented by Pakmor et al. (2012) where unburned oxygen (or oxygen from carbon burning) from the secondary WD is present at low velocities but is not macroscopically mixed in velocity space as would be expected for a Chandrasekhar-mass deflagration (Röpke et al., 2007). The spectral models of Mazzali et al. (2022) also find that SN 2010lp was consistent with a violent merger. The similar emission seen in SN 2022pul could point toward a similar progenitor scenario; however, SN 2010lp was significantly lower-luminosity than SN 2022pul. More modeling is needed to understand if violent mergers can produce the luminosities observed and nickel masses inferred for 03fg-like SNe.
As shown in SN 2012dn and SN 2021zny (Figure 9), [O I] emission has been observed in other 03fg-like SNe (see Dimitriadis et al. 2023). Broad [O I] has also been observed in Ca-rich SNe like 2012hn (green curve). Zenati et al. 2023 found that the merger of a hybrid He-C/O WD with a lower mass C/O WD could explain some of the observed properties of Ca-rich transients. Interestingly, these SNe also tend to be found in remote locations of their host galaxies (Kasliwal et al., 2012; Foley, 2015).
3.5 NIR Emission
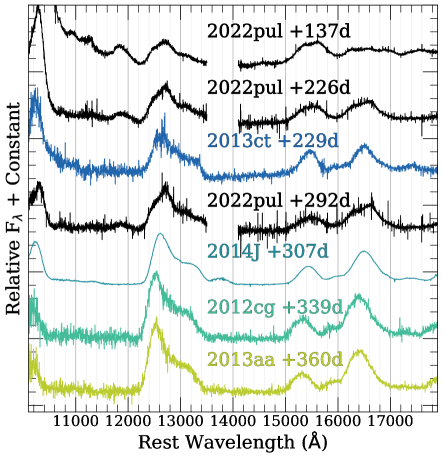
Since JWST prism spectroscopy has relatively low resolution in the NIR, ground-based NIR spectroscopy obtained with NIRES provides critical constraints on the distribution of iron-group elements (IGEs) in the SN ejecta. In Figure 10, we compare our nebular NIR spectra with those of other normal SNe Ia from Maguire et al. (2018) and SN 2014J from (Diamond et al., 2018). The [Fe II] 1.26 m and [Fe II] 1.64 m features in SN 2022pul have significantly different morphologies than those observed in other normal SNe Ia (colored curves). As shown by Kwok et al. (2023a), these features are well-explained by two Gaussian components of [Fe II] offset by km s-1and with FWHM of km s-1. The peaks of these IGE emission profiles are redshifted, while the peaks of the IME emission profiles are blueshifted. This could be the result of an asymmetric explosion, like a violent merger, that produced different compositions of ejecta moving in opposite directions along our line of sight.
3.6 Early-Phase CSM Interaction
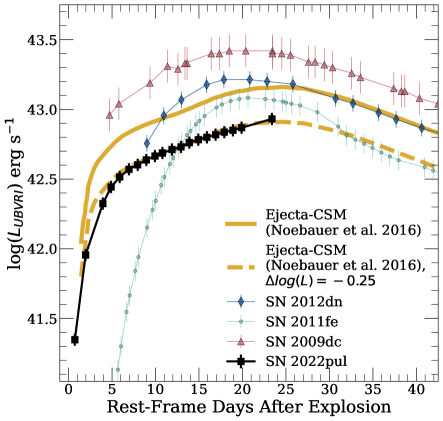
We examine the early-phase photometry of SN 2022pul in more detail in Figure 11. To compare with models, we constructed an estimated pseudobolometric light curve (black squares) from the observed photometry (see Figure 1). We adopted a spectral energy distribution (SED) from the early-time spectra, adjusted it to match the photometry at each epoch, and integrated in the range 3000–9000 Å to estimate the pseudobolometric flux. This is compared with similarly constructed pseudobolometric light curves of SN 2009dc (red triangles), SN 2012dn (blue diamonds), and SN 2011fe (green circles). The solid yellow curve is the synthetic light-curve model resulting from a normal SN Ia embedded in a C/O-rich CSM from Noebauer et al. (2016). We have shifted this model down by 0.25 dex (dashed-yellow curve) to highlight the similarity of its light-curve shape to that of SN 2022pul.
In this model, ejecta colliding with the CSM produce a reverse shock that decelerates and compresses the ejecta. The resulting light curve exhibits two distinct components. The steep rise is caused by the rapid release of radiative energy from the initial CSM-interaction phase, then is followed by the longer timescale additional light-curve evolution from radioactive heating. Radioactive heating then becomes the dominant source of the luminosity, and the light-curve shape in this phase is determined by the amount of 56Ni produced in the explosion. Noebauer et al. (2016) found that the light curve of SN 2009dc could be well-fit with this model by adjusting the composition of the CSM. This provided a luminosity boost that more closely resembled the peak of the light curve of SN 2009dc. Additionally, Noebauer et al. (2016) suggested that the low Si II velocities observed in SN 2009dc relative to normal SNe Ia could be the result of the deceleration of the ejecta by the CSM, and subsequent conversion of this kinetic energy to radiative energy.
We find that the ejecta-CSM model from Noebauer et al. (2016) is a remarkably good fit to the pseudobolometric light curve of SN 2022pul. Similar to the model, SN 2022pul exhibits a fast initial rise, which then transitions to a shallower slope at days after explosion. This clear two-component rise could indicate the CSM is more C/O-rich than that of SN 2009dc (Noebauer et al., 2016). SN 2022pul takes roughly 5 days longer to reach its peak luminosity than SN 2011fe, and its peak luminosity is significantly lower than that of both SN 2012dn and even SN 2011fe.
Despite the similarity of the light curve to the ejecta-CSM model, it is important to note that we do not see signs of interaction in our early-time optical spectra (Figure 2). For example, in the peculiar subclass of SNe Ia-CSM (Silverman et al., 2013), narrow emission is present at early times that has been attributed to the presence of H-rich CSM from a nondegenerate companion star. SN 2022pul only exhibits narrow emission from [O I] at late times, which is consistent with forming deep within the SN ejecta.
4 Discussion
In this section, we first discuss our interpretation of the progenitor scenario of SN 2022pul from ground-based data alone. In particular, a viable scenario needs to be able to explain the slowly-evolving early-time light curve relative to normal SNe Ia, the strong C II absorption in the early spectra, the low ionization state in the nebular phase, and the strong/asymmetric nebular emission from [O I] and [Ca II]. We then discuss how this evidence is further supplemented by nebular observations in the NIR and MIR from JWST, and we briefly discuss our complete optical+NIR+MIR SED, highlighting the main results that are discussed in further detail in Paper II (Kwok et al., 2023a) and Paper III (Johansson et al., 2023).
4.1 Ground-Based Evidence for a WD Merger
Among recent studies of 03fg-like SNe there is a growing evidence that these events can be explained by WD mergers (Dimitriadis et al., 2022; Srivastav et al., 2023; Dimitriadis et al., 2023; Siebert et al., 2023). We summarize some key observational trends in these SNe:
-
•
High peak luminosities and broad light curves (Howell et al., 2006).
- •
- •
- •
- •
- •
The origin of the term “super-Chandrasekhar” in reference to 03fg-like SNe was primarily driven by the inferred high luminosity and broad light curve of SN 2003fg (Howell et al., 2006). It was proposed that a super-Chandrasekhar-mass WD, supported via rapid rotation, could be formed via accretion in an SD progenitor system (Yoon & Langer, 2005), or via the merger of two WDs (Tutukov & Yungelson, 1994; Howell, 2001). Simulated observations of the explosions of rapidly-rotating super-Chandrasekhar-mass WDs have a hard time explaining the low velocities seen in these SNe at peak brightness, and do not show the characteristic strong carbon lines of this subclass (Hachinger et al., 2012b; Fink et al., 2018).
A total ejecta mass greater than can also be achieved within a DD progenitor system. DD progenitors have several advantages when it comes to explaining 03fg-like SNe. (1) The limit on the total ejecta mass allows for a variety of double C/O WD systems. (2) The merger of two WDs can be a naturally asymmetric scenario. Observations should be expected to vary significantly along different lines of sight and for systems with different mass ratios. (3) In a violent merger, oxygen is expected to be present in the innermost regions of the ejecta (Kwok et al., 2023a). (4) This progenitor scenario offers a potential path to forming C/O-rich CSM prior to explosion via the disruption of the secondary WD.
In a WD merger scenario, the explosion can occur either pre- or post-merger. In the former case, the explosion occurs during the dynamical interaction phase of the two WDs (alternatively referred to as “prompt-mergers,” “perimergers,” or “violent mergers” in the literature; Pakmor et al. 2010, 2012; Moll et al. 2014); in the latter case, the explosion occurs after the disruption of the secondary WD (Raskin & Kasen, 2013). Hydrodynamical models of post-mergers can produce a significant amount of unburned carbon and oxygen as a result of tidal stripping of the secondary WD (Raskin & Kasen, 2013). In either scenario, observations are expected to vary greatly with viewing angle. Moll et al. (2014) found that for prompt mergers, depending on viewing angle and the progenitor mass ratio, peak luminosities can vary by a factor of two and span most of the luminosity range of 03fg-like SNe. Furthermore, in post-merger simulations, Raskin et al. (2014) showed that the distribution of IMEs and IGEs in the ejecta is “hourglass”-shaped and surrounded by a dense, C/O-rich CSM. A significant fraction of oxygen is also present in the inner regions of the ejecta.
Early-time observations of some 03fg-like SNe show fast-evolving light-curve bumps that have been interpreted as interaction with a dense CSM (Jiang et al., 2021; Srivastav et al., 2023; Dimitriadis et al., 2023). Dimitriadis et al. (2022) found that the model light curve of their higher mass model ( + ), when viewed along the equator, matched the peak luminosity of the 03fg-like SN 2020esm, but not the shape of its light curve. These models did not consider interaction of the ejecta with the CSM, which can provide additional luminosity and modulate the light-curve shape (Noebauer et al., 2016).
The ground-based observations of SN 2022pul add to the growing evidence that the progenitors of 03fg-like SNe come from WD mergers occurring within a dense C/O-rich CSM, while adding significantly to the diversity of this subclass. Specifically, in both the photospheric and nebular phases, SN 2022pul is most similar to the 03fg-like SN 2012dn with some key differences. In the nebular phase, SN 2022pul displays strong, broad [Ca II] emission that is completely blended with [Fe II] and [Ni II], unlike any other 03fg-like SN Ia.
The primary Ca component of this feature is well-explained by a single Gaussian component and offset by about km s-1 from the systemic velocity of the host galaxy. Symmetric components of [Ca II] have been observed only in ASASSN-15pz (Chen et al., 2019; Siebert et al., 2023), SN 2020esm (Dimitriadis et al., 2022), and SN 2021zny (Dimitriadis et al., 2023). Siebert et al. (2023) argued that the multiple broad velocity components of [Ca II] observed in SN 2020hvf were produced by two distinct ejecta components offset by the orbital velocity of the WDs prior to explosion. This type of emission is more likely to be observed if the line of sight was along the orbital plane. The symmetric component of [Ca II] could indicate that we are instead observing SN 2022pul along the pole, where you would not expect to be capable of seeing velocity offsets. However, this interpretation is inconsistent with the velocity offsets observed between NIR and MIR emission profiles from IMEs and IGEs (Kwok et al., 2023a). Additionally, all clearly identified lines from IGEs in the optical and NIR nebular spectra are asymmetric relative to what is seen in normal SNe Ia, further supporting an asymmetric explosion scenario.
One of the most striking features in the ground-based nebular spectra is the strong [O I] emission, which is extremely rarely observed in thermonuclear SNe. Several sub-Chandrasekhar-mass explosion models predict strong [Ca II] and low ionization states (see Wilk et al. 2020, discussed further in Paper II: Kwok et al. 2023a, and Polin et al. 2021), but a merger is the only model that predicts [O I] at low velocities as seen in SN 2022pul. Similar emission has been observed in low-luminosity subclasses such as 02es-like SNe Ia and Ca-rich SNe. Specifically for the 02es-like SNe Ia, both Taubenberger et al. (2013a) and Kromer et al. (2016) favor a violent merger model for SN 2010lp and iPTF14atg (respectively), as discussed in Section 3.4. The significant amount of [O I] present at low velocity is best explained by this scenario.
The evolution of the optical nebular spectra displayed in Figure 3 shows a clear progression from an SED that appears 03fg-like to an SED dominated by [O I] and [Ca II]. Fast changes in ionization state, including the appearance of broad [Ca II], have been observed in normal SNe Ia at very late times, which has been attributed to clumping of the ejecta (Tucker et al., 2022a). However, our latest phase optical spectrum of SN 2022pul is quite extreme in comparison, bearing a closer resemblance to Ca-rich SNe. For SN 2022pul, we investigate if additional clumping of the ejecta can improve the match of violent merger models to the data in Paper II (Kwok et al., 2023a). Double-degenerate progenitor scenarios have also been favored for some Ca-rich SNe, though not violent mergers specifically (Jacobson-Galan et al., 2019; Zenati et al., 2023). Despite the low luminosities of these peculiar subclasses, the similarity of their nebular emission to that of SN 2022pul is intriguing and warrants further study.
If we combine our evidence for a violent merger with the unique early light curve of SN 2022pul we can begin to build a picture of its progenitor. SN 2022pul was likely the result of the merger of two C/O WDs within dense CSM. This result is corroborated by nebular-phase MIR observations of SN 2022pul with JWST.
4.2 Continuum Emission Observed with JWST
In Figure 4, we presented our complete optical+NIR+MIR nebular-phase spectrum at 338 days after explosion. With MIRI, we observe a strong blackbody continuum (; Johansson et al. 2023). The existence of C/O-rich CSM may provide the necessary conditions for dust formation, and several studies have suggested that this can explain some of the important trends in ground-based observations of 03fg-like SNe (Taubenberger et al., 2013b, 2019; Hsiao et al., 2020; Ashall et al., 2021; Maeda et al., 2023). In particular, an accelerated decline in the optical light curves, potentially due to the onset of dust formation in the SN ejecta, has been observed beginning as early as days after peak brightness (Taubenberger et al., 2013b; Dimitriadis et al., 2022). Hsiao et al. (2020) suggested that the timing of the onset of this effect could be related to the mass of the C/O-rich envelope. Additionally, an excess in NIR light curves has been observed, which might support this theory of dust formation while the pre-existing CSM dust echo is another possibility (Yamanaka et al., 2016; Nagao et al., 2016). Unfortunately, we are unable to constrain these light-curve effects with the available data of SN 2022pul. More work is needed to understand if the optical line shapes in the nebular phase are being affected by dust extinction. For a detailed discussion of the dust emission observed in SN 2022pul see Paper III (Johansson et al., 2023).
One alternative explanation for the dense CSM distribution and subsequent dust formation involves the explosion of a Chandrasekhar-mass WD within the envelope of an AGB star (the core-degenerate scenario; see Kashi & Soker 2011; Hsiao et al. 2020; Ashall et al. 2021). This model predicts a large X-ray luminosity caused by interaction with the envelope that has not yet been observed. Furthermore, due to the high-density burning that occurs in Chandrasekhar-mass explosions (Höflich et al., 1996), these SNe may be expected to form more stable 58Ni. Nebular emission lines of nickel are easier to detect in the MIR, and have been observed in JWST spectra of a normal SN Ia (SN 2021aefx; Kwok et al. 2023b; DerKacy et al. 2023). Emission from stable 58Ni in SN 2022pul is quite weak relative to the classical Type Ia SN 2021aefx, further supporting the idea that SN 2022pul was produced by the merger of lower-mass C/O WDs. For a complete discussion of the nebular-line ionization states, asymmetries, and comparison to explosion models see Paper II (Kwok et al., 2023a).
Finally, while dust formation is plausible (Johansson et al., 2023), we do not see changing attenuation of the redshifted material in the nebular optical emission lines of SN 2022pul, which has been observed in dust-forming SNe like SN 2006jc (Smith et al., 2008). A MIR excess has also been observed in Type Iax supernova, SN 2014dt (Fox et al., 2016). Foley et al. (2016) found that the nebular properties of SNe Iax are consistent with the presence of a bound remnant, and that the MIR properties of SN 2014dt were better explained by this model. Siebert et al. (2023) suggested that the extremely narrow nebular [Ca II] (similar to what has been observed in SNe Iax) emission observed in the 03fg-like SN 2020hvf could be explained by a wind from a bound remnant. This possibility should continue to be considered in when analyzing future observations of 03fg-like SNe.
5 Conclusions
The specific progenitor systems of thermonuclear SNe have remained elusive for decades. Currently, there is still debate over the types of systems and explosion mechanisms that contribute to the majority of the population of normal SNe Ia.
Our thorough ground- and space-based follow-up campaign of SN 2022pul has provided some strong constraints on an SN Ia progenitor system and greatly informs our understanding of the carbon-strong, high-luminosity 03fg-like subclass of SNe Ia. Specifically, the multicomponent rise in the optical light curve, narrow nebular [O I] emission at low velocity, low ionization state and asymmetric nebular features, weak emission from stable 58Ni (Kwok et al., 2023a), and strong emission from dust (Johansson et al., 2023), are all consistent with the merger of two WDs within C/O-rich CSM.
The diversity of 03fg-like SNe Ia is also consistent with this naturally asymmetric scenario. Observations of these explosions should be expected to vary significantly in their luminosity and velocity distributions along different lines of sight. Additionally, the total mass of the system will affect the luminosity, and the mass ratio could lead to different dust distributions and CSM masses. If the conditions of the merger affect the amount of mass from the secondary WD that ends up in the CSM versus the central region of the ejecta, this might explain the varying amounts of [O I] emission that have been observed in the nebular spectra of 03fg-like SNe.
The detection of MIR excesses in now three 03fg-like SNe Ia (SN 2009dc, ASASSN-15pz, and SN 2022pul; see Paper III: Johansson et al. 2023) shows that JWST is an important resource for their follow-up. Future observations should aim to obtain MIR spectral sequences of these SNe to constrain the onset of dust formation, and whether it was formed in the SN ejecta or perhaps in pre-existing CSM. Furthermore, the nebular emission features in the MIR are much less sensitive to temperature structure than optical lines, and provide critical information on the ionization and elemental distributions in the ejecta (DerKacy et al., 2023; Kwok et al., 2023b, a). Higher-resolution observations are needed to probe the presence of narrow emission features, an indication that some of these SNe may have bound remnants (Siebert et al., 2023).
In addition to late-time MIR observations, extremely early UV and optical observations of 03fg-like SNe are needed to adequately understand the CSM interaction phase which can only last a few days (Jiang et al., 2021; Srivastav et al., 2023; Dimitriadis et al., 2023). Prolonged interaction with an extended envelope (i.e., in the core-degenerate scenario) is expected to produce a large X-ray luminosity (Hsiao et al., 2020). Detailed modeling of this scenario is needed, especially in the nebular phase, to understand if it can reproduce the observed properties of 03fg-like SNe Ia. Additionally, currently 03fg-like SNe do not show strong continuum polarization (Bulla et al., 2016); polarimetry at earlier times is essential to understanding the asymmetry of the explosion.
Finally, one large caveat regarding the merger scenario is the amount of CSM that can be formed prior to explosion. The ejecta-CSM model (Noebauer et al., 2016) discussed in Section 3 used a CSM mass of 0.6 . It may be difficult to reconcile this large mass with the substantial amount of oxygen in the central region of the ejecta and the observed luminosity range of 03fg-like SNe. Moreover, the dynamical double WD models of Raskin & Kasen (2013) had less than of CSM, likely insufficient to produce the interaction signature seen in SN 2022pul. Further modeling is needed to explore the parameter space of WD mergers to find a scenario well-matched to the observations of this diverse class of supernova explosions.
This work is based on observations made with the NASA/ESA/CSA JWST as part of program #02072. We thank Shelly Meyett for her consistently excellent work scheduling the JWST observations, Sarah Kendrew for assistance with the MIRI observations, and Glenn Wahlgren for help with the NIRSpec observations.
The data were obtained from the Mikulski Archive for Space Telescopes at the Space Telescope Science Institute (STScI), which is operated by the Association of Universities for Research in Astronomy (AURA), Inc., under National Aeronautics and Space Administration (NASA) contract NAS 5-03127 for JWST. Support for this program at Rutgers University was provided by NASA through grant JWST-GO-02072.001.
The SALT data presented herein were obtained with Rutgers University program 2022-1-MLT-004 (PI S. W. Jha). We are grateful to SALT Astronomer Rosalind Skelton for taking these observations.
This work makes use of data from the Las Cumbres Observatory global network of telescopes. The LCO group is supported by NSF grants AST-1911151 and AST-1911225. This work also makes use of data gathered with the 6.5 meter Magellan telescopes at Las Campanas Observatory, Chile.
M.R.S. is supported by an STScI Postdoctoral Fellowship. G.D. acknowledges H2020 European Research Council grant #758638. L.A.K. acknowledges support by NASA FINESST fellowship 80NSSC22K1599. C.L. is supported by an NSF Graduate Research Fellowship under grant # DGE-2233066.
The UCSC team is supported in part by NASA grant NNG-17PX03C, National Science Foundation (NSF) grant AST-1815935, the Gordon and Betty Moore Foundation, the Heising-Simons Foundation, and a fellowship from the David and Lucile Packard Foundation to R.J.F. The work of A.V.F.’s supernova group at UC Berkeley is generously supported by the Christopher R. Redlich Fund, Alan Eustace (W.Z. is a Eustace Specialist in Astronomy), Frank and Kathleen Wood (T.G.B. is a Wood Specialist in Astronomy), Gary and Cynthia Bengier, Clark and Sharon Winslow, Sanford Robertson (Y.Y. is a Bengier-Winslow-Robertson Postdoctoral Fellow), and many other donors.
S.B. acknowledges support from the Alexander von Humboldt Foundation and from the “Programme National de Physique Stellaire” (PNPS) of CNRS/INSU cofunded by CEA and CNES. D.J.H. receives support through NASA astrophysical theory grant 80NSSC20K0524. J.V. and T.S. are supported by the NKFIH-OTKA grants K-142534 and FK-134432 of the Hungarian National Research, Development and Innovation (NRDI) Office, respectively. B.B. and T.S. are supported by the ÚNKP-22-4 and ÚNKP-22-5 New National Excellence Programs of the Ministry for Culture and Innovation from the source of the NRDI Fund, Hungary. T.S. is also supported by the János Bolyai Research Scholarship of the Hungarian Academy of Sciences. The research of J.C.W. and J.V. is supported by NSF grant AST-1813825.
A.F. acknowledges support by the European Research Council (ERC) under the European Union’s Horizon 2020 research and innovation program (ERC Advanced Grant KILONOVA #885281). M.D., K.M., and J.H.T. acknowledge support from EU H2020 ERC grant #758638. Research by Y.D. and S.V. is supported by NSF grant AST-2008108
Time-domain research by D.J.S. and the University of Arizona team is supported by NSF grants AST-1821987, 1813466, 1908972, and 2108032, and by the Heising-Simons Foundation under grant #2020–1864.
K.M. acknowledges support from the Japan Society for the Promotion of Science (JSPS) KAKENHI grant JP20H00174, and the JSPS Open Partnership Bilateral Joint Research Project (JPJSBP120209937).
L.G. acknowledges financial support from the Spanish Ministerio de Ciencia e Innovación (MCIN), the Agencia Estatal de Investigación (AEI) 10.13039/501100011033, and the European Social Fund (ESF) “Investing in your future” under the 2019 Ramón y Cajal program RYC2019-027683-I and the PID2020-115253GA-I00 HOSTFLOWS project, from Centro Superior de Investigaciones Científicas (CSIC) under the PIE project 20215AT016, and the program Unidad de Excelencia María de Maeztu CEX2020-001058-M.
J.P.H. acknowledges support from the George A. and Margaret M. Downsbrough bequest. The Aarhus supernova group is funded in part by an Experiment grant (#28021) from the Villum FONDEN, and by a project 1 grant (#8021-00170B) from the Independent Research Fund Denmark (IRFD).
This publication was made possible through the support of an LSSTC Catalyst Fellowship to K.A.B., funded through grant 62192 from the John Templeton Foundation to the LSST Corporation. The opinions expressed in this publication are those of the authors and do not necessarily reflect the views of LSSTC or the John Templeton Foundation.
Some of the data presented herein were obtained at the W. M. Keck Observatory, which is operated as a scientific partnership among the California Institute of Technology, the University of California, and NASA. The Observatory was made possible by the generous financial support of the W. M. Keck Foundation. The authors wish to recognize and acknowledge the very significant cultural role and reverence that the summit of Maunakea has always had within the indigenous Hawaiian community. We are most fortunate to have the opportunity to conduct observations from this mountain.
A major upgrade of the Kast spectrograph on the Shane 3 m telescope at Lick Observatory was made possible through generous gifts from the Heising-Simons Foundation as well as William and Marina Kast. Research at Lick Observatory is partially supported by a generous gift from Google.
We thank the Subaru staff for the data taken by the Subaru Telescope (S23A-023).
| Source | MJD | Filter | Brightness (mag) | Uncertainty (Mag) |
|---|---|---|---|---|
| ASAS-SN | 59786.7343 | g | 15.71 | 0.06 |
| ASAS-SN | 59786.7346 | g | 15.88 | 0.06 |
| ASAS-SN | 59786.7346 | g | 15.83 | 0.06 |
| ASAS-SN | 59787.9733 | g | 14.48 | 0.02 |
| ASAS-SN | 59787.9737 | g | 14.50 | 0.02 |
| ASAS-SN | 59787.9737 | g | 14.51 | 0.02 |
| ASAS-SN | 59789.9559 | g | 13.51 | 0.02 |
| ASAS-SN | 59790.7063 | g | 13.16 | 0.01 |
| ASAS-SN | 59790.7066 | g | 13.23 | 0.01 |
| ASAS-SN | 59790.7066 | g | 13.21 | 0.01 |
| AAVSO | 59790.9677 | I | 13.17 | 0.06 |
| ASAS-SN | 59790.9682 | g | 13.22 | 0.01 |
| AAVSO | 59790.9683 | I | 13.09 | 0.05 |
| ASAS-SN | 59790.9685 | g | 13.17 | 0.01 |
| ASAS-SN | 59790.9685 | g | 13.16 | 0.01 |
| AAVSO | 59790.9690 | V | 13.07 | 0.01 |
| AAVSO | 59790.9697 | V | 13.05 | 0.01 |
| AAVSO | 59790.9706 | B | 13.10 | 0.02 |
| AAVSO | 59790.9717 | B | 13.08 | 0.02 |
| AAVSO | 59790.9726 | R | 13.04 | 0.02 |
| AAVSO | 59790.9731 | R | 13.04 | 0.02 |
| Telescope | Instrument | MJD | Phase | Wavelength Range |
|---|---|---|---|---|
| ANU 2.3m | WiFeS | 59790.4 | -17 | 3789 - 8972 |
| UH 2.2m | SNIFS | 59792.3 | -15 | 4054 - 9073 |
| Lick | Kast | 59793.2 | -14 | 3247 - 10862 |
| Keck II | NIRES | 59944.6 | +137 | 9383 - 24615 |
| Lick | Kast | 59975.5 | +168 | 3244 - 10862 |
| Keck II | ESI | 59990.0 | +182 | 3938 - 10168 |
| Keck II | ESI | 60030.0 | +222 | 3938 - 10168 |
| Keck II | NIRES | 60033.4 | +226 | 9383 - 24613 |
| Lick | Kast | 60046.4 | +239 | 3244 - 10861 |
| Subaru | FOCAS | 60048.0 | +240 | 3642 - 9968 |
| Lick | Kast | 60055.4 | +248 | 3609 - 10706 |
| Lick | Kast | 60057.4 | +250 | 3244 - 10862 |
| Keck II | DEIMOS | 60057.5 | +267 | 4386 - 9597 |
| Lick | Kast | 60062.4 | +255 | 3611 - 10706 |
| Keck II | DEIMOS | 60075.3 | +267 | 4753 - 7393 |
| Lick | Kast | 60083.4 | +276 | 3493 - 10861 |
| Magellan | IMACS | 60078.0 | +270 | 4217 - 9388 |
| SOAR | Goodman | 60099.0 | +291 | 4922 - 8909 |
| Keck II | NIRES | 60102.4 | +294 | 9383 - 24615 |
| SOAR | Goodman | 60112.1 | +304 | 3990 - 6979 |
| SALT | RSS | 60117.0 | +309 | 3488 - 7237 |
| Lick | Kast | 60117.2 | +309 | 3611 - 10702 |
| MMT | Binospec | 60118.0 | +310 | 3815 - 9185 |
| Magellan | IMACS | 60120.0 | +312 | 3789 - 9451 |
| JWST | NIRspec | 60124.0 | +316 | 6018 - 49967 |
| JWST | MIRI | 60124.0 | +316 | 49645 - 140457 |
| GTC | OSIRIS | 60126.9 | +319 | 3627 - 10261 |
| Lick | Kast | 60144.2 | +336 | 3625 - 10688 |
References
- Adelman-McCarthy et al. (2008) Adelman-McCarthy, J. K., Agüeros, M. A., Allam, S. S., et al. 2008, ApJS, 175, 297, doi: 10.1086/524984
- Ashall et al. (2020) Ashall, C., Lu, J., Burns, C., et al. 2020, ApJ, 895, L3, doi: 10.3847/2041-8213/ab8e37
- Ashall et al. (2021) Ashall, C., Lu, J., Hsiao, E. Y., et al. 2021, ApJ, 922, 205, doi: 10.3847/1538-4357/ac19ac
- Astropy Collaboration et al. (2013) Astropy Collaboration, Robitaille, T. P., Tollerud, E. J., et al. 2013, A&A, 558, A33, doi: 10.1051/0004-6361/201322068
- Astropy Collaboration et al. (2018) Astropy Collaboration, Price-Whelan, A. M., Sipőcz, B. M., et al. 2018, AJ, 156, 123, doi: 10.3847/1538-3881/aabc4f
- Astropy Collaboration et al. (2022) Astropy Collaboration, Price-Whelan, A. M., Lim, P. L., et al. 2022, ApJ, 935, 167, doi: 10.3847/1538-4357/ac7c74
- Beiler et al. (2023) Beiler, S. A., Cushing, M. C., Kirkpatrick, J. D., et al. 2023, ApJ, 951, L48, doi: 10.3847/2041-8213/ace32c
- Bellm et al. (2019) Bellm, E. C., Kulkarni, S. R., Graham, M. J., et al. 2019, PASP, 131, 018002, doi: 10.1088/1538-3873/aaecbe
- Bessell (1999) Bessell, M. S. 1999, PASP, 111, 1426, doi: 10.1086/316454
- Birkmann et al. (2022) Birkmann, S. M., Giardino, G., Sirianni, M., et al. 2022, in Society of Photo-Optical Instrumentation Engineers (SPIE) Conference Series, Vol. 12180, Space Telescopes and Instrumentation 2022: Optical, Infrared, and Millimeter Wave, ed. L. E. Coyle, S. Matsuura, & M. D. Perrin, 121802P, doi: 10.1117/12.2629545
- Branch & Wheeler (2017) Branch, D., & Wheeler, J. C. 2017, Supernova Explosions (Springer Verlag), doi: 10.1007/978-3-662-55054-0
- Brown et al. (2013) Brown, T. M., Baliber, N., Bianco, F. B., et al. 2013, PASP, 125, 1031, doi: 10.1086/673168
- Bulla et al. (2016) Bulla, M., Sim, S. A., Pakmor, R., et al. 2016, MNRAS, 455, 1060, doi: 10.1093/mnras/stv2402
- Burke et al. (2021) Burke, J., Howell, D. A., Sarbadhicary, S. K., et al. 2021, ApJ, 919, 142, doi: 10.3847/1538-4357/ac126b
- Bushouse et al. (2022) Bushouse, H., Eisenhamer, J., Dencheva, N., et al. 2022, JWST Calibration Pipeline, 1.7.0, doi: 10.5281/zenodo.7038885
- Chandrasekhar (1931) Chandrasekhar, S. 1931, ApJ, 74, 81
- Chen et al. (2019) Chen, P., Dong, S., Katz, B., et al. 2019, ApJ, 880, 35, doi: 10.3847/1538-4357/ab2630
- Clemens et al. (2004) Clemens, J. C., Crain, J. A., & Anderson, R. 2004, in Society of Photo-Optical Instrumentation Engineers (SPIE) Conference Series, Vol. 5492, Ground-based Instrumentation for Astronomy, ed. A. F. M. Moorwood & M. Iye, 331–340, doi: 10.1117/12.550069
- Coulter et al. (2022) Coulter, D. A., Jones, D. O., McGill, P., et al. 2022, YSE-PZ: An Open-source Target and Observation Management System, v0.3.0, Zenodo, Zenodo, doi: 10.5281/zenodo.7278430
- Coulter et al. (2023) —. 2023, PASP, 135, 064501, doi: 10.1088/1538-3873/acd662
- Crawford et al. (2010) Crawford, S. M., Still, M., Schellart, P., et al. 2010, in Society of Photo-Optical Instrumentation Engineers (SPIE) Conference Series, Vol. 7737, Society of Photo-Optical Instrumentation Engineers (SPIE) Conference Series, 773725, doi: 10.1117/12.857000
- Cushing et al. (2004) Cushing, M. C., Vacca, W. D., & Rayner, J. T. 2004, PASP, 116, 362, doi: 10.1086/382907
- Dan et al. (2014) Dan, M., Rosswog, S., Brüggen, M., & Podsiadlowski, P. 2014, MNRAS, 438, 14, doi: 10.1093/mnras/stt1766
- DerKacy et al. (2023) DerKacy, J. M., Ashall, C., Hoeflich, P., et al. 2023, ApJ, 945, L2, doi: 10.3847/2041-8213/acb8a8
- Diamond et al. (2018) Diamond, T. R., Hoeflich, P., Hsiao, E. Y., et al. 2018, ApJ, 861, 119, doi: 10.3847/1538-4357/aac434
- Dimitriadis et al. (2022) Dimitriadis, G., Foley, R. J., Arendse, N., et al. 2022, ApJ, 927, 78, doi: 10.3847/1538-4357/ac4780
- Dimitriadis et al. (2023) Dimitriadis, G., Maguire, K., Karambelkar, V. R., et al. 2023, MNRAS, 521, 1162, doi: 10.1093/mnras/stad536
- Dopita et al. (2007) Dopita, M., Hart, J., McGregor, P., et al. 2007, Ap&SS, 310, 255, doi: 10.1007/s10509-007-9510-z
- Dressler et al. (2011) Dressler, A., Bigelow, B., Hare, T., et al. 2011, PASP, 123, 288, doi: 10.1086/658908
- Faber et al. (2003) Faber, S. M., Phillips, A. C., Kibrick, R. I., et al. 2003, in Instrument Design and Performance for Optical/Infrared Ground-based Telescopes. Edited by Iye, Masanori; Moorwood, Alan F. M. Proceedings of the SPIE, Volume 4841, pp. 1657-1669 (2003)., ed. M. Iye & A. F. M. Moorwood, 1657–1669
- Fabricant et al. (2019) Fabricant, D., Fata, R., Epps, H., et al. 2019, PASP, 131, 075004, doi: 10.1088/1538-3873/ab1d78
- Filippenko et al. (2003) Filippenko, A. V., Chornock, R., Swift, B., et al. 2003, IAU Circ., 8159, 2
- Fink et al. (2018) Fink, M., Kromer, M., Hillebrandt, W., et al. 2018, A&A, 618, A124, doi: 10.1051/0004-6361/201833475
- Fitzpatrick et al. (2019) Fitzpatrick, E. L., Massa, D., Gordon, K. D., Bohlin, R., & Clayton, G. C. 2019, ApJ, 886, 108, doi: 10.3847/1538-4357/ab4c3a
- Foley (2015) Foley, R. J. 2015, MNRAS, 452, 2463, doi: 10.1093/mnras/stv789
- Foley et al. (2016) Foley, R. J., Jha, S. W., Pan, Y.-C., et al. 2016, MNRAS, 461, 433, doi: 10.1093/mnras/stw1320
- Fox et al. (2016) Fox, O. D., Johansson, J., Kasliwal, M., et al. 2016, ApJ, 816, L13, doi: 10.3847/2041-8205/816/1/L13
- François et al. (2019) François, P., Morelli, L., Pizzella, A., et al. 2019, A&A, 621, A60, doi: 10.1051/0004-6361/201833956
- Ganeshalingam et al. (2012) Ganeshalingam, M., Li, W., Filippenko, A. V., et al. 2012, ApJ, 751, 142, doi: 10.1088/0004-637X/751/2/142
- Gordon et al. (2022) Gordon, K., Larson, K., McBride, A., et al. 2022, karllark/dust_extinction: NIRSpectralExtinctionAdded, v1.1, Zenodo, doi: 10.5281/zenodo.6397654
- Gordon et al. (2021) Gordon, K. D., Misselt, K. A., Bouwman, J., et al. 2021, ApJ, 916, 33, doi: 10.3847/1538-4357/ac00b7
- Hachinger et al. (2012a) Hachinger, S., Mazzali, P. A., Taubenberger, S., et al. 2012a, MNRAS, 427, 2057, doi: 10.1111/j.1365-2966.2012.22068.x
- Hachinger et al. (2012b) —. 2012b, MNRAS, 427, 2057, doi: 10.1111/j.1365-2966.2012.22068.x
- Hicken et al. (2007) Hicken, M., Garnavich, P. M., Prieto, J. L., et al. 2007, ApJ, 669, L17, doi: 10.1086/523301
- Höflich et al. (1996) Höflich, P., Khokhlov, A., Wheeler, J. C., et al. 1996, ApJ, 472, L81+, doi: 10.1086/310363
- Howell (2001) Howell, D. A. 2001, ApJ, 554, L193, doi: 10.1086/321702
- Howell et al. (2006) Howell, D. A., Sullivan, M., Nugent, P. E., et al. 2006, Nature, 443, 308, doi: 10.1038/nature05103
- Hsiao et al. (2020) Hsiao, E. Y., Hoeflich, P., Ashall, C., et al. 2020, ApJ, 900, 140, doi: 10.3847/1538-4357/abaf4c
- Iben & Tutukov (1984) Iben, I., J., & Tutukov, A. V. 1984, ApJ, 284, 719, doi: 10.1086/162455
- Iwamoto et al. (1999) Iwamoto, K., Brachwitz, F., Nomoto, K., et al. 1999, ApJS, 125, 439, doi: 10.1086/313278
- Jacobson-Galan et al. (2019) Jacobson-Galan, W. V., Polin, A., Foley, R. J., et al. 2019, arXiv e-prints, arXiv:1910.05436. https://arxiv.org/abs/1910.05436
- Jakobsen et al. (2022) Jakobsen, P., Ferruit, P., Alves de Oliveira, C., et al. 2022, A&A, 661, A80, doi: 10.1051/0004-6361/202142663
- Jerjen et al. (2004) Jerjen, H., Binggeli, B., & Barazza, F. D. 2004, AJ, 127, 771, doi: 10.1086/381065
- Jha et al. (2019) Jha, S. W., Maguire, K., & Sullivan, M. 2019, Nature Astronomy, 3, 706, doi: 10.1038/s41550-019-0858-0
- Jiang et al. (2021) Jiang, J.-a., Maeda, K., Kawabata, M., et al. 2021, ApJ, 923, L8, doi: 10.3847/2041-8213/ac375f
- Johansson et al. (2023) Johansson, J., Siebert, M. R., Kwok, L. A., et al. 2023, in preparation
- Kansky et al. (2019) Kansky, J., Chilingarian, I., Fabricant, D., et al. 2019, PASP, 131, 075005, doi: 10.1088/1538-3873/ab1ceb
- Kashi & Soker (2011) Kashi, A., & Soker, N. 2011, MNRAS, 417, 1466, doi: 10.1111/j.1365-2966.2011.19361.x
- Kashikawa et al. (2002) Kashikawa, N., Aoki, K., Asai, R., et al. 2002, PASJ, 54, 819, doi: 10.1093/pasj/54.6.819
- Kasliwal et al. (2012) Kasliwal, M. M., Kulkarni, S. R., Gal-Yam, A., et al. 2012, ApJ, 755, 161, doi: 10.1088/0004-637X/755/2/161
- Kendrew et al. (2015) Kendrew, S., Scheithauer, S., Bouchet, P., et al. 2015, PASP, 127, 623, doi: 10.1086/682255
- Kendrew et al. (2016) Kendrew, S., Scheithauer, S., Bouchet, P., et al. 2016, in Society of Photo-Optical Instrumentation Engineers (SPIE) Conference Series, Vol. 9904, Space Telescopes and Instrumentation 2016: Optical, Infrared, and Millimeter Wave, ed. H. A. MacEwen, G. G. Fazio, M. Lystrup, N. Batalha, N. Siegler, & E. C. Tong, 990443, doi: 10.1117/12.2232887
- Kerzendorf et al. (2017) Kerzendorf, W. E., McCully, C., Taubenberger, S., et al. 2017, MNRAS, 472, 2534, doi: 10.1093/mnras/stx1923
- Khan et al. (2011) Khan, R., Stanek, K. Z., Stoll, R., & Prieto, J. L. 2011, ApJ, 737, L24, doi: 10.1088/2041-8205/737/1/L24
- Kromer et al. (2013) Kromer, M., Fink, M., Stanishev, V., et al. 2013, MNRAS, 429, 2287, doi: 10.1093/mnras/sts498
- Kromer et al. (2016) Kromer, M., Fremling, C., Pakmor, R., et al. 2016, MNRAS, 459, 4428, doi: 10.1093/mnras/stw962
- Kwok et al. (2023a) Kwok, L. A., Siebert, M. R., Johansson, J., et al. 2023a, ApJ, submitted
- Kwok et al. (2023b) Kwok, L. A., Jha, S. W., Temim, T., et al. 2023b, ApJ, 944, L3, doi: 10.3847/2041-8213/acb4ec
- Leung & Nomoto (2020) Leung, S.-C., & Nomoto, K. 2020, ApJ, 888, 80, doi: 10.3847/1538-4357/ab5c1f
- Lu et al. (2021) Lu, J., Ashall, C., Hsiao, E. Y., et al. 2021, ApJ, 920, 107, doi: 10.3847/1538-4357/ac1606
- Lyman et al. (2014) Lyman, J. D., Levan, A. J., Church, R. P., Davies, M. B., & Tanvir, N. R. 2014, MNRAS, 444, 2157, doi: 10.1093/mnras/stu1574
- Maeda & Iwamoto (2009) Maeda, K., & Iwamoto, K. 2009, MNRAS, 394, 239, doi: 10.1111/j.1365-2966.2008.14179.x
- Maeda et al. (2023) Maeda, K., Jiang, J.-a., Doi, M., Kawabata, M., & Shigeyama, T. 2023, MNRAS, 521, 1897, doi: 10.1093/mnras/stad618
- Maeda et al. (2009) Maeda, K., Kawabata, K., Li, W., et al. 2009, ApJ, 690, 1745, doi: 10.1088/0004-637X/690/2/1745
- Maeda & Kawabata (2022) Maeda, K., & Kawabata, M. 2022, ApJ, 941, 15, doi: 10.3847/1538-4357/ac9df2
- Maguire et al. (2018) Maguire, K., Sim, S. A., Shingles, L., et al. 2018, MNRAS, 477, 3567, doi: 10.1093/mnras/sty820
- Mazzali et al. (2022) Mazzali, P. A., Benetti, S., Stritzinger, M., & Ashall, C. 2022, MNRAS, 511, 5560, doi: 10.1093/mnras/stac409
- Milisavljevic et al. (2017) Milisavljevic, D., Patnaude, D. J., Raymond, J. C., et al. 2017, ApJ, 846, 50, doi: 10.3847/1538-4357/aa7d9f
- Miller & Stone (1993) Miller, J. S., & Stone, R. P. S. 1993, Lick Obs. Tech. Rep. 66 (Santa Cruz: Lick Obs.)
- Moll et al. (2014) Moll, R., Raskin, C., Kasen, D., & Woosley, S. E. 2014, ApJ, 785, 105, doi: 10.1088/0004-637X/785/2/105
- Nagao et al. (2016) Nagao, T., Maeda, K., & Nozawa, T. 2016, ApJ, 823, 104, doi: 10.3847/0004-637X/823/2/104
- Nagao et al. (2017) Nagao, T., Maeda, K., & Yamanaka, M. 2017, ApJ, 835, 143, doi: 10.3847/1538-4357/835/2/143
- Nagao et al. (2018) —. 2018, MNRAS, 476, 4806, doi: 10.1093/mnras/sty538
- Noebauer et al. (2016) Noebauer, U. M., Taubenberger, S., Blinnikov, S., Sorokina, E., & Hillebrandt, W. 2016, MNRAS, 463, 2972, doi: 10.1093/mnras/stw2197
- Nomoto & Leung (2018) Nomoto, K., & Leung, S.-C. 2018, Space Sci. Rev., 214, 67, doi: 10.1007/s11214-018-0499-0
- Oke & Gunn (1983) Oke, J. B., & Gunn, J. E. 1983, ApJ, 266, 713
- Pakmor et al. (2010) Pakmor, R., Kromer, M., Röpke, F. K., et al. 2010, Nature, 463, 61, doi: 10.1038/nature08642
- Pakmor et al. (2012) Pakmor, R., Kromer, M., Taubenberger, S., et al. 2012, ApJ, 747, L10, doi: 10.1088/2041-8205/747/1/L10
- Perley (2019) Perley, D. A. 2019, PASP, 131, 084503, doi: 10.1088/1538-3873/ab215d
- Perlmutter et al. (1999) Perlmutter, S., Aldering, G., Goldhaber, G., et al. 1999, ApJ, 517, 565, doi: 10.1086/307221
- Phillips (1993) Phillips, M. M. 1993, ApJ, 413, L105, doi: 10.1086/186970
- Polin et al. (2019) Polin, A., Nugent, P., & Kasen, D. 2019, ApJ, 873, 84, doi: 10.3847/1538-4357/aafb6a
- Polin et al. (2021) —. 2021, ApJ, 906, 65, doi: 10.3847/1538-4357/abcccc
- Prentice et al. (2022) Prentice, S. J., Maguire, K., Siebenaler, L., & Jerkstrand, A. 2022, MNRAS, 514, 5686, doi: 10.1093/mnras/stac1657
- Prochaska et al. (2020) Prochaska, J., Hennawi, J., Westfall, K., et al. 2020, The Journal of Open Source Software, 5, 2308, doi: 10.21105/joss.02308
- Raskin & Kasen (2013) Raskin, C., & Kasen, D. 2013, ApJ, 772, 1, doi: 10.1088/0004-637X/772/1/1
- Raskin et al. (2014) Raskin, C., Kasen, D., Moll, R., Schwab, J., & Woosley, S. 2014, ApJ, 788, 75, doi: 10.1088/0004-637X/788/1/75
- Riess et al. (1998) Riess, A. G., Filippenko, A. V., Challis, P., et al. 1998, AJ, 116, 1009
- Rigby et al. (2022) Rigby, J., Perrin, M., McElwain, M., et al. 2022, arXiv e-prints, arXiv:2207.05632. https://arxiv.org/abs/2207.05632
- Röpke et al. (2007) Röpke, F. K., Woosley, S. E., & Hillebrandt, W. 2007, ApJ, 660, 1344, doi: 10.1086/512769
- Scalzo et al. (2010) Scalzo, R. A., Aldering, G., Antilogus, P., et al. 2010, ApJ, 713, 1073, doi: 10.1088/0004-637X/713/2/1073
- Schlafly & Finkbeiner (2011) Schlafly, E. F., & Finkbeiner, D. P. 2011, ApJ, 737, 103, doi: 10.1088/0004-637X/737/2/103
- Schwab et al. (2016) Schwab, J., Quataert, E., & Kasen, D. 2016, MNRAS, 463, 3461, doi: 10.1093/mnras/stw2249
- Science Software Branch at STScI (2012) Science Software Branch at STScI. 2012, PyRAF: Python alternative for IRAF, Astrophysics Source Code Library, record ascl:1207.011. http://ascl.net/1207.011
- Seitenzahl et al. (2013) Seitenzahl, I. R., Ciaraldi-Schoolmann, F., Röpke, F. K., et al. 2013, MNRAS, 429, 1156, doi: 10.1093/mnras/sts402
- Shappee et al. (2014) Shappee, B. J., Prieto, J. L., Grupe, D., et al. 2014, ApJ, 788, 48, doi: 10.1088/0004-637X/788/1/48
- Sheinis et al. (2002) Sheinis, A. I., Bolte, M., Epps, H. W., et al. 2002, PASP, 114, 851, doi: 10.1086/341706
- Shen & Moore (2014) Shen, K. J., & Moore, K. 2014, ApJ, 797, 46, doi: 10.1088/0004-637X/797/1/46
- Shen et al. (2019) Shen, K. J., Quataert, E., & Pakmor, R. 2019, ApJ, 887, 180, doi: 10.3847/1538-4357/ab5370
- Siebert et al. (2020) Siebert, M. R., Dimitriadis, G., Polin, A., & Foley, R. J. 2020, ApJ, 900, L27, doi: 10.3847/2041-8213/abae6e
- Siebert et al. (2023) Siebert, M. R., Foley, R. J., Zenati, Y., et al. 2023, arXiv e-prints, arXiv:2306.11788, doi: 10.48550/arXiv.2306.11788
- Silverman et al. (2011) Silverman, J. M., Ganeshalingam, M., Li, W., et al. 2011, MNRAS, 410, 585, doi: 10.1111/j.1365-2966.2010.17474.x
- Silverman et al. (2012) Silverman, J. M., Foley, R. J., Filippenko, A. V., et al. 2012, MNRAS, 425, 1789, doi: 10.1111/j.1365-2966.2012.21270.x
- Silverman et al. (2013) Silverman, J. M., Nugent, P. E., Gal-Yam, A., et al. 2013, ApJS, 207, 3, doi: 10.1088/0067-0049/207/1/3
- Smith et al. (2020) Smith, M., Sullivan, M., Wiseman, P., et al. 2020, arXiv e-prints, arXiv:2001.11294. https://arxiv.org/abs/2001.11294
- Smith et al. (2006) Smith, M. P., Nordsieck, K. H., Burgh, E. B., et al. 2006, in Society of Photo-Optical Instrumentation Engineers (SPIE) Conference Series, Vol. 6269, Society of Photo-Optical Instrumentation Engineers (SPIE) Conference Series, 62692A, doi: 10.1117/12.672415
- Smith et al. (2008) Smith, N., Foley, R. J., & Filippenko, A. V. 2008, ApJ, 680, 568, doi: 10.1086/587860
- Srivastav et al. (2023) Srivastav, S., Smartt, S. J., Huber, M. E., et al. 2023, ApJ, 943, L20, doi: 10.3847/2041-8213/acb2ce
- Tanaka et al. (2010) Tanaka, M., Kawabata, K. S., Yamanaka, M., et al. 2010, ApJ, 714, 1209, doi: 10.1088/0004-637X/714/2/1209
- Taubenberger (2017) Taubenberger, S. 2017, in Handbook of Supernovae, ed. A. W. Alsabti & P. Murdin (Springer Cham), 317, doi: 10.1007/978-3-319-21846-5_37
- Taubenberger et al. (2013a) Taubenberger, S., Kromer, M., Pakmor, R., et al. 2013a, ApJ, 775, L43, doi: 10.1088/2041-8205/775/2/L43
- Taubenberger et al. (2011) Taubenberger, S., Benetti, S., Childress, M., et al. 2011, MNRAS, 412, 2735, doi: 10.1111/j.1365-2966.2010.18107.x
- Taubenberger et al. (2013b) Taubenberger, S., Kromer, M., Hachinger, S., et al. 2013b, MNRAS, 432, 3117, doi: 10.1093/mnras/stt668
- Taubenberger et al. (2019) Taubenberger, S., Floers, A., Vogl, C., et al. 2019, MNRAS, 488, 5473, doi: 10.1093/mnras/stz1977
- Tonry et al. (2018) Tonry, J. L., Denneau, L., Heinze, A. N., et al. 2018, PASP, 130, 064505, doi: 10.1088/1538-3873/aabadf
- Townsley et al. (2019) Townsley, D. M., Miles, B. J., Shen, K. J., & Kasen, D. 2019, ApJ, 878, L38, doi: 10.3847/2041-8213/ab27cd
- Tripp (1998) Tripp, R. 1998, A&A, 331, 815
- Tucker et al. (2022a) Tucker, M. A., Ashall, C., Shappee, B. J., et al. 2022a, ApJ, 926, L25, doi: 10.3847/2041-8213/ac4fbd
- Tucker et al. (2022b) Tucker, M. A., Shappee, B. J., Huber, M. E., et al. 2022b, PASP, 134, 124502, doi: 10.1088/1538-3873/aca719
- Tully et al. (2013) Tully, R. B., Courtois, H. M., Dolphin, A. E., et al. 2013, AJ, 146, 86, doi: 10.1088/0004-6256/146/4/86
- Tutukov & Yungelson (1994) Tutukov, A. V., & Yungelson, L. R. 1994, MNRAS, 268, 871
- Vacca et al. (2003) Vacca, W. D., Cushing, M. C., & Rayner, J. T. 2003, PASP, 115, 389, doi: 10.1086/346193
- Valenti et al. (2014) Valenti, S., Yuan, F., Taubenberger, S., et al. 2014, MNRAS, 437, 1519, doi: 10.1093/mnras/stt1983
- Valenti et al. (2016) Valenti, S., Howell, D. A., Stritzinger, M. D., et al. 2016, MNRAS, 459, 3939, doi: 10.1093/mnras/stw870
- Webbink (1984) Webbink, R. F. 1984, ApJ, 277, 355, doi: 10.1086/161701
- Whelan & Iben (1973) Whelan, J., & Iben, I. J. 1973, ApJ, 186, 1007, doi: 10.1086/152565
- Wilk et al. (2020) Wilk, K. D., Hillier, D. J., & Dessart, L. 2020, MNRAS, 494, 2221, doi: 10.1093/mnras/staa640
- Wilson et al. (2004) Wilson, J. C., Henderson, C. P., Herter, T. L., et al. 2004, in Society of Photo-Optical Instrumentation Engineers (SPIE) Conference Series, Vol. 5492, Society of Photo-Optical Instrumentation Engineers (SPIE) Conference Series, ed. A. F. M. Moorwood & M. Iye, 1295–1305, doi: 10.1117/12.550925
- Woosley & Kasen (2011) Woosley, S. E., & Kasen, D. 2011, ApJ, 734, 38, doi: 10.1088/0004-637X/734/1/38
- Yamanaka et al. (2009) Yamanaka, M., Kawabata, K. S., Kinugasa, K., et al. 2009, ApJ, 707, L118, doi: 10.1088/0004-637X/707/2/L118
- Yamanaka et al. (2016) Yamanaka, M., Maeda, K., Tanaka, M., et al. 2016, PASJ, 68, 68, doi: 10.1093/pasj/psw047
- Yoon & Langer (2005) Yoon, S. C., & Langer, N. 2005, A&A, 435, 967, doi: 10.1051/0004-6361:20042542
- Zenati et al. (2023) Zenati, Y., Perets, H. B., Dessart, L., et al. 2023, ApJ, 944, 22, doi: 10.3847/1538-4357/acaf65