Particle-in-cell Simulations of the Magnetorotational Instability
in Stratified Shearing Boxes
Abstract
The magnetorotational instability (MRI) plays a crucial role in regulating the accretion efficiency in astrophysical accretion disks. In low-luminosity disks around black holes, such as Sgr A* and M87, Coulomb collisions are infrequent, making the MRI physics effectively collisionless. The collisionless MRI gives rise to kinetic plasma effects that can potentially affect its dynamic and thermodynamic properties. We present 2D and 3D particle-in-cell (PIC) plasma simulations of the collisionless MRI in stratified disks using shearing boxes with net vertical field. We use pair plasmas, with initial and concentrate on sub-relativistic plasma temperatures (). Our 2D and 3D runs show disk expansion, particle and magnetic field outflows, and a dynamo-like process. They also produce magnetic pressure dominated disks with (Maxwell stress dominated) viscosity parameter . By the end of the simulations, the dynamo-like magnetic field tends to dominate the magnetic energy and the viscosity in the disks. Our 2D and 3D runs produce fairly similar results, and are also consistent with previous 3D MHD simulations. Our simulations also show nonthermal particle acceleration, approximately characterized by power-law tails with temperature dependent spectral indices . For temperatures , we find . The maximum accelerated particle energy depends on the scale separation between MHD and Larmor-scale plasma phenomena in a way consistent with previous PIC results of magnetic reconnection-driven acceleration. Our study constitutes a first step towards modeling from first principles potentially observable stratified MRI effects in low-luminosity accretion disks around black holes.
keywords:
plasmas – instabilities – accretion disks – acceleration of particles – dynamo1 Introduction
The primary driver of accretion in astrophysical disks is believed to be the turbulence generated by the magnetorotational instability (MRI; Balbus & Hawley, 1991, 1998), which provides the needed outward transport of angular momentum. Most of our knowledge about the nonlinear evolution of the MRI in different disk regimes comes from magnetohydrodynamic (MHD) simulations. However, in the regime where the plasma accretion rate is much lower than the Eddington rate, the Coulomb mean free path of the particles can be much larger than the system size, rendering the disk effectively collisionless and making the MHD approach inapplicable. This collisionless accretion regime is expected, for instance, in the low-hard state of X-ray binaries (Esin et al., 1997) as well as around the central supermassive black holes of most nearby galaxies, including M87 and Sagittarius A* (Sgr A*) in our own Milky Way (Yuan & Narayan, 2014).
The collisionless version of the MRI can give rise to several kinetic plasma phenomena, which may in turn affect its dynamics as well as the thermodynamic properties of the accreting plasma. These kinetic phenomena have been studied mainly via unstratified shearing-box MRI simulations, using either a fluid approach through kinetic-MHD models (Sharma et al., 2006, 2007) or particle simulations that employ either the hybrid or the particle-in-cell (PIC) methods (Riquelme et al., 2012; Hoshino, 2013, 2015; Kunz et al., 2016; Inchingolo et al., 2018; Bacchini et al., 2022). One of the relevant kinetic phenomena is the appearance of an anisotropic stress, which is due to the presence of a pressure anisotropy in the accreting turbulence. Previous unstratified shearing-box simulation studies, both based on fluid and particle methods, have found that this anisotropic stress may contribute significantly to the disk viscosity, making the collisionless MRI turbulence more efficient in transporting angular momentum compared to its collisional counterpart.
Another potentially important collisionless phenomenon is the possibly different ion and electron heating rates (e.g., Sharma et al., 2007). However, to date PIC studies have only used an ion to electron mass ratio (or close to unity), therefore not capturing the possibly different heating efficiencies of the different species. Plasma energization can also include nonthermal particle acceleration. Studying this phenomenon requires fully kinetic treatments of at least one species, which has been done through PIC and hybrid simulations. Different levels of nonthermal particle acceleration have indeed been found by these types of studies (Riquelme et al., 2012; Hoshino, 2013, 2015; Kunz et al., 2016; Inchingolo et al., 2018; Bacchini et al., 2022), although the conditions under which this acceleration is most efficient and the mechanism(s) underlying this phenomenon remain to be clarified.
An important physical ingredient, so far not included in hybrid or fully kinetic PIC studies of the MRI, is the vertical stratification of the disks. While the unstratified local shearing-box approximation allows us to investigate a disk by focusing on a small vertical section, this approach does not account for potentially important processes in stratified disks, such as outflows, disk expansion and the generation of a corona, among others. Stratified disks have been included in previous MHD shearing-box simulations of the MRI, which have found that stratification can give rise to important phenomena like outflows and dynamo-like processes, which may in turn affect the overall accretion efficiency of the disks (Bai & Stone, 2013; Salvesen et al., 2016). Also, a kinetic-MHD study that considers a stratified disk (Hirabayashi & Hoshino, 2017) has found that disk stratification may decrease the importance of anisotropic stress significantly compared to unstratified kinetic-MHD results.
To address these possible effects, our study employs 2D and 3D stratified shearing-box PIC simulations to examine the development of the collisionless MRI. We use equal ion and electron masses, for computational convenience, and focus on the sub-relativistic temperature regime, relevant for the inner regions of black hole accretion disks (, where is the Boltzmann constant, is the plasma temperature and is the speed of light). By comparing with unstratified PIC runs, we show the importance of including stratification to describe phenomena like plasma beta evolution, effective viscosity and particle acceleration. In our 2D runs we pay special attention to the role played by the ratio between the initial cyclotron frequency of the particles and the Keplerian frequency of the disk, (hereafter, the scale-separation ratio). In realistic disks, this ratio satisfies and determines the scale separation between mesoscale MHD phenomena and kinetic microphysical processes. Even though most of our analysis is done in 2D, in this paper we take a step forward by conducting the first fully kinetic 3D simulation of the stratified MRI evolution. This preliminary 3D simulation enables us to compare it with our established 2D results and gain valuable insight into the limitations of the 2D approach. This exploration sets the stage for future investigations aimed at fully unraveling the complexities of the 3D scenario.
The paper is organized as follows. In §2 we describe our numerical method and simulation setup. In §3 and §4 we present the general properties of the stratified MRI turbulence in 2D and 3D, respectively. In §5 we quantify the effective viscosity in our runs, and in §6 we analyze the ability of the stratified MRI turbulence to accelerate particles. Finally, we present our conclusions in §7.
2 Simulation Setup
We use the electromagnetic PIC code TRISTAN-MP (Buneman, 1993; Spitkovsky, 2005) in 2D and 3D. Our simulations are performed in the local, shearing-box approximation (Hawley et al., 1995), using Cartesian coordinates where the , and axes correspond to the radial, azimuthal (or toroidal) and vertical directions of the disk, respectively. This reference frame rotates with an angular velocity , corresponding to the Keplerian angular velocity at a radius that coincides with the center of our simulation box. In order to model a stratified disk, we include the vertical component of the gravitational force produced by the central object, , and we initially set up an isothermal disk in hydrostatic equilibrium with a -dependent density profile:
| (1) |
where is the plasma density at the disk midplane (considering both species), is the scale height of the disk given by and is the initial plasma temperature, which is given by in all of our runs. Our runs do not include any type of particle cooling, so a gradual increase in the temperature and scale height of the simulated disks is expected due to dissipation of magnetic energy. The whole simulation domain is initially threaded by a vertical, homogeneous magnetic field , so that the initial plasma parameter in the disk midplane, (), has a value of . These choices for and imply that the initial Alfvén velocity in the disk midplane, (), is in all of our runs.
2.1 Basic Equations
In our rotating frame, the time derivative of particles momentum is determined by the Lorentz force, the radial and vertical components of gravity, and the Coriolis force:111Since Coriolis forces conserve kinetic energy, the standard Coriolis expression for the evolution of , , can be directly translated into a relativistic momentum evolution as .
| (2) |
where , , and are, respectively, the particle velocity, the particle charge and the electric and magnetic fields. In this non-inertial frame, Maxwell’s equations also acquire extra terms, which modify the evolution of the electric field as (Schiff, 1939):
| (3) |
where is the current density and is the Keplerian rotation velocity of the disk at the center of our simulation box (the evolution of the magnetic field is not modified in the rotating frame). As discussed in Riquelme et al. (2012), the terms proportional to in Eq. 3 can in principle be comparable to the displacement current , but should not change the non-relativistic MHD behavior of the plasma. This is because, in the non-relativistic regime (), these extra terms are always much smaller than the first term on the right hand side of Eq. 3 (). Therefore, the current density should still adjust to satisfy , as assumed in the non-relativistic MHD approach. Thus, as it has been done in all previous PIC and hybrid studies of the MRI, we drop the terms proportional to in Eq. 3 and solve the conventional Maxwell’s equations. We are thus implicitly assuming that these (beyond MHD) modifications to the displacement current do not affect considerably the kinetic MRI dynamics.
| Run | UN2D-20 | ST2D-28 | ST2D-20 | ST2D-14 | ST2D-10 | ST2D-7 | ST2D-3.5 | ST3D-3.5 |
| 20 | 28 | 20 | 14 | 10 | 7 | 3.5 | 3.5 | |
| [] | 22 | 35 | 43 | 47 | 46 | 46 | 48 | 24 |
| [] | - | - | - | - | - | - | - | 24 |
| [] | 22 | 120 | 89 | 95 | 92 | 93 | 96 | 96 |
| [] | 0.35 | 0.35 | 0.35 | 0.35 | 0.35 | 0.35 | 0.35 | 0.35 |
| 25 | 400 | 350 | 200 | 200 | 200 | 200 | 30 | |
| [] | 0.45 | 0.45 | 0.45 | 0.45 | 0.45 | 0.45 | 0.45 | 0.225 |
-
•
We list the initial parameters of our simulations, which are: the scale-separation ratio , where is the initial cyclotron frequency of the particles, the box size along the different axes (, and ) in terms of , the grid spacing (equal in all dimensions) in terms of the initial plasma skin depth, , the initial number of particles (ions and electrons) per cell, and the speed of light in units of , where is the simulation time step.
2.2 Shearing Coordinates
Simulating the MRI in the shearing-box approximation requires implementing shearing periodic boundary conditions in the radial () direction (e.g., Hawley et al., 1995). We do this by employing shearing coordinates (Riquelme et al., 2012), in which the grid follows the shearing velocity profile within the shearing box, allowing the use of standard periodic boundary conditions in the radial () direction. However, the use of shearing coordinates introduces modifications in the evolution of the electric and magnetic fields, as well as in the evolution of particles momenta and positions. These modifications are described in detail in the Appendix of Riquelme et al. (2012) and, for easy access, are also summarized below.
In the shearing coordinates, the fields evolve as
The last terms in these equations, which are proportional to (hereafter, the -dependent terms), can, however, be neglected in the regime, as it is shown below. This can be seen considering that the size of our shearing-boxes in the direction should be typically a few times the wavelength of the most unstable MRI modes , which means that (the fact that is the dominant scale of the MRI turbulence even in its nonlinear stage will be shown in §4.1 and further discussed in §4.2). Also, assuming that the order of magnitude of the time derivative of any field component should satisfy , one can calculate the ratios between the magnitudes of the dependent terms in Eqs. 2.2 and 2.2 and the left hand side of these equations, obtaining:
| (6) |
for Eq. 2.2 and
| (7) |
for Eq. 2.2. Since in general (which is verified in §4.2), the right hand side of Eq. 6 is much smaller than unity as long as , implying that the -dependent term in Eq. 2.2 can be safely neglected. The right hand side of Eq. 7, on the other hand, is not necessarily since its value depends on the precise magnitude of the ratio , which makes the dependent term in Eq. 2.2 not necessarily negligible. However, using the approximation , we can calculate the ratio between the magnitude of this dependent term and an estimate of the magnitude of the first term on the right hand side of Eq. 2.2 (), obtaining:
| (8) |
This implies that dropping the dependent term in Eq. 2.2 should not change the non-relativistic MHD behavior of the plasma, in which , and is also consistent with our previous choice of ignoring the terms proportional to in Eq. 3. Doing a similar analysis, we find that the ratio between the magnitudes of the third and the first terms on the right hand side of Eq. 2.2 is
| (9) |
so, for consistency, we also neglect the former. Therefore, in our simulations we evolve the fields by solving the equations:
| (11) |
In terms of particles evolution, in the shearing coordinates each particle’s momentum evolves as (Riquelme et al., 2012):
| (12) |
which is valid in the limit and as long as the shear velocity of the plasma within our simulation domain, , is non-relativistic. This last assumption is justified since , and in our shearing-box is also of the order of a few times . This implies that , making Eq. 12 valid in the regime .
Finally, the evolution of the particles position is given by:
| (13) |
which is obtained combining Eqs. A30 and A35 of Riquelme et al. (2012) also in the limit in which is non-relativistic.
In order to safeguard the numerical stability and accuracy of our simulations, every time the factor on the right hand side of Eqs. 2.2, 11 and 13 equals an integer, we reset these equations to their initial () shape. This implies a periodic “unshearing" of our shearing grid that, therefore, requires a remapping of the electric and magnetic fields, as well as of the particles positions. This periodic redefinition of the time origin in our runs means that the factors in Eqs. 2.2, 11 and 13 never surpass unity. Notice also that Eq. 13 implies that relativistic particles may in principle change position in the direction at a rate close to twice the speed of light. This should not be considered a violation of special relativity, since this equation only describes the update of particle positions in our non-inertial, time-varying shearing coordinates. However, this situation may affect the numerical stability of our method. In order to avoid this possibility, our 3D runs use . Since this is not an issue in our 2D runs, in those cases we use (see Table 1).
We emphasize that, in order to obtain our plasma evolution equations, we have assumed a non-relativistic plasma with , which rotates at non-relativistic velocities (). This implies that our work strictly applies to a plasma at radii significantly larger than the gravitational radius of a central black hole. For this reason, in this work we concentrate on a sub-relativistic regime, where the plasma temperature satisfies . Notice, however, that the treatment of individual particles is relativistic, since (as we see below) a small fraction of them can still be nonthermally accelerated to energies much larger than .
2.3 Boundary conditions along
Using shearing coordinates allows the use of periodic boundary conditions both in the (radial) and (toroidal) coordinates. In the coordinate we use open boundary conditions, which allow the existence of field and particle outflows in our stratified setup. Thus, in our runs particles are removed from the simulation box after they cross the vertical boundaries, while the fields are absorbed by these boundaries. This configuration effectively prevents outflowing fields from rebounding into the simulation domain (Cerutti et al., 2015; Belyaev, 2015; Sironi et al., 2016). This is done by implementing an absorption layer of width in the vertical boundaries, where the terms
| (14) |
are added to the right hand side of Eqs. 2.2 and 11, respectively. We use cells and within the absorption layer ( otherwise), where is the inner edge of the absorption layer and is the simulation time step.
2.4 Numerical parameters
The simulations presented in this paper and their numerical parameters are listed in Table 1, with all physical quantities in stratified runs corresponding to plasma conditions in the disk midplane. These parameters are the scale-separation ratio , where is the initial cyclotron frequency of the particles, the box size along the different axes (, and ) in terms of , the grid spacing in terms of the initial plasma skin depth, , the initial number of macro-particles (ions and electrons) per cell and the speed of light in units of , where is the simulation time step. Notice that we ran simulations using several values of , and , and to make sure that our results are numerically converged. Table 1 only includes the simulations used to present our results.
2.5 Notation Convention
In this section, we introduce various types of averages denoted by angled brackets with different subscripts, namely , , and . denotes the average along the axis at a fixed height for 2D stratified simulations, denotes the average over the plane at a fixed for 3D stratified simulations, and represents the average taken over the volume of the disk for stratified simulations, while for unstratified simulations it represents the average over the entire simulation domain.
Additionally, we use an overline notation () for quantities that are computed as the ratio of two volume averages. For instance, for the plasma and temperature we define and . In these expressions, , where denotes the isotropic pressure, and and correspond to the pressure parallel and perpendicular to the local magnetic field, respectively.
Since in the stratified runs these averages are calculated in the disk region, we define this region through the condition , where denotes the instantaneous scale height of the disk. Notice that the calculation of has to be done in the disk region itself, whose definition depends on through the inequality , implying that the of the disk has to be determined recursively.
3 2D results
In this section we describe the stratified MRI turbulence using 2D simulations, paying special attention to the difference between stratified and unstratified simulations and to the role played by the scale-separation ratio . In §3.1 we analyze the properties of the turbulence, and in §3.2 we show the evolution of the plasma properties in the disk.
3.1 Turbulence properties in 2D
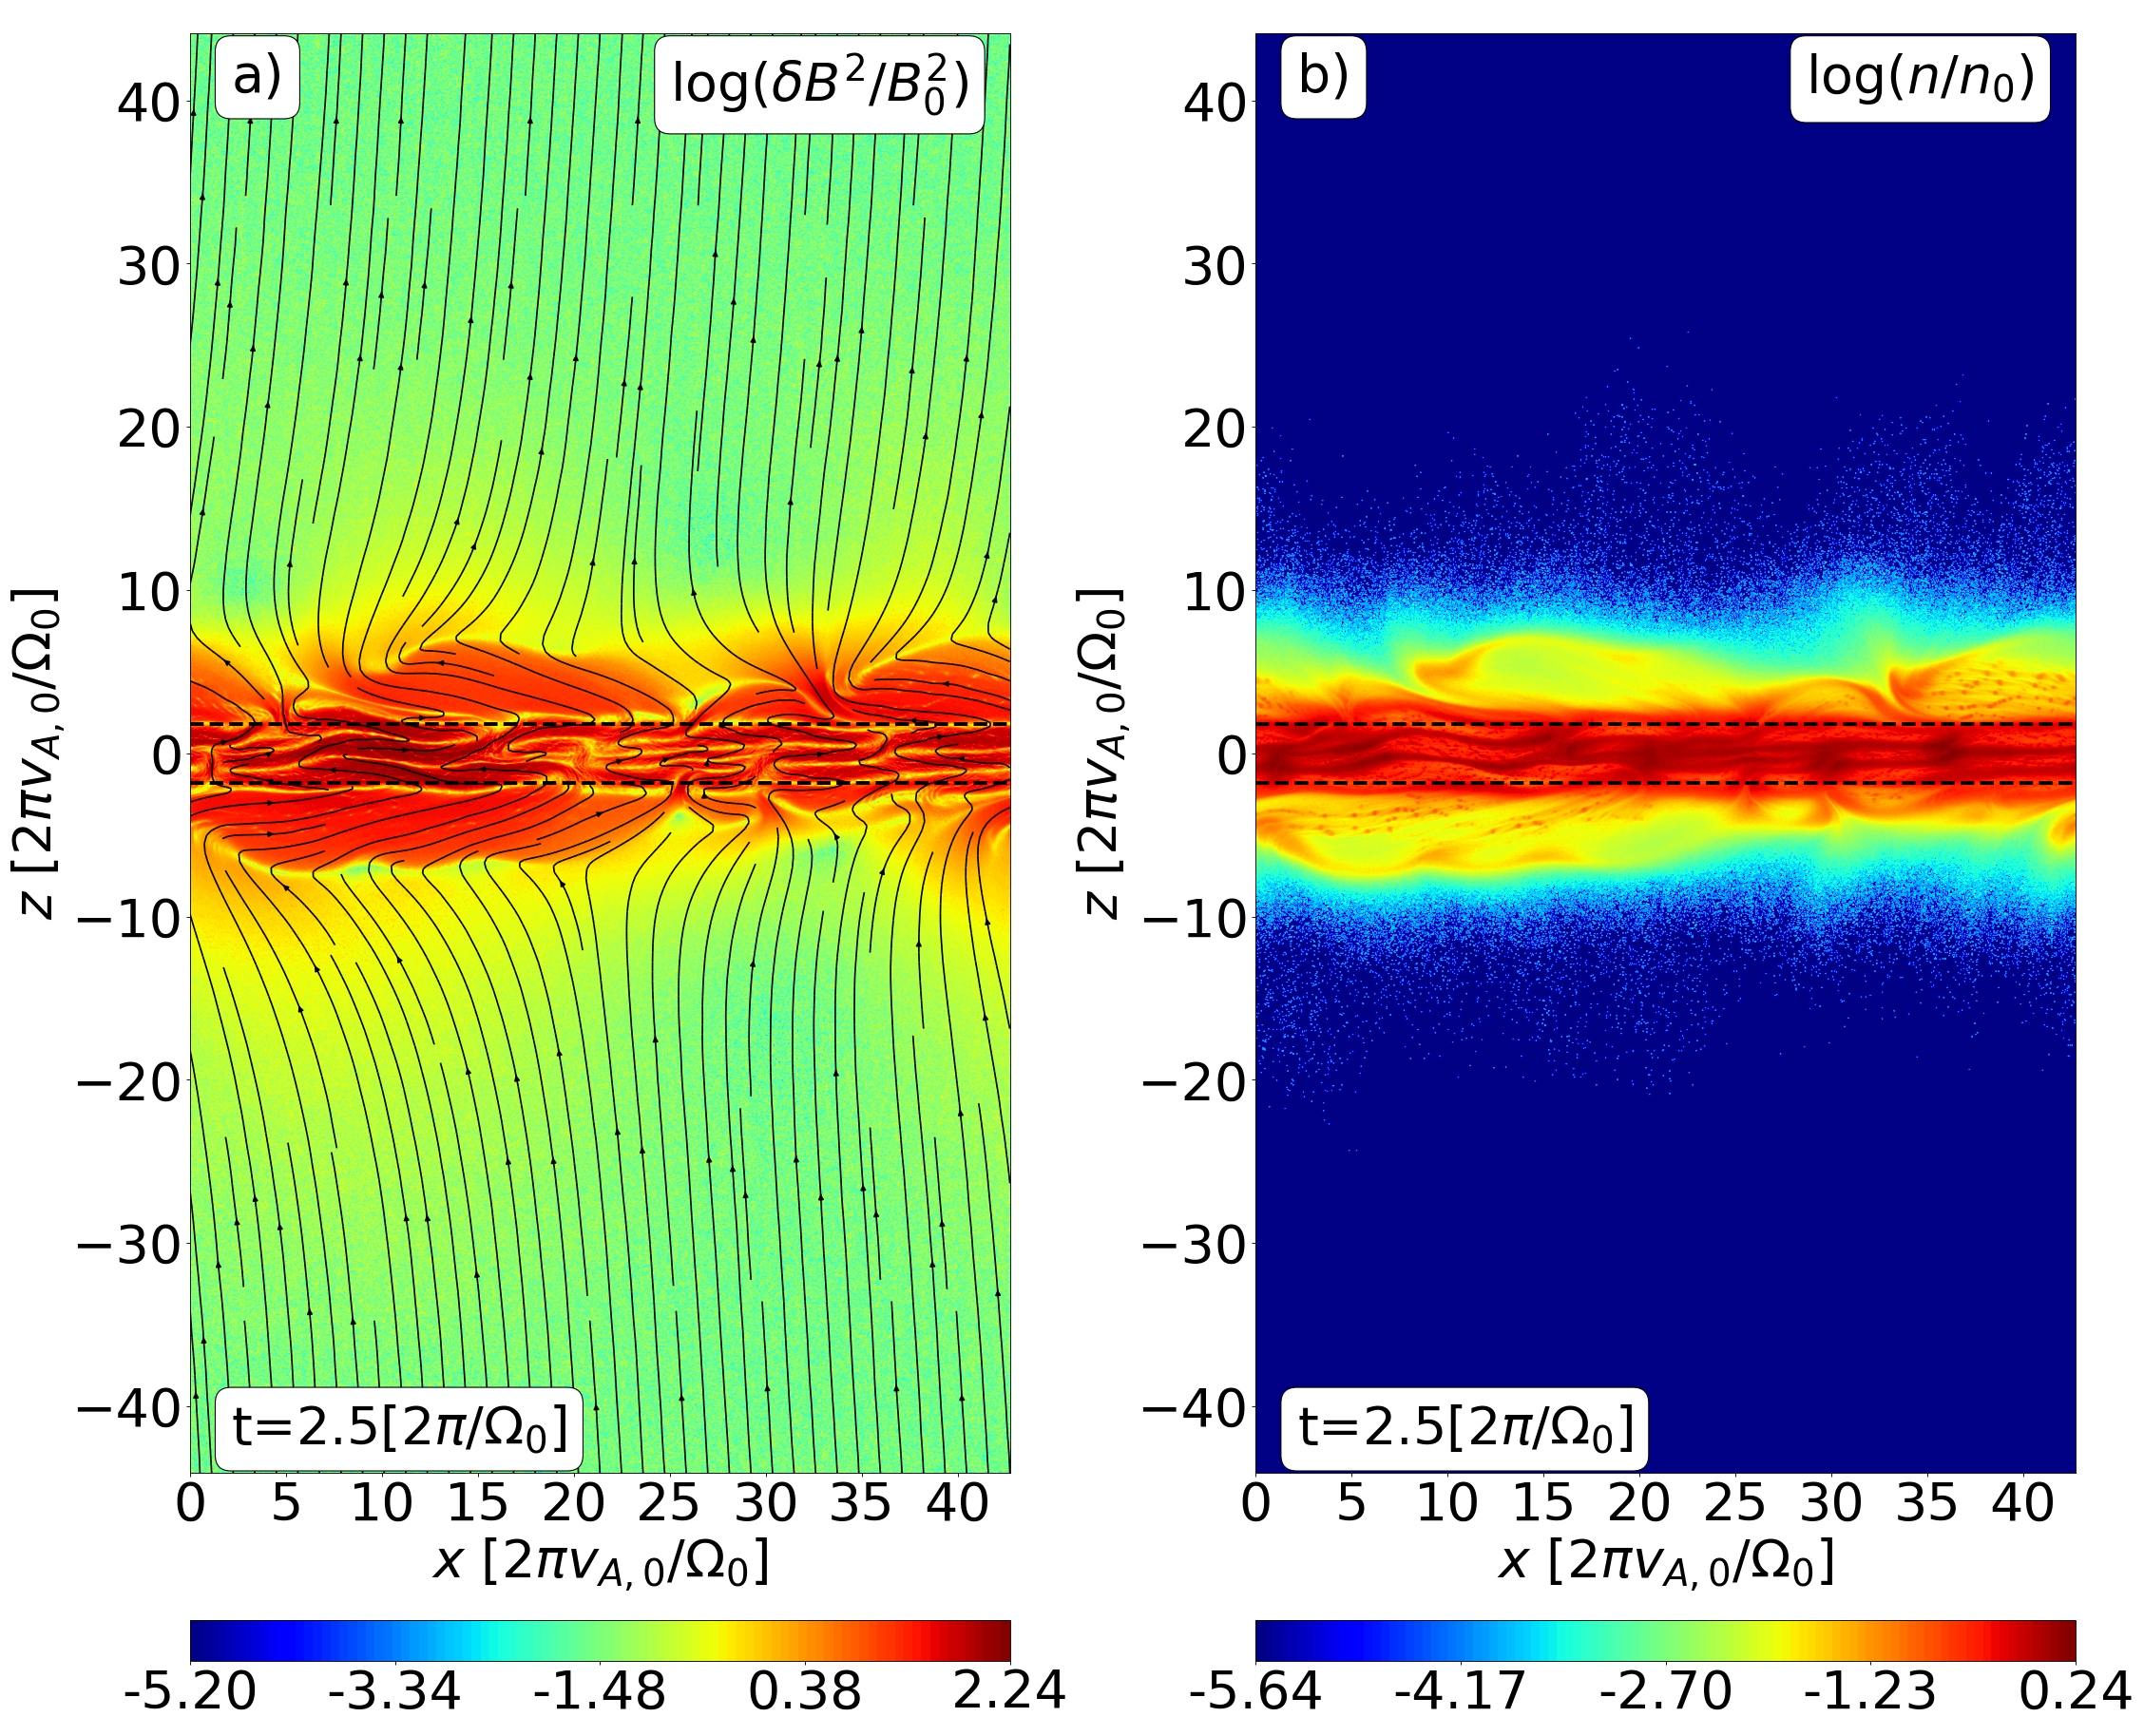
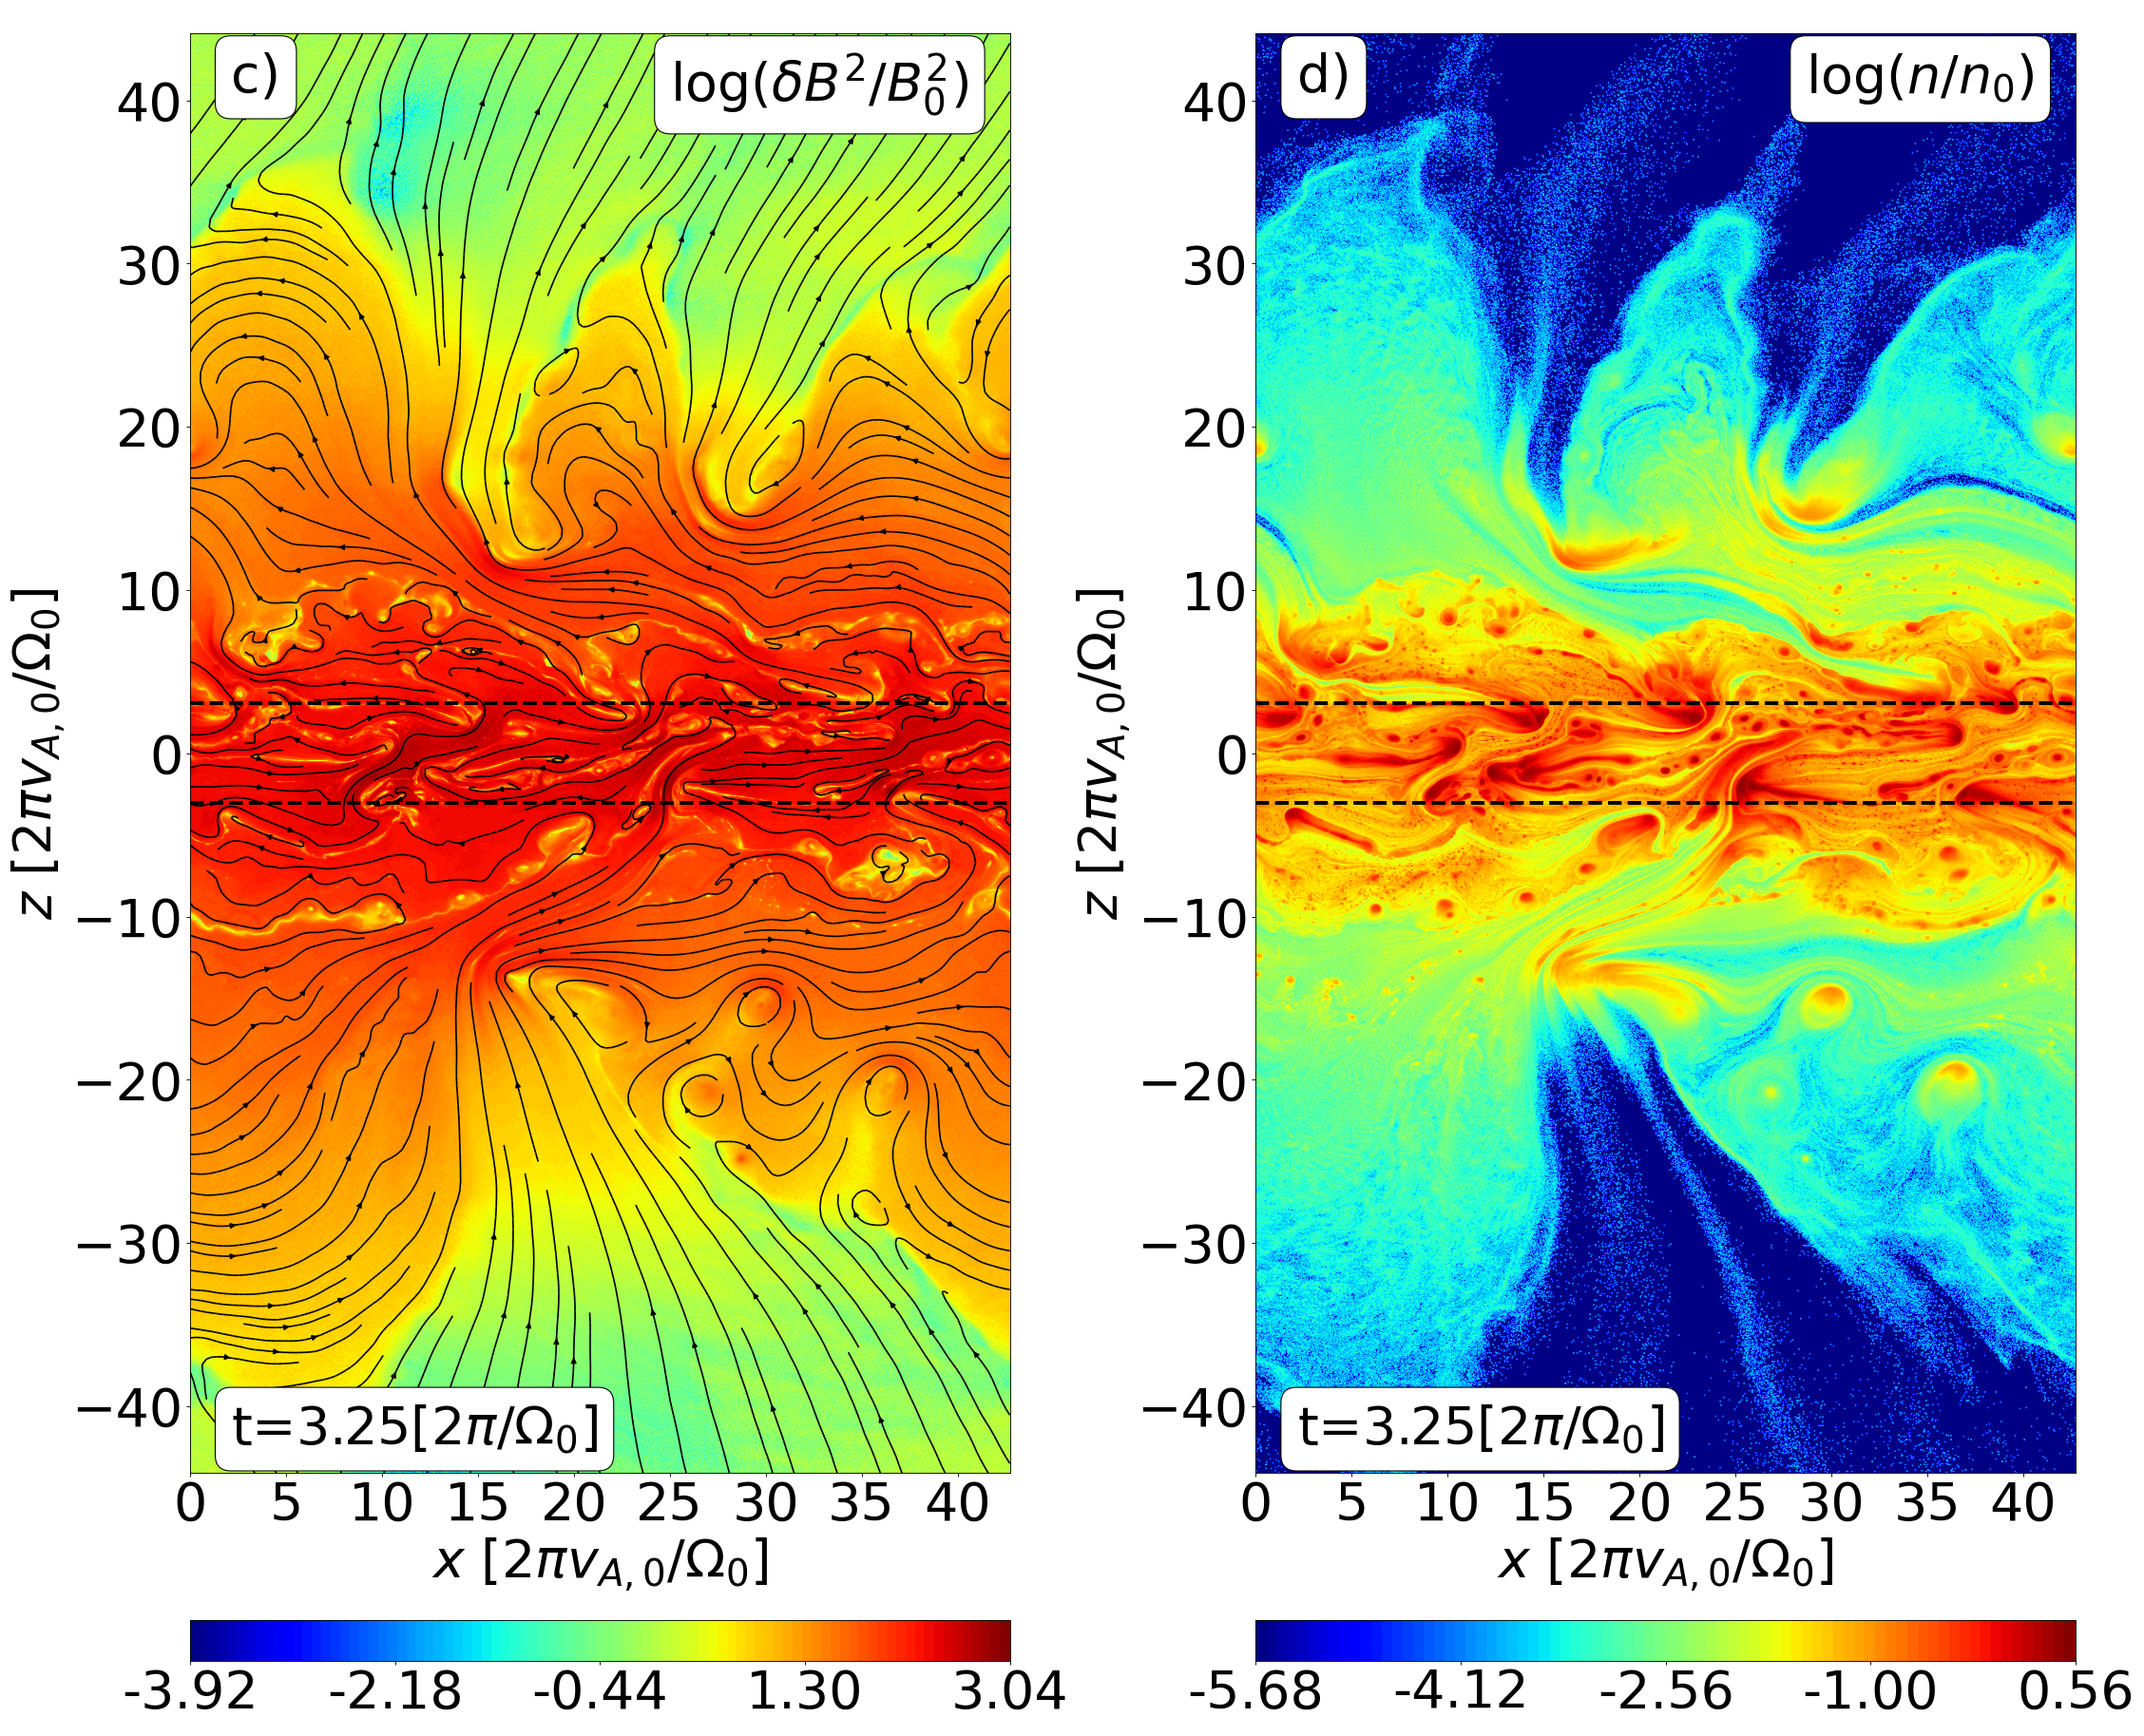
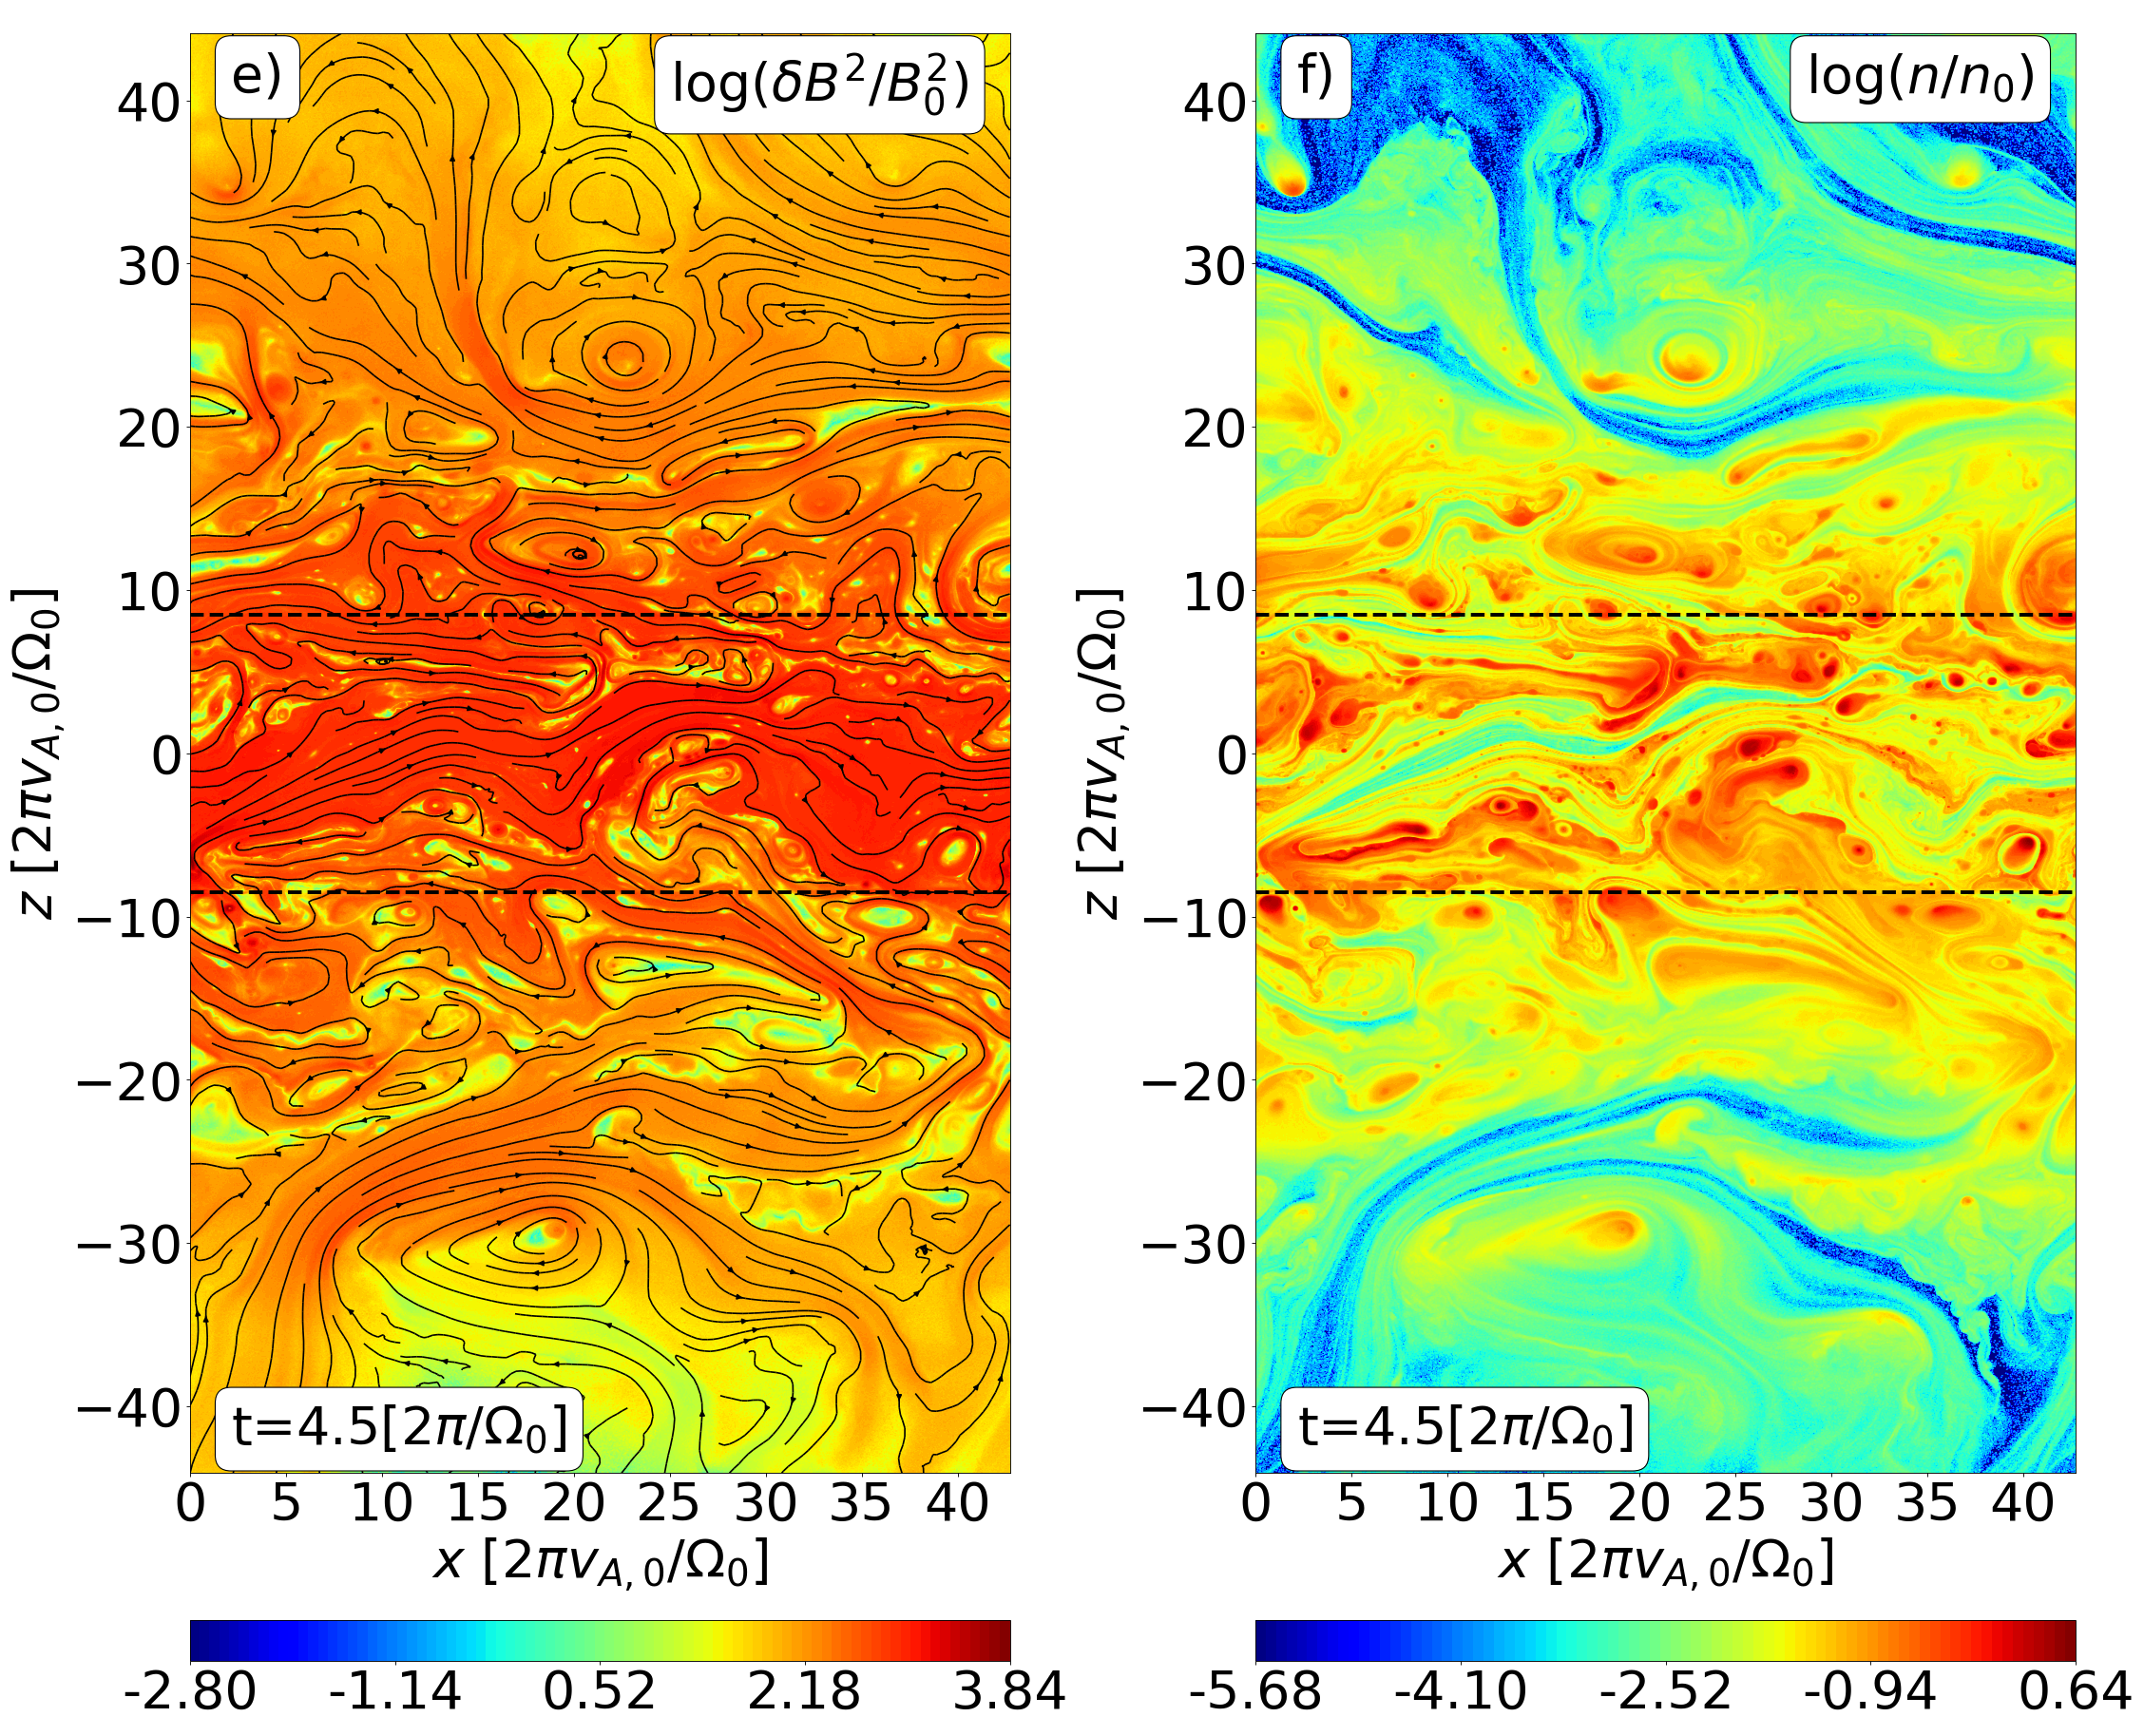
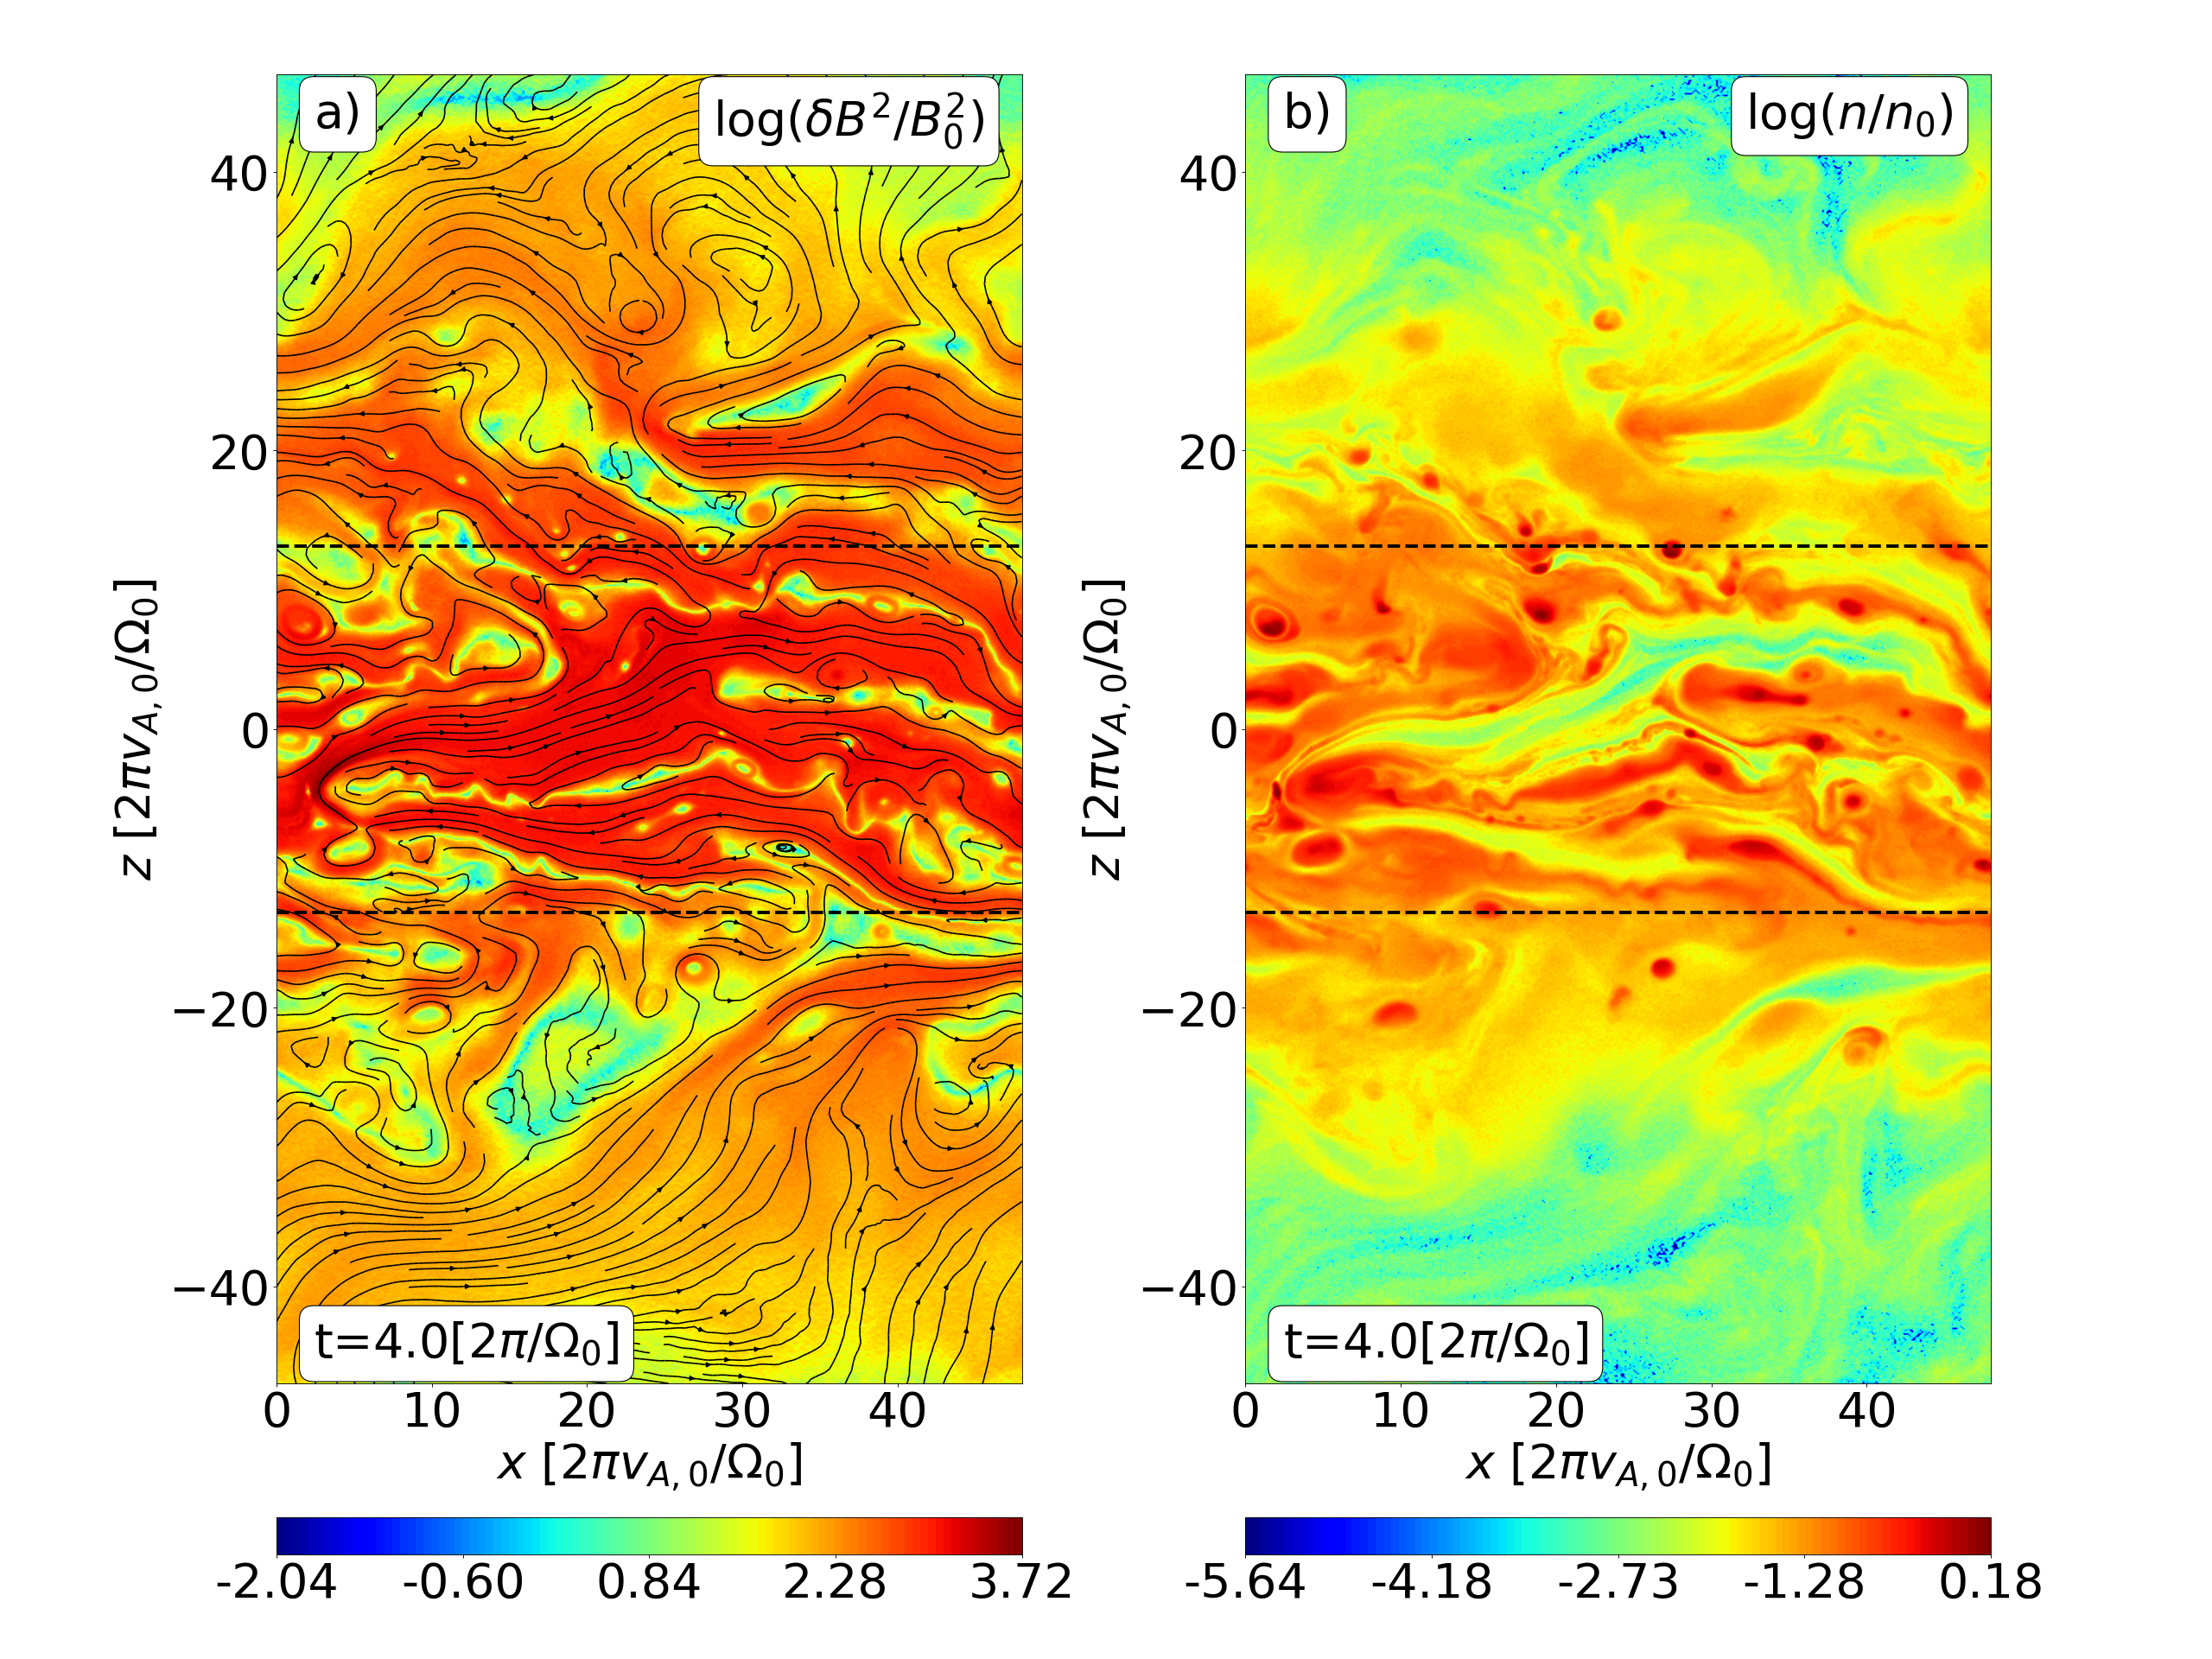
Figure 1 shows three snapshots of the squared magnetic fluctuations (where and ) and of the particle density for the stratified 2D run ST2D-20 (). Panels and show the initial formation of nonlinear channel flows at time . These channel flows appear both in and and are more clearly formed within the disk region (), which is marked by the horizontal dotted lines in all the panels. Panels and show the same quantities but at , when the channel flows have already experienced reconnection, breaking into a turbulent state. At that moment, the disk thickness has increased due to plasma heating and significant particle and magnetic field outflows occur. This turbulent state continues during the entire simulation and is accompanied by a permanent puffing up of the disk, as shown by panels and , corresponding to .
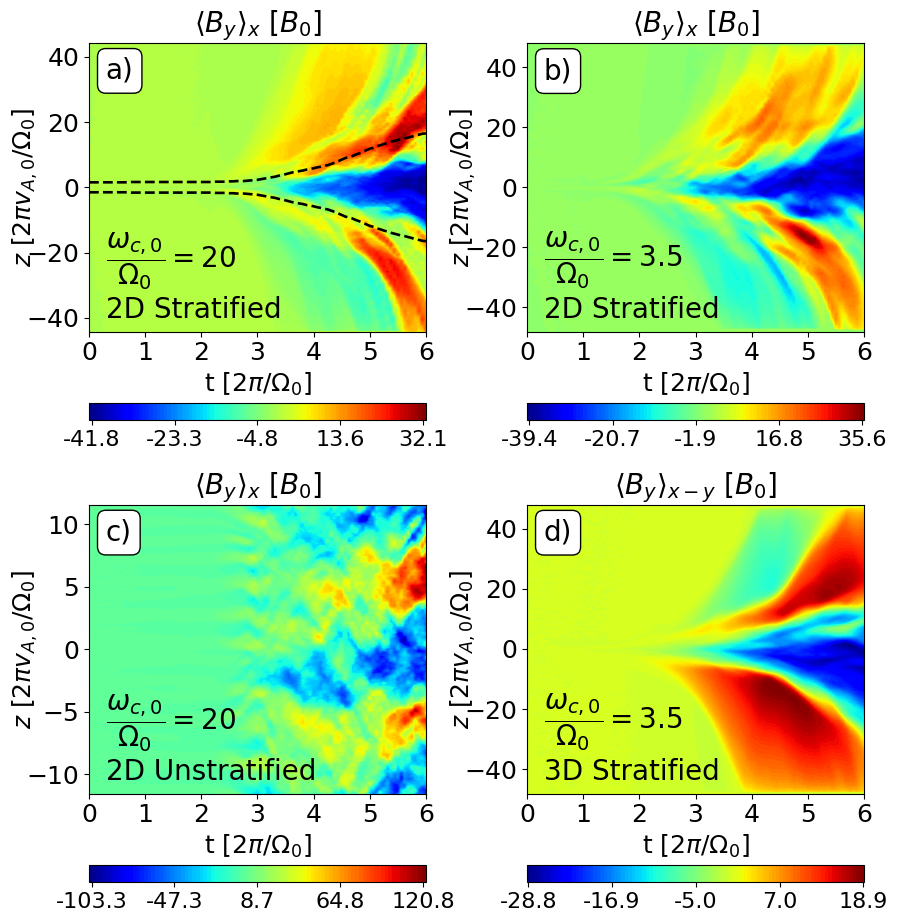
Our 2D runs also show the formation of a large scale, preferentially toroidal dynamo-like field, similar to those observed in previous MHD studies (e.g., Bai & Stone, 2013; Salvesen et al., 2016). This is seen in panel of Fig. 2, which shows as a function of time and of the vertical coordinate . We see that a net is formed, with a maximum amplitude of during the nonlinear stage of the stratified simulation and with oposite signs inside and outside the disk. The amplitude of
is very close to the one observed by previous equivalent 3D MHD simulations of the stratified MRI with initial in the disk midplane (Salvesen et al., 2016).
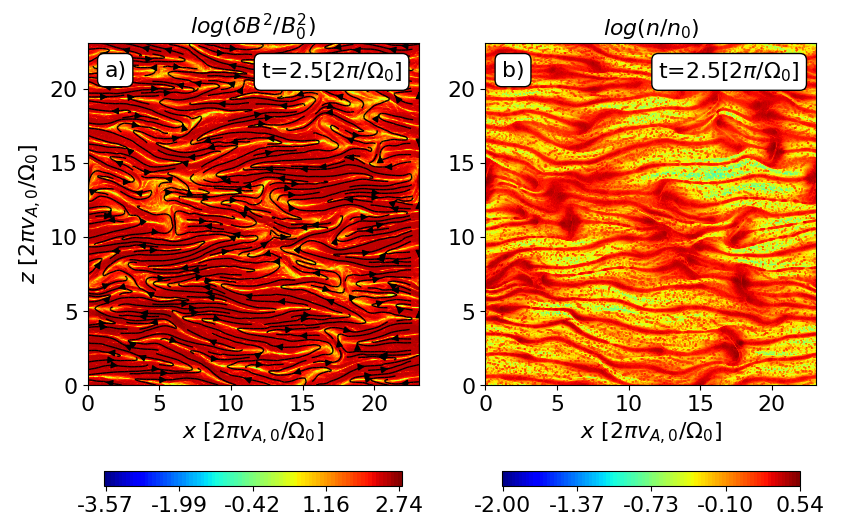
In order to explore the effect of the scale-separation ratio on the 2D turbulence structure, Fig. 3 shows and in the nonlinear MRI state ( []) for an analogous run using (run ST2D-3.5) instead of . By comparing with panels and of Fig. 1, we see that the scale-separation ratio does not appear to produce a qualitative change in the properties of the 2D MRI turbulence, preserving features such as disk thickness increase and the presence of outflows. Run ST2D-3.5 also shows significant dynamo-like activity, as seen in panel of Fig. 2, where a net field appears similarly to the case of run ST2D-20 in panel .
The weak effect of on the field structure of the stratified MRI can also be seen in the magnetic field power spectra, which are shown in Fig. 4 for runs with , 20 and 28 (all of them at []). Panel shows the spectra of the poloidal component of the magnetic field, ( and are the Fourier transform of the and components of and is the corresponding wave number), while panel shows the spectra of the toroidal component, . For all the values of , the spectra show similar shapes, with a break at ( is marked by the colored dots on each line), where is the typical particle Larmor radius, defined as . Their main difference is the location of the break of the spectra, which moves to larger wave numbers (in units of ) as increases, implying a growing separation between the kinetic () and the MHD () scales. However, apart from this growing separation between scales, increasing does not significantly affect the qualitative shape of the power spectra.

Panels and also compare and with power-law functions of index () and show that, at sub-Larmor scales (), the poloidal and toroidal spectra are approximately consistent with . This behavior is expected for kinetic Alfvén wave turbulence (e.g., Passot & Sulem, 2015) and it has also been observed in previous unstratified 2D and 3D kinetic simulations (Kunz et al., 2016; Inchingolo et al., 2018; Bacchini et al., 2022). Above Larmor scales () the poloidal spectra show a peak at , followed by a power-law region characterized by . The toroidal spectra, on the other hand, has a peak at , followed first by an approximately flat region for and then by a steeper region for . The nearly flat behavior of the toroidal spectra at is significantly affected by the presence of the dynamo-like field. Indeed, panels and of Fig. 4 show the poloidal and toroidal spectra of the “turbulent" part of the magnetic field, , which is obtained by removing the contribution from the dynamo-like field:
| (15) |
where . While the turbulent and total spectra of the poloidal field are very similar (see panels and , respectively), the turbulent spectra of the toroidal field (panel ) decrease substantially at compared to the total toroidal spectra (panel ), maintaining its behavior for . The and 2 behaviors of the poloidal and toroidal components of the turbulent field is similar to the unstratified results from 3D MHD simulations of the MRI (e.g., Walker et al., 2016), as well as the ones of 3D kinetic simulations (Kunz et al., 2016; Bacchini et al., 2022).

3.2 Disk properties in 2D
In this section we show the evolution of the average disk properties in our 2D runs, paying attention to the way these properties are affected by the presence of stratification and by the scale-separation ratio .
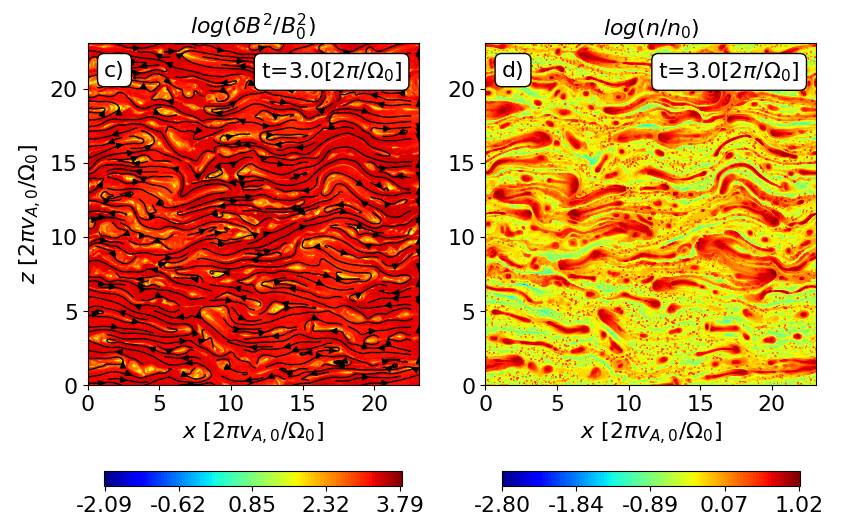
In order to assess the effect of stratification, we compare run ST2D-20 with the analogous unstratified run UN2D-20, with the same initial conditions as in the disk midplane of run ST2D-20. Figure 5 shows and for run UN2D-20 at the moment when nonlinear channel flows appear ( ) and then when these channel flows have reconnected and broken into turbulence ( ). At first glance, this figure suggests that the evolution of the MRI turbulence in run UN2D-20 is similar to the one in the disk region of run ST2D-20. However, the average plasma properties between these two runs differ substantially, as shown in Fig. 6. Panel of Fig. 6 shows the evolution of in the disk of run ST2D-20 (solid blue line) and in the whole volume of the analogous unstratified run UN2D-20 (solid red line). In both simulations there is an initial exponential growth regime that transitions to a much slower growth regime at []. Also, the two runs show the lack of a complete magnetic field saturation.
However, at [], at any given time the unstratified case reaches a magnitude times larger than in the stratified case. This factor larger amplification applies similarly to the three components of the magnetic field, as can be seen from panel of Fig. 6.
Interestingly, the component in the unstratified case appears to be dominated by a large scale, dynamo-like component, similarly to what occurs in the stratified runs. This can be seen from panel of Figure 2, which shows for run UN2D-20. We see that by , reaches an amplitude , similar to the one of the total component, as shown by the dashed red line in panel of Fig. 6. However, whereas the dynamo activity in the analogous stratified run ST2D-20 (shown in panel of Fig. 2) produces a rather homogeneous in the disk region (, marked by the dashed black lines), the characteristic wavelength of the large scale field in the unstratified case is times smaller. We thus interprete the large scale field in the unstratified case as a growth in the wavelength of the MRI modes, being therefore of different nature compared to the larger scale of the stratified runs.
The time when the stratified simulation significantly slows down its growth ( [) coincides with the moment when stratification effects, such as outflows and disk expansion become important, as can be seen from Fig. 1. Notice that this moment coincides with the time when the disk temperature starts increasing significantly, as we can see from the dashed-blue line in panel of Fig. 6, showing a connection between energy dissipation and disk expansion and outflow generation.

Despite the fact that the magnetic field is amplified less in the stratified case, the average cold sigma parameter () is larger in the nonlinear regime of these runs. This is shown by the solid blue and solid red lines in panel of Fig. 6 for the stratified and unstratified cases, respectively. This can be explained by the decrease in the disk density due to its expansion in the stratified runs. Finally, in both cases the plasma beta () reaches a nearly steady state regime for [, as shown by the dashed lines in panel of Fig. 6. However, while in the unstratified case, in the stratified case, which shows that stratification produces a disk that is magnetic-pressure supported, consistently with previous MHD stratified simulations (Bai & Stone, 2013; Salvesen et al., 2016).
In order to explore the role of the scale-separation ratio in our stratified runs, panels and of Figure 7 show the quantities , , , and for stratified simulations with 7, 10, 14, 20 and 28. We see that increasing produces a slight increase in and , not yet showing a clear convergence for the highest values of . (Note that the time origins of these simulations were slightly adjusted to align their exponential growth temporally, facilitating comparison). The evolutions of and exhibit some variations within a factor of , but without showing a discernible dependence on .
As discussed in §3.1, another important feature of the stratified 2D simulations is a dynamo-like action that produces a significant field, as shown in panels and of Fig. 2. The magnetic energy in the disk provided by the dynamo-like field in run ST2D-20 is shown by the solid lines in the panel of Fig. 8, where the red-solid, black-solid and green-solid lines show the contributions by the three components of : , and , respectively. We see that the dynamo-like action within the disk is indeed dominated by the toroidal component of the magnetic field. Panel of Fig. 8 also shows in dashed lines the contribution to the magnetic energy provided by the three components of the turbulent magnetic field , which are averaged over the disk volume obtaining , and (red-dashed, black-dashed and green-dashed lines, respectively). We see that the turbulent field is dominated by its toroidal component as well and contributes most of the magnetic energy in the disk from the triggering of the MRI turbulence at [ until [. After that, the toroidal component of the dynamo-like field becomes larger (by a factor of ) than the toroidal component of the turbulent field.
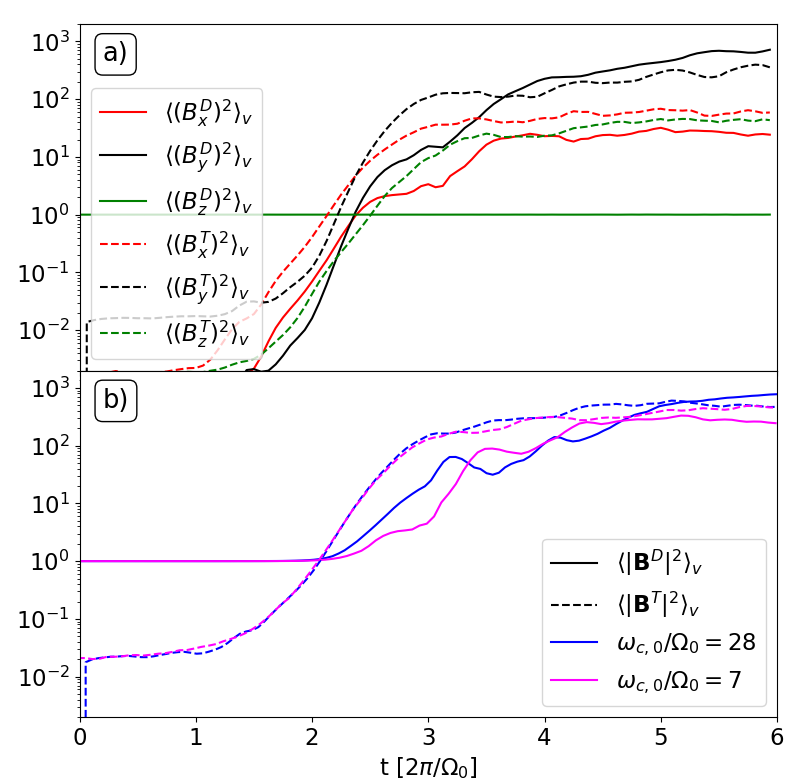
Panel of Fig. 8 shows the total energies in the dynamo-like field (blue-solid line) and in the turbulent field (blue-dashed line) for run ST2D-20 (). We see that after [ the energies in the dynamo and turbulent fields are comparable. Thus, in terms of the total magnetic energy, the dynamo-like and turbulent magnetic fields are roughly equally important after the initial period (of orbit after the triggering of the MRI) in which the turbulent magnetic energy dominates. This trend appears to not be significantly affected by the scale-separation ratio . This is shown by the pink-solid and pink-dashed lines in panel of Fig. 8, which show the contributions by, respectively, the turbulent and dynamo-like fields to the magnetic energy in the disk of run ST2D-7 (). We see that in this run there is also an initial period of about orbit in which the turbulent field energy dominates, followed by a similar contribution to energy by the turbulent and dynamo-like fields.
Thus, we have shown that disk stratification in 2D can change significantly the behavior of the MRI turbulence compared to the unstratified case. Besides producing significant outflows and a puffing up of the disk due to temperature increase, stratification makes the disk turbulence more magnetically dominated (smaller ) compared to what is shown in an analogous 2D unstratified simulation. Stratification also gives rise to a significant large scale dynamo-like activity, which contributes similarly to the magnetic energy in the nonlinear MRI stage as the turbulent field after orbit from the triggering of the MRI.
We also found that increasing the scale-separation ratio produces slightly more magnetized disks, obtaining no complete convergence for the largest values of used, consistent with the result obtained by Bacchini et al. (2022) who found that a scale separation ratio is required for a complete convergence in the 2D case.
In the next section we compare these 2D results with a 3D simulation showing that, although some differences appear, most of our 2D results are reasonably well reproduced in the 3D case.
4 3D MRI turbulence
In this section we present results from a 3D stratified simulation, run ST3D-3.5 () and compare them with the analogous 2D stratified run ST2D-3.5.
4.1 Turbulence properties in 2D vs 3D
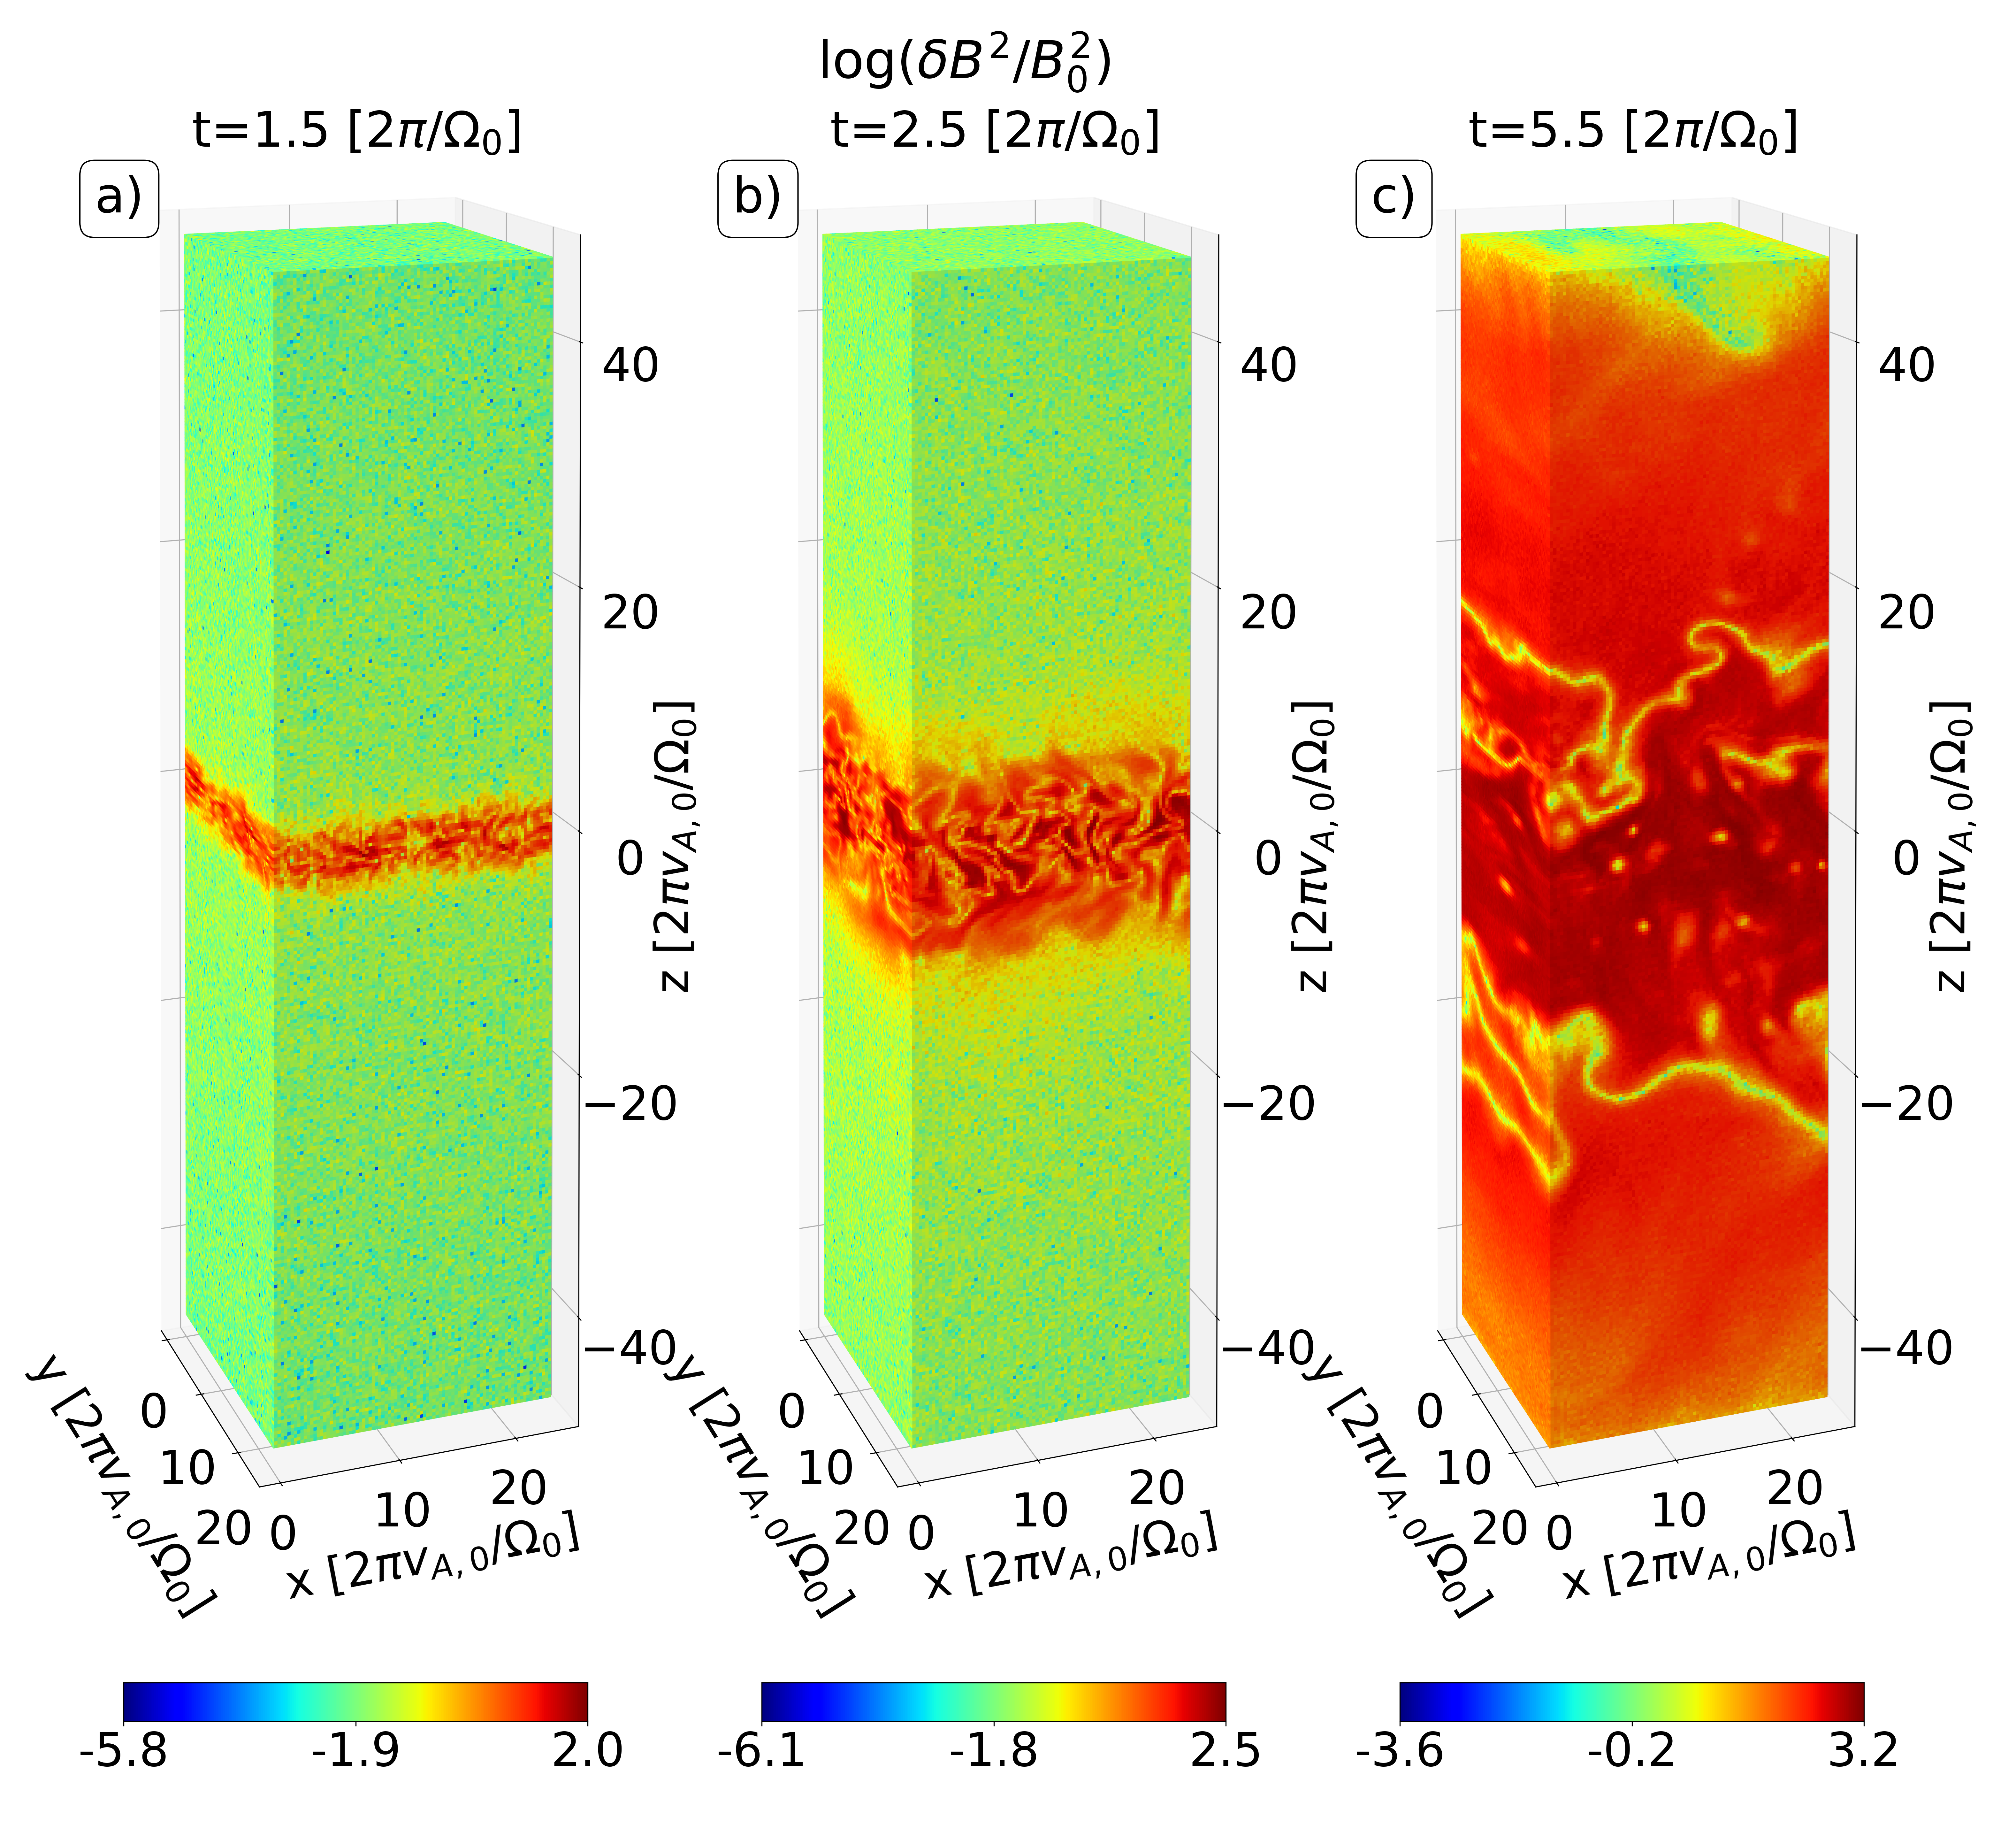
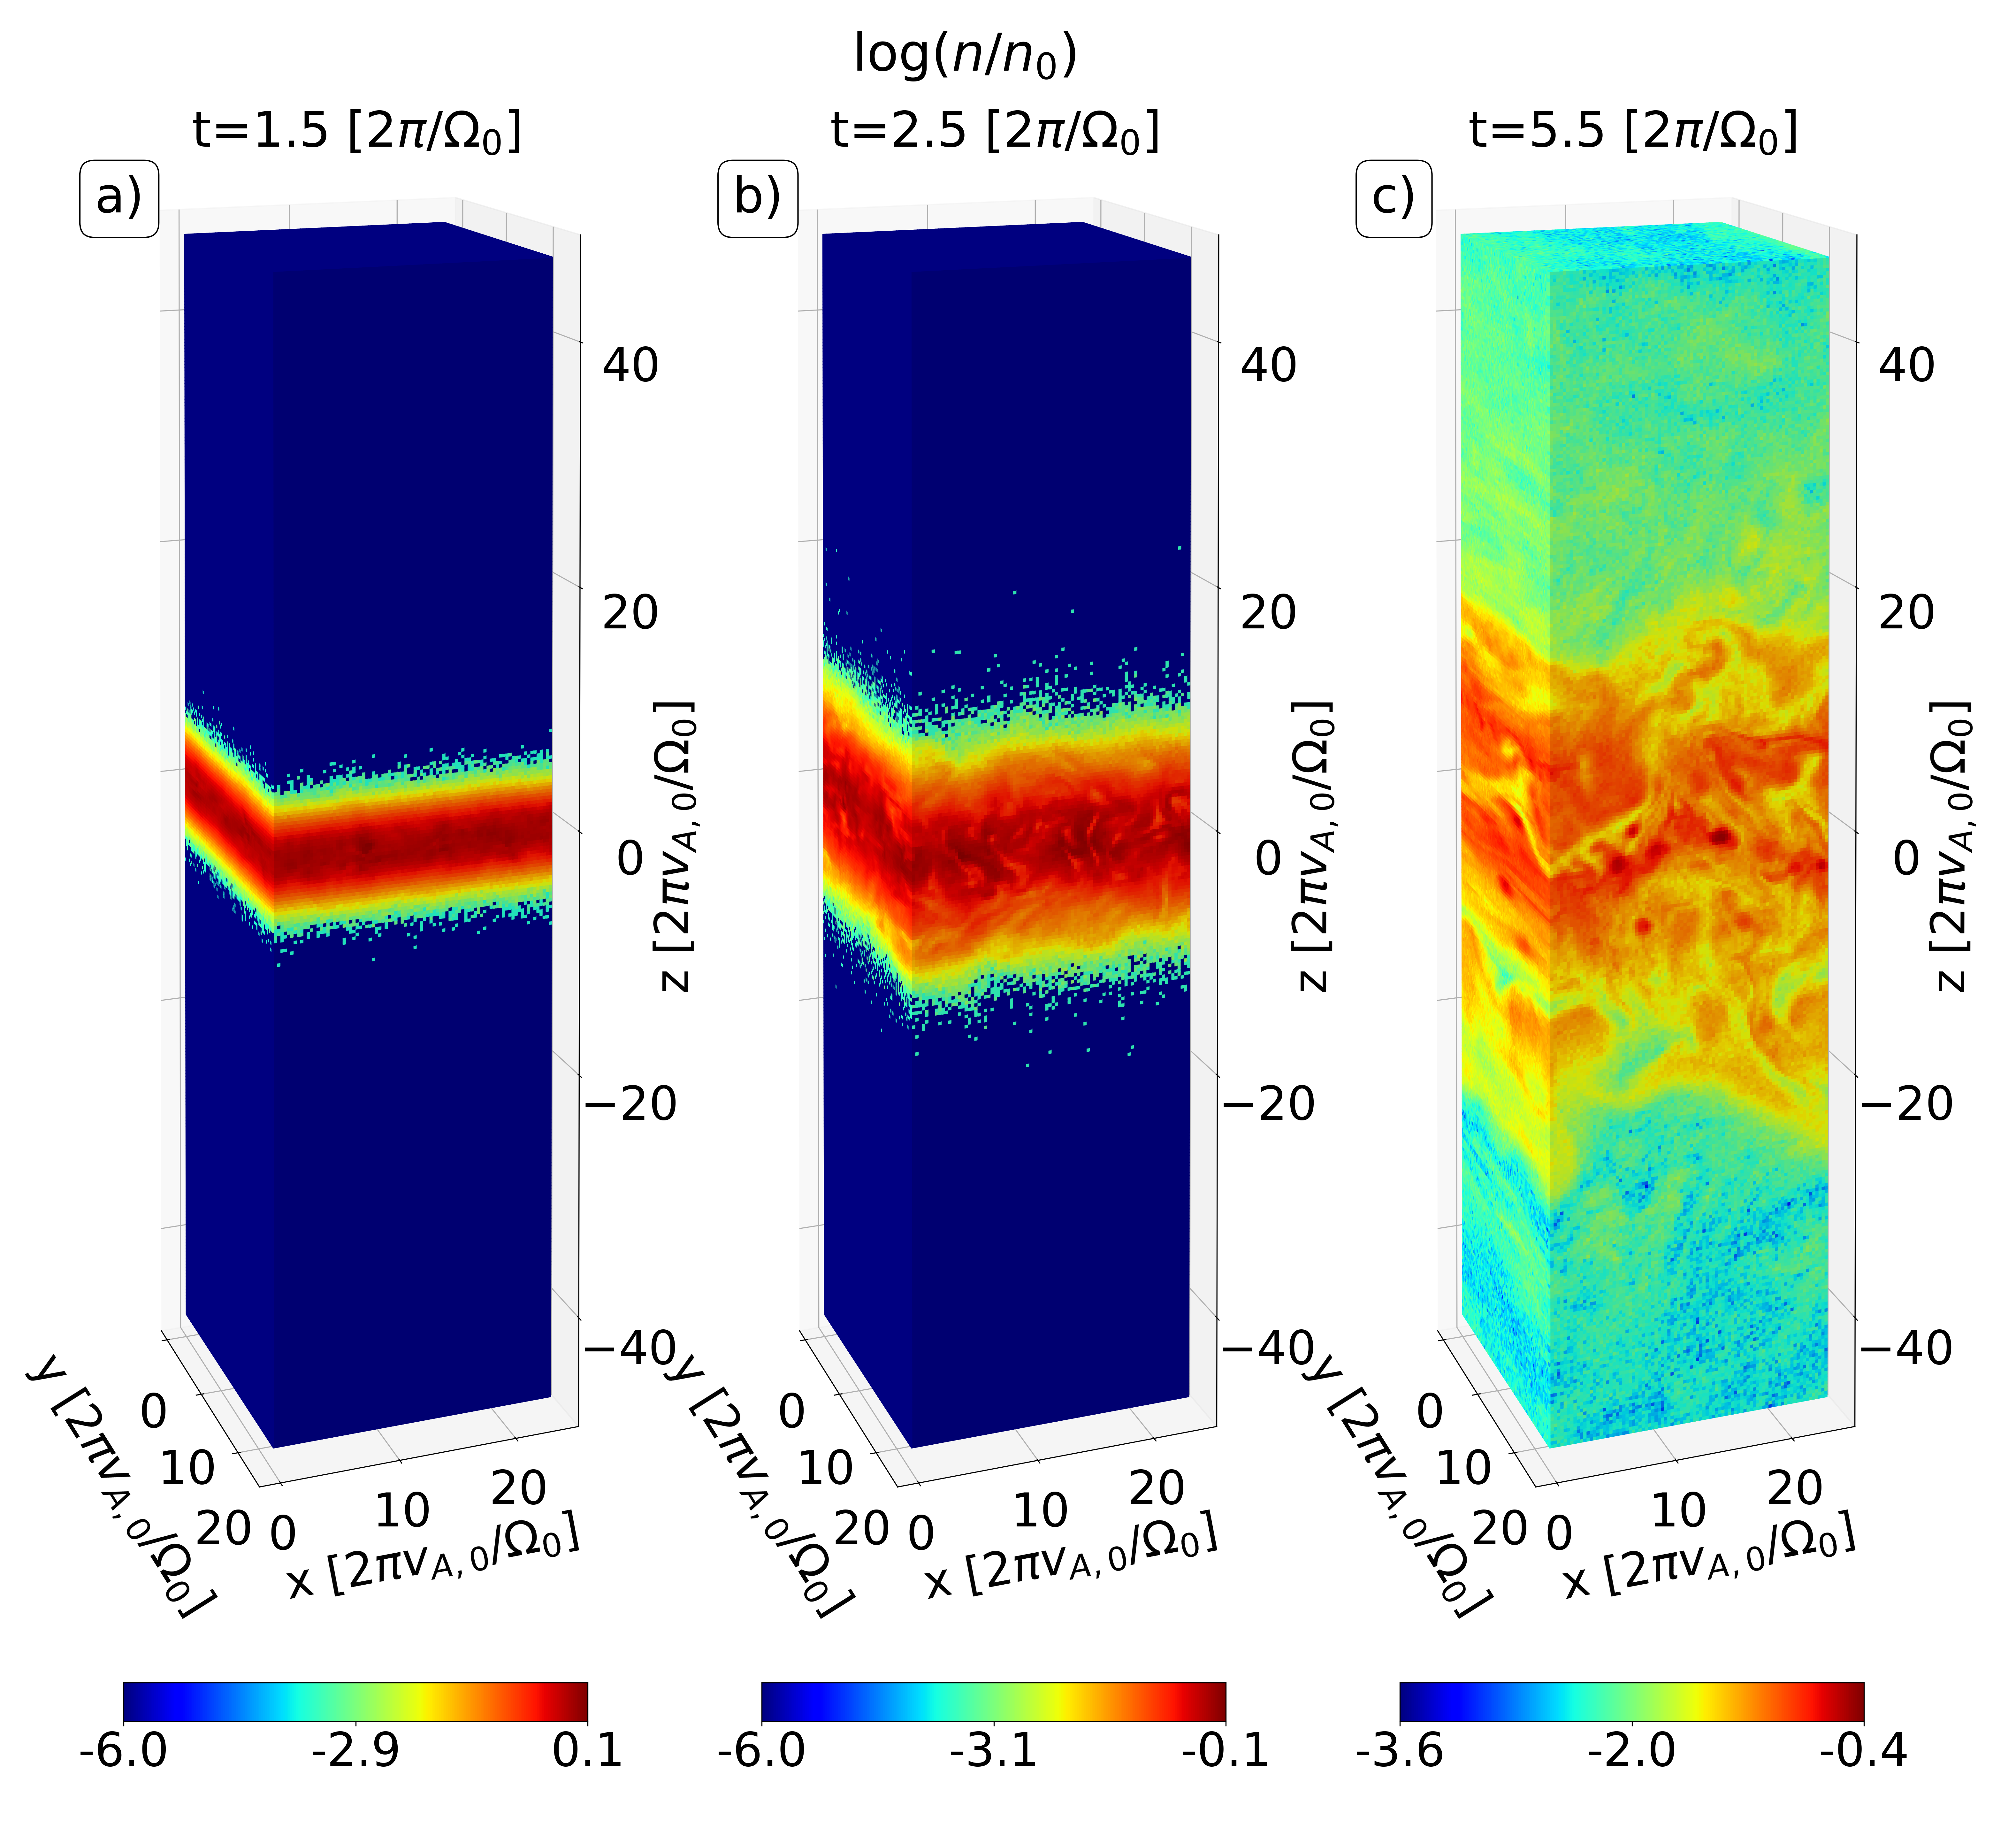
Figure 9 shows three snapshots of for the stratified 3D run ST3D-3.5 at times , 2.5 and 5.5 . At the qualitative level, there are many similarities with the turbulence structure of the 2D runs. At , nonlinear channel flows are present in , which look similar to the ones shown in panel of Fig. 1 for run ST2D-20. At , the channel flows have already reconnected and broken into turbulence, with a significant increase in the disk thickness, similarly to what was shown for run ST2D-20 in panel of Fig. 1. This trend continues at later times, as can be seen in panel of Fig. 9, which shows at . Figure 10 shows the same snapshots of Fig 9 but for the particle density . At nonlinear channel flows are present in , similarly to what is shown in panels of Fig. 1 for run ST2D-20. At and 4 , a much more turbulent and progressively thicker disk is shown, as also shown for run ST2D-20 in panels and of Fig. 1.
Our 3D run also shows the action of a dynamo-like mechanism, as can be seen from panel of Fig. 2, which shows averaged over the plane, , as a function of time and of the vertical coordinate . We see that a net field is formed, with an amplitude similar to the 2D cases shown in panels and of Fig. 2 (runs ST2D-20 and ST2D-3.5). However, while the dynamo-like field in 2D shows significant time-variability and inhomogeneity along the -coordinate, in 3D this field appears less variable and more homogeneous.
The behavior of the magnetic power spectrum seems to be quite similar in 2D and 3D. Panels and of Fig. 11 compare, respectively, the poloidal and toroidal magnetic spectra of the 2D and 3D runs ST3D-3.5 and ST2D-3.5 (blue and green lines, respectively). These runs share the same ratio , so that the effect of the scale-separation does not affect significantly the comparison. At sub-Larmor scales (, where is marked by the colored dots on each line), we observe a magnetic spectrum with (poloidal case) and (toroidal case), for both types of runs. These and 3.5 spectra are, however, steeper than the ones shown by the 2D runs with higher , showing that a minimum scale-separation ratio is necessary for correctly capturing the behavior of the sub-Larmor part of the spectra. Above Larmor scales (), both runs show a poloidal and toroidal magnetic field spectra with close to and , respectively. These and behaviors are maintained when removing the dynamo-like field in both runs (which in 3D is defined as in Eq. 15 but with ). This is shown in panels and of Fig. 11 where we show the poloidal and toroidal spectra of . The main effect of removing is to substantially reduce the contribution of to the toroidal part of the 2D and 3D spectra. In this way, the peak of the poloidal and toroidal spectra of both in 2D and 3D approach (although the toroidal part of the turbulent spectrum in 3D has its peak at wavelengths times larger than in 2D). This behavior of the spectra in runs ST3D-3.5 and ST2D-3.5 above Larmor scales is similar to the ones shown in our stratified 2D runs with higher scale-separation ratio (Fig. 4), as well as in previous unstratified MHD (Walker et al., 2016) and kinetic 3D simulations (Kunz et al., 2016; Bacchini et al., 2022).

4.2 Validation of assumptions
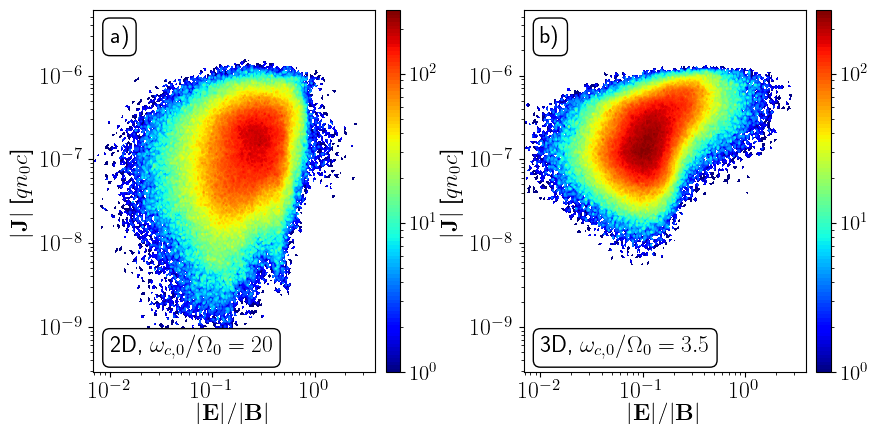
The fact that the peaks of the poloidal and toroidal spectra of are close to in 3D is important for the validation of the shearing coordinates approach used in this work. Indeed, since only depends on and , substracting this quantity from the total field does not change the power spectra of the magnetic field for and ( and , where is the wave vector in Fourier space). Thus, the dominance of for poloidal and toroidal components of implies that the dominant wavelength of the magnetic fluctuations along the and axis is given by . This is indeed one of the assumptions made in our implementation of the shearing coordinates approach (§2.2), which, combined with the condition , allowed us to drop the dependent terms in the field evolution equations 2.2 and 2.2, as well as to obtain the momentum and particle position evolution equations 12 and 13. Notice that our shearing coordinates approach also assumes that the electric field in the MRI turbulence is either smaller or of the same order of the magnetic field (). To support this assumption, panels and of Fig. 12 shows as example the distribution of the electric current magnitude and the ratio for runs ST2D-20 and ST3D-3.5 at time []. We see that in both cases the entire distribution satisfies , including the regions with the largest value of , which are expected to correspond to reconnecting current sheets. This shows that the assumptions made in §2.2 to derive the plasma evolution equations in our shearing coordinates are fully supported by our obtained MRI turbulence behavior.
4.3 Disk plasma properties in 2D vs 3D
In this section we compare the disk plasma properties evolution in 2D and 3D. Panel in Fig. 13 shows the evolution of in the 2D and 3D runs ST2D-3.5 and ST3D-3.5. In both cases there is an initial exponential growth regime that evolves into a nonlinear regime with a much smaller growth rate at . Later, in the time interval , significant differences appear in the 2D and 3D cases, with the 3D run having a amplitude times smaller. This significant difference in produces a similar difference in , as can be seen from the solid blue and green lines in panel of Fig. 13. This implies that in that time interval the disk expansion (and therefore its density) is about the same in the two simulations. This is consistent with the fact that their temperatures reach similar values, as shown by the dashed lines in panel of Fig. 13. Finally, consistently with the behaviors of and , is times larger in the 3D case during the time period . Later, when there is a transition towards a state in which the amplitudes of in 2D and 3D tend to give more similar values, which also tends to produce similar values of . Indeed, for , in both runs while is only a factor of larger in the 2D case.
The smaller magnetic amplification shown by the 3D run in the time interval is consistent with recent unstratified PIC simulations of the MRI that show that using 3D runs is important to allow efficient reconnection of the toroidal magnetic field component (Bacchini et al., 2022). By the end of the simulations, however, the 2D and 3D magnetic energies only differ by a factor of . This can be explained by the growing importance of the dynamo-like field in the stratified 2D and 3D runs, which evolves very similarly in these two types of runs. The progressively growing importance of the dynamo-like field in 2D can be seen from panel of Fig. 13, which shows that in run ST2D-3.5, (solid-blue line) starts smaller than the turbulent part of the magnetic energy density (dotted-blue line) for , but afterwards it becomes comparable to . This is indeed consistent with what was shown for 2D runs with larger scale-separation ratios in Fig. 8. In the 3D run ST3D-3.5 this increase in the dynamo-like field importance is even more significant, since (solid-green line) becomes times larger than (dotted-green line) at , given that 3D runs dissipate more efficiently via reconnection. Since has essentially the same values in 2D and 3D, it is thus expected that, by the end of the simulations, only differs by a factor of between the 2D and 3D cases.
In §5.2 we show that the similitude between 2D and 3D by the end of the runs is also reproduced when analyzing the MRI-driven effective viscosity.

5 Effective viscosity
In this section we analyze the effective disk viscosity caused by the MRI turbulence. This viscosity is quantified making used of the parameter (Shakura & Sunyaev, 1973), defined as the component of the plasma stress tensor , normalized by the plasma pressure, . This stress tensor component has three contributions: the Maxwell stress , the Reynolds stress , where is the fluid velocity, and the anisotropic stress , where and are the plasma pressures perpendicular and parallel to the local magnetic field. Notice that, even though in the calculation of we assume non-relativistic fluid velocities, in our simulations individual particles can still acquire relativistic velocities. Thus is calculated as , where and are the momenta and Lorentz factors of the particles in a given fluid element and denotes an average over those particles. In this way we ensure that the fluid velocity corresponds to the velocity of the reference frame where the average particles momentum within a fluid element vanishes.
5.1 Effect of stratification and on viscosity
Fig. 14 shows in solid blue line the time evolution of the average parameter () for run ST2D-20, along with the contributions from the Maxwell, Reynolds and anisotropic stresses: (; dotted blue line), (; dot-dashed blue line) and (; dashed line), respectively. We see that reaches a saturated value of , which is dominated by the Maxwell stress, with the contributions to following the ordering . The fact that is consistent with the dominance of magnetic pressure compared to particle pressure () seen in panel of Fig. 6 for the same run ST2D-20. We compare these results with the ones of the analogous unstratified run UN2D-20, where we find a similar ordering of the contributions to , , but with a times smaller . This difference is consistent with the times larger obtained in the unstratified run, implying a significant effect of stratification on the disk viscosity in collisionless studies of the MRI. Notably, the importance of in our results seems to contradicts previous unstratified kinetic studies (Kunz et al., 2016; Bacchini et al., 2022), but are in line with the findings from MHD simulations (Bai & Stone, 2013; Salvesen et al., 2016).


We also measured the effect of on the behavior of , , and the total , which is done in panel of Fig. 15. We see that, although fluctuates by factors of order unity, there is no discernible dependence of this quantity on , implying that the scale separation used in our 2D runs appears to be large enough to accurately capture the behavior of the MRI-driven viscosity. The blue lines in panel of Fig. 15 also compare the contribution to by the turbulent field (dashed lines) and dynamo-like fields (solid lines) in the ST2D-28 run (), which we name and , respectively. We see that dominates until . After that moment and are comparable, with fluctuating differences of a factor ). A similar behavior is obtained for and in run ST2D-7 (), which are shown by dashed-pink and solid-pink lines, respectively. This implies that no clear effect of the scale-separation ratio of and is observed in our simulations. The fact that these quantities become comparable after is in line with the behaviors of and for runs ST2D-28 and ST2D-7, which also become comparable in the same time period, as shown in panel of Fig. 8.
5.2 Viscosity in 2D vs 3D
Panel of Fig. 16 compares the effective viscosities of the 3D and 2D runs ST3D-3.5 and ST2D-3.5, respectively. We see that for , the viscosity of the 3D run has a nearly steady value of . For , the 3D is times smaller than in the 2D case, while for the of the 2D and 3D runs become more similar, differing by a maximum factor of . The time dependence of the difference between the 2D and 3D values of is consistent with the fact that, initially, the 3D is times larger than in 2D, with a subsequent period at in which both ’s acquire essentially the same value, as shown by the dashed blue (2D) and green (3D) lines in panel of Fig. 13.
These results reinforce the idea that, when the dynamo-like field becomes either dominant (3D) or comparable to the turbulent field (2D) at , the 2D and 3D runs produce fairly similar results, which include the value of the (Maxwell stress-dominated) disk viscosity. When that happens, itself is significantly affected by the dynamo-like field. This can be seen from panel of Figure 16, which shows the contributions of the dynamo-like magnetic field (solid) and the turbulent magnetic field (dashed) to the Maxwell stress, and , in the 3D run ST3D-3.5 (green) and the 2D run ST2D-3.5 (blue). At , the 3D run exhibits a greater contribution to the Maxwell stress attributed to the dynamo-like field (by a factor ). This dominant contribution to the viscosity by the large scale dynamo-like field is in qualitative agreement with the 3D MHD simulations of Bai & Stone (2013) in the case of . Conversely, in the 2D run ST2D-3.5 the dynamo-like contribution to the viscosity becomes comparable to the one of the turbulent field after , with some dominance of the former after by a factor of . This is in line with results shown for the 2D runs ST2D-28 and ST2D-7 ( and 7, respectively), for which and were comparable after , with no discernible dependence on .
Both our 2D and 3D runs give rise to an anisotropic stress that is subdominant compared to the Maxwell stress, although the former is larger than the Reynolds stress in the 3D run, which is the contrary to what occurs in 2D, suggesting that 3D effects would tend to suppress the fluid velocities that give rise to the Reynolds stress.
5.3 Pressure anisotropy behavior
The very small contribution of to the total effective viscosity in our 2D and 3D stratified runs seems to contradict previous kinetic simulation studies that suggest that the anisotropic stress can be as important as Maxwell stress in collisionless disks (e.g., Kunz et al., 2016). This discrepancy, however, appears to be mainly due to the small regime reached in the nonlinear state of our simulations. To demonstrate this point, panel of Fig. 17 shows the distribution of plasma anisotropy and in the disk of run ST2D-20 during a time interval , and compares it with a threshold for the growth of unstable mirror modes (black line) obtained from linear Vlasov theory (Hellinger et al 2006):
| (16) |
We see that in most cases tends to be larger than unity and limited by the mirror threshold. As an estimate of the upper limit for the expected importance of , one can compute the ratio assuming that the pressure anisotropy of the plasma is given by Eq. 16. In that case we would have
| (17) |
where we have applied Eq. 16 in the limit ( for [], as can be seen from the evolution for run ST2D-20 shown in Fig. 6). Thus, using , we obtain . This upper limit is consistent with the fact that is much smaller (by a factor of ) than in run ST2D-20, as shown, respectively, by the dashed blue and dotted blue lines in Fig. 14. Notice that in a hypothetical case in which (e.g., as in Kunz et al., 2016), Eq. 17 would predict comparable contributions from the anisotropic and Maxwell stress with .

Panel of Fig. 17 shows the same as panel but for the 2D run ST2D-3.5. We see that is somewhat larger in the case of run ST2D-3.5 for a given . The larger value of is consistent with the smaller scale-separation ratio, as shown by previous PIC simulation studies of the mirror instability driven by a growing background magnetic field (see, e.g., Ley et al., 2023). However, the distribution of and in the disk of run ST2D-3.5 still follows reasonably well the threshold for the growth of mirror modes presented in Eq. 16, consistently with the essentially absent effect of scale-separation on the dominance of in our runs. Panel of Fig. 17 shows the behavior for and in the 3D run ST3D-3.5. We see that the pressure anisotropy behaves similarly in the runs ST2D-3.5 and ST3D-3.5, in agreement with the small contribution of to the effective viscosity in the 3D case.
In summary, our 2D and 3D runs give a (Maxwell stress dominated) with values between (3D) and (2D), with a progressively similar behavior of the 2D and 3D runs as the dynamo-like field becomes dominant ( ). In this dynamo-dominated regime, is expected to be mainly produced by the dynamo-like field. Interestingly, this viscosity behavior is very similar to the one obtained from 3D MHD simulations of stratified disk with net vertical field and initial (Salvesen et al., 2016).
6 Particle acceleration
Our stratified MRI simulations show significant particle acceleration. In this section, we show that the acceleration efficiency grows as the disk temperature and the scale-separation ratio increase. Well developed nonthermal tails are observed mainly in our 2D runs, due to their relatively large scale-separation ratio.
6.1 Spectrum evolution in 2D
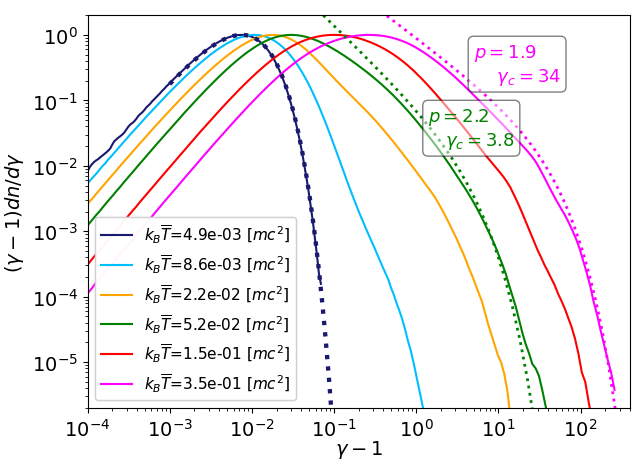
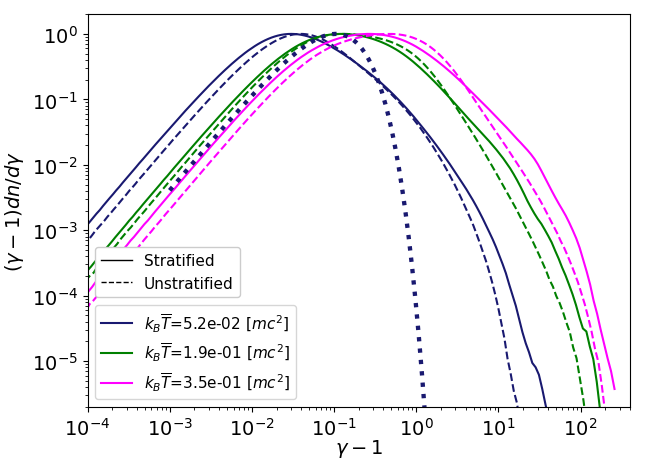
The evolution of the particle spectrum, , calculated in the disk of run ST2D-20 is shown in Fig. 18, where is the particle Lorentz factor. The spectra are shown for different values of the disk temperature , instead of at different times. (This allows us to compare spectra from different simulations, removing the fact that different runs may take different times to trigger the MRI and/or to heat the plasma). As the plasma temperature increases, their spectra develop a nonthermal tail that can be approximately described as a power-law with an exponential cut-off,
| (18) |
where and are the corresponding spectral index and cut-off Lorentz factor, respectively. This behavior can be seen in Fig. 18, for instance, in the cases and . For the first temperature we fitted Eq. 18 using and (green dotted line), while for the second temperature we used and (pink dotted line). These fits were obtained using a maximum likelihood analysis considering only particles with energy larger than .
6.2 Role of
The role of the scale-separation ratio is shown in Fig. 19, which shows the spectra of simulations with and 28, for temperatures (panel ) and (panel ). For each of these spectra, we show in dotted lines the corresponding fits using power-laws with exponential cut-offs (Eq. 18). The dependences of the fitted and on are shown in panels and of Fig. 20, respectively. By comparing with the black line in panel (), we see that for the spectra with temperature , behaves approximately as . For , on the other hand, with no clear dependence on .
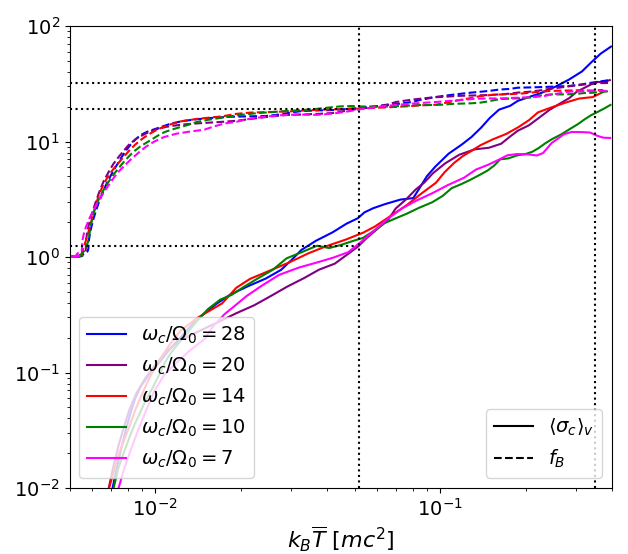
This discrepancy in how depends on is likely a manifestation of the underlying acceleration mechanism, which appears to be consistent with the expectation from reconnection driven acceleration. Indeed, the dependence on for is qualitatively consistente with the pair plasma magnetic reconnection results of Werner et al. (2016) in the limit of small system size, . These results show power-laws with supra-exponential cut-offs () with , where and is the magnitude of the magnetic field in the upstream medium of the reconnecting plasmas. The corresponding value of in our simulations can be estimated from the power spectrum of the (poloidal) magnetic energy component, , for runs with different scale-separation ratios shown in panel of Fig. 4 (we use the poloidal magnetic field since this is the component that can experience reconnection in 2D). We see that the poloidal spectra peak at fairly independent of the scale-separation ratio. Thus a reasonable estimate for is . In addition, we can estimate , where () is the root mean square amplification factor of the magnetic field in the disk at a given time. Thus, if reconnection is the main driver of particle acceleration in our runs, should be close to , which would be given by
| (19) |
where we have used that in all our simulations. The value as a function of is shown in dashed lines in Fig. 21 for different values of . We see that when , , fairly regardless of the scale-separation ratio. This means that the expected at is
| (20) |

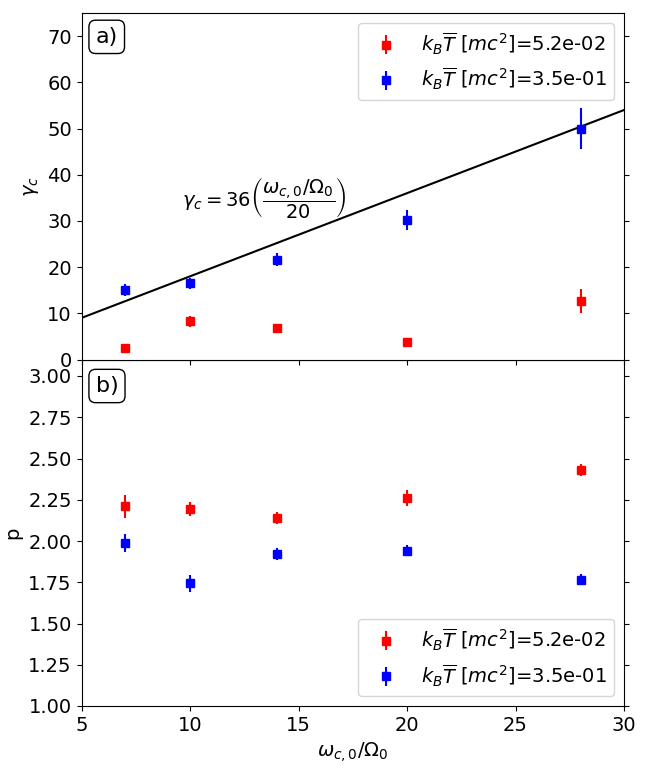
The black line in panel of Fig. 20 shows the case , where is given by Eq. 20. We see that reproduces well the behavior of in our runs with .
The behavior expected from reconnection is valid as long as (Werner et al., 2016), where corresponds to the cold sigma parameter in the upstream medium of the reconnection simulations. We estimate using in our runs when , which is for the range of considered, as shown by the solid lines in Fig. 21.222Since we want to estimate the equivalent of the upstream cold sigma parameter , we are mainly interested in the values of outside the current sheets, where is the largest. Thus, given that in our runs ( (), we are using instead of as our estimate of . Thus, using Eq. 19, we obtain that
| (21) |
Eq. 21 thus implies that all of our simulations satisfy the restriction when , even in our run with the largest scale-separation ratio, . Interestingly, Fig. 21 also shows that, when , and , implying that for that temperature . This means that, if particle acceleration is driven by magnetic reconnection at , should not be proportional to . Instead, a weaker dependence on is expected, since in that case likely grows more slowly with time as (Petropoulou & Sironi, 2018; Hakobyan et al., 2021). This possibly explains why we do not observe a clear dependence of on in the case of .
The values of for and seen in panel of Fig. 20 are close to and , respectively, and do not show a clear dependence on the scale-separation ratio. This is also consistent with acceleration being driven by reconnection. For instance, for and (a case close to our results with , where ; see Fig. 21), Werner et al. (2016) predicts . Whereas for and (close to our results with , where ; see Fig. 21), the results of Werner et al. (2016) show .
6.3 Effect of stratification on the acceleration
The previous discussion underscores the importance of plasma conditions, in particular and , in determining the efficiency of nonthermal particle acceleration. Since these conditions vary significantly between stratified and unstratified simulations (as shown by Fig. 6), we expect the acceleration efficiency in these two types of runs to be different. Fig 22 compares spectra from run ST2D-20 with the equivalent spectra in the unstratified run UN2D-20 at the same values of . We see that the spectra in the unstratified run are always softer than in the stratified run ST2D-20. This is consistent with the fact that, for a given temperature, in run UN2D-20 the value of is smaller than in the run ST2D-20, which favors harder nonthermal acceleration (as seen in panel of Fig. 6)
6.4 Acceleration in 2D vs 3D
In Fig. 23 we compare spectra from the 2D and 3D simulations ST2D-3.5 and ST3D-3.5, both with a scale-separation ratio , for , and . As expected from our previous discussion on the dependence of on , the 2D run ST2D-3.5 should produce a nonthermal tail of rather short extension, which is what we see in Fig. 23. However, it is still interesting to verify whether its main features are reproduced in the 3D run ST3D-3.5. We see that, although the spectra show somewhat different shapes, they both feature nonthermal tails with similar maximum energies. In particular, when , the 2D and 3D spectra look very similar, suggesting that 3D effects maintain the main particle accelerating properties of the MRI turbulence in the stratified setup.
Even though the nonthermal particle behavior in our runs suggests a significant role of magnetic reconnection in the acceleration of particles, our simulations may be subject to effects that are not present in previous magnetic reconnection studies. These include particle escape from the disk, stochastic acceleration by the MRI turbulence (e.g., Kimura et al., 2019; Sun & Bai, 2021), and the action of various kinetic instabilities that may contribute to field dissipation and/or particle acceleration, including, e.g., the drift kink instability (Zenitani & Hoshino, 2007) and the ion-cyclotron instability (Ley et al., 2019). We thus defer to future research a detailed determination of the dominant acceleration process(es) as well as the role of the scale-separation ratio by including 2D and 3D runs with larger values of .

7 Conclusions
In this work we have studied the effect of stratification on the collisionless MRI using 2D and 3D PIC simulations. Comparing 2D stratified and unstratified runs, we found that stratification affects the evolution of the disk conditions, due to the presence of outflows and disk expansion, leading to a decrease in the amplification of magnetic field energy density in the turbulent non-linear MRI regime. However, the expansion of the disk also decreases the plasma pressure and density, resulting in a highly magnetized disk, with smaller and larger cold magnetization parameter compared to the unstratified case. Indeed, in the nonlinear regime the disk is magnetic-pressure supported with , which is a factor smaller than the value reached by its unstratified counterpart. Our stratified simulations do not exhibit a discernible low beta corona separated from the disk.
In the disk region, our runs also give rise to a significant large scale and predominantly toroidal dynamo-like field ( in 2D), whose dominant scale length follows the disk scale height. Although a large scale field also appears in the 2D unstratified case, its scale length is times smaller. The increased magnetization of our 2D stratified runs produces an effective viscosity in the disk that reaches , which is a factor larger than in the equivalent unstratified case. This viscosity is dominated by the Maxwell stress, , with a small contribution of the anisotropic stress, . This small is consistent with the regulation of pressure anisotropies by kinetic microinstabilities in the low regime.
Even though our 2D and 3D stratified simulations produce similar results, some differences are present. In order to assess them, we compared 2D and 3D runs focusing on a specific case with small scale separation, . In the early phase of the non-linear MRI stage (i.e., orbits after the triggering of the instability), 3D simulations exhibit a significantly lower amplification of the magnetic field energy density compared to their 2D counterpart, consistently with a more efficient reconnection of the toroidal magnetic field component in 3D (as shown in the recent work of Bacchini et al., 2022). This primarily affects the effective viscosity and the plasma , which are, respectively, times smaller and larger in the 3D case. However, after this initial stage (at []), our 2D and 3D simulations are more similar, with reaching essentially the same values and the effective viscosity being only times smaller in 3D (in 3D, during the whole nonlinear MRI stage). This transition at [] occurs because of the growing importance of the large scale dynamo-like field ( in 3D). Indeed, after an initial stage in which the turbulent field () dominates, the dynamo-like field becomes larger than the turbulent field in the 3D runs while in 2D it reaches values comparable to the turbulent field. Since the dynamo field has almost the same amplitude in 2D and 3D, the total fields in these two types of runs differ by a small amount after []. Also, in this dynamo-dominated period, the 3D viscosity is mainly produced by the dynamo-like field, while in 2D the turbulent and dynamo fields contribute comparably to . In 3D the disk viscosity is also dominated by the Maxwell stress, , with a small contribution from the anisotropic stress, . This is also consistent with the action of pressure anisotropy-driven kinetic microinstabilities in the 3D case, as it occurs in 2D. Our 2D and 3D results in terms of , and dynamo-like field behaviors are reasonably consistent with previous 3D MHD simulations of stratified disks with similar initial conditions (e.g., Bai & Stone, 2013; Salvesen et al., 2016).
In terms of particle acceleration, in our 2D runs we find that the particle spectra in the nonlinear MRI stage follow power-laws with exponential cut-offs, with power-law indices for disk temperatures . Additionally, depending on the value of during the nonlinear MRI stage, the maximum energy attained by the particles is either proportional to the scale separation or fairly independent of this parameter, which appears to be consistent with previous magnetic reconnection studies (Werner et al., 2016). Particle acceleration in our 2D unstratified runs appears to be less efficient than in the analogous stratified case. This is likely due to the smaller cold magnetization parameter attained in the unstratified simulations. Furthermore, the particle acceleration observed in our 2D run with is well reproduced by its analogous 3D simulation, suggesting that 3D effects should maintain most of the acceleration properties of the MRI turbulence. However, 3D runs with larger scale-separation ratio are needed to confirm this trend.
In summary, our results suggest that including disk stratification in shearing-box PIC simulations of the MRI is important for studying its saturation, effective viscosity generation and particle acceleration physics. Interestingly, 2D and 3D simulations give quite similar results for the scale-separation ratios used in this work, especially after the magnetic field energy becomes dominated by a large-scale, dynamo-like field (which occurs orbits after the triggering of the instability). We leave for future work the clarification of the effect of larger scale-separation ratios in 3D, as well as disentangling the underlying mechanism(s) for particle acceleration. We also note that our results refer to a specific case of initial plasma conditions. Further research is thus needed to clarify the effects of changing the initial and/or temperature in the disk, potentially leading to a more distinct differentiation between an unmagnetized disk and a magnetized corona (e.g., Salvesen et al., 2016). Investigating the effect of more realistic mass ratios on the dynamic and thermodynamic properties of the collisionless MRI is also deferred to future work.
Acknowledgements
A. Sandoval acknowledges support from the Center for Excellence in Astrophysics and Associated Technologies (CATA) through ANID, BASAL, FB210003. M. Riquelme thanks support from a Fondecyt Regular Grant No. 1191673 and from CONICYT/Quimal 190011. A. Spitkovsky acknowledges the support of NSF grants PHY-2206607 and AST-1814708. F. Bacchini acknowledges support from the FED-tWIN programme (profile Prf-2020-004, project “ENERGY”) issued by BELSPO. The computational resources and services used in this work were provided by the National Laboratory for High Performance Computing (NLHPC) of the Center for Mathematical Modeling of University of Chile (ECM-02) and the VSC (Flemish Supercomputer Center), funded by the Research Foundation – Flanders (FWO) and the Flemish Government – department EWI.
Data Availability
The data underlying this article will be shared on reasonable request to the corresponding author.
References
- Bacchini et al. (2022) Bacchini, F., Arzamasskiy, L., Zhdankin, V., Werner, G. R., Begelman, M. C. & Uzdensky, D. A. 2022, ApJ, 938, 86
- Bai & Stone (2013) Bai X.-N. & Stone J. M., 2013, ApJ, 767, 30
- Balbus & Hawley (1991) Balbus, S. A., & Hawley, J. F. 1991, ApJ, 376, 214
- Balbus & Hawley (1998) Balbus, S. A., & Hawley, J. F. 1998, Rev. Mod. Phys., 70, 1
- Belyaev (2015) Belyaev M. A., 2015, New Astron., 36, 37
- Buneman (1993) Buneman, O. 1993, Computer Space Plasma Physics (Tokyo: Terra Scientific)
- Cerutti et al. (2015) Cerutti, B., Philippov, A., Parfrey, K. & Spitkovsky, A. 2015, MRAS, 448, 606
- Esin et al. (1997) Esin, A. A., McClintock, J. E., & Narayan, R. 1997, ApJ, 489, 865
- Hakobyan et al. (2021) Hakobyan, H., Petropoulou, M., Spitkovsky, A. & Sironi, L. 2021, ApJ, 912, 48
- Hawley et al. (1995) Hawley, J. F., Gammie, C. F., & Balbus, S. A. 1995, ApJ, 440, 742
- Hirabayashi & Hoshino (2017) Hirabayashi, K. & Hoshino, M. 2017, ApJ, 842, 36
- Hoshino (2013) Hoshino, M. 2013, ApJ, 773, 118
- Hoshino (2015) Hoshino, M. 2015, Phys. Rev. Lett., 114, 061101
- Inchingolo et al. (2018) Inchingolo, G., Grismayer, T., Loureiro, N. F., Fonseca, R. A., & Silva, L. O. 2018, ApJ, 859, 149
- Kimura et al. (2019) Kimura, S., Tomida, K., & Murase, K. 2019, MNRAS 485, 163
- Kunz et al. (2016) Kunz, M. W., Stone,J. M. & Quataert, E. 2016, Phys. Rev. Lett., 117, 235101
- Ley et al. (2023) Ley, F., Zweibel, E., Riquelme, M., Sironi, L., Miller, D. & Tran, A. 2023, ApJ, 947, 89
- Ley et al. (2019) Ley, F., Riquelme, M., Sironi, L., Verscharen, D. & Sandoval, A. 2019, ApJ, 880, 100
- Passot & Sulem (2015) Passot, T & Sulem, P. L. 2015, ApJ, 812, L37
- Petropoulou & Sironi (2018) Petropoulou, M. & Sironi, L. 2018, MNRAS, 481, 5687
- Riquelme et al. (2012) Riquelme, M.A., Quataert, E., Sharma, P., & Spitkovsky, A. 2012, ApJ, 755, 50
- Salvesen et al. (2016) Salvesen, G., Simon, J. B., Armitage, P. J. & Begelman, M. C. 2016, MNRAS, 457, 857
- Schiff (1939) Schiff, L. I. 1939, Proc. Natl Acad. Sci, 25, 391
- Shakura & Sunyaev (1973) Shakura, N. I., & Sunyaev, R. A. 1973, A&A, 24, 337
- Sharma et al. (2006) Sharma, P., Hammett, G., Quataert, E., & Stone, L. 2006, ApJ, 637, 952
- Sharma et al. (2007) Sharma, P., Quataert, E., Hammett, G., & Stone, L. 2007, ApJ, 667, 714
- Sironi et al. (2016) Sironi, L., Giannios, D. & Petropoulou, M. 2016, MRAS, 462, 48
- Spitkovsky (2005) Spitkovsky, A. 2005, in AIP Conf. Proc. 801, Astrophysical Sources of High Energy Particles and Radiation, ed. T. Bulik, B. Rudak, & G. Madejski (Melville, NY: AIP), 345
- Sun & Bai (2021) Sun, X & Bai, X.-N. 2021, MNRAS 506, 1128
- Walker et al. (2016) Walker, J., Lesur, G., & Boldyrev, S. 2016, MNRAS, 457, L39
- Werner et al. (2016) Werner, G. R., Uzdensky, D. A., Cerutti, B., Nalewajko, K., & Begelman, M. C. 2016, ApJL, 816, L8
- Yuan & Narayan (2014) Yuan, F. & Narayan, R. 2014, ARA&A, 52, 529
- Zenitani & Hoshino (2007) Zenitani, S. & Hoshino, M. 2007, ApJ, 670, 702