Enhancing Energy-Awareness in Deep Learning through Fine-Grained Energy Measurement
Abstract.
With the increasing usage, scale, and complexity of Deep Learning (dl) models, their rapidly growing energy consumption has become a critical concern. Promoting green development and energy awareness at different granularities is the need of the hour to limit carbon emissions of dl systems. However, the lack of standard and repeatable tools to accurately measure and optimize energy consumption at a fine granularity (e.g., at the API level) hinders progress in this area.
This paper introduces FECoM (Fine-grained Energy Consumption Meter), a framework for fine-grained dl energy consumption measurement. FECoM enables researchers and developers to profile dl APIs from energy perspective. FECoM addresses the challenges of fine-grained energy measurement using static instrumentation while considering factors like computational load and temperature stability. We assess FECoM’s capability for fine-grained energy measurement for one of the most popular open-source dl frameworks, namely TensorFlow. Using FECoM, we also investigate the impact of parameter size and execution time on energy consumption, enriching our understanding of TensorFlow APIs’ energy profiles. Furthermore, we elaborate on the considerations and challenges while designing and implementing a fine-grained energy measurement tool. This work will facilitate further advances in dl energy measurement and the development of energy-aware practices for dl systems.
1. Introduction
Deep Learning (dl)-based solutions are employed in an increasing number of areas concerning our day-to-day life, such as, in medicine (Panesar, 2019; Nayyar et al., 2021; Bote-Curiel et al., 2019), transportation (Veres and Moussa, 2019; Wang et al., 2019; Haydari and Yılmaz, 2020), education (Nafea, 2018; Perrotta and Selwyn, 2020; Vijayalakshmi and Venkatachalapathy, 2019), and finance (Mehbodniya et al., 2021; Ozbayoglu et al., 2020). However, the increasing use of dl requires ample computational resources, resulting in an alarming surge in energy consumption. The extensive use of computational resources causes significantly increased co2 emissions and financial costs (Fonseca et al., 2019). For instance, training a MegatronLM model (Shoeybi et al., 2019) consumes enough energy to power three American households for a year (Labbe, 2021). This unsustainable trend is continuing; the computational resources required to train a best-in-class ml model is doubling every 3.4 months (Amodei and Hernandez, 2018).
For this reason, it is essential to make software development, specifically using dl, energy-aware, i.e., develop dl code optimized from the energy consumption perspective, without compromising models’ accuracy (Sarro, 2023). To achieve this goal, we propose to measure energy consumption for dl applications at fine granularity (such as at the API level) and identify energy-hungry API calls; so that we can suggest alternative energy-efficient software versions (Fonseca et al., 2019).
Software engineering researchers have studied the energy footprints of software programs in recent years (Desrochers et al., 2016; García-Martín et al., 2019; Georgiou et al., 2022; Hähnel et al., 2012). Broadly, energy measurement techniques are classified into hardware-based and software-based. Hardware-based techniques use physical devices such as a power monitor to measure the power consumed by a machine at a given time. However, hardware-based techniques are considered very difficult in use (Cruz, 2021), because of syncing issues, i.e., to sync the start and end times of the program execution with a hardware device, automatically. Software-based techniques measure energy by using a set of special-purpose registers, referred to as performance counters (pmcs), in modern processors. These registers count specific hardware events (Khan et al., 2018), including power consumed by hardware components, such as CPU and memory. Most research studies (Georgiou et al., 2022; Abou-Of et al., 2016; Jurj et al., 2020) use software tools such as perf (manual page, 2023) and PowerStat (Canonical, 2018) that use PMCs under the hood to measure energy consumption.
Energy can be measured at different granularities, ranging from coarse-grained system-level to fine-grained API111An API (i.e., Application Programming Interface) refers to publicly available elements (e.g., interfaces, classes, methods) in a library or a framework. An API comes with its public reference documentation that explains to the user how a method should be used, properly. Client applications, such as ml-based programs, call these apis from the dl frameworks e.g., TensorFlow and PyTorch, to implement their functionalities. level. System-level measurement considers the overall energy consumption of the entire machine or computing hardware. A program- or a process-level profiling examines the energy used by a software application. Function-level measurement profiles the energy usage within specific code blocks and methods. API-level measurement focuses on the energy footprint of external frameworks called by the software in the form of API call statements. API-level measurement offers the finest granularity in attributing energy consumption to specific code entities.
Despite efforts to improve energy-efficiency of source code, we observe many gaps and deficiencies in the literature (Fonseca et al., 2019). Georgiou et al. (Georgiou et al., 2022) revealed that the documentation of even the most popular dl frameworks, namely TensorFlow and PyTorch, lack an energy-consumption profile of their APIs. Such an energy consumption profile could motivate software developers to explore alternative solutions and make software development more energy-efficient (Fonseca et al., 2019). The primary reason for the lack of energy-aware documentation for dl frameworks is the absence of fine-grained energy consumption measurement techniques (García-Martín et al., 2019). In fact, the majority of the existing approaches allow us to measure energy consumption only at the system-level due to the support offered by hardware and operating system vendors (Cruz, 2021).
There has been some efforts to measure energy at a fine-grained level; however, existing approaches for measuring energy consumption, in general, have several deficiencies. For example, existing approaches (Wei et al., 2019; Ournani et al., 2021) operate at a coarser granularity, measuring entire functions and cannot be used to measure energy consumed by at the statement-level, including calls to external frameworks, libraries, and APIs. Furthermore, they support only specific programming languages such as Java, C/C++, and Fortran for CPU architectures, without considering GPU architectures used in most deep learning deployments (Dally et al., 2021).
Software tool vendors have developed relevant tools, such as Code Carbon (Carbon, 2023) and Experiment Impact Tracker (Henderson et al., 2020a), to estimate power consumption and carbon emissions during the training of dl models. However, these tools focus on the ml program-level granularity, leading to sampling intervals exceeding 10 seconds, which is not suitable for fine-grained energy measurements (because the measured source code entity can complete its execution in a fraction of seconds). Moreover, they, including other academic studies so far, overlook the overhead introduced by background processes and temperature fluctuations within the computing environment, resulting in noisy measurements. Bannour et al. (Bannour et al., 2021) have shown that existing tools consistently under-report energy consumption and carbon emissions, making them less sensitive to measuring energy at a smaller scale and, hence, making them unsuitable for measuring energy consumption at a finer granularity. At present, to the best of our knowledge, there is no convenient (i.e., easily usable), generic (i.e., that can be applied on various kinds of programs and granularity), and automated noise-free solution for measuring the energy consumption of custom deep learning code at a fine-grained level, such as at the API granularity.
This study aims to address the challenge of measuring energy consumption at the API granularity as a crucial step towards using such a mechanism. To this end, we devise a framework viz. FECoM, which measures the energy consumed by APIs within a dl framework. FECoM generates an Abstract Syntax Tree (ast) of the input program, applies static instrumentation by using our patching mechanism, and measures the energy consumption of the desired APIs. We empirically investigate how the size of the parameters of an API call affects energy consumption and execution time (RQ2). This empirical analysis provides valuable insights on how data size influences energy consumption, enriching our understanding of the used APIs’ energy profile in the context of dl applications. Though we use the developed method to measure energy consumed by a dl framework APIs, it can be used to measure energy consumption at a code block or even statement-level. Given the absence of any standard for dl API energy-consumption at a fine-grained level of measurement, we take a step further and provide a detailed account of challenges and considerations that are vital for researchers designing energy measurement tools (RQ3). Such considerations will facilitate the development of more tools and techniques for energy measurement in the field. Our study makes the following contributions:
-
•
Method and framework. Implementing a generic method and framework, FECoM, to accurately measure energy consumption at a fine-grained level. Such a method has been instantiated for TensorFlow, to show its feasibility in practice.
-
•
Static instrumentation tool. Developing a static instrumentation tool, viz. Patcher (FECoM, 2023e), enabling necessary program patching for the energy measurement framework.
-
•
Empirical study. Conducting an empirical study to evaluate and understand the impact of parameter size on energy consumption for dl APIs, as well as systematically examine the execution reports produced by our FECoM to understand the reasons of failures to measure energy consumption at a fine-gained granularity.
-
•
Dataset. Create a dataset (FECoM, 2023c) comprising energy profiling data at the API granularity for TensorFlow API calls. This dataset covers a diverse range of domains and includes API calls with varying input parameter sizes.
-
•
Documenting the challenges. Collect and categorize challenges that may arise during the development of an energy measurement tool at fine-grained granularity to facilitate the development of effective energy measurement tools and provide insights to researchers and developers in this field.
We make our framework FECoM, the dataset, as well as the patching program used for static instrumentation publicly available (FECoM, 2023a).
2. Approach
This section describes the architecture of the Fine-grained Energy Consumption Meter (FECoM) framework and static instrumentation we devised for fine-grained energy-consumption measurement.
2.1. FECoM Architecture
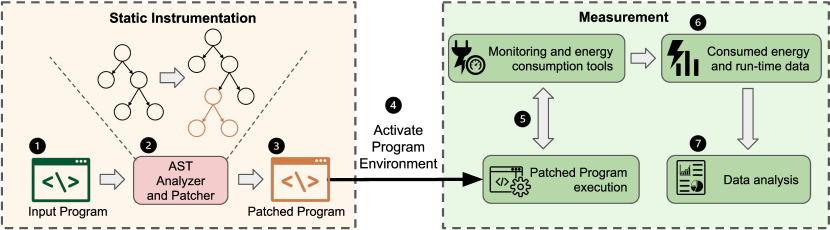
Figure 1 presents the architecture of the proposed framework, FECoM. FECoM employs static instrumentation to measure fine-grained energy consumption. For a given program, FECoM identifies a set of target API calls and instruments the code around the identified calls. The instrumented code triggers FECoM’s measurement module, enabling us to isolate the API from the rest of the program during execution and measure its energy consumption. The measurement module plays a crucial role in ensuring that the temperature and energy consumption remain stable. It performs the necessary checks to verify these conditions. Once the temperature and energy stability criteria are met, the measurement module proceeds to execute the API call specified, capturing the corresponding energy data. In the following, we describe each of FECoM ’s components in detail (FECoM, 2023a).
2.2. Static instrumentation
We developed a tool, referred to as Patcher, to instrument the code to enable energy-consumption measurement. Patcher operates at both the method and project levels, offering fine-grained control over energy profiling. In the context of this work, “method” refers to an API call within the code of a dl project, while “project” encompasses the entire codebase of a dl project hosted in a repository.
Patcher generates an Abstract Syntax Tree (ast) of the input Python script and identifies the libraries and their aliases used within them. This information allows Patcher to locate the API calls corresponding to the specified libraries. Patcher allows specifying the library for the analysis. For instance, if the user wants to measure the energy consumption of the API’s provided by TensorFlow, they specify the name of the library (“TensorFlow” in this case) as an input parameter, and Patcher automatically identifies all the TensorFlow API calls. Additionally, Patcher identifies class definitions that utilize the required libraries as base classes and keeps track of objects created from these classes. This enables the identification of method calls made through these objects, which are the target calls for energy measurement.
The instrumentation process inserts two source code statements around the target function calls, as shown in Listing 2, which act as breakpoints. The first statement, before_execution_INSERTED_INTO_SCRIPT, is placed before the original function call; the statement ensures that the machine has reached a stable state and captures the start time of method execution. The second statement, after_execution_INSERTED_INTO_SCRIPT, is inserted after the function call; this statement records relevant information such as the total execution time and energy consumed. We provide the list of used parameters and corresponding descriptions in Table 1.
The Project-level script Patcher follows a similar approach as the method-level Patcher by inserting the same source code statements before and after the entire script, enabling comprehensive energy-consumption measurement throughout the project’s execution.
| Argument/Function | Description |
|---|---|
| start_times_INSERTED_INTO_SCRIPT | Start times determined by before_execution |
| before_execution_INSERTED_INTO_SCRIPT | Patched function added before the original API call |
| EXPERIMENT_FILE_PATH | Path to store experiment data |
| function_to_run | API signature for analysis |
| after_execution_INSERTED_INTO_SCRIPT | Patched function added after the original API call |
| method_object | Object in case of a method call e.g., model in model.compile() |
| function_args | Arguments of the API call |
| function_kwargs | Keyword arguments of the API call |
2.2.1. Validation for the static instrumentation tool
To validate Patcher, we drew inspiration from Automated Program Repair (APR) techniques (Wang et al., 2020), adapting them to our use case. The validation process consists of the following steps:
Executability: In the first step, we ensure the executability of the generated patches, confirming that they execute without any syntactical errors. As Python is an interpreted language, we utilize the Pylance language server (Microsoft, 2023) to validate the patched code for any syntactic or type errors, ensuring a smooth compilation process.
Automated testing: Next, we conduct automated testing on the patched scripts to verify their behavior against the original version to ensure that the patches have not introduced any unintended changes to a project (i.e., we check if they produce the expected outputs). For this step, we randomly selected six projects from the set of projects used in our experiment (see Section 3.3); the chosen projects for evaluation represent approximately one-third of the analyzed projects.
Human evaluation: To further validate the correctness and coverage of the code generated by Patcher, we conducted a human evaluation. We used the six projects selected from the previous step and sought volunteers from the Computer Science Department of Dalhousie University with prior experience developing dl models in Python using TensorFlow. Six graduate students were chosen to participate, and we assigned two projects to each evaluator, ensuring two evaluators for each project. The evaluators were provided with the original Python notebook, the converted Python script from the notebook, the method-level patched script, and the project-level patched script. They were briefed about their task using a patch template as described in Listing 2, and were informed about the purpose of the validation without indicating the authorship of Patcher. The evaluators were then instructed to assess the provided artifacts and document any issues related to the following criteria:
-
•
Correctness: This assesses whether the generated patch for each method adheres to the patch template as shown in Listing 2 (i.e., it accurately extracts all the argument values for a given API call). The evaluators were asked to mark each patched API call as either Correct or Incorrect based on this criteria. To evaluate, we calculate Correctness accuracy as the ratio of total correct patches to the total number of patches evaluated.
-
•
Completeness: This evaluates whether the tool accurately identifies all TensorFlow API calls and appropriately patches all relevant calls. The evaluators were asked to provide the total number of eligible API calls (i.e., TensorFlow based calls), along with the total number of calls that were missed by the Patcher (i.e., API calls that should have been patched, but were missed by the Patcher). To evaluate, we calculate Completeness accuracy as the ratio of total patched calls to the total number of eligible calls.
The evaluators were asked to fill an anonymous Excel sheet (FECoM, 2023f) for each project containing information such as logs and relevant method calls for which they checked the patched code to verify each of the evaluation criteria. We consolidated the evaluations and checked for any differences in the evaluation for each project.
Notably, the evaluators reported high accuracy for the patched projects based on the adopted criteria. Specifically, the Correctness criterion achieved accuracy, while the Completeness criterion achieved accuracy. Patcher missed API call out of expected total calls. A detailed analysis revealed that these missed instances are API calls made via returned TensorFlow objects from user-defined functions. The Patcher currently operates on method calls made by the objects created and used in the same code block. Hence, when a user-defined method creates and returns an object to a code block that uses the object to invoke a method, it does not get identified by the Patcher. We aim to address this limitation in the future versions of the Patcher, by introducing type prediction of the returned objects.
2.3. Pre-measurement Stability Checks
The machine used for the experiments must be stable before executing the API calls and collecting their energy consumption as suggested by Georgiou et al. (Georgiou et al., 2022). The introduced stability checks ensure low fluctuation in the hardware’s energy consumption, thus reducing noise and ensuring accurate measurements by conducting energy measurement experiments under approximately the same conditions every time.
We perform two kinds of stability checks as part of the FECoM framework—the temperature check and the energy stability check. GPU overheating can substantially increase power draw (Price et al., 2016), skewing results. The temperature check ensures that the CPU and GPU temperatures are below a standard hardware-specific threshold, maintaining uniform thermal conditions. FECoM uses lm-sensors (Lm-Sensors, 2023) tool to obtain the CPU temperature and nvidia-smi (Developer, 2022) to obtain GPU temperature. We follow a key guideline to run as few user processes as possible during the experiment. This guideline helps us achieve stability from a temperature and energy consumption perspective.
With energy stability check functionality, we ensure that CPU, RAM, and GPU energy observations are not fluctuating. Variability indicates outside processes are consuming significant power, introducing measurement noise. The check also accounts for overheads from static instrumentation by ensuring a steady pre-instrumentation state. Fluctuations in energy consumption indicate that other processes on the machine are consuming considerable energy, and, hence, the measured energy might include considerable noise. To perform the check, we measure and record energy consumption by the three hardware components (i.e., CPU, RAM, and GPU), periodically. We load the most recent energy data observations for the components. Then, we determine stability by comparing the coefficient of variation () of the data points, to the stable state coefficient of variation, for each component. We calculate the stable state coefficient one time in no-load condition i.e., by running only the energy measurement scripts without any other processes on the experiment machine for approximately minutes. We calculate the coefficient of variation by dividing the mean by the standard deviation. If the coefficient of variation of the last observations is smaller than or equal to the stable state coefficient of variation, the machine is deemed to be in a stable state. If both stable temperature and stable energy are achieved, the machine is ready to execute the experiments.
2.4. Energy Measurement Module
The energy measurement module (FECoM, 2023d) executes the selected project, measures the consumed energy, and documents the observations. We execute each project (and each API call, in turn) ten times to ensure the reliability of the measurements.

Figure 3 shows a typical power consumption profile of an API call. We measure the energy consumption by the API between the start () and end () time of the call execution. Let be the energy consumed for a given API call at time , where . This measurement is then adjusted by subtracting the stable mean energy consumption of the system, which can be attributed to background processes, resulting in . We measure periodically for different values of and add them to obtain i.e., . The resulting value is further averaged over 10 repetitions of the same experiment to obtain the mean energy consumption . Throughout this paper, we will refer to when discussing net energy consumption in our experiments.
We store the raw measurements in JSON format, ensuring their accessibility and reproducibility via our replication package. The collected energy consumption data include energy consumption by CPU, RAM, and GPU. Additionally, we record timestamps, experiment settings such as wait time if the machine is unstable, wait time after API call execution, stable state power consumption, GPU and CPU max allowed temperature, and sizes of arguments passed to the API under measurement.
2.5. Tools
We provide below a brief description of the tools that we used for energy consumption and temperature monitoring.
Intel’s Running Average Power Limit (RAPL): is an interface that allows applications to monitor and control the power consumption of various components, such as the CPU and memory, within Intel processors. RAPL works by measuring the power consumption of the processor at regular intervals of approximately 1 ms (Intel, 2020) and reporting this information. It measures energy consumption of
-
•
Package (PKG): all CPU components, such as cores, integrated graphics, caches and memory controllers.
-
•
Core: all the CPU cores.
-
•
Uncore: all caches, integrated graphics and memory controllers.
-
•
dram: random access memory RAM attached to the CPU’s memory controller (Shanbhag and Chimalakonda, 2022).
Since the PKG values include the CPU’s total energy consumption, we will only discuss these in our analysis similar to other studies (Shanbhag and Chimalakonda, 2022), and we will refer to them as CPU energy consumption.
Perf: is a command-line tool for collecting performance statistics from Linux systems. Data relating to energy consumption is collected using Perf’s energy event—a wrapper around Intel’s RAPL. Specifically, the perf stat command is used to gather and report real-time performance counter statistics from running a command. Though perf stat supports reporting statistics at a maximum 1 ms frequency, a high overhead could result at intervals lower than 100 ms (manual page, 2023).
NVIDIA’s System Management Interface (nvidia-smi) (Developer, 2022): is a command-line utility that allows monitoring and controlling the performance of NVIDIA GPUs. It provides detailed real-time status of the GPU, including its power draw and temperature.
lm-sensors (Lm-Sensors, 2023): is a Linux software tool package that enables monitoring of the hardware sensors on the CPU, which includes temperature sensors. It provides the sensors command-line interface for retrieving sensor data.
2.6. Replication Package
The replication package for FECoM is available on GitHub (FECoM, 2023a). It contains all the necessary files and instructions to replicate the experiments and results this paper presents.
3. Experimental Setup
3.1. Research Questions
The goal of this study is to develop an approach and framework to measure energy consumption at a fine-grained level (e.g., API level) to understand better the energy profile of APIs of dl frameworks so that it can be subsequently used to make their documentation energy-aware. Towards this goal, we propose the framework, FECoM (described in Section 2). We formulate the following research questions (RQs) to evaluate the proposed approach and the framework FECoM.
-
RQ1:
To what extent is FECoM capable of measuring energy consumption at the API level?
In this RQ, we aim to measure the effectiveness of the proposed framework, FECoM. We want to ensure the correctness of the measured energy through this evaluation. -
RQ2:
To what extent does input data size have an effect on energy consumption?
With RQ2, we wish to investigate the relationship between the input data provided to the APIs under examination and their energy consumption. Answering this RQ will reveal the energy profile of APIs in relation to their input parameter size, which should become a critical component of energy-aware API documentation. -
RQ3:
What are the main challenges and considerations in developing fine-grained energy measurement tools for dl frameworks?
Verdecchia et al. (Verdecchia et al., 2023) emphasized the significant scarcity of tools, for example, to measure energy consumption, in the Green Artificial Intelligence domain. Additionally, Bannour et al. (Bannour et al., 2021) noted that the existing tools lack sensitivity to measure energy consumption at fine granularity. However, measuring energy consumption at lower granularities, such as API-level poses unique challenges compared to coarse-grained measurement. With this research question, we aim to uncover the key challenges, underlying reasons and considerations that arise when developing tools measuring energy consumption for fine-grained profiling of dl frameworks and models. Furthermore, answering this research question will provide insights and suggestions for researchers and practitioners, and facilitate the development of new tools and techniques in the field.
3.2. Experimental Design
In this section, we elaborate on the experimental design choices and corresponding rationale for answering the research questions.
3.2.1. RQ1
Validating the correctness of the measured energy consumption at a fine-grained granularity is a non-trivial challenge due to the lack of existing tools or benchmarks to measure energy consumption at the fine-grained level. To overcome the challenge, we measure energy consumption both at the API level and at the project level, i.e., we measure the total energy consumed by the whole project and the energy consumed by all the API and method calls belonging to a framework like TensorFlow. The energy consumed by a project is approximately the sum of energy consumed by all the methods defined, called (including library/framework methods and API calls), and executed within the project. Therefore, the sum of the energy consumed by the measured methods must be less than the total energy consumed by the project. Concretely, we model the relationship between energy consumed by a project and the methods for , in the project, in the following way.
| (1) |
Where methods for are in the scope of energy measurement (e.g., TensorFlow methods and API calls in the considered project code) representing and, hence, measured by FECoM. The rest of the methods for represent that falls outside of the scope of FECoM and, hence, we do not measure their energy consumption. The energy consumed by methods within scope i.e., cannot be greater than the energy consumed by the entire project. In Equation 1, if the energy consumed by out-of-the-scope methods is negligible, i.e., , we should observe if we measure the energy consumed by individual methods, correctly.
We extend the evaluation of our proposed approach by investigating the relationship between energy consumption and execution time at the API level granularity. Previous research suggests a linear relationship between energy consumption and execution time (Corral et al., 2014), or indirectly, execution frequency (McIntosh et al., 2019). This relationship seems intuitive—the longer or more frequently a task is performed, the more energy is consumed. This assumption holds when the power remains constant, as energy consumption is given by , where represents the time duration. However, if the power is a function of time , the linear relationship no longer applies. Nevertheless, it is generally expected that as execution time increases, energy consumption will also increase proportionally.
3.2.2. RQ2
The time complexity of an algorithm, , is a function describing an asymptotic upper bound of an algorithm’s run-time given an input of size (Sipser, 2010). This implies that the execution time of an algorithm is a function of its input data size. In Section 3.2.1, we discuss that energy consumption is the function of execution time i.e., . Therefore, energy consumption also is a function of input parameter size as given below.
| (2) |
Though it is intuitive that the energy consumption of an API call depends on the input parameter size, the relationship between energy consumption and parameter size is not known. This research question utilizes our proposed method and FECoM to determine the concrete relationship between these two aspects.
In this experiment, we measure energy consumption by an API call multiple times, changing the passed parameters’ data size. We determine , and i.e., the energy consumed by CPU, RAM, and GPU, respectively, for various values of . We vary the input data size in increments of of the original data. The first run of a method uses of the original data, and this size is incremented by for each successive run until the 10th run uses the entire original data size. We analyze the method-level energy consumption data from RQ1 and identify of the most energy-hungry API calls. Similar to the RQ1 setup, we execute each selected API call times, resulting in observations for each call.
3.2.3. RQ3
This RQ explores and discusses the key considerations as well as challenges that one may face while designing and developing frameworks and tools similar to FECoM for fine-grained energy consumption measurement. To compile a comprehensive set of design considerations and challenges, we diligently documented all the error logs and issues encountered while developing the FECoM framework (FECoM, 2023b). Initially, we carefully reviewed meeting minutes from our development team comprised of the first three authors, identifying instances where roadblocks were encountered while developing the framework. Additionally, team members individually reviewed the initial list and augmented the identified issues. They also added new issues based on their experience working on this study. We asked them to supplement the issues with additional information, including instructions to reproduce, error logs, and adopted solutions.
We used the Open Coding Technique (Khandkar, 2009), a qualitative data analysis method, to analyze and categorize the identified issues. This approach enabled us to systematically label and categorize the collected information, identify emerging themes and patterns, and construct a conceptual framework from the raw issues. The process involved the following key steps:
(1) Coding process: The initial step involved thoroughly reviewing the collected initial issues and deconstructing them into smaller segments for close examination. We analyzed these segments to identify relationships, similarities, and dissimilarities. We assigned appropriate codes to each segment to facilitate further analysis, enabling us to identify and categorize them systematically for subsequent analysis. This process was conducted in isolation for each of the team members to eliminate bias in the coding process.
(2) Iterative process: Open coding is an iterative process that involves revisiting the segments and individual items multiple times. After an initial round of coding, we searched for new concepts and patterns by continually refining our coding scheme until we reached data saturation.
(3) Emergent coding: With emergent coding, codes and categories emerged directly from the data itself, allowing themes and patterns to be identified inductively. This approach prevented us from imposing preconceived notions and theories, ensuring a data-driven analysis.
(4) Constant comparison: We continuously compared new data with existing codes and categories throughout the coding process to ensure consistency and identify variations or similarities.
After completing the process, we obtained issues grouped into multiple categories and subcategories.
3.3. Repository Selection
The following criteria were used to select a dl project repository for evaluating the RQs.
-
(1)
It should be publicly available on GitHub and popular (i.e., having at least stars).
-
(2)
It should include a good variety of TensorFlow-2-based projects across various dl domains and should be actively maintained.
-
(3)
It should be easily reproducible.
Based on these criteria, we chose the dl tutorials repository from the official TensorFlow documentation (Tensorflow, 2023) (commit: e7f81c2) for our experiments. This repository is publicly available on GitHub, with over thousand stars and thousand forks, and offers a wide variety of dl tasks, including computer vision, natural language processing, and audio processing, each presented as a self-contained Jupyter notebook. These tutorials extensively utilize TensorFlow’s essential API’s. Moreover, they are designed for easy reproducibility, as each tutorial performs all the steps of the dl pipeline (i.e., data loading, pre-processing, training, testing) within the notebook without any additional dependencies. Additionally, the tutorials are continually updated to work with the latest TensorFlow versions, maintained by a team of more than contributors.
3.4. Experimental Environment
All experiments were conducted on a Ubuntu machine equipped with an Intel(R) Xeon(R) Gold 5317 CPU (24 logical cores, GHz), and GB of main memory. For GPU-accelerated computations, the machine incorporates an nvidia GeForce rtx Ti with GB GDDR6X memory. The GPU exhibits an idle power of Watts and maximum power consumption of Watts. To ensure consistent and reliable results, our experimental setup utilizes Python alongside TensorFlow . This combination requires nVIDIA CUDA and cuDNN to leverage the full capabilities of the GPU and optimize dl computations.
3.5. Settings
3.5.1. Sampling interval
The frequency at which energy measurement samples are captured and retrieved is an important factor in measuring energy consumption. The frequency of the sampling interval affects the precision and resolution of the measurements taken. A high-frequency sampling interval can provide more precise and detailed measurements. However, it may also require more processing power and resources and generate a larger data volume (leading to more overheads) (manual page, 2023). However, using a lower frequency sampling interval can also result in situations where energy consumption readings at API granularity cannot be captured precisely. If a API’s execution time is shorter than the sampling interval, energy consumption cannot be measured effectively. Thus, this trade-off needs consideration in selecting a sampling interval frequency.
For FECoM, we set the sampling interval to be ms. The selected sampling frequency is significantly lower than the other studies (Linares-Vásquez et al., 2014; Wei et al., 2019) in the field of software energy measurement. For example, Wei et al. uses a sampling frequency of ms. However, dl APIs typically have long execution times, thus making a lower frequency adequate for capturing energy fluctuations while minimizing overhead. Users of FECoM can customize the sampling interval according to their specific experiment requirements.
3.5.2. Machine stability
As discussed in Section 2.3, maintaining the machine’s temperature and energy stability is crucial to ensure accurate and reliable energy consumption measurements. We have set conservative temperature thresholds of 55∘C for the CPU and 40∘C for the GPU, well below the maximum allowed temperatures of 84∘C for the Intel(R) Xeon(R) Gold 5317 cpu (Intel, 2023) and 93∘C for the nvidia GeForce rtx 3070 GPU (NVIDIA, 2023b) as specified in the product documentation. We adopt best practices from the literature to achieve and maintain stable conditions during measurements. For the GPU nvidia-smi, enabling persistence mode is crucial as it optimizes GPU performance by keeping it in a fixed state and CUDA libraries ready for immediate use, minimizing voltage and frequency changes (Cai et al., 2017; Reaño et al., 2015). Similarly, setting the cpu power policy to performance mode ensures it operates at maximum frequency (Suchanek et al., 2018).
To enhance measurement accuracy, it is essential to minimize background processes on the machine related to energy measurement. Stopping unnecessary background processes (Georgiou et al., 2022) ensures that only the relevant processes run during the measurement cycle. Additionally, the energy measurement cycle for each API call should only initiate when the machine is in a “stable condition” (Georgiou et al., 2022). This is ensured via the energy stability check discussed in Section 2.3. After each call execution, the machine should remain idle for a brief period to avoid tail power states (Georgiou et al., 2022), ensuring the accuracy and consistency of the energy consumption measurements.
4. Results
In this section, we present our experimental observations for the considered research questions.
4.1. RQ1. FECoM Effectiveness
To answer RQ1, we measure energy consumption both at the API and the project level. As we discuss in Section 3.2.1, if the sum of energy consumed by the measured APIs is greater than the energy consumed by the entire project, then the proposed approach is falling short of measuring energy consumption at the fine-grained granularity. We use approximate values for the comparison because energy consumption tools have limited precision (Cruz, 2021; Georgiou et al., 2018). As we discuss in Section 3.5.1, we use a sampling interval of ms for the perf and nvidia-smi tools. It implies that the energy consumption of any API with a run time below ms is excluded from the sample of considered calls, further reducing the sum of method-level energy consumption values.
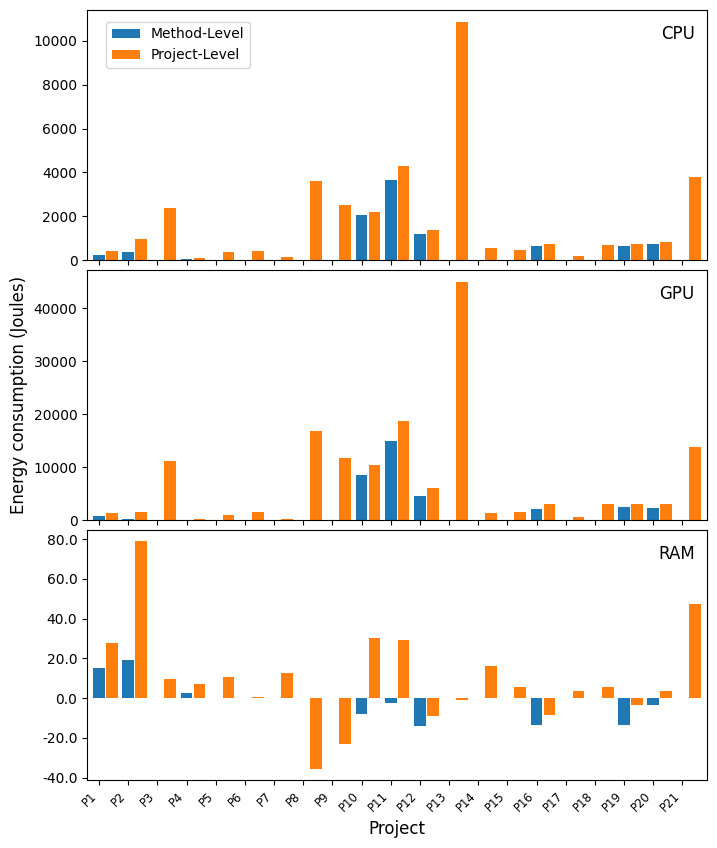
Figure 4 shows the total energy consumed by individual projects and all methods in the scope within individual projects for each hardware device (i.e., CPU, GPU, and RAM).
It shows that for all analyzed projects for each hardware device considered in our study.
We can observe varying degree of difference between and
for different projects. Such a variance stems from different amounts of energy consumed by methods not in the scope, i.e., .
For instance, the project images/cnn has TensorFlow methods in scope that consume Joules energy within the GPU; the rest of the energy Joules energy is consumed by out-of-scope methods.
Project keras/overfit_and_underfit presents an intriguing case where we observe .
This difference can be attributed to the fact that the project imports TensorFlow library in their source code, but it majorly utilizes a different library, other than TensorFlow for ml tasks.
Consequently, while the energy consumption associated with this external library is reflected in the project-level energy measurement, it remains unaccounted for in the method-level energy analysis.
Given that FECoM targets TensorFlow methods, energy consumed by functions of other libraries is not accounted for in .
We perform statistical tests to determine the significance of the observed differences in energy consumption between method-level and project-level measurements. To assess the normality of the data, we conducted the Shapiro-Wilk (Shapiro and Wilk, 1965) test at both the method and project levels with . The p-values for CPU were and , for GPU were and , and for RAM were and , respectively for the method and project levels. The results of the Shapiro-Wilk test indicate that the data for both the method and project levels are not normally distributed (). As the data did not meet the normality assumption, we opted for non-parametric tests. We employed the Wilcoxon signed-rank test (Wilcoxon, 1992), which is suitable for paired samples, to assess whether the sum of method-level energy consumption is less than the project-level energy consumption for each energy type. We performed the Wilcoxon test using the Scipy (Scipy, 2023) library with the alternative hypothesis set to “greater” that determines whether the distribution underlying the difference between paired samples (project_level and sum of method_level) is stochastically greater than a distribution symmetric about zero. Based on the results of the one-tailed Wilcoxon signed-rank test, we can conclude that there is a statistically significant difference between the method-level and project-level energy consumption for all energy types (CPU, GPU, and RAM). The p-values for the Wilcoxon signed-rank tests are extremely small(), with values ranging from to , thus supporting the alternative hypothesis that the sum of method-level energy for a project is less than the project-level energy consumption.
Another interesting observation stemming from Figure 4 is the presence of negative average RAM energy consumption for some projects. Figure 6 shows a sudden spike in RAM power consumption at the beginning of API call execution, followed by a settling down below the mean stable power. Before executing a function on the GPU, the input data must be copied from RAM (CPU memory) to GPU memory (Research, 2023). These extensive data copying operations could explain the spike in RAM power draws at the start of execution. This spike, followed by a lower RAM power, is likely associated with TensorFlow methods utilizing GPU kernels, which utilize GPU memory VRAM instead of system RAM (TensorFlow, 2021). Comparing the numerical values of with those of in igure 4 confirms that GPU energy consumption is approximately five times higher than CPU energy consumption across all experiments. After the initial data copying, the CPU and RAM enter an idle state, requiring less energy than the stable state and, hence, the negative average energy consumption.
We extend the evaluation of our proposed approach by investigating the relationship between energy consumption and execution time at the method-level granularity. To validate the linear relationship between energy consumption and mean execution time, we compute the Pearson correlation coefficient. The obtained correlation coefficients for GPU, CPU, and RAM are (p-value ), (p-value ), and (p-value ), respectively. These values indicate that execution time for GPU and CPU have a strong positive relationship with energy consumption, while RAM exhibits a strong negative relationship.
FECoM enables new insights into energy consumption patterns in real-world deep learning code. Consider as an example the TensorFlow program (FECoM, 2023h) for image classification as shown in listing 5; this program loads data, trains a model, evaluates it, and performs inference. Using FECoM, we can break down the total energy usage and attribute consumption to individual API’s. The data loading operation via fashion_mnist.load_data() is quite efficient, consuming only 1J. In contrast, model.fit() for training is identified as an energy hotspot, drawing significant power at 4400J. Evaluation and inference operations exhibit more moderate consumption of 29J and 3J.
Summing the method-level measurements, the TensorFlow API’s account for about 4500J energy. However, FECoM’s project-level view shows the overall program consumes 5990J. This additional 1490J can be ascribed to non-TensorFlow operations like file I/O and data pre-processing. By supporting fine-grained profiling, FECoM reveals patterns that arise from contributions of specific API calls versus other program activities. Developers can use these insights to target optimization efforts on costly operations like fit(). FECoM enables drilling down into energy consumption patterns within real dl code, empowering developers to write greener, more efficient AI applications.

4.2. RQ2. Effect of Input Data Size on Energy Consumption
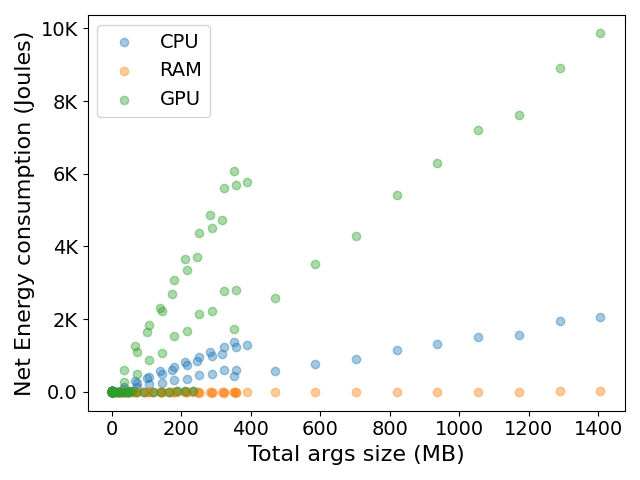
To answer RQ2, we executed API calls with varying input data sizes. The results are presented in Figure 7. The scatter plot illustrates the Net energy consumption in Joules against the total parameter size in megabytes (MB). The figure reveals a linear relationship between input data size and energy consumption for both the CPU and GPU, indicating that and are increasing linear functions for this API call. This confirms the hypothesis for RQ2. However, when considering RAM energy consumption as a function of input data size, instead of an increasing linear function, appears to remain constant.
To validate the linear relationship between energy consumption and input data size, we computed the Pearson correlation coefficient. The obtained correlation coefficients for GPU, CPU, and RAM are (p-value ), (p-value ), and (p-value ), respectively. These values indicate that input data size for GPU and CPU have a strong positive relationship with energy consumption, while RAM exhibits a low positive relationship. This means that as the data size increases, CPU and GPU energy consumption tend to increase as well. The extremely small p-values for CPU, and GPU signify the high statistical significance of these correlations. However, the low correlation exhibited by RAM is not statistically significant. The effect sizes, representing the magnitude of the Pearson correlation coefficients, are substantially large for the GPU and CPU, indicating a significant relationship between their energy consumption and input data size. As discussed in RQ1, the RAM plays a role in the execution at the beginning of the API call execution, where the data is copied to the installed GPU. However, after the data is copied the role of RAM gets over and, hence, we observe low energy consumption from the RAM for the rest of the execution.
4.3. RQ3. Key considerations in Fine-grained Energy Measurement
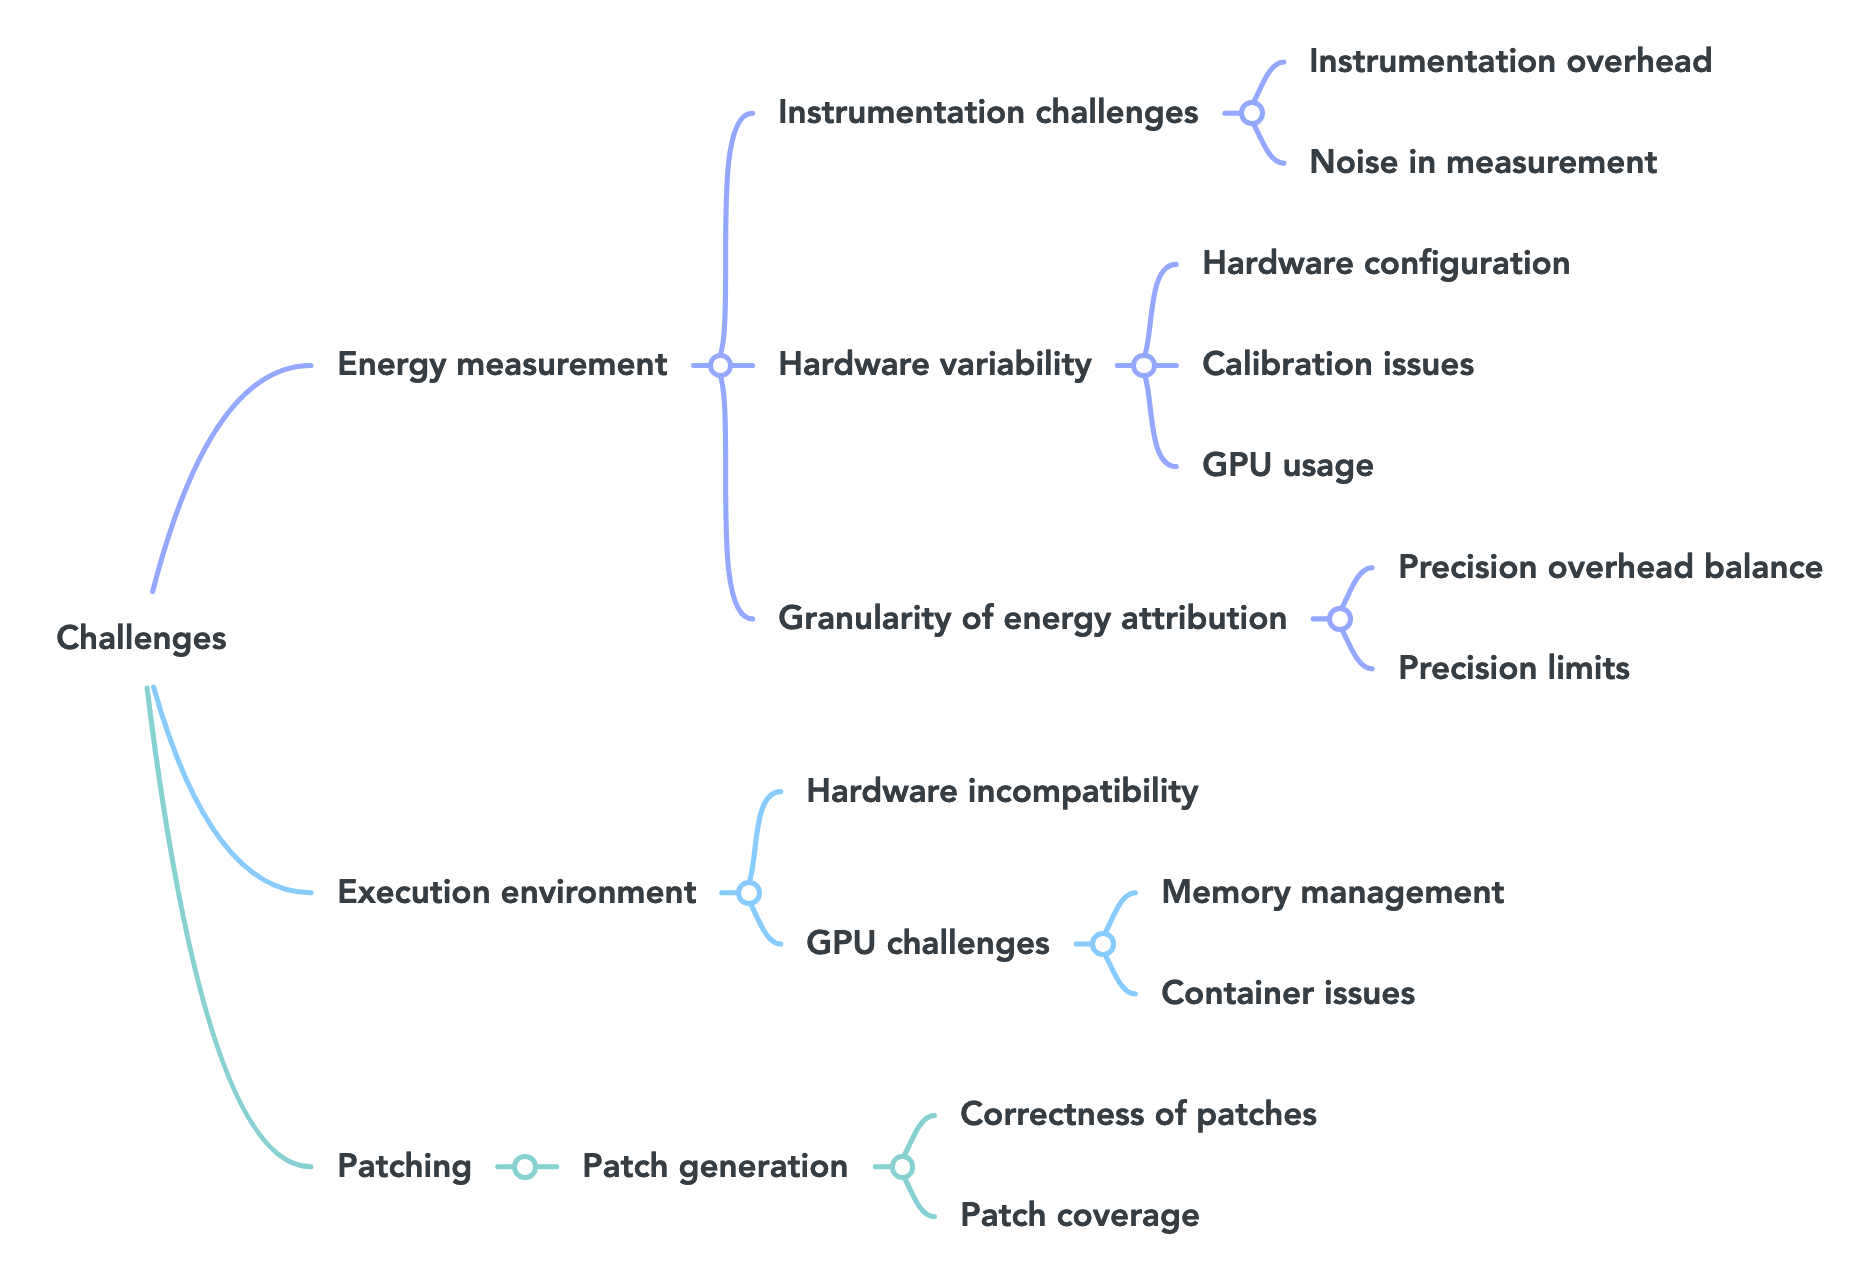
This research question aims to support developers and researchers working in this field by elaborating on the issues, considerations, and challenges one may encounter while developing a tool similar to FECoM. Figure 8 presents the issues and challenges (organized into categories/sub-categories) that we obtained by using an open coding process as discussed in the experiment design section 3.2.3. We provide an online appendix in the replication package, with comprehensive details about the design considerations and challenges faced while developing FECoM, along with supplementary material documenting error logs and issues used in the open coding process (FECoM, 2023b). These issues arose and were addressed inherently during FECoM’s design and development. Prior to conducting formal experiments, we tested and refined FECoM extensively by evaluating its functionality on a diverse set of projects. This rigorous verification was crucial for handling the complexities involved in fine-grained energy measurement. In the rest of the section, we elaborate on each challenge found by our analysis.
4.3.1. Energy measurement
Issues that hinder effective energy measurement belong to this category.
Instrumentation challenges: These challenges relate to the implementation of the energy measurement module.
-
•
Instrumentation overhead: Instrumented code has additional instructions that may account for overhead and therefore may impact the performance and energy consumption of the code.
Mitigation: We identify the following alternatives to address the challenge.-
–
Implement machine stability and temperature stability checks.
-
–
Adaptive sampling to dynamically adjust sampling frequency based on API execution time.
-
–
Lightweight instrumentation using binary analysis instead of source code changes.
-
–
-
•
Noise in measurement: Background processes running on the machine during energy measurement introduce noise and overheads, affecting the accuracy of measured energy.
Mitigation: To mitigate this issue, we suggest the following approaches.-
–
Ensure only necessary background processes are run during energy consumption experiments.
-
–
Measure the net energy consumption by subtracting the energy of the stable baseline from the total energy consumed during measurements.
-
–
Containerization or virtualization to isolate just the software being measured.
-
–
Concurrent measurement on replicate systems for noise cancellation.
-
–
Hardware variability: Issues introduced by the heterogeneity in hardware and configurations.
-
•
Hardware configuration: Different hardware configurations can lead to variations in energy consumption values for the same project.
Mitigation: To mitigate this issue, ensure all energy observations come from the same or replicated machine. -
•
Calibration issues: Energy measurement tools require calibration to account for hardware variations.
Mitigation: To mitigate this issue, implement calibration processes to calculate stable energy consumption, maximum allowed temperatures, and wait times specific to the used hardware configuration that can be reused. -
•
GPU usage: The selected subject systems must utilize GPU in an optimized manner. Failing to ensure this challenge may introduce incorrect and inconsistent energy data collection.
Mitigation: To mitigate this issue, we suggest the following approaches.-
–
Manual inspection and execution of the program to ensure that it is indeed functional and utilizes the GPU effectively.
-
–
Utilize monitoring tools like NVDashboard (NVIDIA, 2021) to monitor and visualize GPU metrics.
-
–
Granularity of energy attribution: Issues related to precision limit, and to the required balance between precision of energy consumption and associated overheads.
-
•
Precision limits: Existing software tools, due to Intel RAPL limitation, do not permit energy measurements at intervals smaller than 1ms.
Mitigation: To mitigate this issue, take hardware API support constraints into consideration while deciding the sampling rate of the profiling setup. -
•
Precision overhead balance: Observing energy consumption at a high frequency improves the precision of observed data; however, such high frequencies also introduce computation overhead that may introduce noise.
Mitigation: Depending on the application context, balance the observation frequency and associated overhead. For instance, In our context, we measure TensorFlow APIs that tend to run a significantly long time (minutes or, sometimes, even hours); therefore, we choose ms as the observation frequency.
4.3.2. Patching
Issues related to source code instrumentation.
Patch generation: This category summarizes the issues and considerations related to patch generation.
-
•
Correctness of patches: Each identified patch location (in our case, each TensorFlow API) must be correctly patched to record the correct energy consumption of the API and not introduce new syntactic or semantic issues.
Mitigation: Ensure the correctness of the generated patches using manual validation and automated tests. -
•
Patch coverage: Each patch location must be identified correctly to avoid missing code that is supposed to be patched and measured.
Mitigation: Ensure the coverage of instrumentation technique by performing manual validation on the patched scripts.
4.3.3. Execution environment
Environment-related issues that may hinder effective energy measurement.
Hardware incompatibility:
Compatibility issues arise when using framework versions (e.g., TensorFlow) that are not compatible with the machine’s hardware or software dependencies.
Mitigation:
To mitigate the issue, focus only on subject systems that use the target framework e.g., TensorFlow-2.
Ensure that the required software dependencies are installed on the machine and verify the error logs to confirm that a program execution completes without any error in the logs.
GPU challenges: Issues related to effective use of GPU fall in this category.
-
•
Memory management: CUDA memory allocation errors may arise when a process cannot allocate sufficient memory during data processing on a GPU.
Mitigation: Optimizing memory usage by managing the batch size of the training dataset and by choosing appropriate hyper-parameters can mitigate this issue. -
•
Container issues: Incompatibility of Docker containers with specific GPUs and TensorFlow versions may hinder the replication of a project.
Mitigation: To mitigate this issue, ensure that the NVIDIA drivers and Container Toolkit (NVIDIA, 2023a) are set up on the host system. Select a suitable base image from nvidia/cuda tags (Dockerhub, 2023), and when starting containers, use the ”–gpus” flag to ensure correct detection of GPUs.
5. Threats to Validity
Internal validity:
Confounds and noise. Several factors could affect a method’s energy measurement through confounding. On the machine, multiple processes, including typical operating system processes, run in the background—scripts and tools for energy measurement, temperature checks, and stable state checks. All of these processes induce overheads that can skew energy consumption measurements. We employ several mitigation measures. Firstly, temperature checks are disabled before running the stable checks, and stable checks are disabled during method execution. This keeps the number of processes running during execution at a minimum. Secondly, we measure stable state energy consumption without any compute load on the machine and subtract it from the gross energy consumption to get net energy consumption.
Measurement precision. Choosing an appropriate sampling interval for measuring energy at regular intervals is an important design decision. We use a sampling interval of 500 ms. Though considering a smaller sampling interval would have given us more observations for each experiment, it also increases the overheads and noises that may lead to incorrect energy consumption values. Given that our target methods are framework APIs that typically last for minutes, if not hours, we chose a relatively low sampling interval.
Construct validity: Construct validity concerns the accuracy of the measurements and inferences using those measurements. To ensure accurate energy measurement, the Patcher instruments the code. The instrumentation, coupled with stability checks, ensures that the measured energy consumption is indeed consumed by the API under measurement. We validated not only the Patcher using automated and manual validation, but also the measured energy consumption at the API granularity.
External validity: External validity deals with the generalizability of the observed results. Given that the energy consumption is highly dependent on hardware, it may pose a threat to validity. However, to mitigate this issue, we measure gross and net energy consumption (by reducing the gross energy consumption with stable state energy consumption).
6. Related Work
Measuring energy consumption of software systems. A significant number of studies (Sahin et al., 2014; Manotas et al., 2014; Hao et al., 2012; Sahin et al., 2012) uses physical power meters, such as the Monsoon high voltage power monitor (Inc., [n. d.]), to measure a system’s energy consumption. These devices physically measure the electrical power consumed by a given software system. The key benefits of using a hardware power meter are its accuracy and precision. Another way to measure energy consumption is to use software tools (Šimunić et al., 1999; Simunic et al., 2000; Brooks et al., 2000; Gurumurthi et al., 2002). Recent Intel and amd processors provide the Running Average Power Limit (rapl) interface (Weaver, [n. d.]), which can measure the power consumption of a processor at regular intervals through built-in performance counters. rapl can measure the power consumption up to intervals of approximately 1 ms, translating to a sampling frequency of 1 kHz (Intel, 2020). Many tools have been built on top of rapl, such as the Intel Power Gadget (it has been discontinued from usage) (Intel, 2019), PowerTOP (van de Ven, [n. d.]) and Perf (manual page, 2023). Power modeling is another method that is used to obtain insights into the energy consumption of software systems (Hao et al., 2012). Power modeling techniques estimate energy consumption by considering factors such as the energy characteristics of the hardware and run-time information. However, power modeling techniques’ full potential has yet to be unlocked.
| Approach | Granularity | Sampling Rate | Languages | Architecture | DL Frameworks | Power stability | Temperature stability | Automated |
|---|---|---|---|---|---|---|---|---|
| CodeCarbon (Carbon, 2023) | Program/Function | 15s | Python | CPU(Deprecated), GPU and RAM | ||||
| FPowerTool (Wei et al., 2019) | Function | 1ms | Fortran/C/C++ | CPU | ||||
| JavaIO (Ournani et al., 2021) | System | 1ms | Java | CPU | ||||
| Perf (manual page, 2023) | System | 1ms | n/a | CPU | ||||
| PowerTOP (van de Ven, [n. d.]) | System | 20s | n/a | CPU and GPU | ||||
| Experiment Impact Tracker (Henderson et al., 2020a) | Program/Function | 1s | Python | CPU and GPU | ✓ | |||
| FECoM | API/Program | 500ms | Python | CPU, GPU and RAM | ✓ | ✓ | ✓ | ✓ |
Optimizing energy consumption of ML tasks. Previous studies (Georgiou et al., 2022; Zhang et al., 2018; Anthony et al., 2020; Henderson et al., 2020b) have investigated the energy consumption of different dl models. Algorithmic optimization is a major approach that contributes to reducing the energy consumption of dl models. These optimizations often take place in model pruning, which refers to removing unnecessary connections within a neural network (Han et al., 2016; Yang et al., 2017). and quantization, which reduces the precision of the weights and activations within a neural network by making them quantized and reducing the memory required for a given model. For instance, Han et al. (Han et al., 2016) found that the energy consumption of deep neural networks can be reduced by using a combined technique consisting of model pruning, weight quantization, and Huffman coding. This approach can reduce the size and computational complexity of the deep learning models without significant degradation to their performance.
Measuring energy consumption at different granularities. Available hardware and software tools measure energy consumption at the system level. To improve the granularity of analysis and recommendations, researchers have attempted to measure the energy consumption at a more fine-grained level, such as at the process level (Linares-Vásquez et al., 2014; Ournani et al., 2021) at best. Bree et al. (Bree and Cinnéide, 2022) attempted method replacement for measuring the energy consumed by the visitor pattern; however, their approach is unsuitable for measuring any given method’s energy consumption due to the lack of a generalizable solution. FPowerTool (Wei et al., 2019) operates at a coarser granularity of function blocks for programming languages written in C, C++, and Fortran in non-dl programs. However, its biggest drawback is that it uses a dynamic instrumentation technique that involves injecting tracing code during the runtime, which would lead to noisy and inaccurate energy measurement data at finer granularities such as API level. Similarly, CodeCarbon (Carbon, 2023) and Experiment Impact Tracker (Henderson et al., 2020a) are open-source software tools designed to monitor and reduce the co2 emissions associated with computing processes, particularly those involved in dl applications. These tools integrate themselves into Python codebases and enable the tracking of emissions based on power consumption and location-dependent carbon intensity. While CodeCarbon and Experiment Impact Tracker can measure power consumption, and hence co2 emissions at a function-level granularity through the use of decorators, they have a few drawbacks. Firstly, the process of modifying source code to measure the power consumption for desired methods is manual in nature. For instance, if users of CodeCarbon wish to measure the power consumption of TensorFlow API calls, they have to insert the addition lines-of-code calling the CodeCarbon tool themselves, manually for each TensorFlow API instance. Secondly, and more importantly, it overlooks the overheads introduced by background processes and temperature fluctuations while having a sampling rate of seconds, leading to significant noise in the measured energy consumption. Therefore, to the best of our knowledge, the literature does not offer any approach that measures energy consumption at the method level for dl frameworks.
Gaps in existing research. The existing literature as shown in Table 2 has two critical limitations. First, existing approaches can measure energy consumption at only the system level due to support offered by hardware and operating system vendors. There have been efforts to measure energy consumption at the finer granularity (such as at the function level); however, as discussed, they lack various requirements like low sampling rate, stability check, support for dl framework and languages like TensorFlow and python, as well as support for CPU, GPU and RAM architectures. Second, current approaches require manually instrumenting the code to measure energy consumption. For a software engineer to improve the energy efficiency of a given code conveniently and efficiently, the engineer must have access to an approach that can automate the energy measurement process to work at the fine-grained level so that the engineer can take corrective actions, if needed, early. Our proposed approach addresses the gap by providing an automated and generic mechanism to measure energy consumption at the method granularity.
7. Implications
7.1. Implications for Researchers
Researchers in the field can build upon the foundation of FECoM to develop hybrid measurement approaches, especially using the findings from RQ3. Researchers can conduct empirical studies to gain insights into energy consumption patterns, revealing relationships between model architecture, hyperparameters, and energy efficiency, contributing to the development of more energy-efficient dl models and algorithms. Researchers could leverage FECoM to construct detailed energy profiles of DL models, illuminating optimization opportunities. For example, in RQ2, we showed how FECoM can be used to gain insights into the relationship between energy consumption and input data size. These insights are steps towards enriching API documentation of dl frameworks. Through extensions and new experiments with FECoM, researchers can gain a deeper understanding of energy dynamics in DL systems.
7.2. Implications for Developers
DL developers can utilize FECoM’s capabilities to measure and optimize energy consumption at the granularity of framework APIs. Developers can pinpoint energy hotspots in their code down to the API call level by incorporating FECoM into their development workflows. For example, in RQ1, we observed that for the Autoencoder project (FECoM, 2023g), the same type of API call “Model.fit” consumed varying amounts of energy ( J, J, J) based on the context of the call. This fine-grained profiling allows developers to make informed optimizations like substituting inefficient APIs, streamlining data pipelines, and adopting energy-aware coding practices. FECoM ultimately enables developers to build greener, leaner DL applications by illuminating energy consumption patterns. Its ease of use and integration with popular frameworks like TensorFlow can encourage energy awareness among the wider DL developer community.
7.3. Implications for Educators
As DL courses expand, educators can utilize FECoM to instill energy-conscious development habits among students early on. By exposing students to tools like FECoM and its fine-grained profiling, educators highlight the significant energy demands of DL and the need for efficiency. Educators can prepare the next generation of DL developers to prioritize energy efficiency and build more sustainable AI systems by integrating FECoM in class projects and assignments to measure and optimize model energy consumption, providing hands-on experience with Green AI principles.
8. Conclusions and Future work
In this work, we focused on the critical aspect of energy consumption in deep learning and introduced FECoM, a fine-grained energy measurement framework. FECoM uses static instrumentation to segregate the execution of an API and to ensure machine’s stability. Our experiments and evaluation have shown that the proposed framework measures consumed energy at the API granularity. Our empirical analysis investigating the influence of input parameter data size and execution time on energy consumption reveals that an API’s energy consumption shows a linear relationship with input data size. Furthermore, we consolidated and categorized various considerations, challenges, and issues we faced throughout the design and development of the framework. Addressing these challenges will guide future efforts in creating fine-grained energy measurement tools. In the future, we would like to use the proposed framework to extend our empirical analysis to investigate additional aspects related to the energy profile of dl framework APIs. Exploring the role of hyper-parameters and data quality on fine-grained energy consumption will further enhance energy profiling capabilities. Additionally, we plan to extend the application of FECoM to other popular dlframeworks like PyTorch for a comprehensive analysis of energy-efficient models.
9. Acknowledgement
Saurabhsingh Rajput and Tushar Sharma are supported by the Natural Sciences and Engineering Research Council of Canada (NSERC) through grant NSERC Discovery RGPIN/04903. Maria Kechagia and Federica Sarro are supported by the European Research Council under grant no. 741278 (EPIC).
References
- (1)
- Abou-Of et al. (2016) Mona A Abou-Of, Ahmed H Taha, and Amr A Sedky. 2016. Trade-off between low power and energy efficiency in benchmarking. In 2016 7th International Conference on Information and Communication Systems (ICICS). IEEE, 322–326.
- Amodei and Hernandez (2018) Dario Amodei and Danny Hernandez. 2018. Ai and Compute. https://openai.com/blog/ai-and-compute/
- Anthony et al. (2020) Lasse F Wolff Anthony, Benjamin Kanding, and Raghavendra Selvan. 2020. Carbontracker: Tracking and predicting the carbon footprint of training deep learning models. arXiv preprint arXiv:2007.03051 (2020).
- Bannour et al. (2021) Nesrine Bannour, Sahar Ghannay, Aurélie Névéol, and Anne-Laure Ligozat. 2021. Evaluating the carbon footprint of NLP methods: a survey and analysis of existing tools. In Proceedings of the Second Workshop on Simple and Efficient Natural Language Processing. 11–21.
- Bote-Curiel et al. (2019) Luis Bote-Curiel, Sergio Muñoz-Romero, Alicia Gerrero-Curieses, and José Luis Rojo-Álvarez. 2019. Deep learning and big data in healthcare: a double review for critical beginners. Applied Sciences 9, 11 (2019), 2331.
- Bree and Cinnéide (2022) Déaglán Connolly Bree and Mel Ó Cinnéide. 2022. The Energy Cost of the Visitor Pattern. In 2022 IEEE International Conference on Software Maintenance and Evolution (ICSME). IEEE, 317–328.
- Brooks et al. (2000) David Brooks, Vivek Tiwari, and Margaret Martonosi. 2000. Wattch: A framework for architectural-level power analysis and optimizations. ACM SIGARCH Computer Architecture News 28, 2 (2000), 83–94.
- Cai et al. (2017) Ermao Cai, Da-Cheng Juan, Dimitrios Stamoulis, and Diana Marculescu. 2017. Neuralpower: Predict and deploy energy-efficient convolutional neural networks. In Asian Conference on Machine Learning. PMLR, 622–637.
- Canonical (2018) Canonical. 2018. Ubuntu Manpage: powerstat - a tool to measure power consumption. https://manpages.ubuntu.com/manpages/bionic/man8/powerstat.8.html.
- Carbon (2023) Code Carbon. 2023. Code Carbon. https://github.com/mlco2/codecarbon
- Corral et al. (2014) Luis Corral, Anton B. Georgiev, Alberto Sillitti, and Giancarlo Succi. 2014. Can Execution Time Describe Accurately the Energy Consumption of Mobile Apps? An Experiment in Android. In Proceedings of the 3rd International Workshop on Green and Sustainable Software (Hyderabad, India) (GREENS 2014). Association for Computing Machinery, New York, NY, USA, 31–37. https://doi.org/10.1145/2593743.2593748
- Cruz (2021) Luís Cruz. 2021. Tools to Measure Software Energy Consumption from your Computer. http://luiscruz.github.io/2021/07/20/measuring-energy.html. https://doi.org/10.6084/m9.figshare.19145549.v1 Blog post..
- Dally et al. (2021) William J. Dally, Stephen W. Keckler, and David B. Kirk. 2021. Evolution of the Graphics Processing Unit (GPU). IEEE Micro 41, 6 (2021), 42–51. https://doi.org/10.1109/MM.2021.3113475
- Desrochers et al. (2016) Spencer Desrochers, Chad Paradis, and Vincent M Weaver. 2016. A validation of DRAM RAPL power measurements. In Proceedings of the Second International Symposium on Memory Systems. 455–470.
- Developer (2022) NVIDIA Developer. 2022. Nvidia System Management Interface. https://developer.nvidia.com/nvidia-system-management-interface
- Dockerhub (2023) Dockerhub. 2023. Docker Cuda Image. https://hub.docker.com/r/nvidia/cuda
- FECoM (2023a) FECoM. 2023a. FECoM: A Framework to Measure Energy Consumption of TensorFlow APIs. https://github.com/SOLAR-group/FECoM/blob/main/README.md
- FECoM (2023b) FECoM. 2023b. FECoM Challenges. https://github.com/SOLAR-group/FECoM/blob/main/replication/documents/README.md
- FECoM (2023c) FECoM. 2023c. FECoM Dataset. https://github.com/SOLAR-group/FECoM/blob/main/data/README.md
- FECoM (2023d) FECoM. 2023d. FECoM Measurement. https://github.com/SOLAR-group/FECoM/blob/main/fecom/measurement/README.md
- FECoM (2023e) FECoM. 2023e. FECoM Patcher. https://github.com/SOLAR-group/FECoM/blob/main/fecom/patching/README.md
- FECoM (2023f) FECoM. 2023f. FECoM Validation. https://github.com/SOLAR-group/FECoM/blob/main/replication/validation/README.md
- FECoM (2023g) FECoM. 2023g. Tensorflow Tutorial Autoencoder. https://github.com/tensorflow/docs/blob/master/site/en/tutorials/generative/autoencoder.ipynb
- FECoM (2023h) FECoM. 2023h. Tensorflow Tutorial Classification. https://github.com/tensorflow/docs/blob/master/site/en/tutorials/keras/classification.ipynb
- Fonseca et al. (2019) Alcides Fonseca, Rick Kazman, and Patricia Lago. 2019. A Manifesto for Energy-Aware Software. IEEE Software 36, 6 (2019), 79–82.
- García-Martín et al. (2019) Eva García-Martín, Crefeda Faviola Rodrigues, Graham Riley, and Håkan Grahn. 2019. Estimation of energy consumption in machine learning. J. Parallel and Distrib. Comput. 134 (2019), 75–88.
- Georgiou et al. (2018) Stefanos Georgiou, Maria Kechagia, Panos Louridas, and Diomidis Spinellis. 2018. What Are Your Programming Language’s Energy-Delay Implications?. In Proceedings of the 15th International Conference on Mining Software Repositories (Gothenburg, Sweden) (MSR ’18). Association for Computing Machinery, New York, NY, USA, 303–313. https://doi.org/10.1145/3196398.3196414
- Georgiou et al. (2022) Stefanos Georgiou, Maria Kechagia, Tushar Sharma, Federica Sarro, and Ying Zou. 2022. Green AI: Do Deep Learning Frameworks Have Different Costs?. In Proceedings of the 44th International Conference on Software Engineering (Pittsburgh, Pennsylvania) (ICSE ’22). Association for Computing Machinery, New York, NY, USA, 1082–1094. https://doi.org/10.1145/3510003.3510221
- Gurumurthi et al. (2002) Sudhanva Gurumurthi, Anand Sivasubramaniam, Mary Jane Irwin, Narayanan Vijaykrishnan, and Mahmut Kandemir. 2002. Using complete machine simulation for software power estimation: The softwatt approach. In Proceedings Eighth International Symposium on High Performance Computer Architecture. IEEE, 141–150.
- Hähnel et al. (2012) Marcus Hähnel, Björn Döbel, Marcus Völp, and Hermann Härtig. 2012. Measuring Energy Consumption for Short Code Paths Using RAPL. SIGMETRICS Perform. Eval. Rev. 40, 3 (jan 2012), 13–17. https://doi.org/10.1145/2425248.2425252
- Han et al. (2016) Song Han, Huizi Mao, and William J. Dally. 2016. Deep Compression: Compressing Deep Neural Network with Pruning, Trained Quantization and Huffman Coding. In 4th International Conference on Learning Representations, ICLR 2016, San Juan, Puerto Rico, May 2-4, 2016, Conference Track Proceedings, Yoshua Bengio and Yann LeCun (Eds.). http://arxiv.org/abs/1510.00149
- Hao et al. (2012) Shuai Hao, Ding Li, William GJ Halfond, and Ramesh Govindan. 2012. Estimating Android applications’ CPU energy usage via bytecode profiling. In 2012 First international workshop on green and sustainable software (GREENS). IEEE, 1–7.
- Haydari and Yılmaz (2020) Ammar Haydari and Yasin Yılmaz. 2020. Deep reinforcement learning for intelligent transportation systems: A survey. IEEE Transactions on Intelligent Transportation Systems 23, 1 (2020), 11–32.
- Henderson et al. (2020a) Peter Henderson, Jieru Hu, Joshua Romoff, Emma Brunskill, Dan Jurafsky, and Joelle Pineau. 2020a. Towards the Systematic Reporting of the Energy and Carbon Footprints of Machine Learning. arXiv:2002.05651 [cs.CY]
- Henderson et al. (2020b) Peter Henderson, Jieru Hu, Joshua Romoff, Emma Brunskill, Dan Jurafsky, and Joelle Pineau. 2020b. Towards the systematic reporting of the energy and carbon footprints of machine learning. Journal of Machine Learning Research 21, 248 (2020), 1–43.
- Inc. ([n. d.]) Monsoon Solutions Inc. [n. d.]. High Voltage Power Monitor. https://www.msoon.com/online-store/High-Voltage-Power-Monitor-p90002590
- Intel (2019) Intel. 2019. Intel® Power Gadget. https://www.intel.com/content/www/us/en/developer/articles/tool/power-gadget.html
- Intel (2020) Intel. 2020. Running Average Power Limit Energy Reporting / CVE-2020-8694 , CVE-2020-8695 / INTEL-SA-00389. https://www.intel.com/content/www/us/en/developer/articles/technical/software-security-guidance/advisory-guidance/running-average-power-limit-energy-reporting.html
- Intel (2023) Intel. 2023. Intel Xeon Gold Processor. https://www.intel.com/content/www/us/en/products/sku/215272/intel-xeon-gold-5317-processor-18m-cache-3-00-ghz/specifications.html
- Jurj et al. (2020) Sorin Liviu Jurj, Flavius Opritoiu, and Mircea Vladutiu. 2020. Environmentally-friendly metrics for evaluating the performance of deep learning models and systems. In Neural Information Processing: 27th International Conference, ICONIP 2020, Bangkok, Thailand, November 23–27, 2020, Proceedings, Part III 27. Springer, 232–244.
- Khan et al. (2018) Kashif Nizam Khan, Mikael Hirki, Tapio Niemi, Jukka K. Nurminen, and Zhonghong Ou. 2018. RAPL in Action: Experiences in Using RAPL for Power Measurements. ACM Trans. Model. Perform. Eval. Comput. Syst. 3, 2, Article 9 (mar 2018), 26 pages. https://doi.org/10.1145/3177754
- Khandkar (2009) Shahedul Huq Khandkar. 2009. Open coding. University of Calgary 23, 2009 (2009).
- Labbe (2021) Mark Labbe. 2021. Energy consumption of AI poses environmental problems. https://www.techtarget.com/searchenterpriseai/feature/Energy-consumption-of-AI-poses-environmental-problems
- Linares-Vásquez et al. (2014) Mario Linares-Vásquez, Gabriele Bavota, Carlos Bernal-Cárdenas, Rocco Oliveto, Massimiliano Di Penta, and Denys Poshyvanyk. 2014. Mining Energy-Greedy API Usage Patterns in Android Apps: An Empirical Study. In Proceedings of the 11th Working Conference on Mining Software Repositories (Hyderabad, India) (MSR 2014). Association for Computing Machinery, New York, NY, USA, 2–11. https://doi.org/10.1145/2597073.2597085
- Lm-Sensors (2023) Lm-Sensors. 2023. LM-Sensors GitHub Repository. https://github.com/lm-sensors/lm-sensors
- Manotas et al. (2014) Irene Manotas, Lori Pollock, and James Clause. 2014. Seeds: A software engineer’s energy-optimization decision support framework. In Proceedings of the 36th International Conference on Software Engineering. 503–514.
- manual page (2023) Linux manual page. 2023. perf-stat— Linux manual page. https://man7.org/linux/man-pages/man1/perf-stat.1.html.
- McIntosh et al. (2019) Andrea McIntosh, Safwat Hassan, and Abram Hindle. 2019. What can Android mobile app developers do about the energy consumption of machine learning? Empirical Software Engineering 24, 2 (April 2019), 562–601. https://doi.org/10.1007/s10664-018-9629-2
- Mehbodniya et al. (2021) Abolfazl Mehbodniya, Izhar Alam, Sagar Pande, Rahul Neware, Kantilal Pitambar Rane, Mohammad Shabaz, and Mangena Venu Madhavan. 2021. Financial fraud detection in healthcare using machine learning and deep learning techniques. Security and Communication Networks 2021 (2021), 1–8.
- Microsoft (2023) Microsoft. 2023. Pylance Language Server. https://github.com/microsoft/pylance-release
- Nafea (2018) Ibtehal Talal Nafea. 2018. Machine learning in educational technology. Machine learning-advanced techniques and emerging applications (2018), 175–183.
- Nayyar et al. (2021) Anand Nayyar, Lata Gadhavi, and Noor Zaman. 2021. Machine learning in healthcare: review, opportunities and challenges. Machine Learning and the Internet of Medical Things in Healthcare (2021), 23–45.
- NVIDIA (2021) NVIDIA. 2021. GPU Dashboards in Jupyter Lab. https://github.com/rapidsai/jupyterlab-nvdashboard.
- NVIDIA (2023a) NVIDIA. 2023a. NVIDIA CONTAINER TOOLKIT. https://docs.nvidia.com/datacenter/cloud-native/container-toolkit/latest/install-guide.html
- NVIDIA (2023b) NVIDIA. 2023b. Nvidia Geforce RTX 3070. https://www.nvidia.com/en-us/geforce/graphics-cards/30-series/rtx-3070-3070ti/
- Ournani et al. (2021) Zakaria Ournani, Romain Rouvoy, Pierre Rust, and Joel Penhoat. 2021. Evaluating The Energy Consumption of Java I/O APIs. In 2021 IEEE International Conference on Software Maintenance and Evolution (ICSME). 1–11. https://doi.org/10.1109/ICSME52107.2021.00007
- Ozbayoglu et al. (2020) Ahmet Murat Ozbayoglu, Mehmet Ugur Gudelek, and Omer Berat Sezer. 2020. Deep learning for financial applications: A survey. Applied Soft Computing 93 (2020), 106384.
- Panesar (2019) Arjun Panesar. 2019. Machine learning and AI for healthcare. Springer.
- Perrotta and Selwyn (2020) Carlo Perrotta and Neil Selwyn. 2020. Deep learning goes to school: Toward a relational understanding of AI in education. Learning, Media and Technology 45, 3 (2020), 251–269.
- Price et al. (2016) Danny C Price, Michael A Clark, Benjamin R Barsdell, Ronald Babich, and Lincoln J Greenhill. 2016. Optimizing performance-per-watt on GPUs in high performance computing: Temperature, frequency and voltage effects. Computer Science-Research and Development 31, 4 (2016), 185–193.
- Reaño et al. (2015) Carlos Reaño, Federico Silla, Gilad Shainer, and Scot Schultz. 2015. Local and Remote GPUs Perform Similar with EDR 100G InfiniBand. In Proceedings of the Industrial Track of the 16th International Middleware Conference (Vancouver, BC, Canada) (Middleware Industry ’15). Association for Computing Machinery, New York, NY, USA, Article 4, 7 pages. https://doi.org/10.1145/2830013.2830015
- Research (2023) Princeton Research. 2023. GPU Computing. https://researchcomputing.princeton.edu/support/knowledge-base/gpu-computing
- Sahin et al. (2012) Cagri Sahin, Furkan Cayci, James Clause, Fouad Kiamilev, Lori Pollock, and Kristina Winbladh. 2012. Towards power reduction through improved software design. In 2012 IEEE Energytech. IEEE, 1–6.
- Sahin et al. (2014) Cagri Sahin, Lori Pollock, and James Clause. 2014. How do code refactorings affect energy usage?. In Proceedings of the 8th ACM/IEEE International Symposium on Empirical Software Engineering and Measurement. 1–10.
- Sarro (2023) Federica Sarro. 2023. Search-Based Software Engineering in the Era of Modern Software Systems. In Procs. of the 31st IEEE RE. IEEE.
- Scipy (2023) Scipy. 2023. scipy.stats.wilcoxon — SciPy v1.11.1 Manual. https://docs.scipy.org/doc/scipy/reference/generated/scipy.stats.wilcoxon.html
- Shanbhag and Chimalakonda (2022) Shriram Shanbhag and Sridhar Chimalakonda. 2022. On the Energy Consumption of Different Dataframe Processing Libraries – An Exploratory Study. https://doi.org/10.48550/ARXIV.2209.05258
- Shapiro and Wilk (1965) S. S. Shapiro and M. B. Wilk. 1965. An Analysis of Variance Test for Normality (Complete Samples). Biometrika 52, 3/4 (1965), 591–611. http://www.jstor.org/stable/2333709
- Shoeybi et al. (2019) Mohammad Shoeybi, Mostofa Patwary, Raul Puri, Patrick LeGresley, Jared Casper, and Bryan Catanzaro. 2019. Megatron-LM: Training Multi-Billion Parameter Language Models Using Model Parallelism. https://doi.org/10.48550/ARXIV.1909.08053
- Šimunić et al. (1999) Tajana Šimunić, Luca Benini, and Giovanni De Micheli. 1999. Cycle-accurate simulation of energy consumption in embedded systems. In Proceedings of the 36th annual ACM/IEEE Design Automation Conference. 867–872.
- Simunic et al. (2000) Tajana Simunic, Luca Benini, Giovanni De Micheli, and Mat Hans. 2000. Source code optimization and profiling of energy consumption in embedded systems. In Proceedings 13th International Symposium on System Synthesis. IEEE, 193–198.
- Sipser (2010) Michael Sipser. 2010. Introduction to the theory of computation (2. ed., internat. ed., [nachdr.] ed.). Course Technology, Boston.
- Suchanek et al. (2018) Marek Suchanek, Milan Navratil, Don Domingo, and Laura Bailey. 2018. 4.4. CPU frequency governors Red Hat enterprise linux 6. https://access.redhat.com/documentation/en-us/red_hat_enterprise_linux/6/html/performance_tuning_guide/s-cpu-cpufreq
- TensorFlow (2021) TensorFlow. 2021. GPU Memory Growth. https://www.tensorflow.org/guide/gpu#limiting_gpu_memory_growth
- Tensorflow (2023) Tensorflow. 2023. Docs/site/en/tutorials at master · tensorflow/docs. https://github.com/tensorflow/docs/tree/master/site/en/tutorials
- van de Ven ([n. d.]) Arjan van de Ven. [n. d.]. The Linux PowerTOP Tool. https://github.com/fenrus75/powertop
- Verdecchia et al. (2023) Roberto Verdecchia, June Sallou, and Luís Cruz. 2023. A systematic review of Green AI. Wiley Interdisciplinary Reviews: Data Mining and Knowledge Discovery (2023), e1507.
- Veres and Moussa (2019) Matthew Veres and Medhat Moussa. 2019. Deep learning for intelligent transportation systems: A survey of emerging trends. IEEE Transactions on Intelligent transportation systems 21, 8 (2019), 3152–3168.
- Vijayalakshmi and Venkatachalapathy (2019) V Vijayalakshmi and K Venkatachalapathy. 2019. Comparison of predicting student’s performance using machine learning algorithms. International Journal of Intelligent Systems and Applications 11, 12 (2019), 34.
- Wang et al. (2020) Shangwen Wang, Ming Wen, Bo Lin, Hongjun Wu, Yihao Qin, Deqing Zou, Xiaoguang Mao, and Hai Jin. 2020. Automated patch correctness assessment: How far are we?. In Proceedings of the 35th IEEE/ACM International Conference on Automated Software Engineering. 968–980.
- Wang et al. (2019) Yuan Wang, Dongxiang Zhang, Ying Liu, Bo Dai, and Loo Hay Lee. 2019. Enhancing transportation systems via deep learning: A survey. Transportation research part C: emerging technologies 99 (2019), 144–163.
- Weaver ([n. d.]) Vince Weaver. [n. d.]. Linux support for Power Measurement Interfaces. https://web.eece.maine.edu/~vweaver/projects/rapl/rapl_support.html
- Wei et al. (2019) Guang Wei, Depei Qian, Hailong Yang, Zhongzhi Luan, and Lin Wang. 2019. FPowerTool: A Function-Level Power Profiling Tool. IEEE Access 7 (2019), 185710–185719. https://doi.org/10.1109/ACCESS.2019.2961507
- Wilcoxon (1992) Frank Wilcoxon. 1992. Individual comparisons by ranking methods. In Breakthroughs in Statistics: Methodology and Distribution. Springer, 196–202.
- Yang et al. (2017) Tien-Ju Yang, Yu-Hsin Chen, and Vivienne Sze. 2017. Designing Energy-Efficient Convolutional Neural Networks Using Energy-Aware Pruning. In Proceedings of the IEEE Conference on Computer Vision and Pattern Recognition (CVPR).
- Zhang et al. (2018) Xingzhou Zhang, Yifan Wang, and Weisong Shi. 2018. pCAMP: Performance Comparison of Machine Learning Packages on the Edges. In USENIX workshop on hot topics in edge computing (HotEdge 18).