1]organization=Department of Physics, Indian Institute of Technology Ropar, Rupnagar - 140 001, Punjab, India
[orcid=0000-0003-3813-4322] \cortext[1]Pushpendra P. Singh
Spectroscopic performance evaluation and modeling of a low background HPGe detector using GEANT4
Abstract
Low background gamma spectrometry employing HPGe detectors is a sensitive technique for measuring low-level radioactivity in environmental applications, material screening, and for rare decay searches. This work presents spectroscopic performance evaluation and modelling of a low background measurement setup developed at IIT Ropar in Punjab, India, to measure trace natural radioactive elements, with a particular interest in studying low-level radioactivity in soil and/or rock samples to generate specific inputs for low background experiments. The performance test and characterization of a low background cryocooled HPGe detector with relative efficiency of 33% have been carried out. An effective detector model has been developed using GEANT4 Monte Carlo simulation to determine the response of the detector over an energy range of 80.9–1408 keV and compared with the experimental performance of the detector. The response of the detector obtained using Monte Carlo simulations agrees reasonably well within 93% level of confidence, indicating only 7% deviation in the comparison. The present setup offers improved detection limits of primordial radionuclides (U/Th and K) to measure radioactive contamination in environmental matrices, which has been used elsewhere [1].
keywords:
Carbon loaded HPGe detector, \sepDetector scanning, and characterization, \sepGEANT4, \sepMonte Carlo simulation, \sepGamma-ray spectroscopy, \sepLow background measurements \sepEnvironmental radioactivity, \sepSoil sample analysis1 Introduction
Gamma spectroscopy setups employing low background HPGe spectrometers play an increasingly important role in measurements of environmental radioactivity and material selection for rare event experiments [2, 3, 4, 5, 6, 7, 8]. The experimental sensitivity of these low background measurements depends critically on the identification and minimization of confounding background. In above-ground measurements, the background is mainly dominated by cosmic rays and cosmic ray-induced interactions, cosmogenic radionuclides (T1/2 d–y), primordial radioactivity consisting of gamma-ray radiation from natural decay chains of 238U, 232Th and 40K (T1/2 – y) in and around the detector setup material, airborne radioactivity of radon and its progeny and the detector itself is the source of , , and neutrons background [7]. The environmental radioactivity originating from naturally occurring radionuclides, namely; 238U, 232Th, and 40K are long-lived ( - y) and present in trace amounts in the earth crust. The gamma-ray background from these naturally occurring radionuclides is a significant source of radiation exposure for above-ground laboratories. Measurement at the environmental level deals with low radioactivity concentration and involves inherent complexity due to the typical interference of natural radionuclides over a wide energy range. Additionally, the gamma-ray flux is subject to variation, possibly due to experiment location in the laboratory/site, seasonal fluctuations, the radon concentration near the experimental setup, or unknown systematic uncertainties. Background statistical fluctuations can influence the assessment of peak identification, peak area calculations, energy resolution, confined intervals, and detection limits. These background fluctuations can cause differences in the precise determination of activity concentrations in weak samples. For reliable estimation of the radioactive impurities, it is necessary to identify and minimize the background to improve the minimum detection limits of the spectrometer. Due to the typical interference of natural radionuclides, it is essential to accurately estimate the background level by measuring the concentration of the members of these decay chains and their variation [9, 10].
In India, the proposals for a potential underground laboratory driven by the interest in rare event studies have been initiated [11, 12, 13]. As mentioned earlier, other than the ambient background from the surroundings, the material of the counting detectors itself contributes to the background contamination levels in rare event experiments. To improve the sensitivity of measurement and accurately determine radio impurities, an essential prerequisite is low radioactivity around the detector as much as possible. The low background cryostats contribute miniature to the sample spectrum, improving its signal-to-noise ratio and significantly reducing the Minimum detectable activity (MDA). Therefore, the radiopure cryostat with selectively refined detector construction materials and applying passive shielding allows for lower minimum detectable activity and high sample throughput for a specific counting time, which is highly desirable in low background counting applications. Furthermore, cryocooler-based low background HPGe detectors are desirable for probing low background experiments in above-ground or remote underground locations for long-term counting measurements. To maximize the counting efficiency for investigating trace radioactive elements, it is necessary to understand the detector performance in compact geometry over a wide energy range and different counting setup configurations.
With this motivation, we have taken up the initiative to build a low background measurement setup at the Indian Institute of Technology (IIT) Ropar using the HPGe detectors. This setup is intended for radio-purity assessment and understanding of the radiation background at IIT Ropar to carry out low background experiments. This paper describes the performance test and characterization of a low background carbon fiber HPGe detector with a relative efficiency (R.E.) of 33%. The first set of studies presents detector characterization with radioactive sources over a wide energy range from 80.9–1408 keV. The performance specifications are successfully tested against the warranted values provided by the manufacturer. Measurements have been performed with point-like sources to calculate the peak shape, Peak-to-Compton ratio (P/C), Full energy peak efficiency (FEPE), and Figure of merit (FOM). Mono-energetic sources are used to perform close scanning of Ge crystal along its parallel and perpendicular axis to determine the inner crystal structure. A Monte Carlo model has been developed using GEANT4 to calculate the FEPE of the HPGe detector for gamma spectrometry measurements associated with the development of a low background setup. It has been observed that germanium crystal volume and dead layers in the surroundings are crucial parameters in the detector geometry [14, 15]. Over the operational lifespan of the detector, the continuous diffusion of lithium ions into the germanium crystal leads to an increase in the dead layer thickness and a decrease in the active volume of the detector. Previous literature has reported a significant deviation of 10–30 between the experimental and simulated FEPE efficiencies in the energy range of 60-2000 keV [15, 16, 17, 18]. In order to validate a simulation code, the detector has been optimized, which typically involves adjusting various detector parameters, such as the dimensions, dead layer thickness, and other relevant factors. The second set of studies characterizes the natural gamma-ray background during long counting measurement and its further reduction by incorporating a Pb shield at the above-ground laboratory of IIT Ropar. The organized statistical data on this topic would be valuable for inter-laboratory comparisons and unique in different geological and geographical conditions than the rest of the studied areas, especially quantifying low-level natural radioactivity. The activity concentration and Minimum detectable activity (MDA) for common radioisotopes in environmental samples are evaluated. The presentation of this paper is organized as follows, section 2 describes the experimental setup and procedure details, section 3 discusses the experimental characterization, detector modelling, comparison with simulated data, and spectroscopy measurements for characterizing background distributions. The summary and conclusions are given in section 4.
2 Experimental setup and Methodology
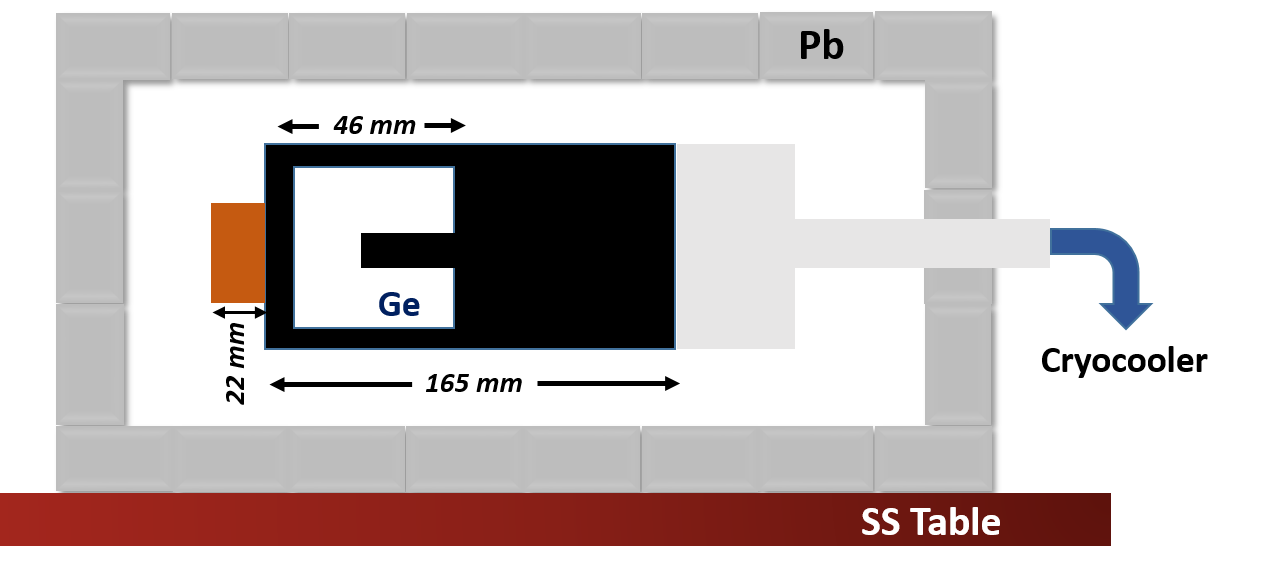
The experimental setup (ILM-0) comprises of p-type co-axial HPGe detector, ORTEC make (GEM30P4-83-RB) with a measured relative efficiency of 33% having a crystal diameter of 62 mm and thickness of 46 mm. The detector crystal is mounted inside a cryostat of low background carbon fiber (carbon-composite) body, and the top face is 5 mm beneath a 0.9 mm thick carbon fiber entrance window. The rear end of the detector is attached to the 150 mm long vertical cold finger connected to the transfer hose of an electro-mechanical cooler (ORTEC X-Cooler III) to cool the detector crystal to liquid nitrogen (LN2) temperature (77 K). The typical cooldown time required by the electro-mechanical cooler is found to be 10-16 h. The detector assembly is supported with additional online UPS to protect during utility power failure. The HPGe detector is surrounded by moderate passive shielding with lead bricks of dimensions and mounted on a custom-made stainless steel (SS) table, as shown in Figure 1. In this arrangement, the detector with a preamplifier is entirely shielded with adequate space for mounting voluminous samples generally used in environmental radioactivity measurements. In addition, it has a provision for an inner layer of passive shielding and an active muon veto. It should be mentioned that different shapes and configurations of the lead shields were also considered before the final implementation of bricks geometry.
The detector is coupled with the pulse processing electronics and data acquisition system, including a NIM-based high voltage power supply, spectroscopic amplifier, and multichannel analyzer procured from ORTEC. The multichannel analyzer records the data using the emulator software Maestro. A list of relevant technical details, along with the associated electronics, are summarized in Table 1.
| Model | GEM30P4-83-RB |
| Manufacturer | ORTEC |
| In service since | 2017 |
| Capsule type | Pop top |
| HV Bias | +2800 V |
| Crystal polarity | p-type |
| DAQ | Analog |
| Shaping time | 6 s |
| Geometry | Closed end |
| Cryostat type | Vertical dipstick |
| Cryostat diameter | 75 mm |
| Crytal diameter | 62 mm |
The characterization measurements have been carried out using a set of standard sealed disk-type gamma sources of the active diameter of 6 mm and thickness of 1 mm with absolute strength of gamma sources 95 kBq within 5% uncertainty. These sources cover a gamma ray energy range from 80.9 keV to 1408 keV, as shown in Table 2.
| Sources | Gamma | Decay | Half- | Branching |
| Energy | mode | life | Ratio | |
| (keV) | (%) | |||
| 109Cd | 88.0 | EC | 461.4 d | 3.64 |
| 57Co | 122.1 | 271.7 d | 85.60 | |
| 136.5 | 10.68 | |||
| 133Ba | 80.9 | EC | 10.5 y | 32.90 |
| 276.4 | 7.160 | |||
| 302.9 | 18.34 | |||
| 356.0 | 62.05 | |||
| 383.9 | 8.940 | |||
| 22Na | 511.0 | 2.6 y | 180.7 | |
| 1274.5 | 99.94 | |||
| 137Cs | 661.7 | 30.1 y | 85.10 | |
| 54Mn | 834.5 | EC | 312.2 d | 99.98 |
| 65Zn | 1115.5 | EC | 243.9 d | 50.04 |
| 60Co | 1173.2 | 1925.3 d | 99.85 | |
| 1332.5 | 99.98 | |||
| 152Eu | 121.7 | EC | 13.5 y | 28.53 |
| 244.7 | EC | 7.550 | ||
| 344.4 | 26.60 | |||
| 411.1 | 2.240 | |||
| 444.0 | EC | 0.298 | ||
| 779.0 | 12.93 | |||
| 867.4 | EC | 4.230 | ||
| 964.0 | EC | 14.51 | ||
| 1085.8 | EC | 10.11 | ||
| 1089.7 | 1.734 | |||
| 1112.1 | EC | 13.67 | ||
| 1213.0 | EC | 1.415 | ||
| 1299.1 | 1.633 | |||
| 1408.0 | EC | 20.87 |
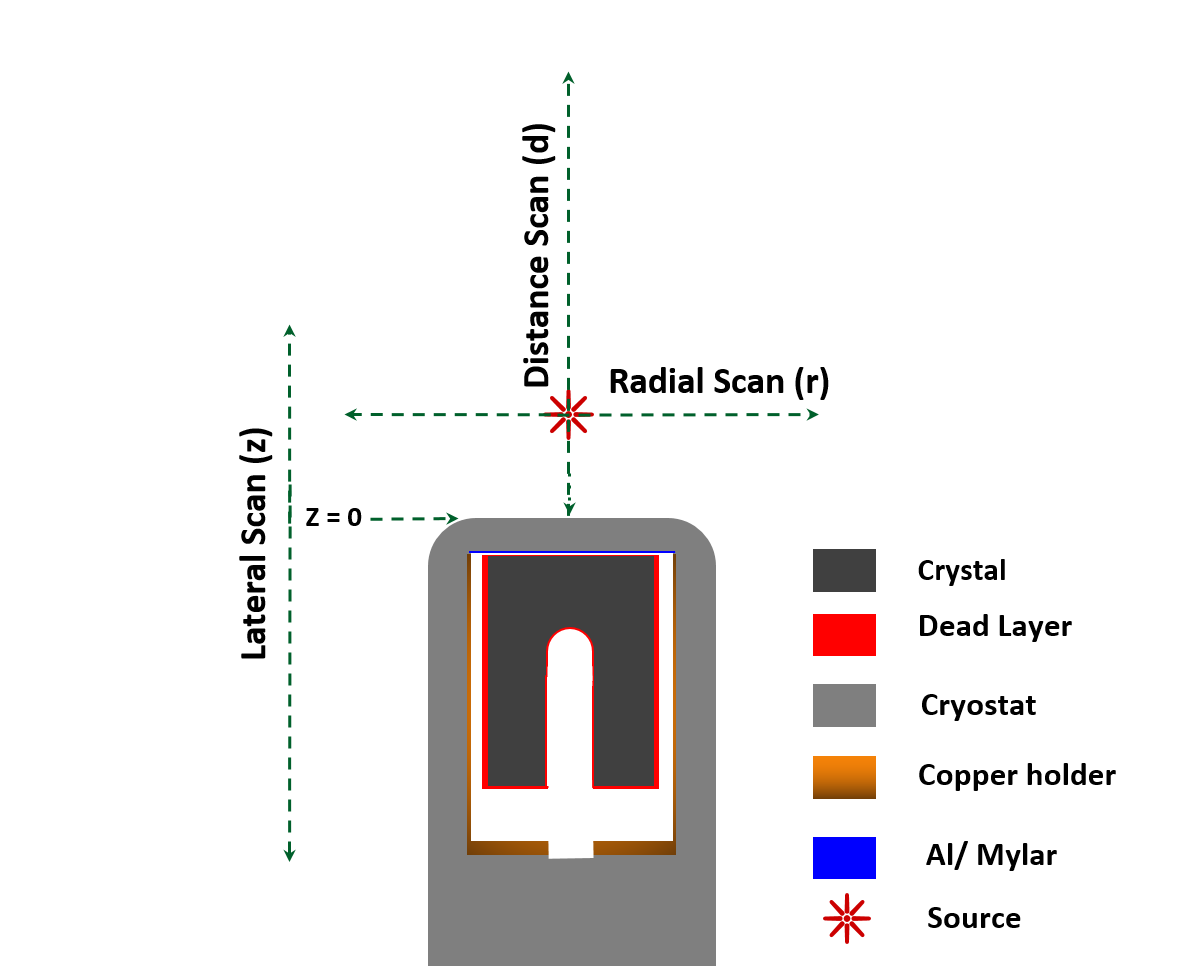
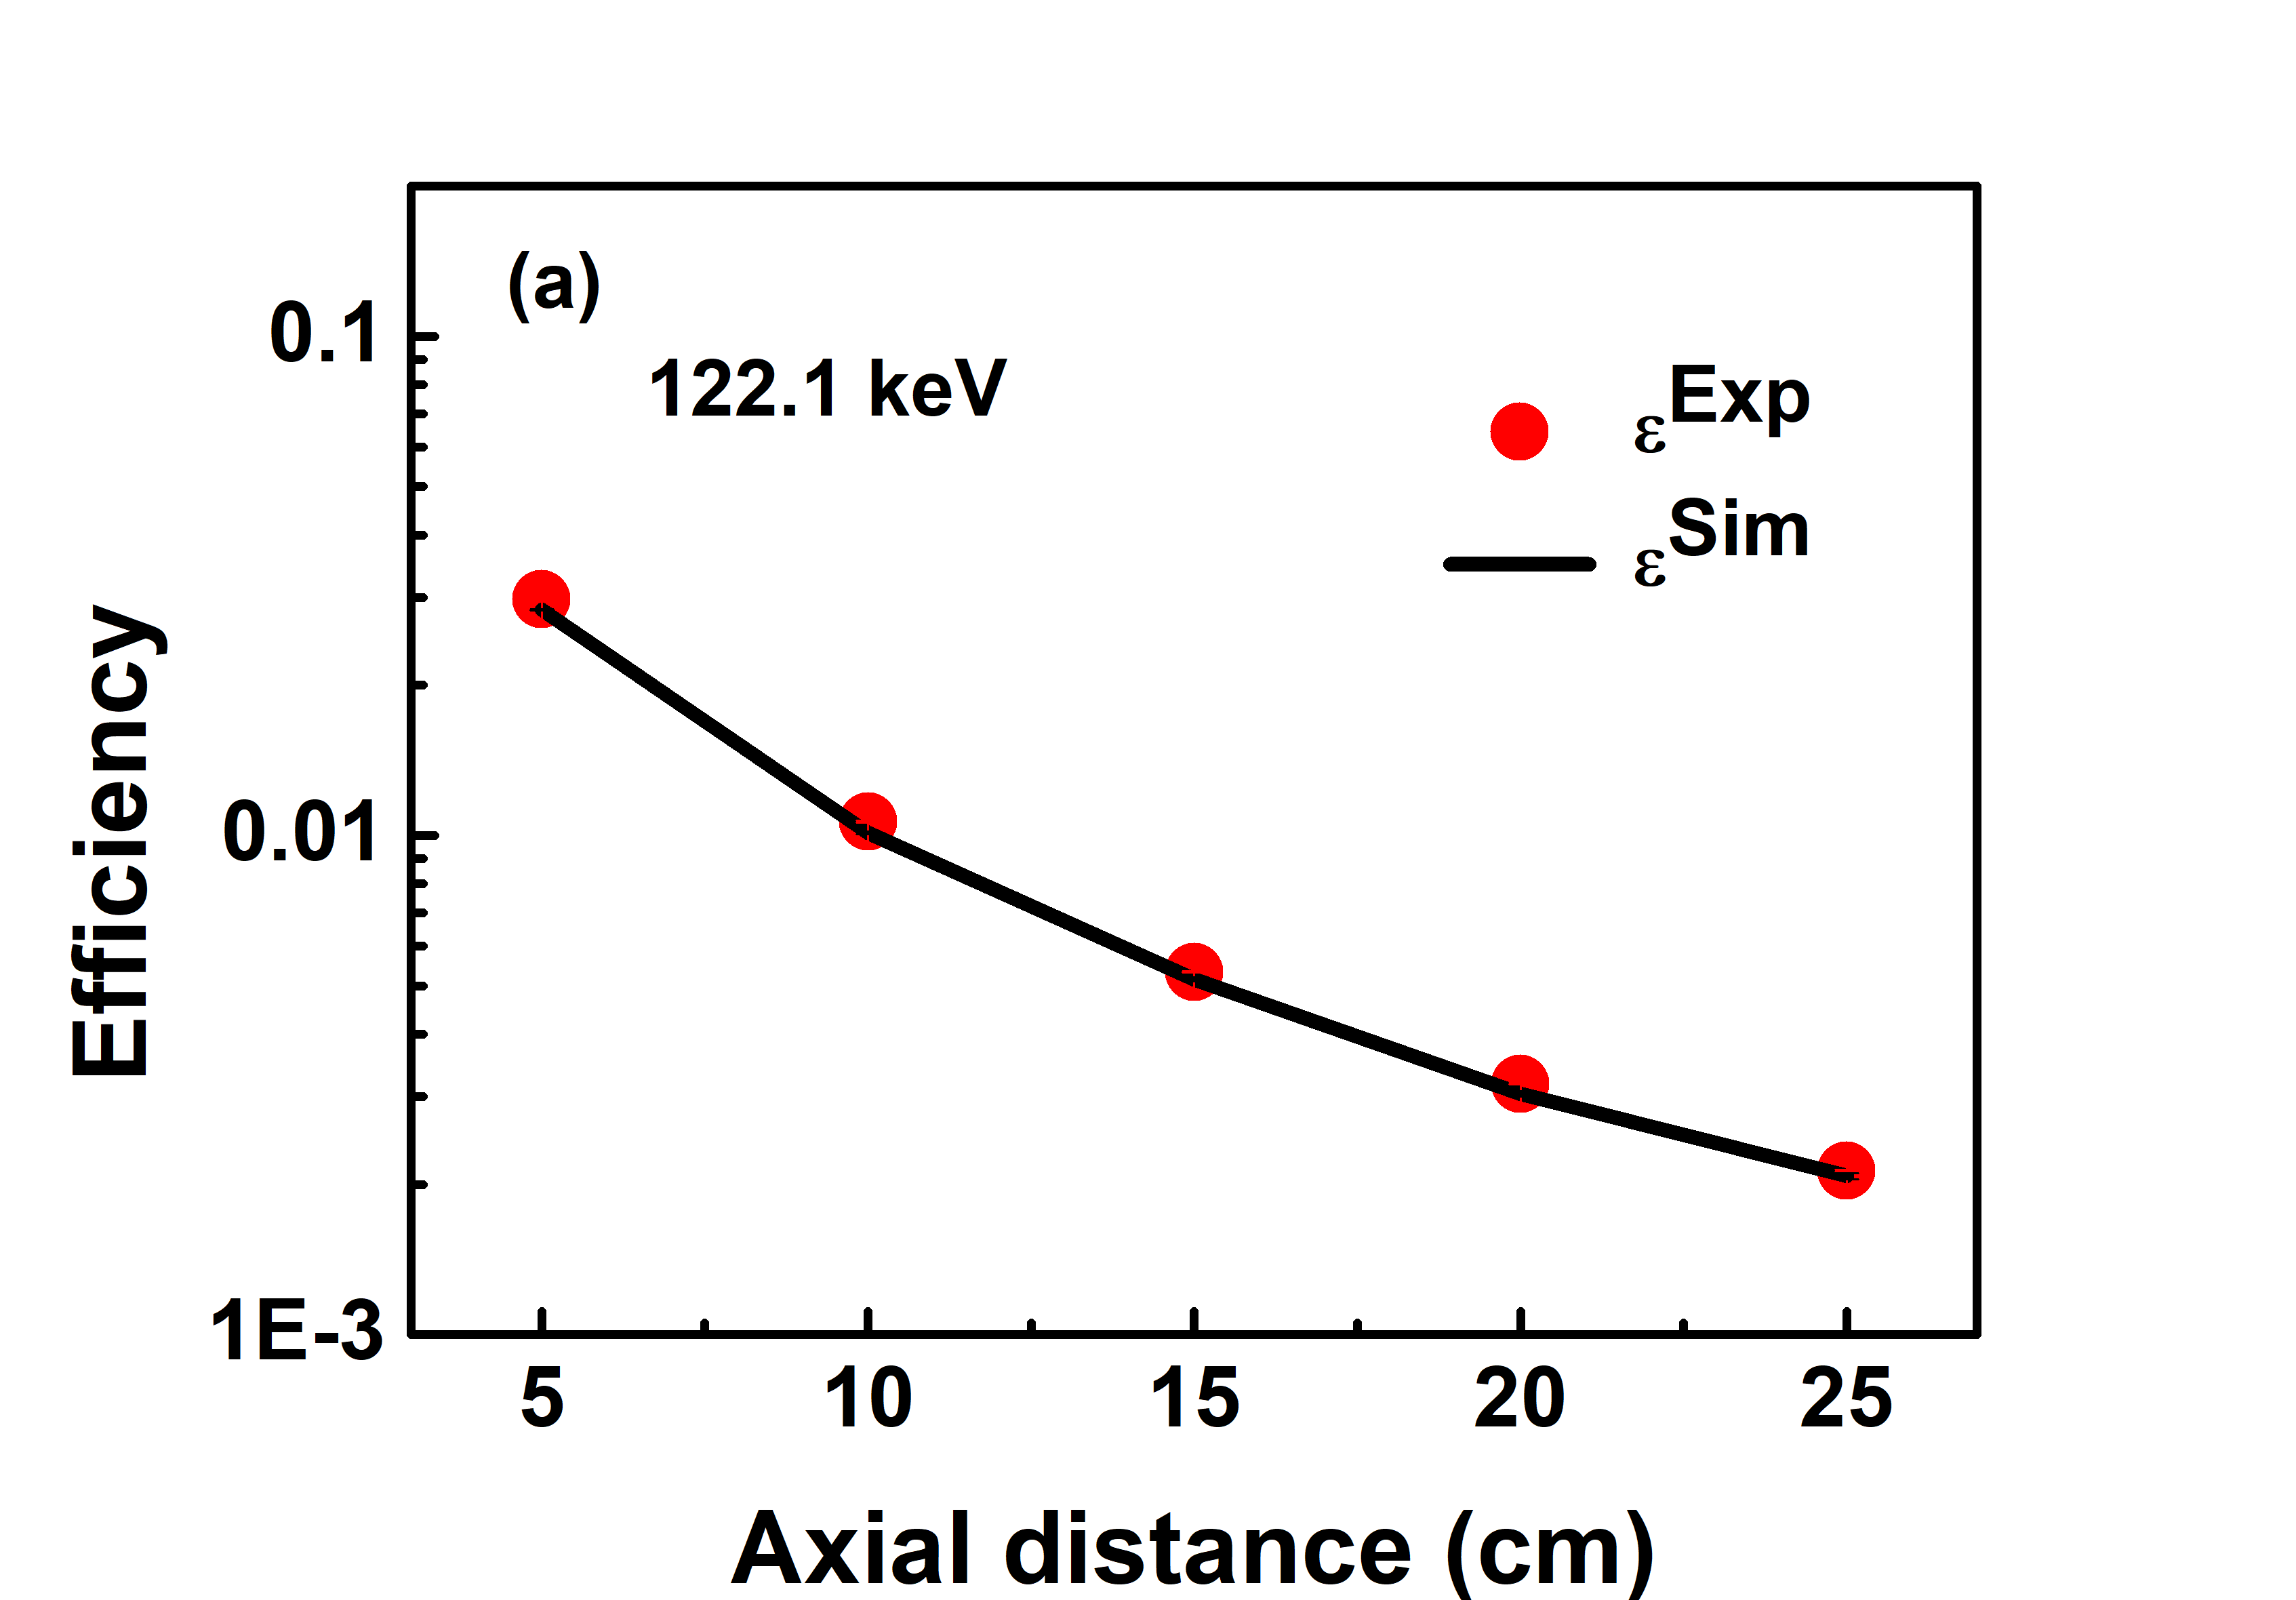
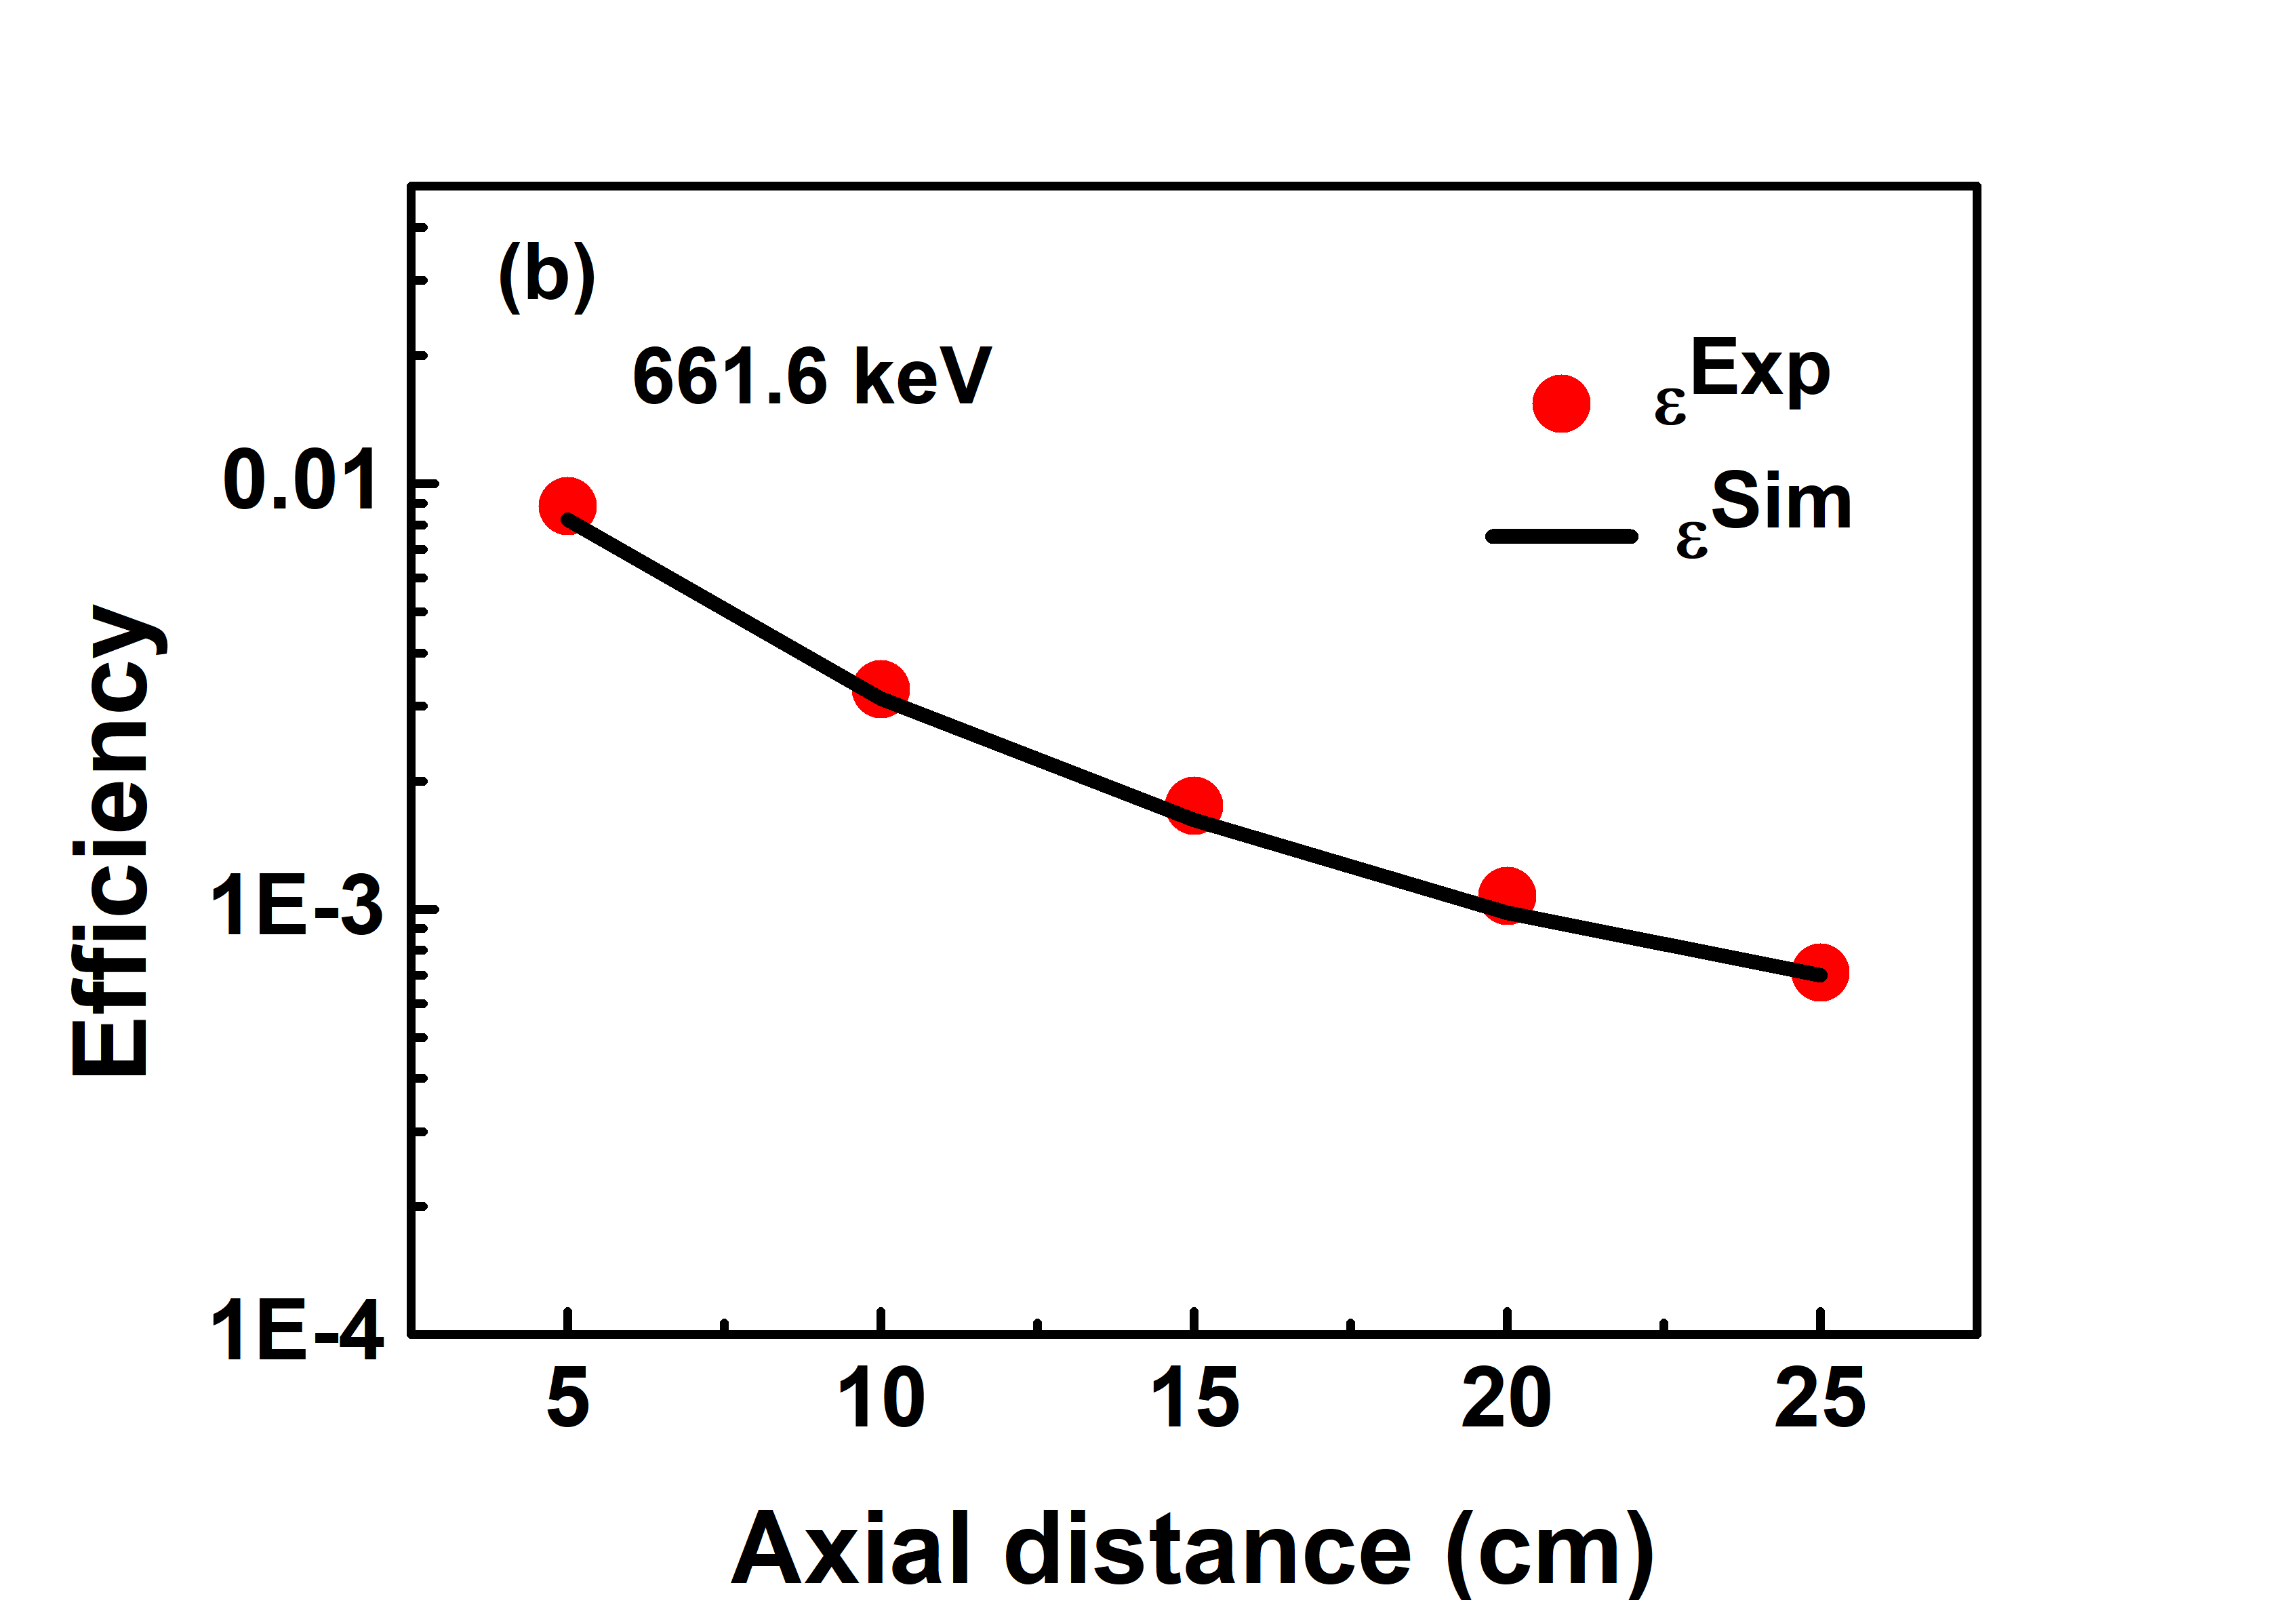
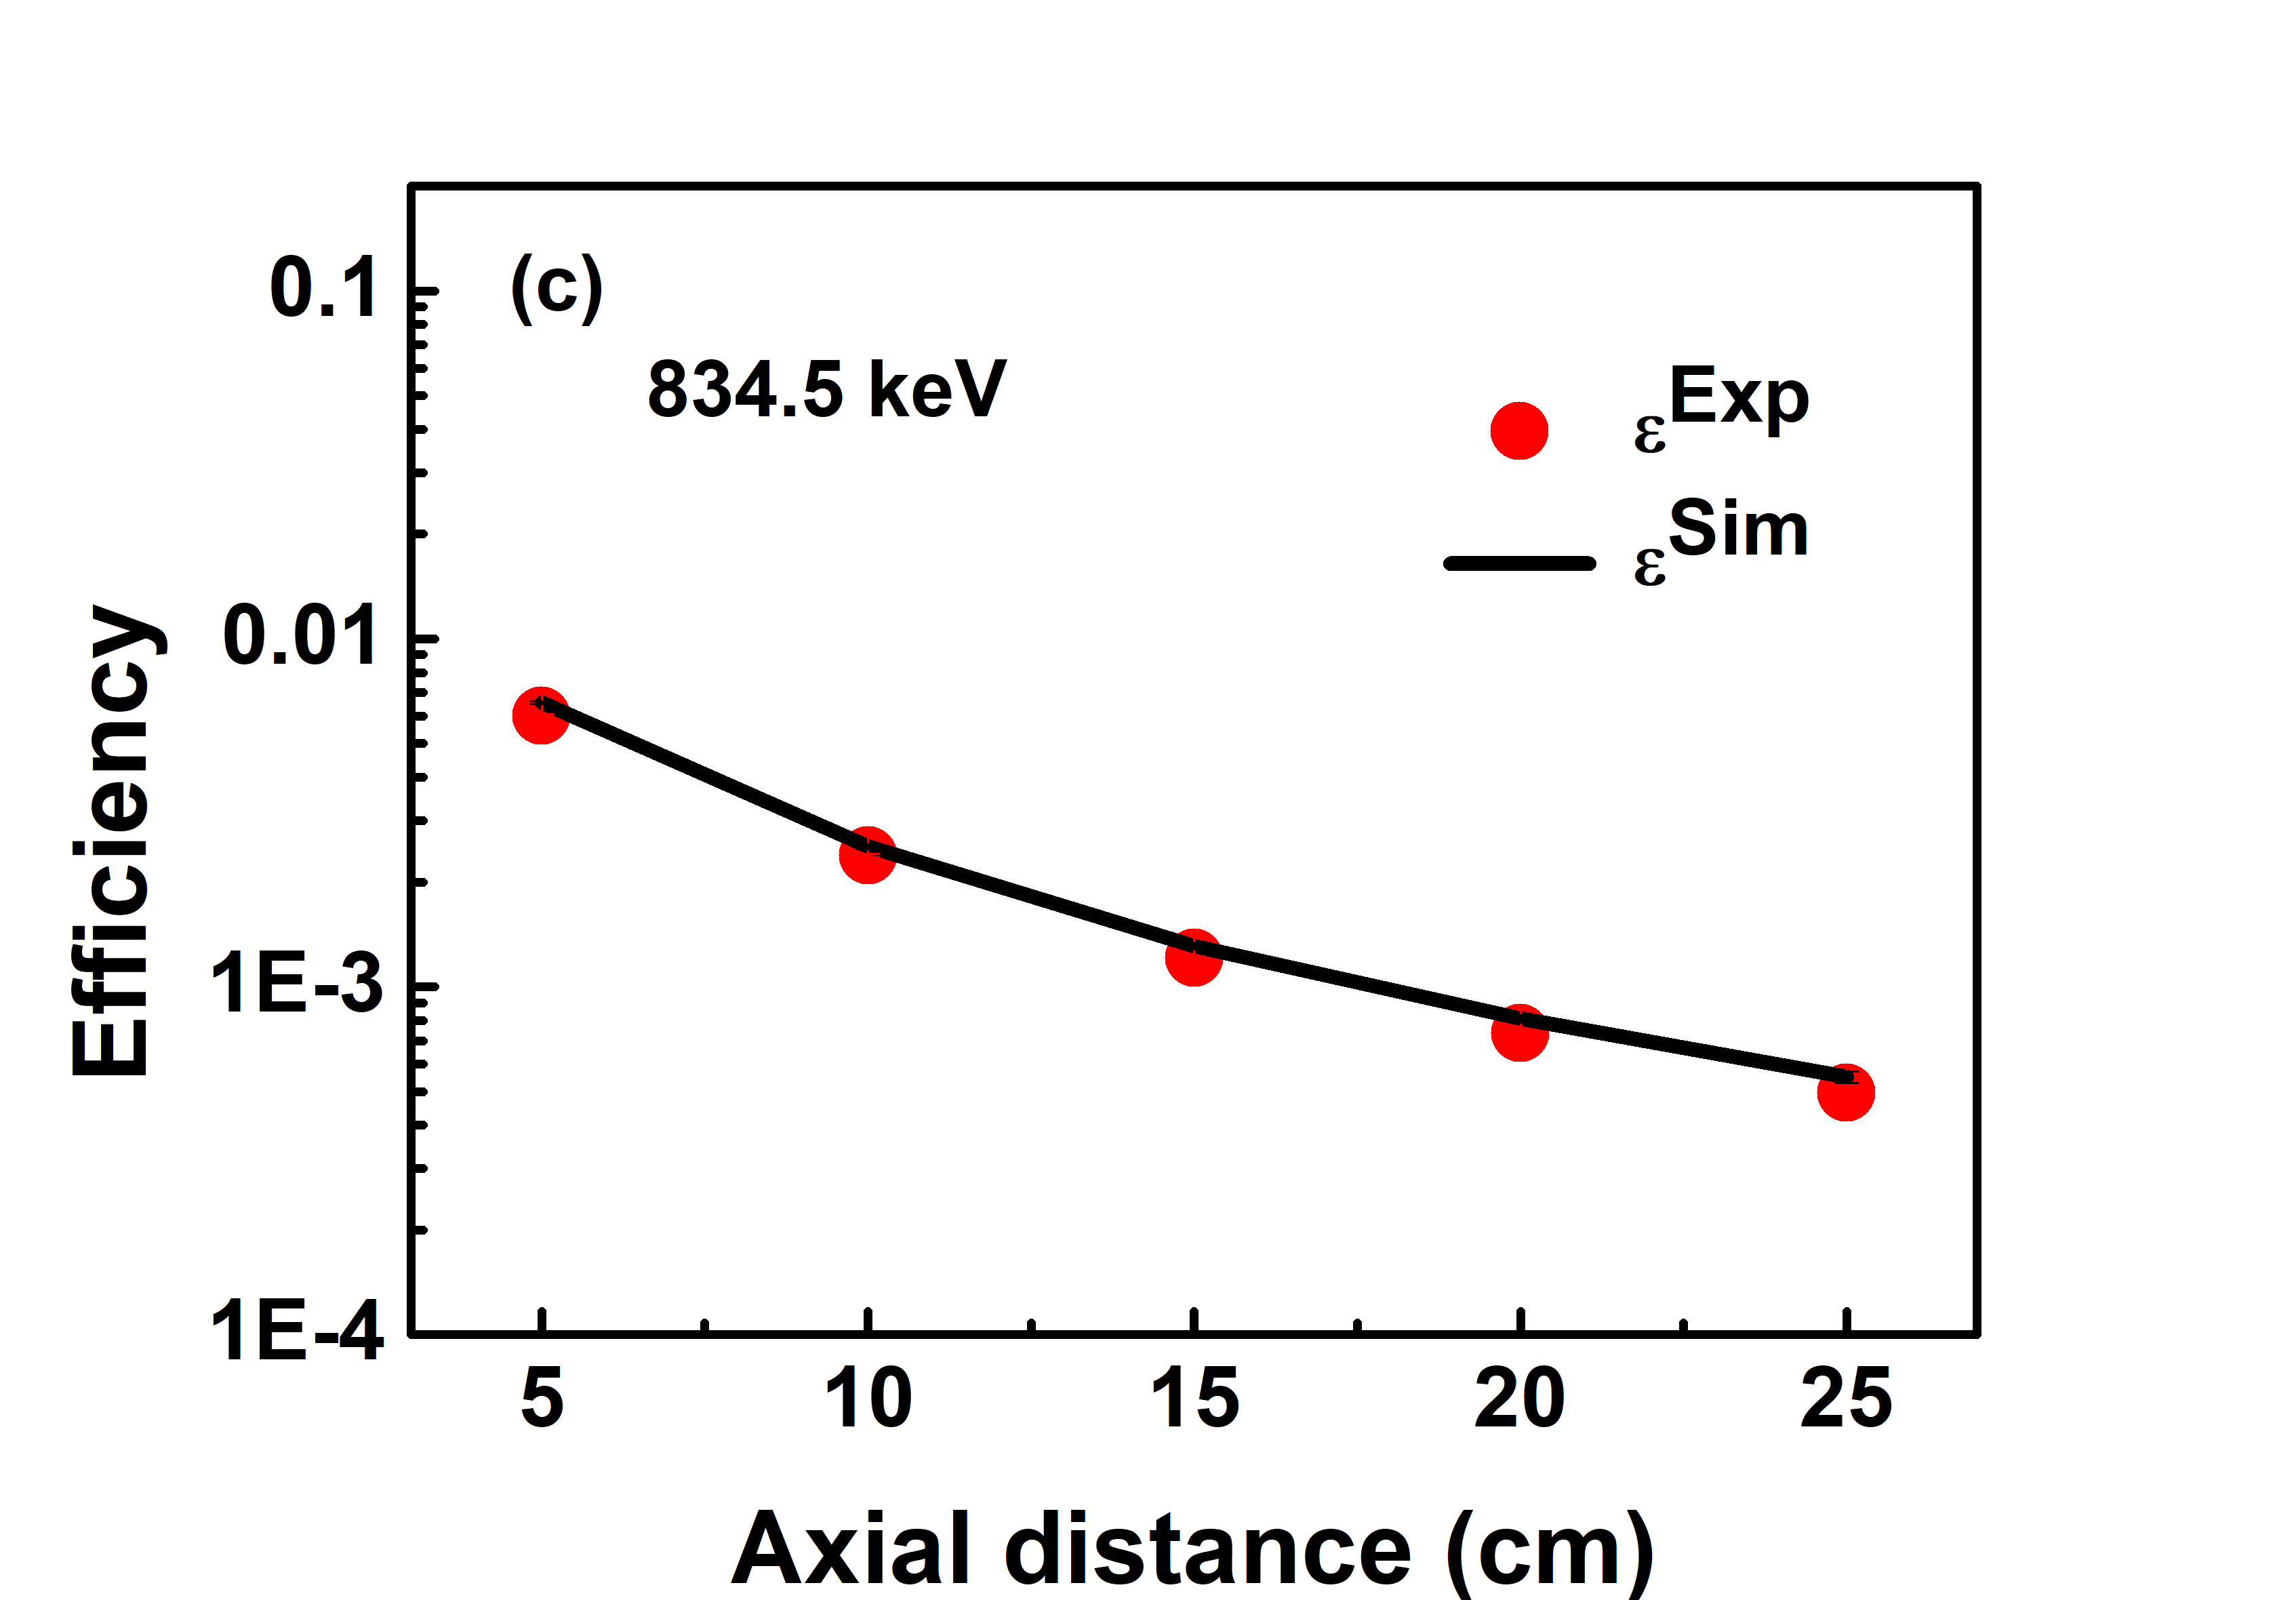
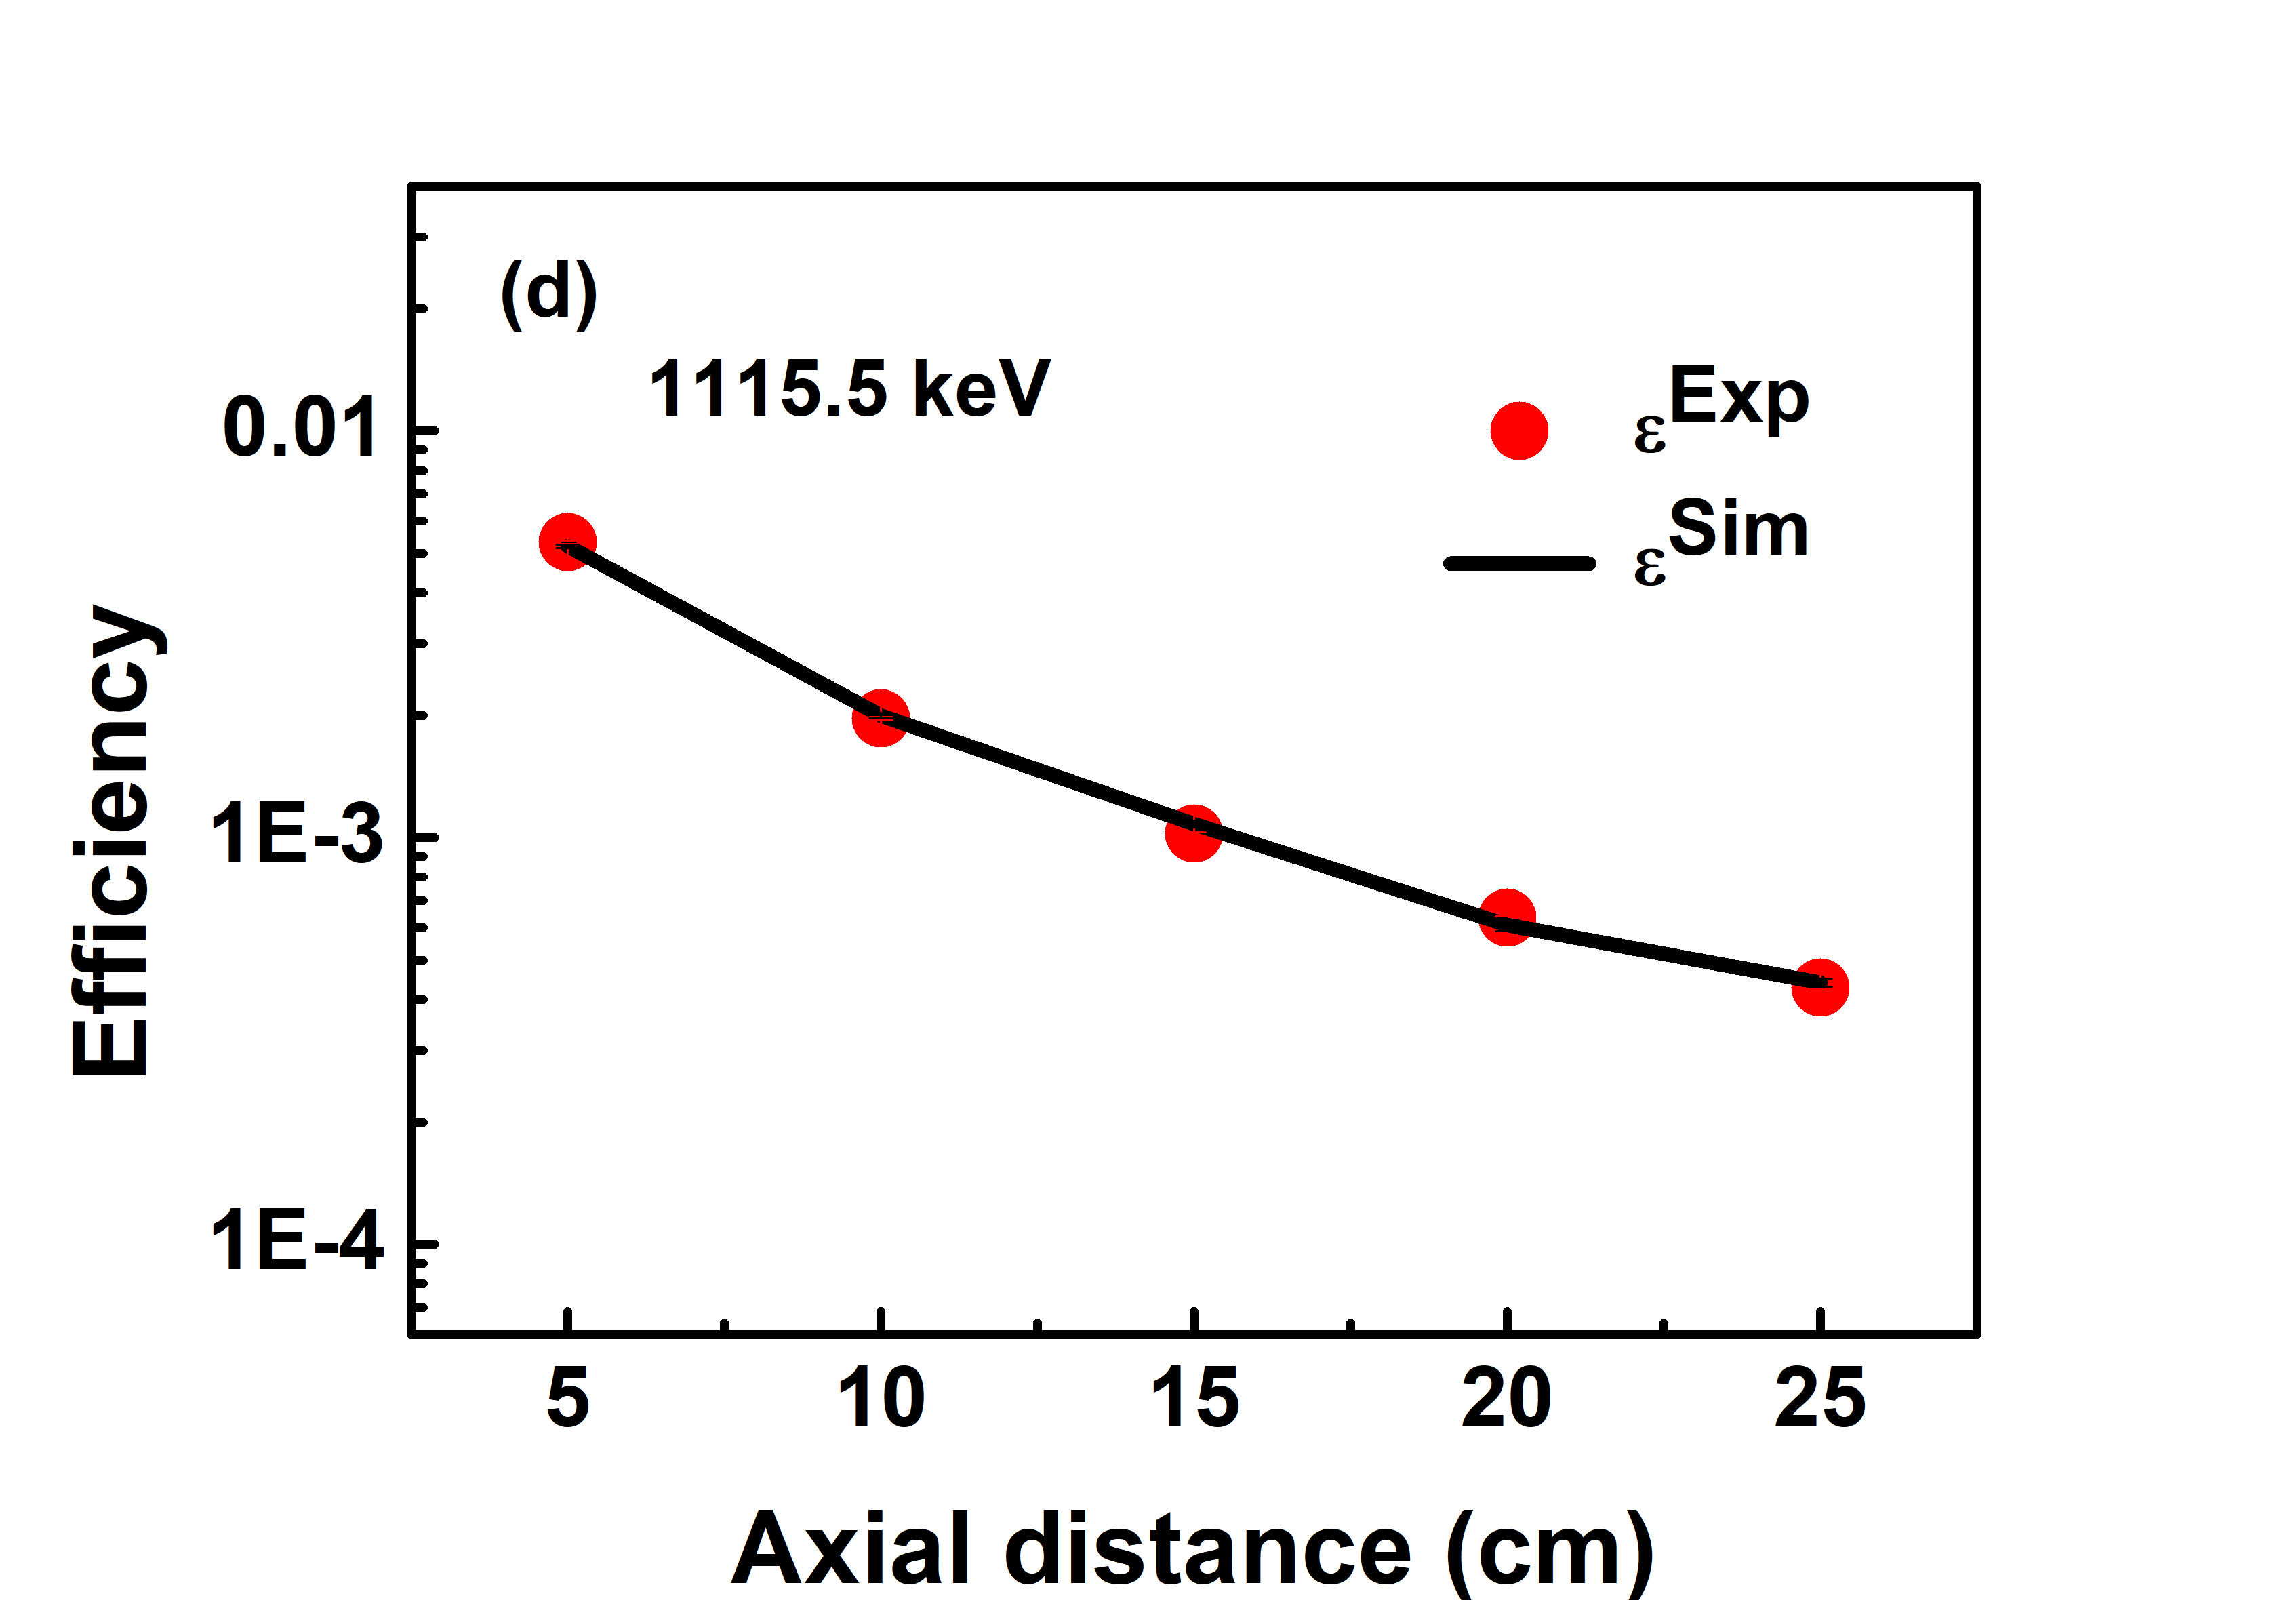
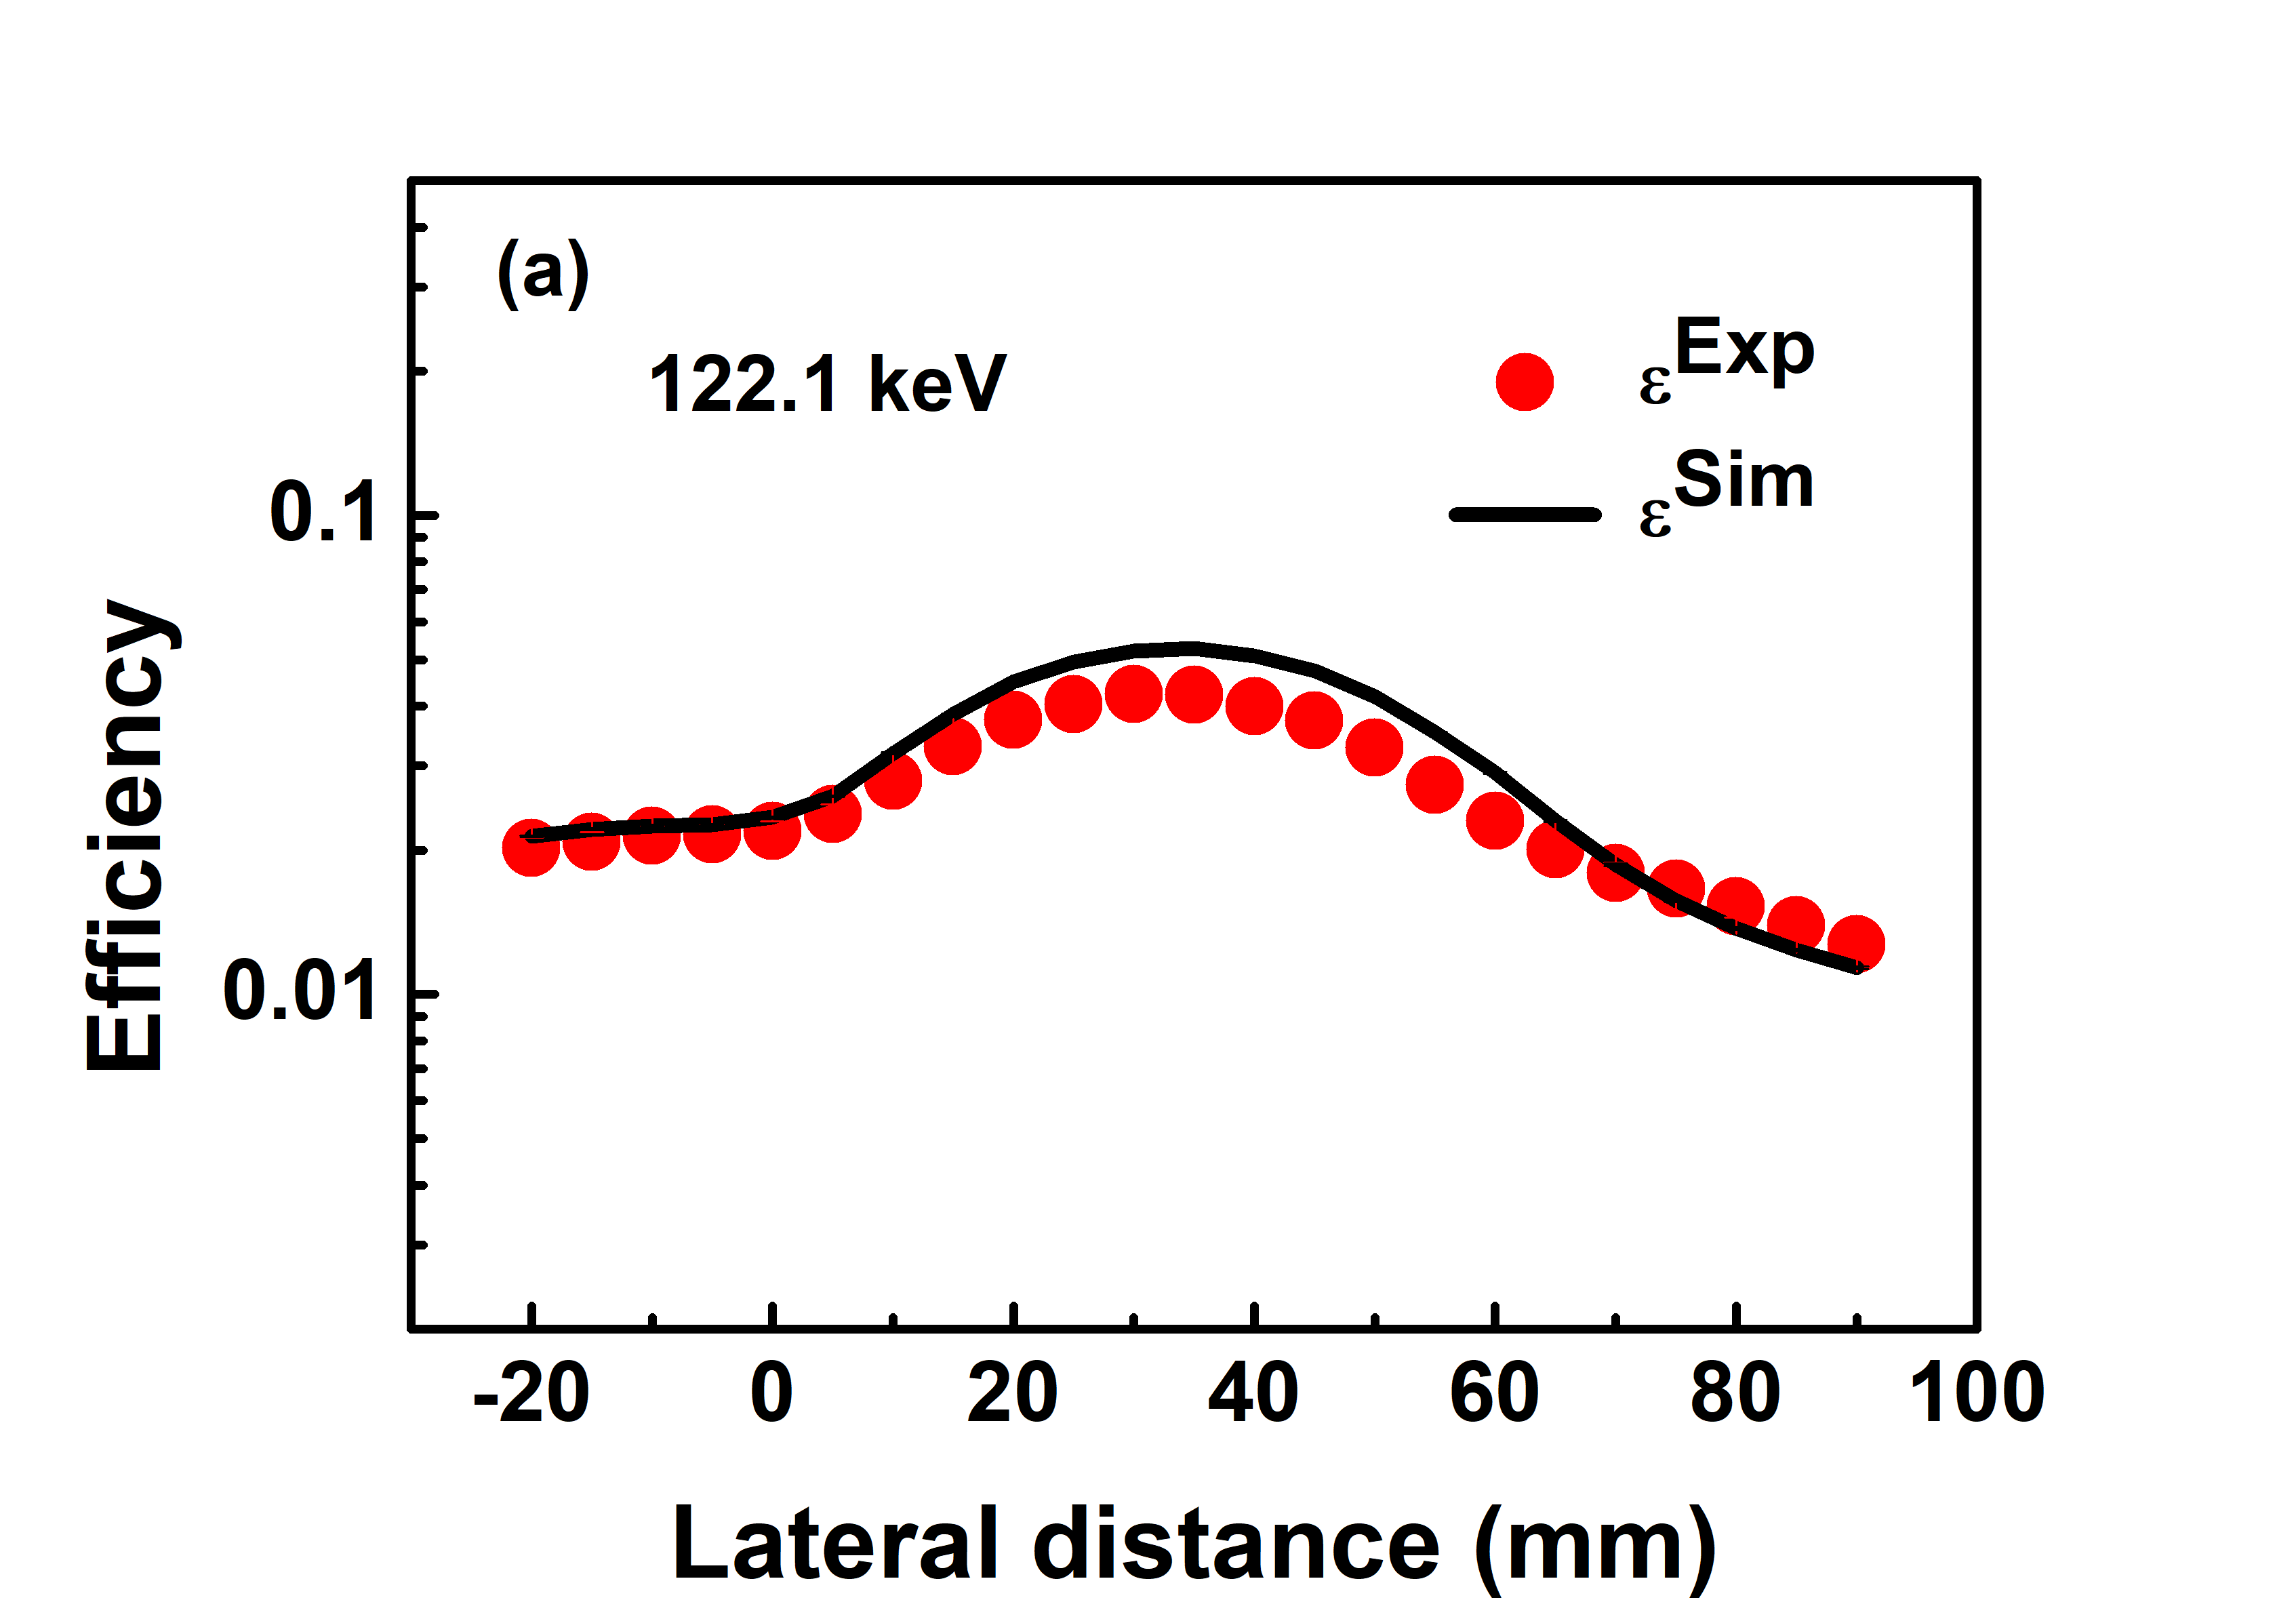
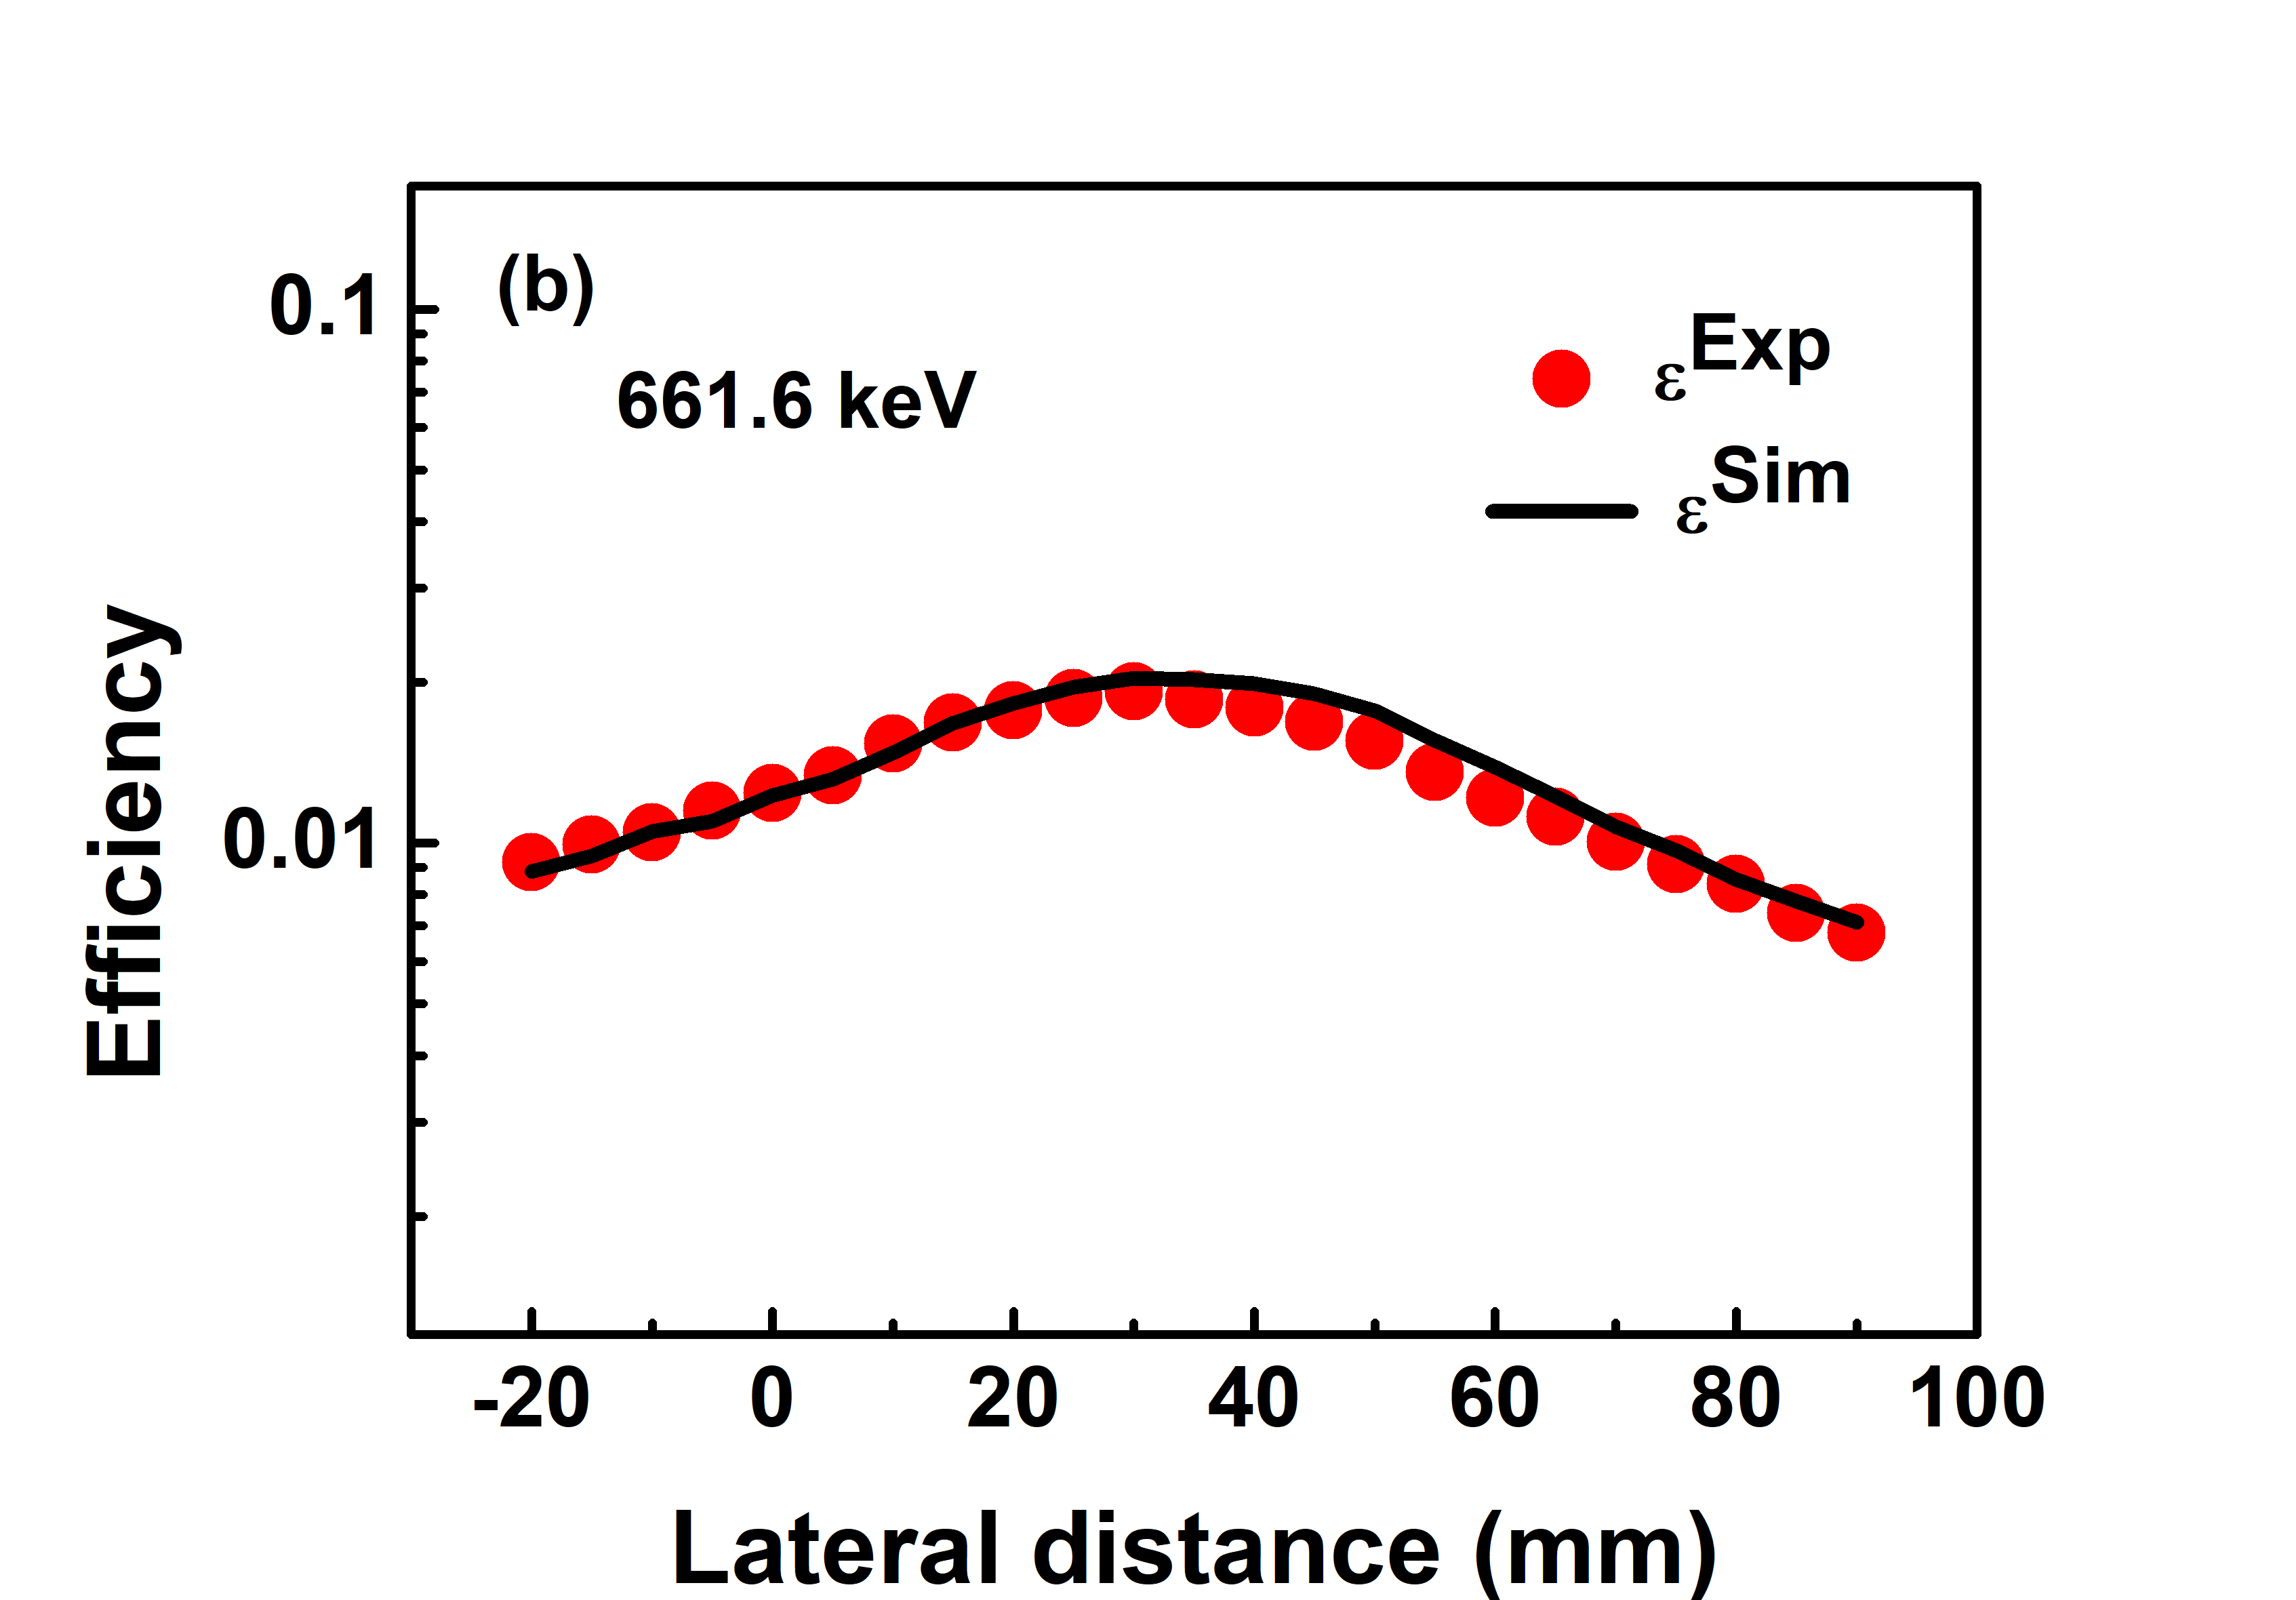
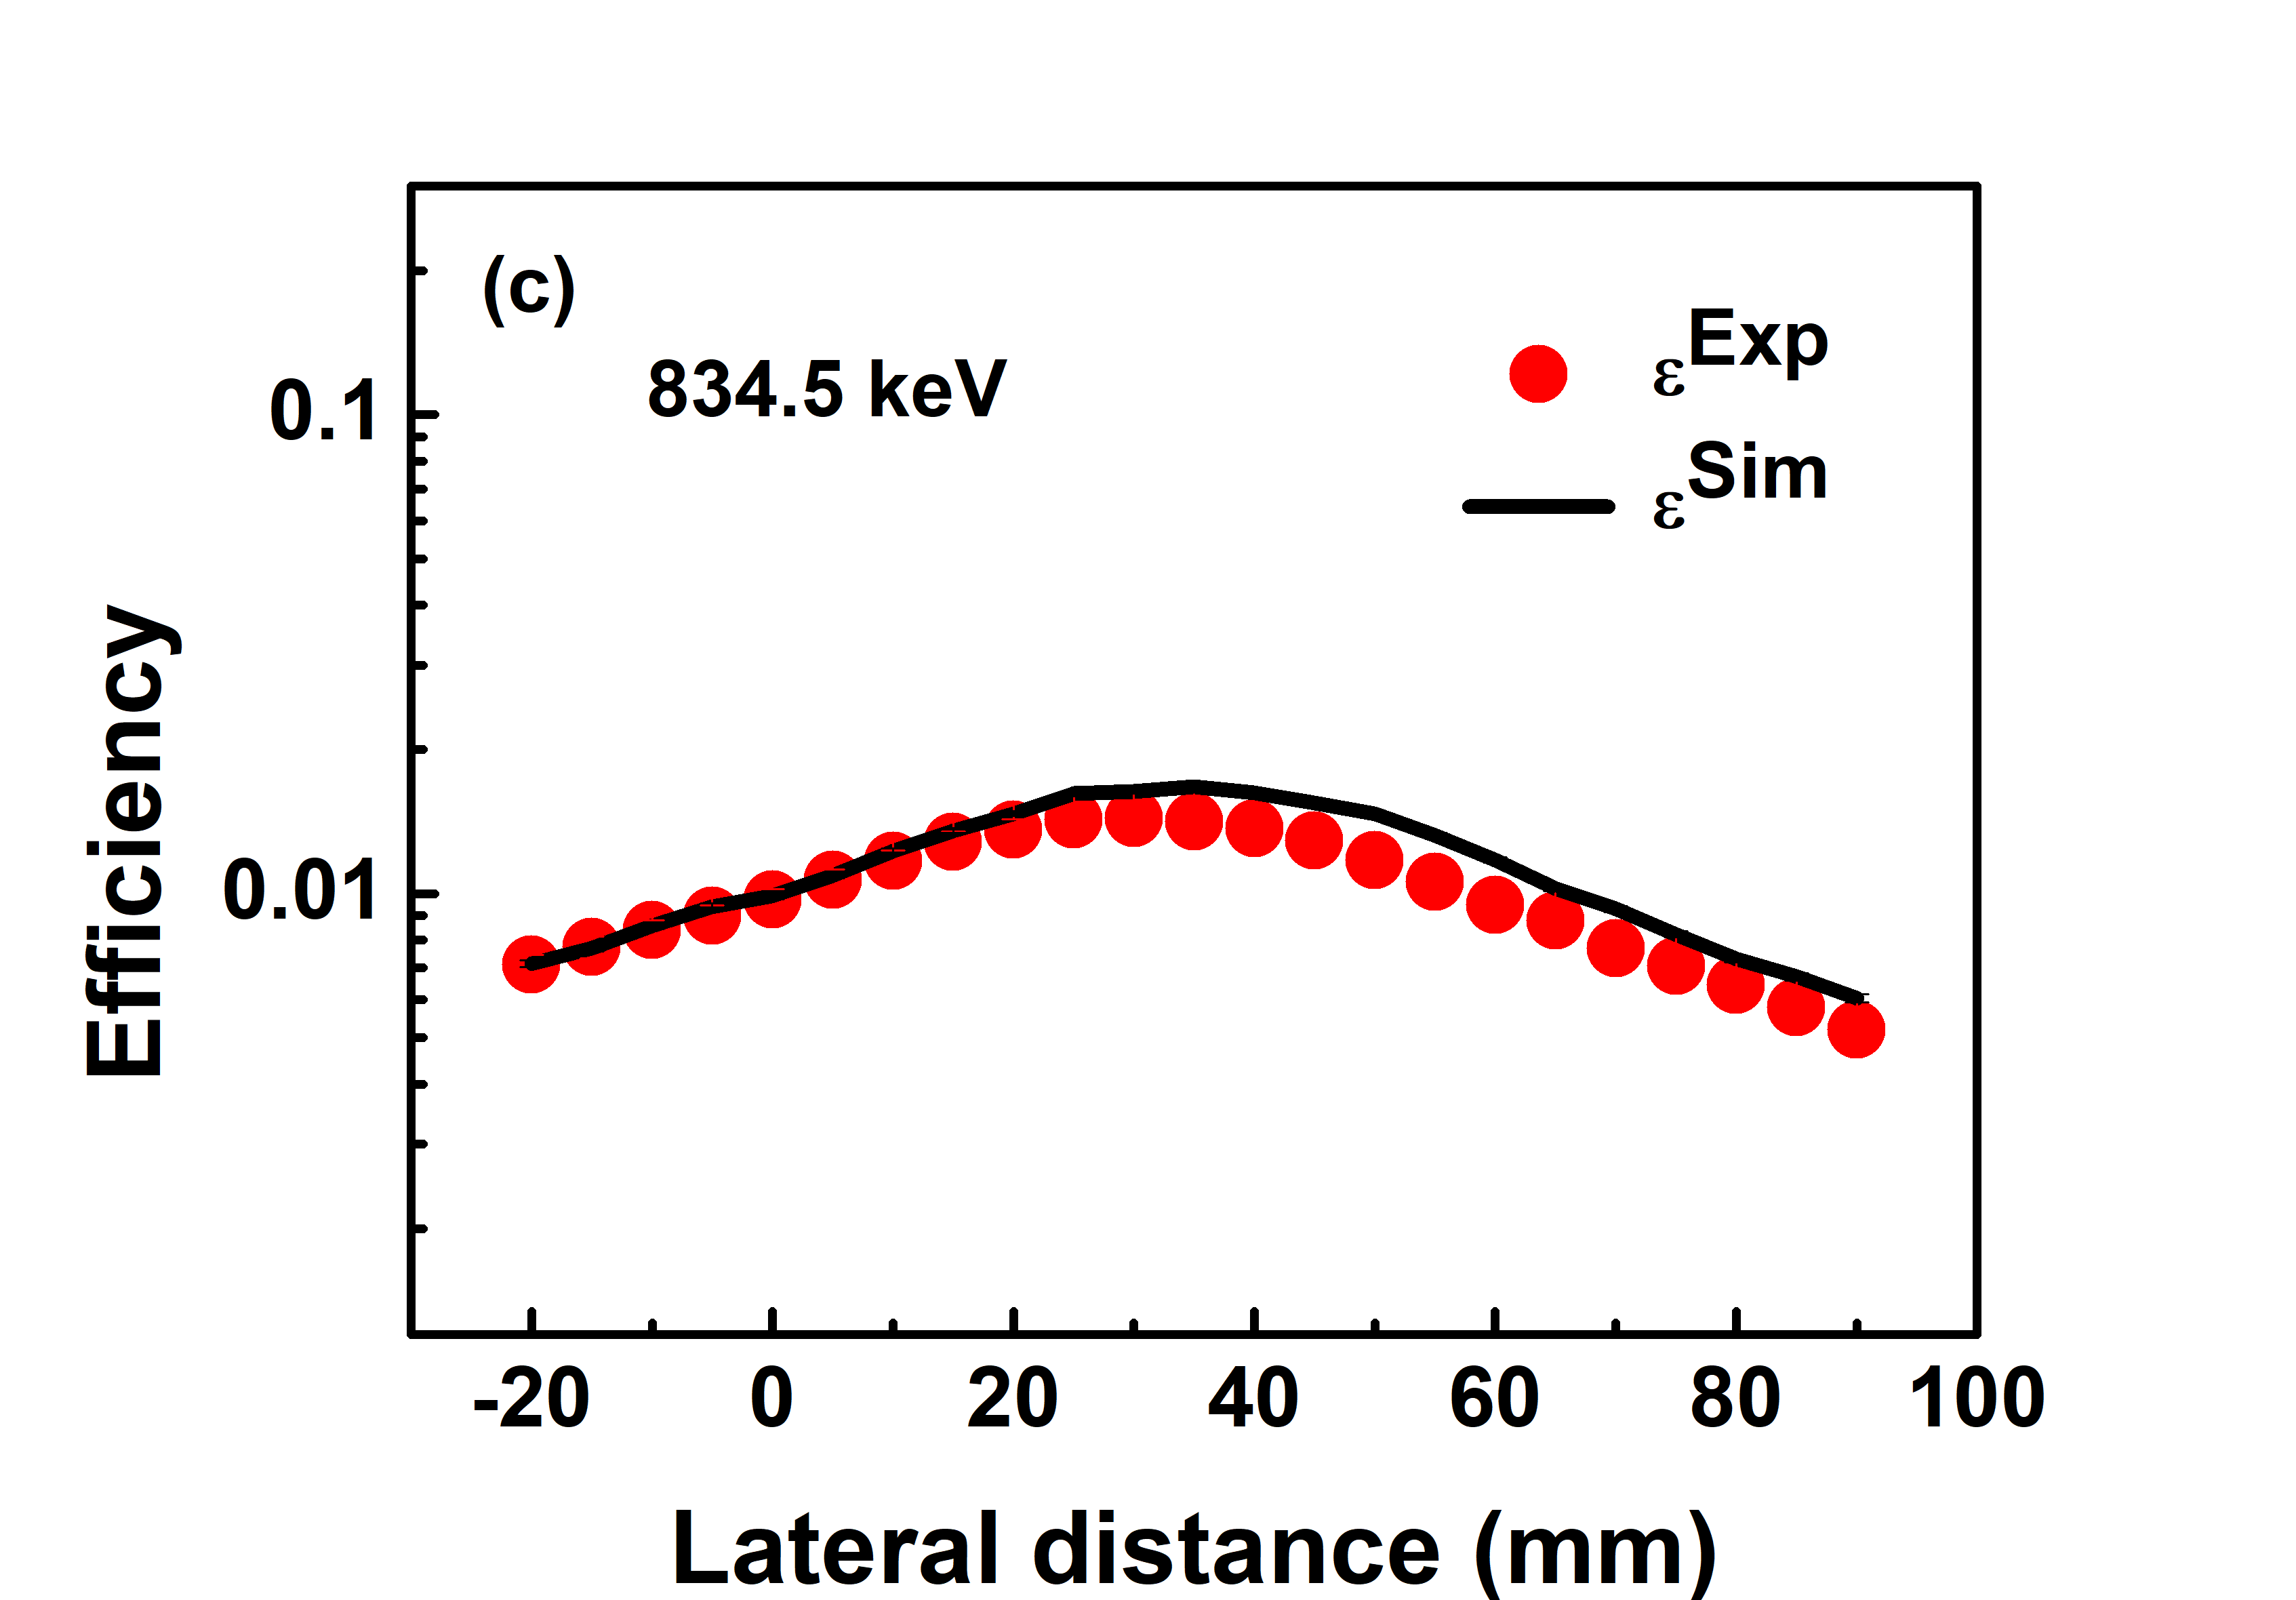
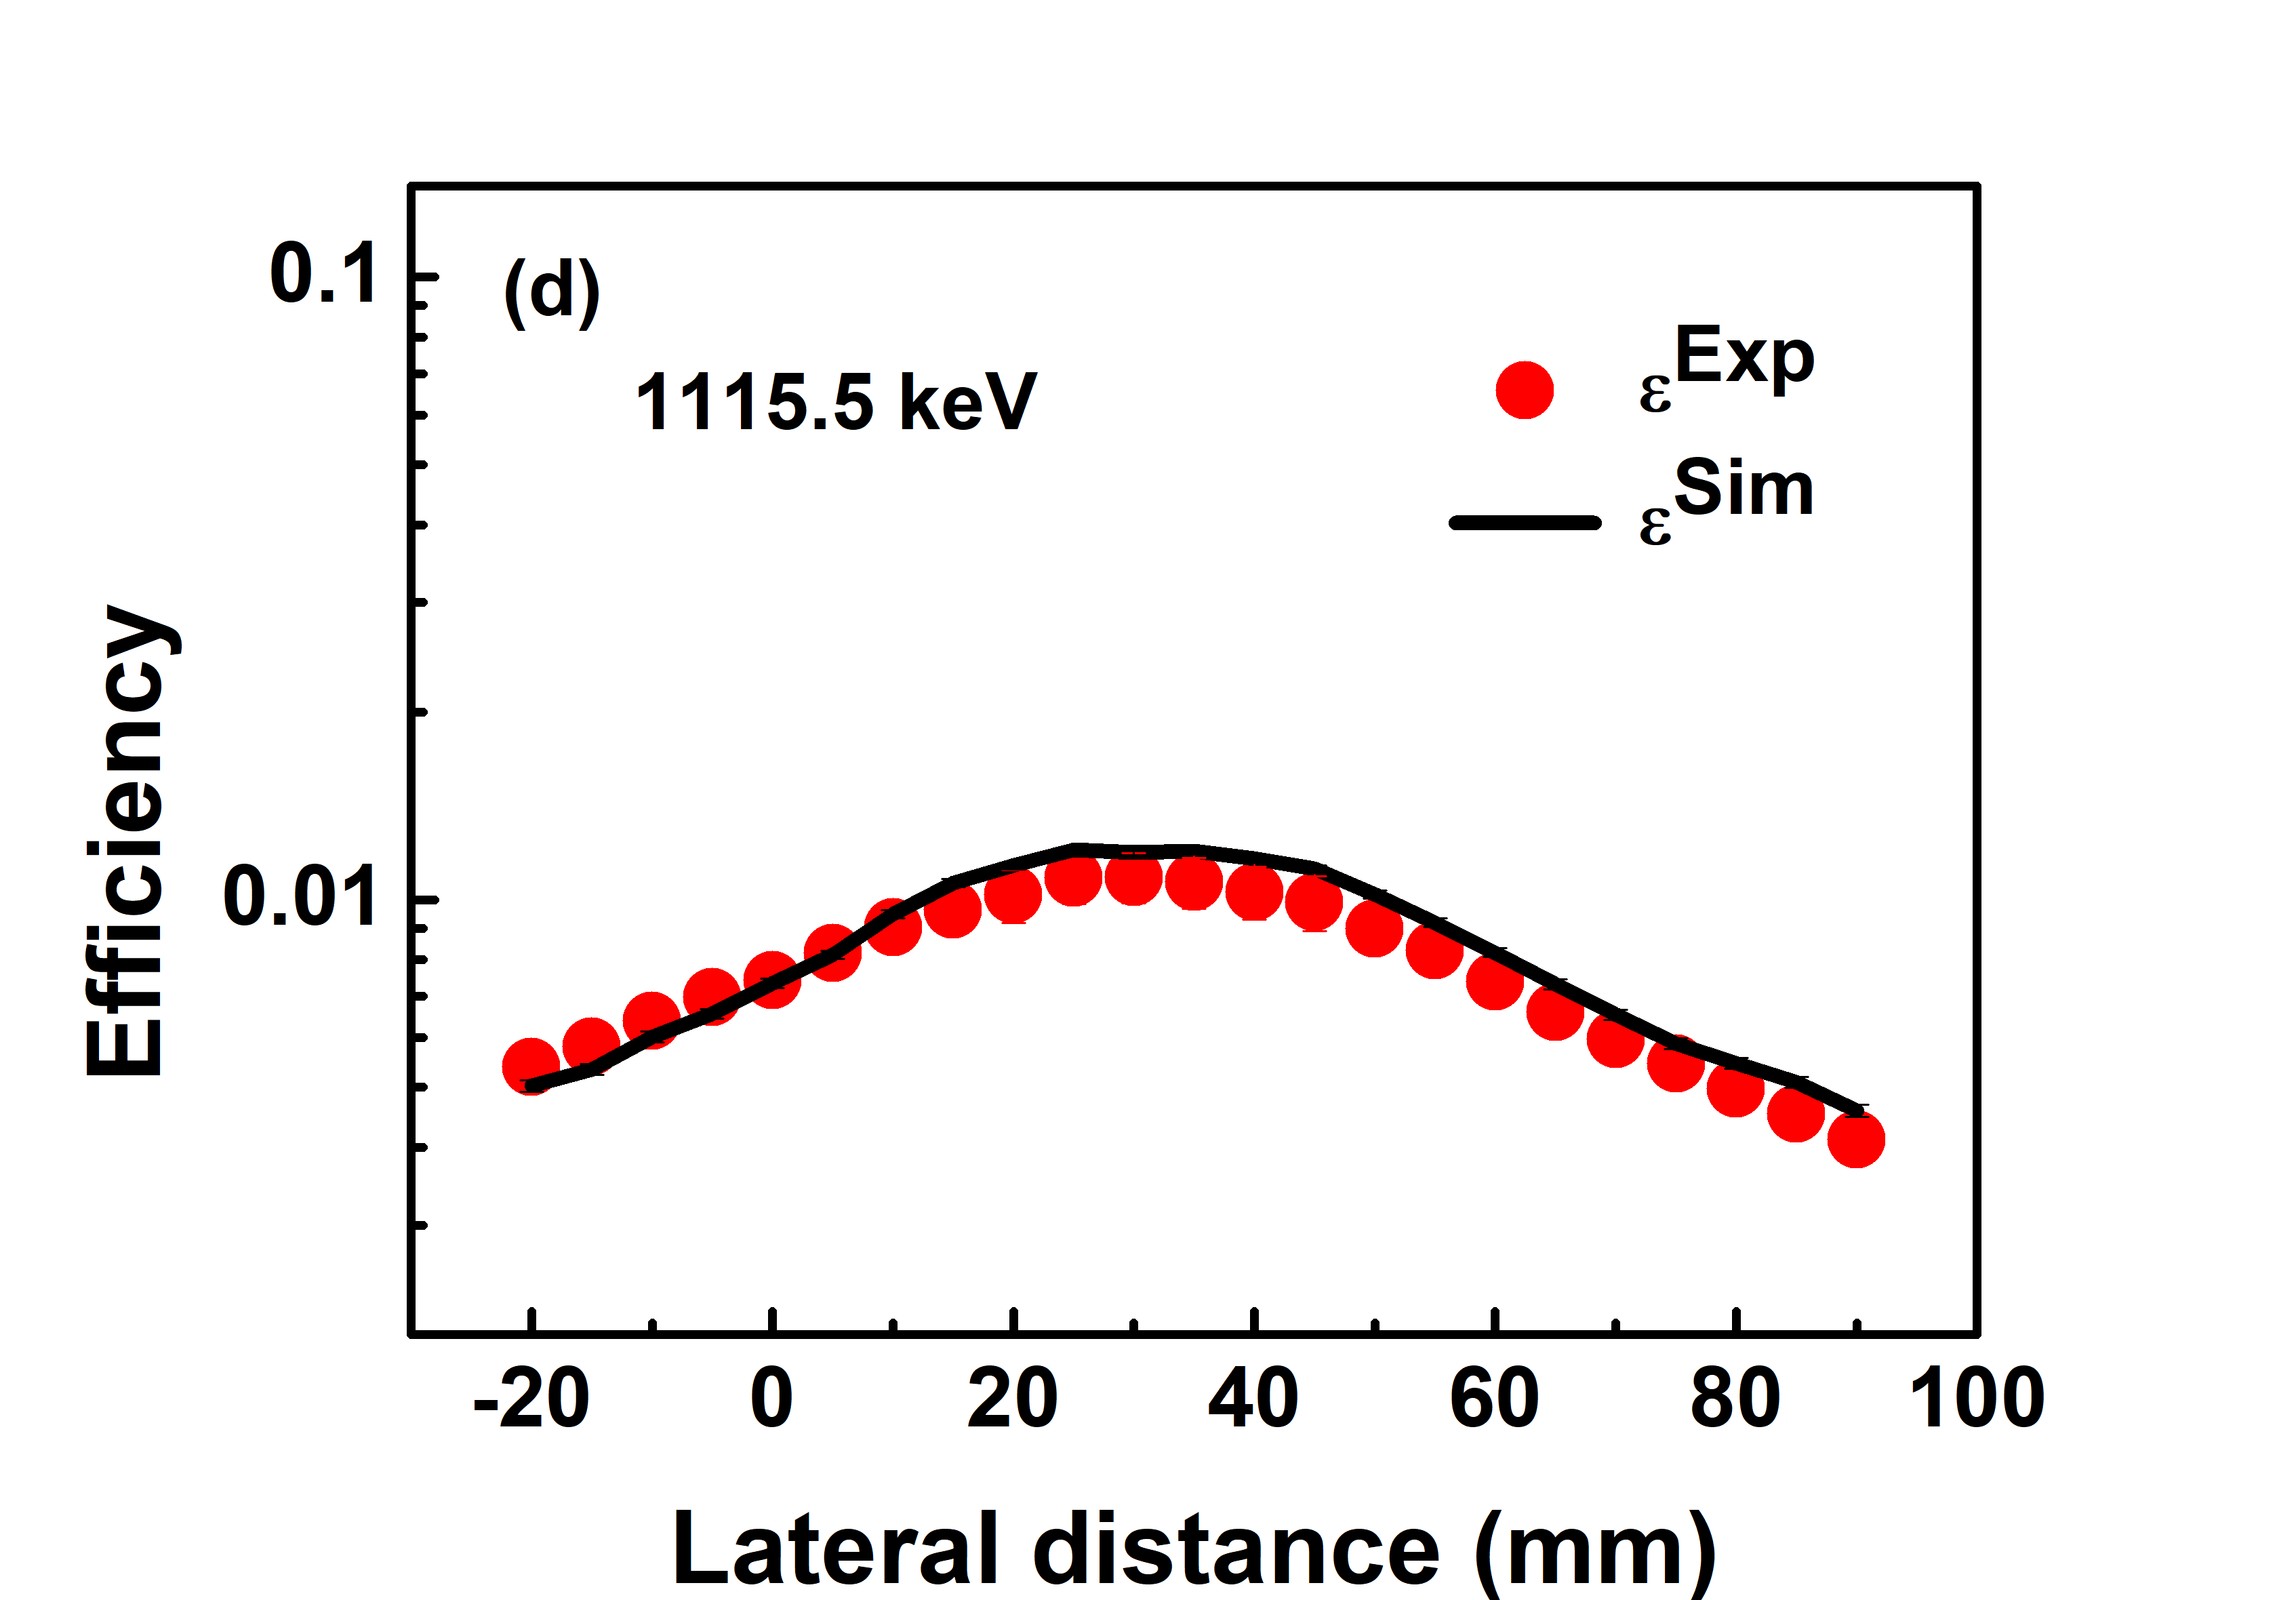
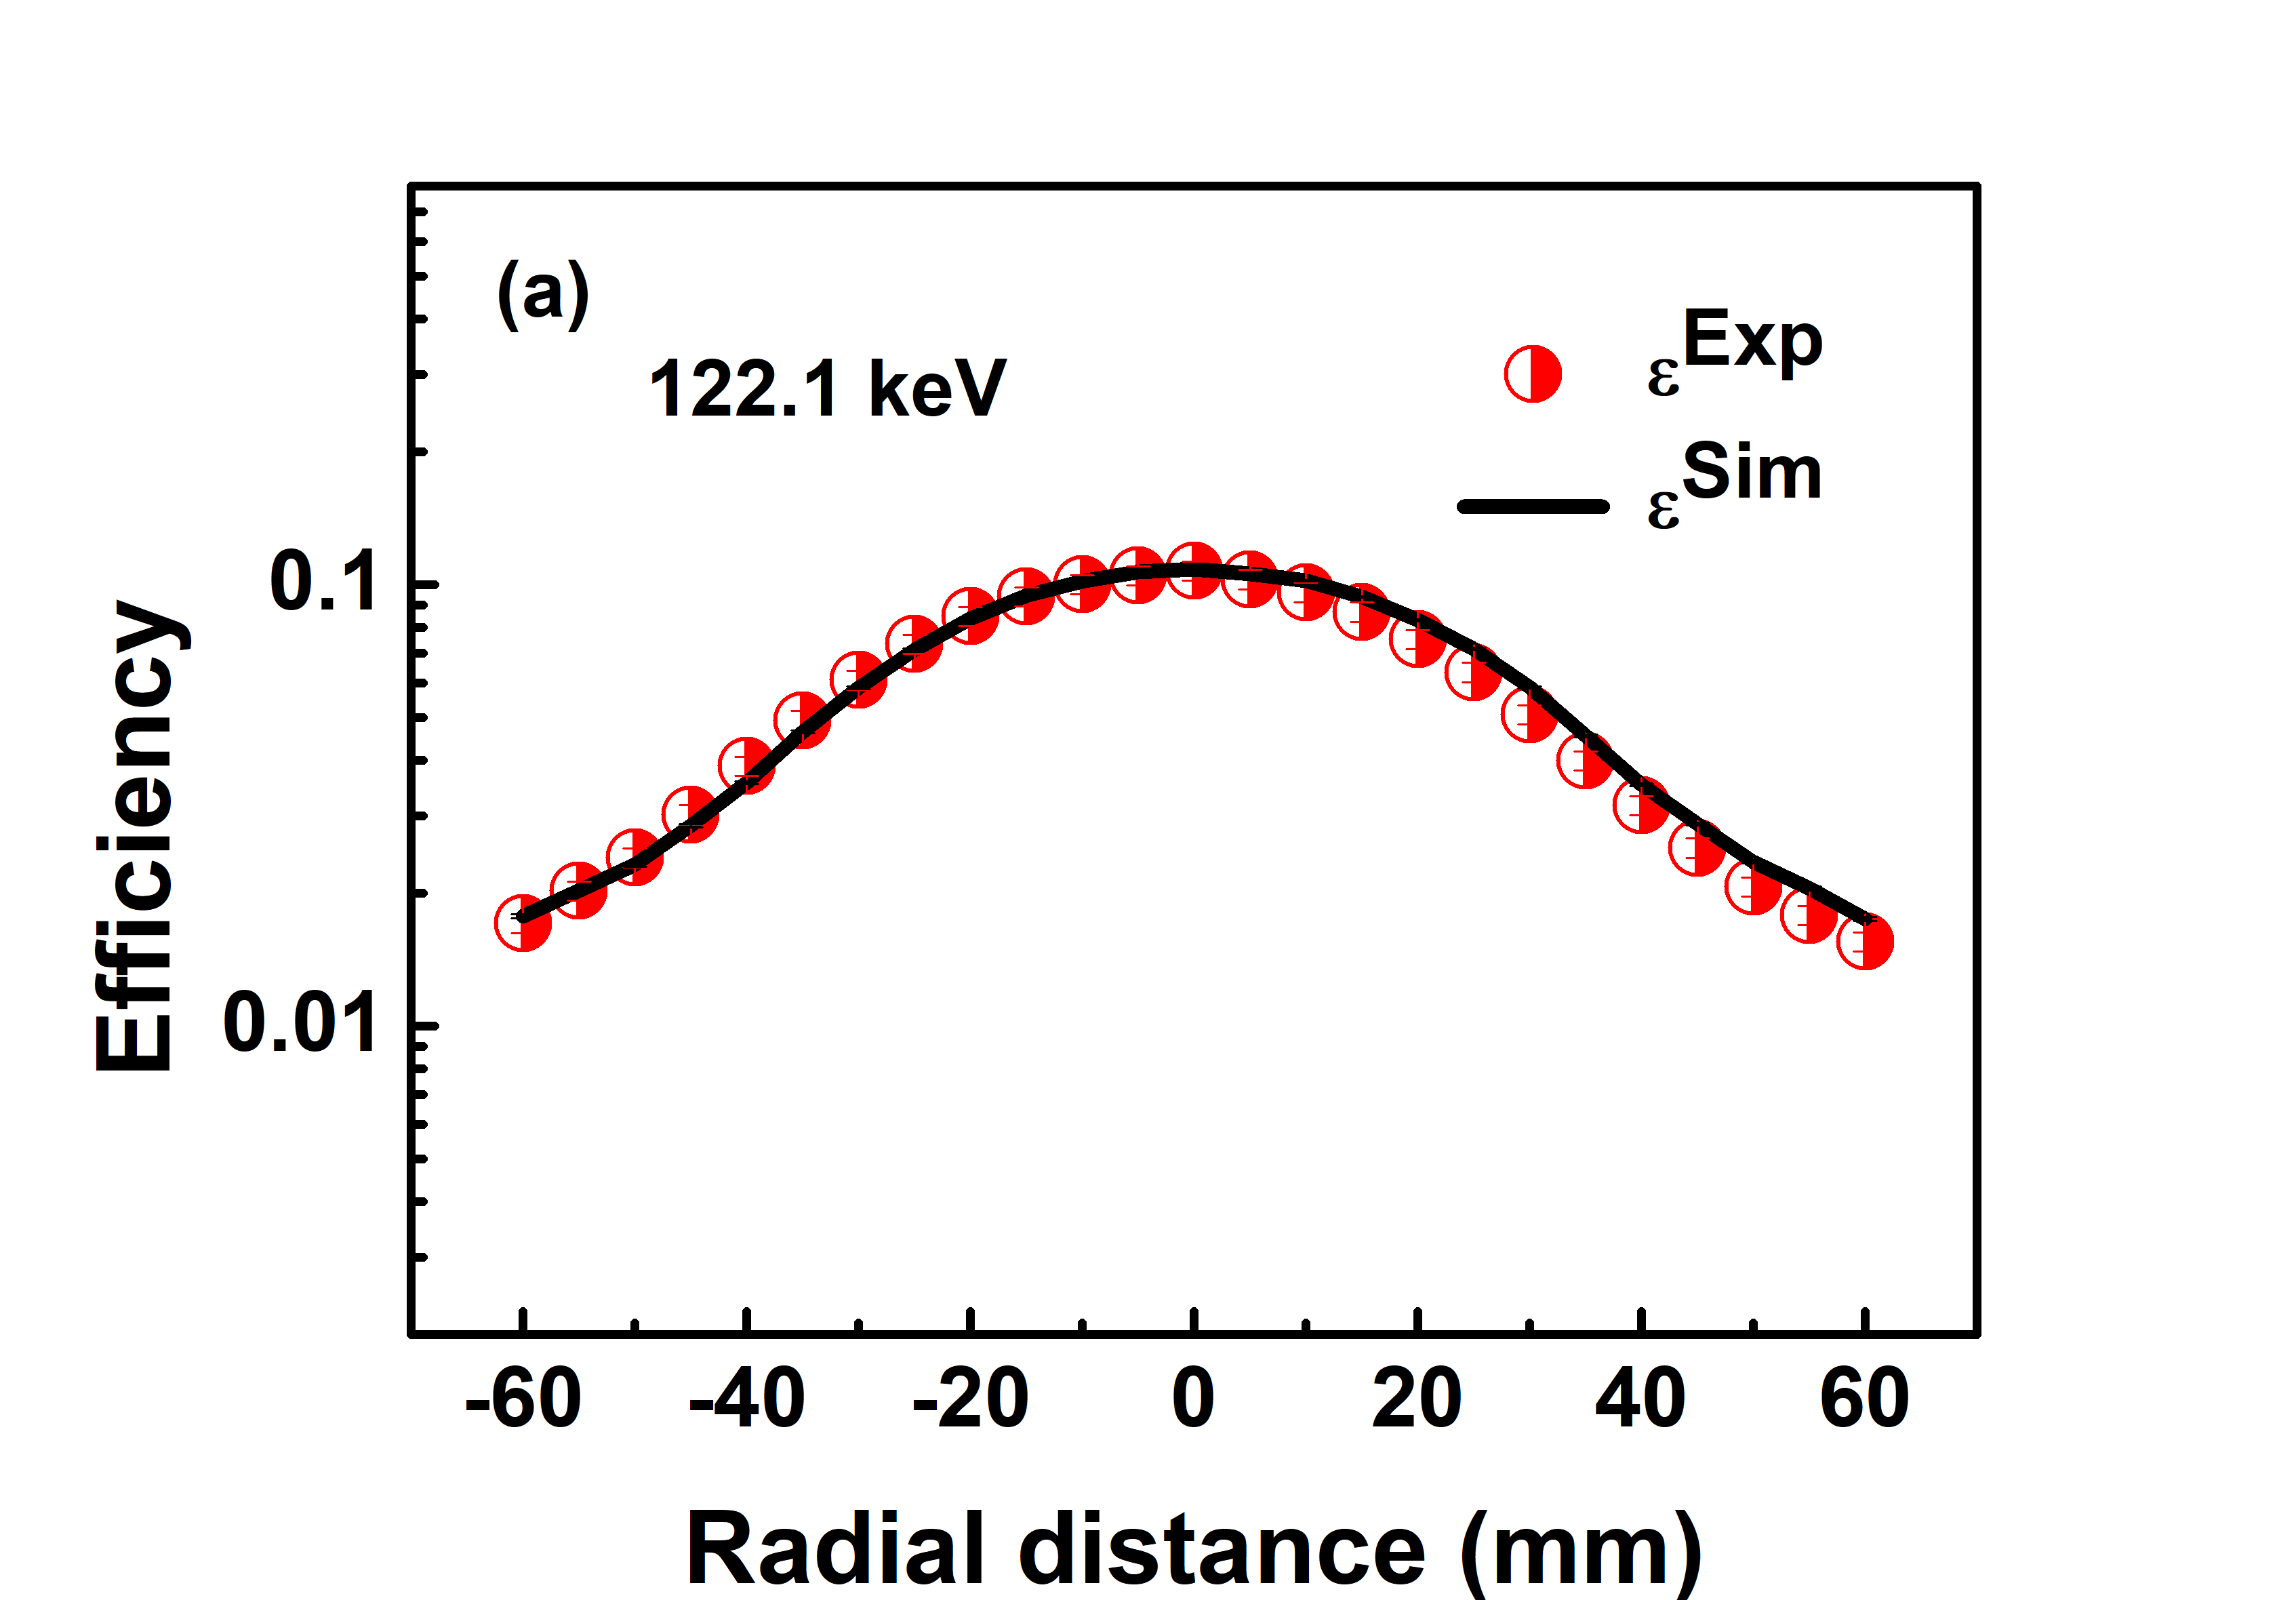
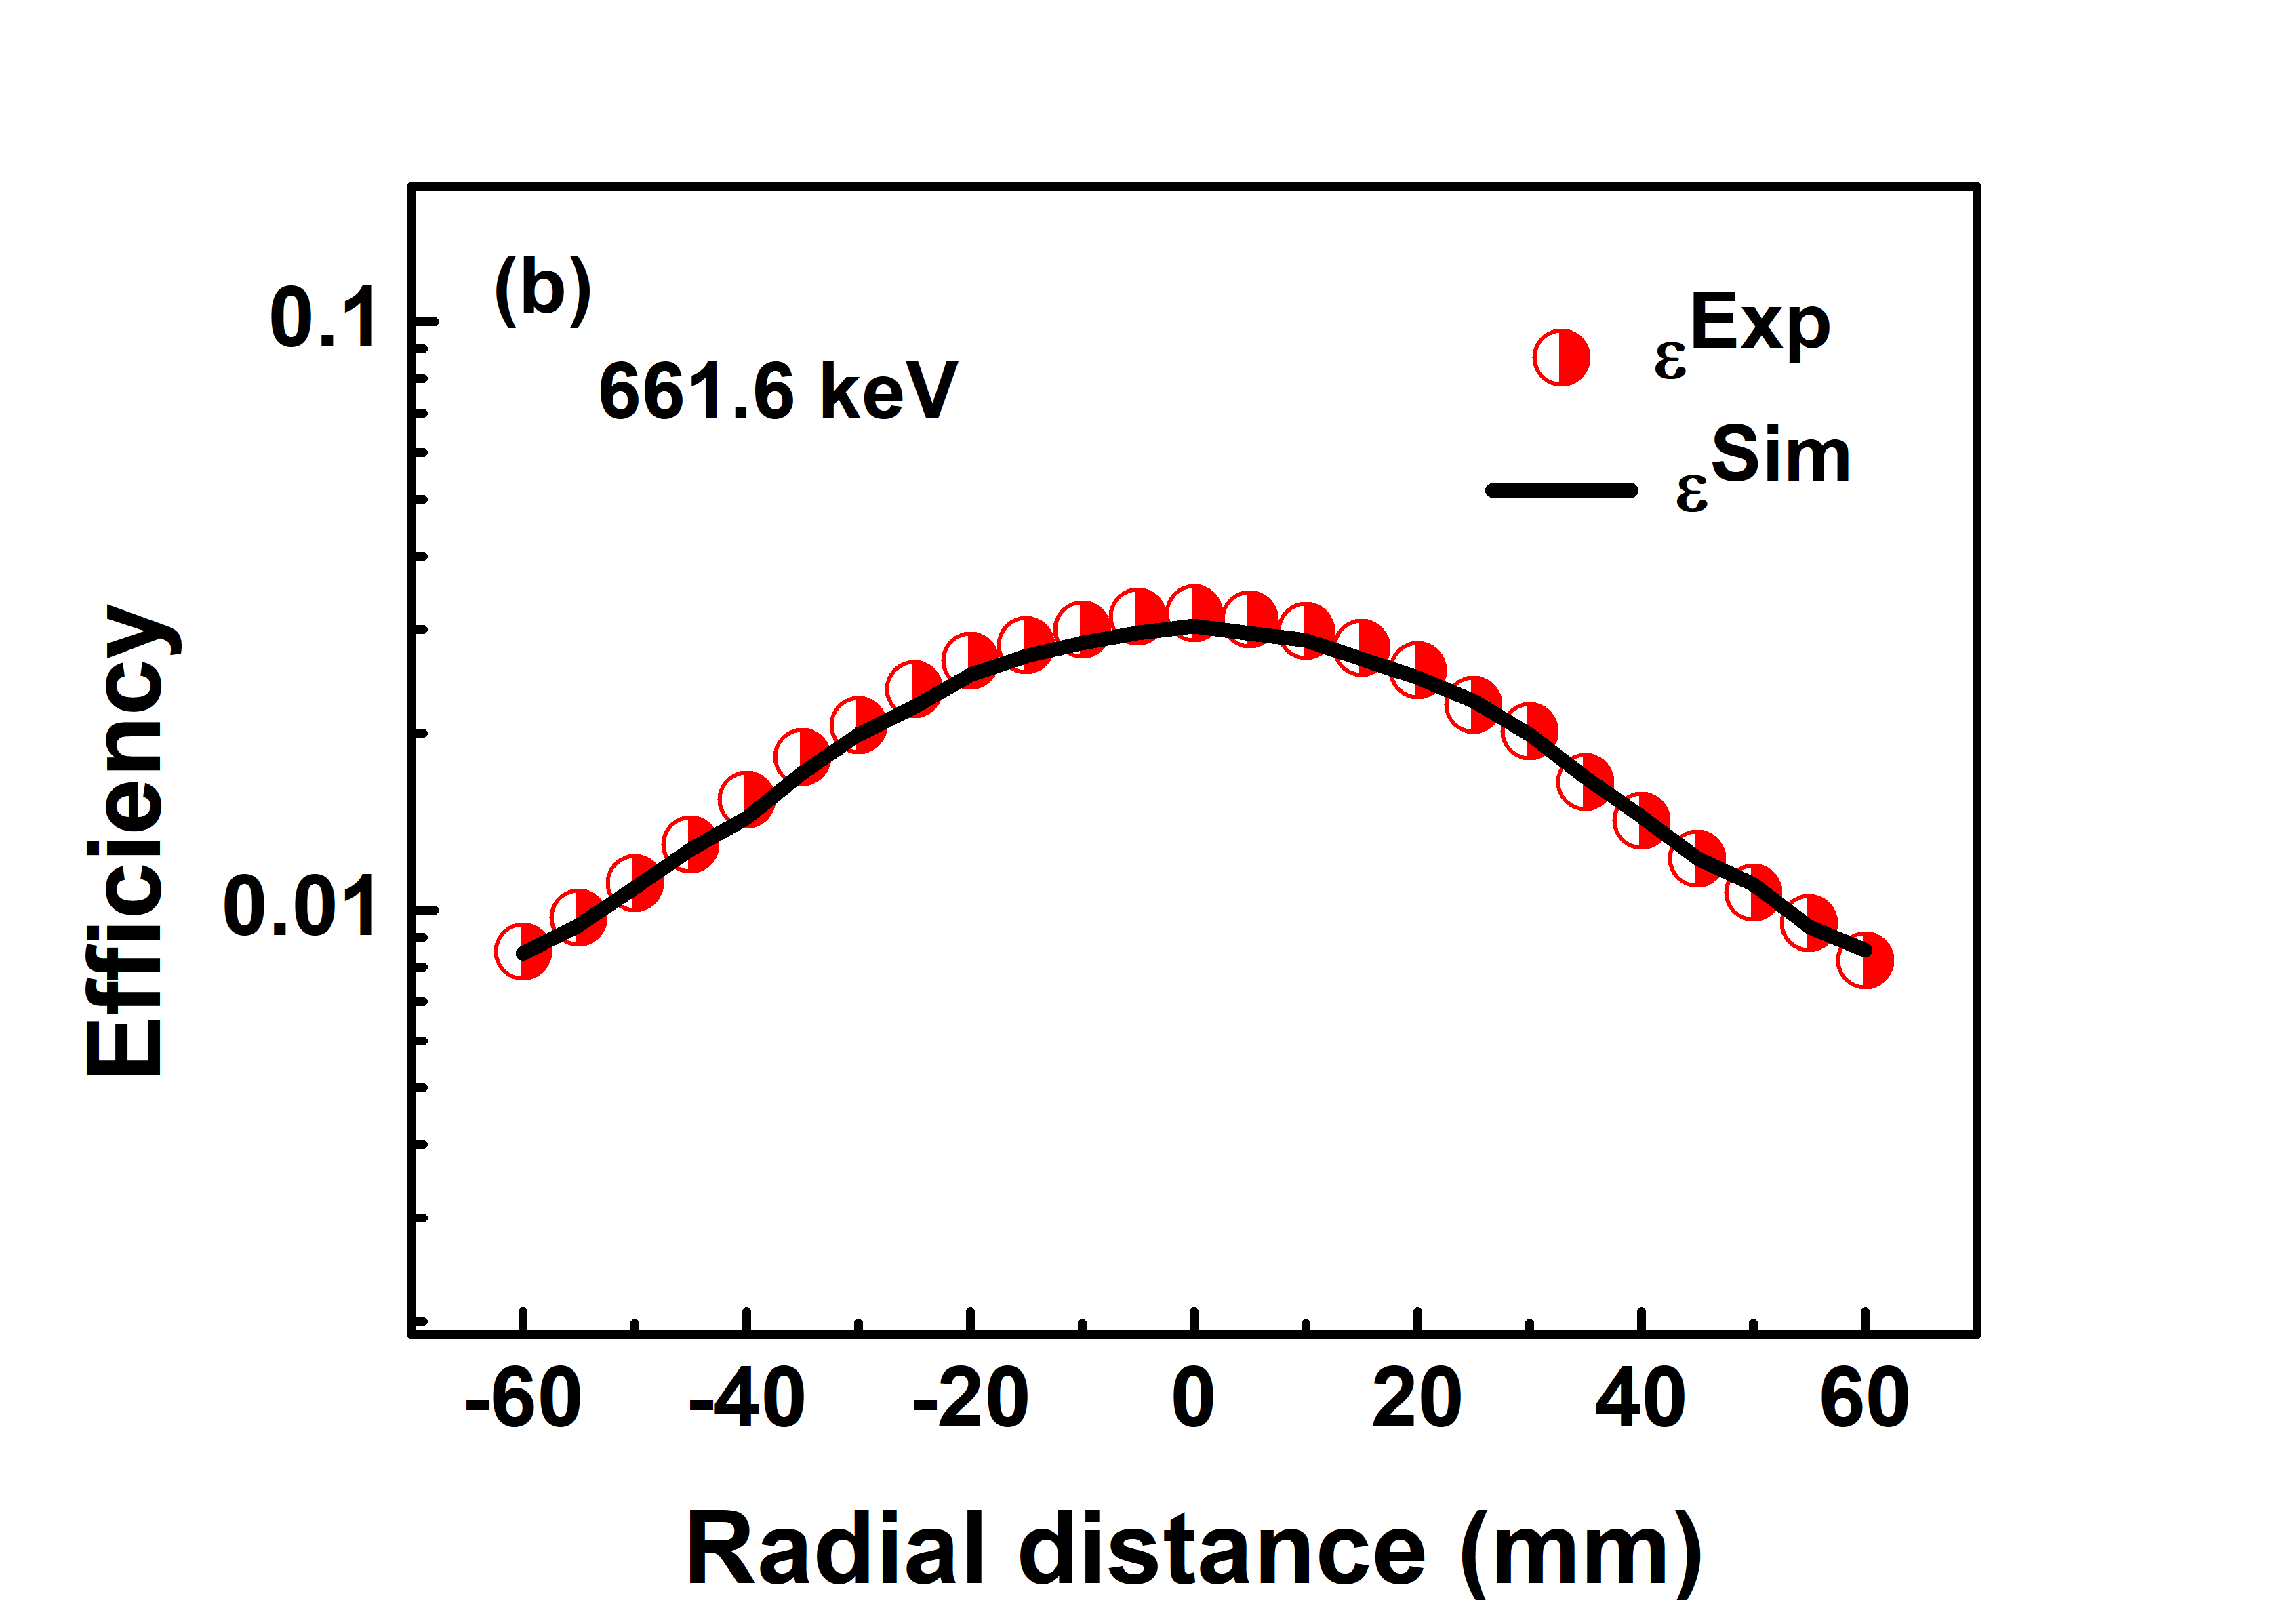
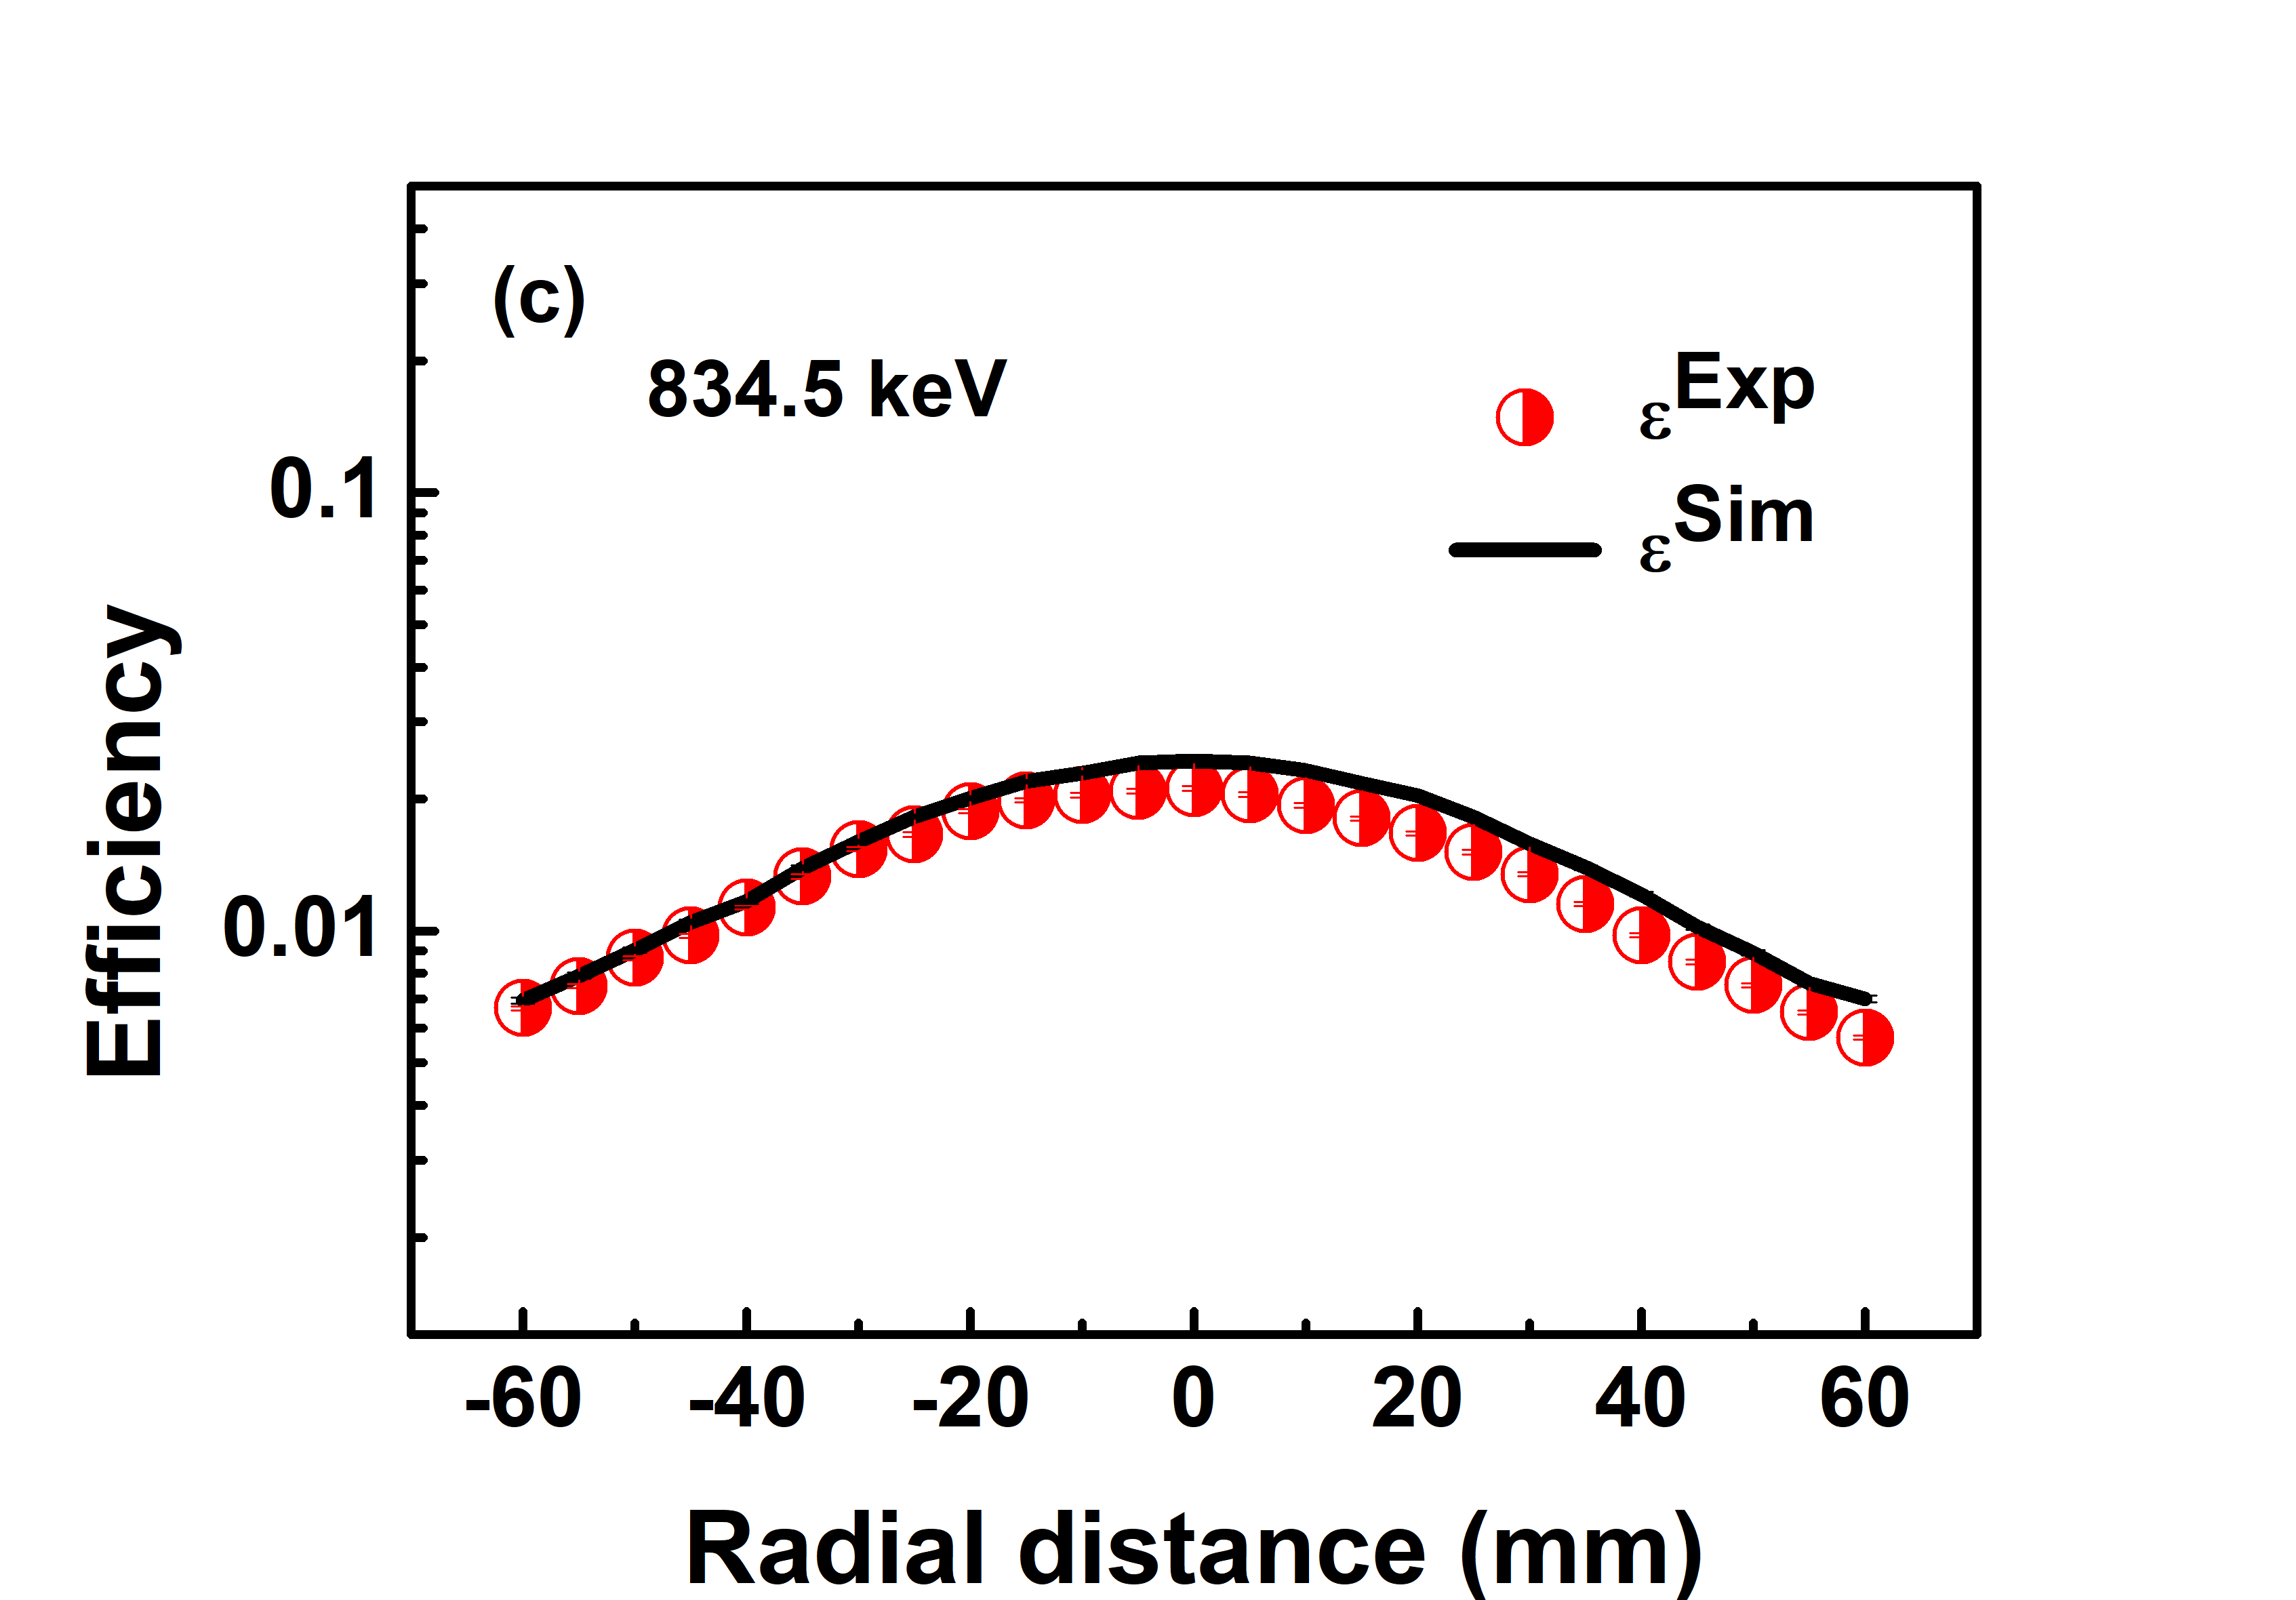
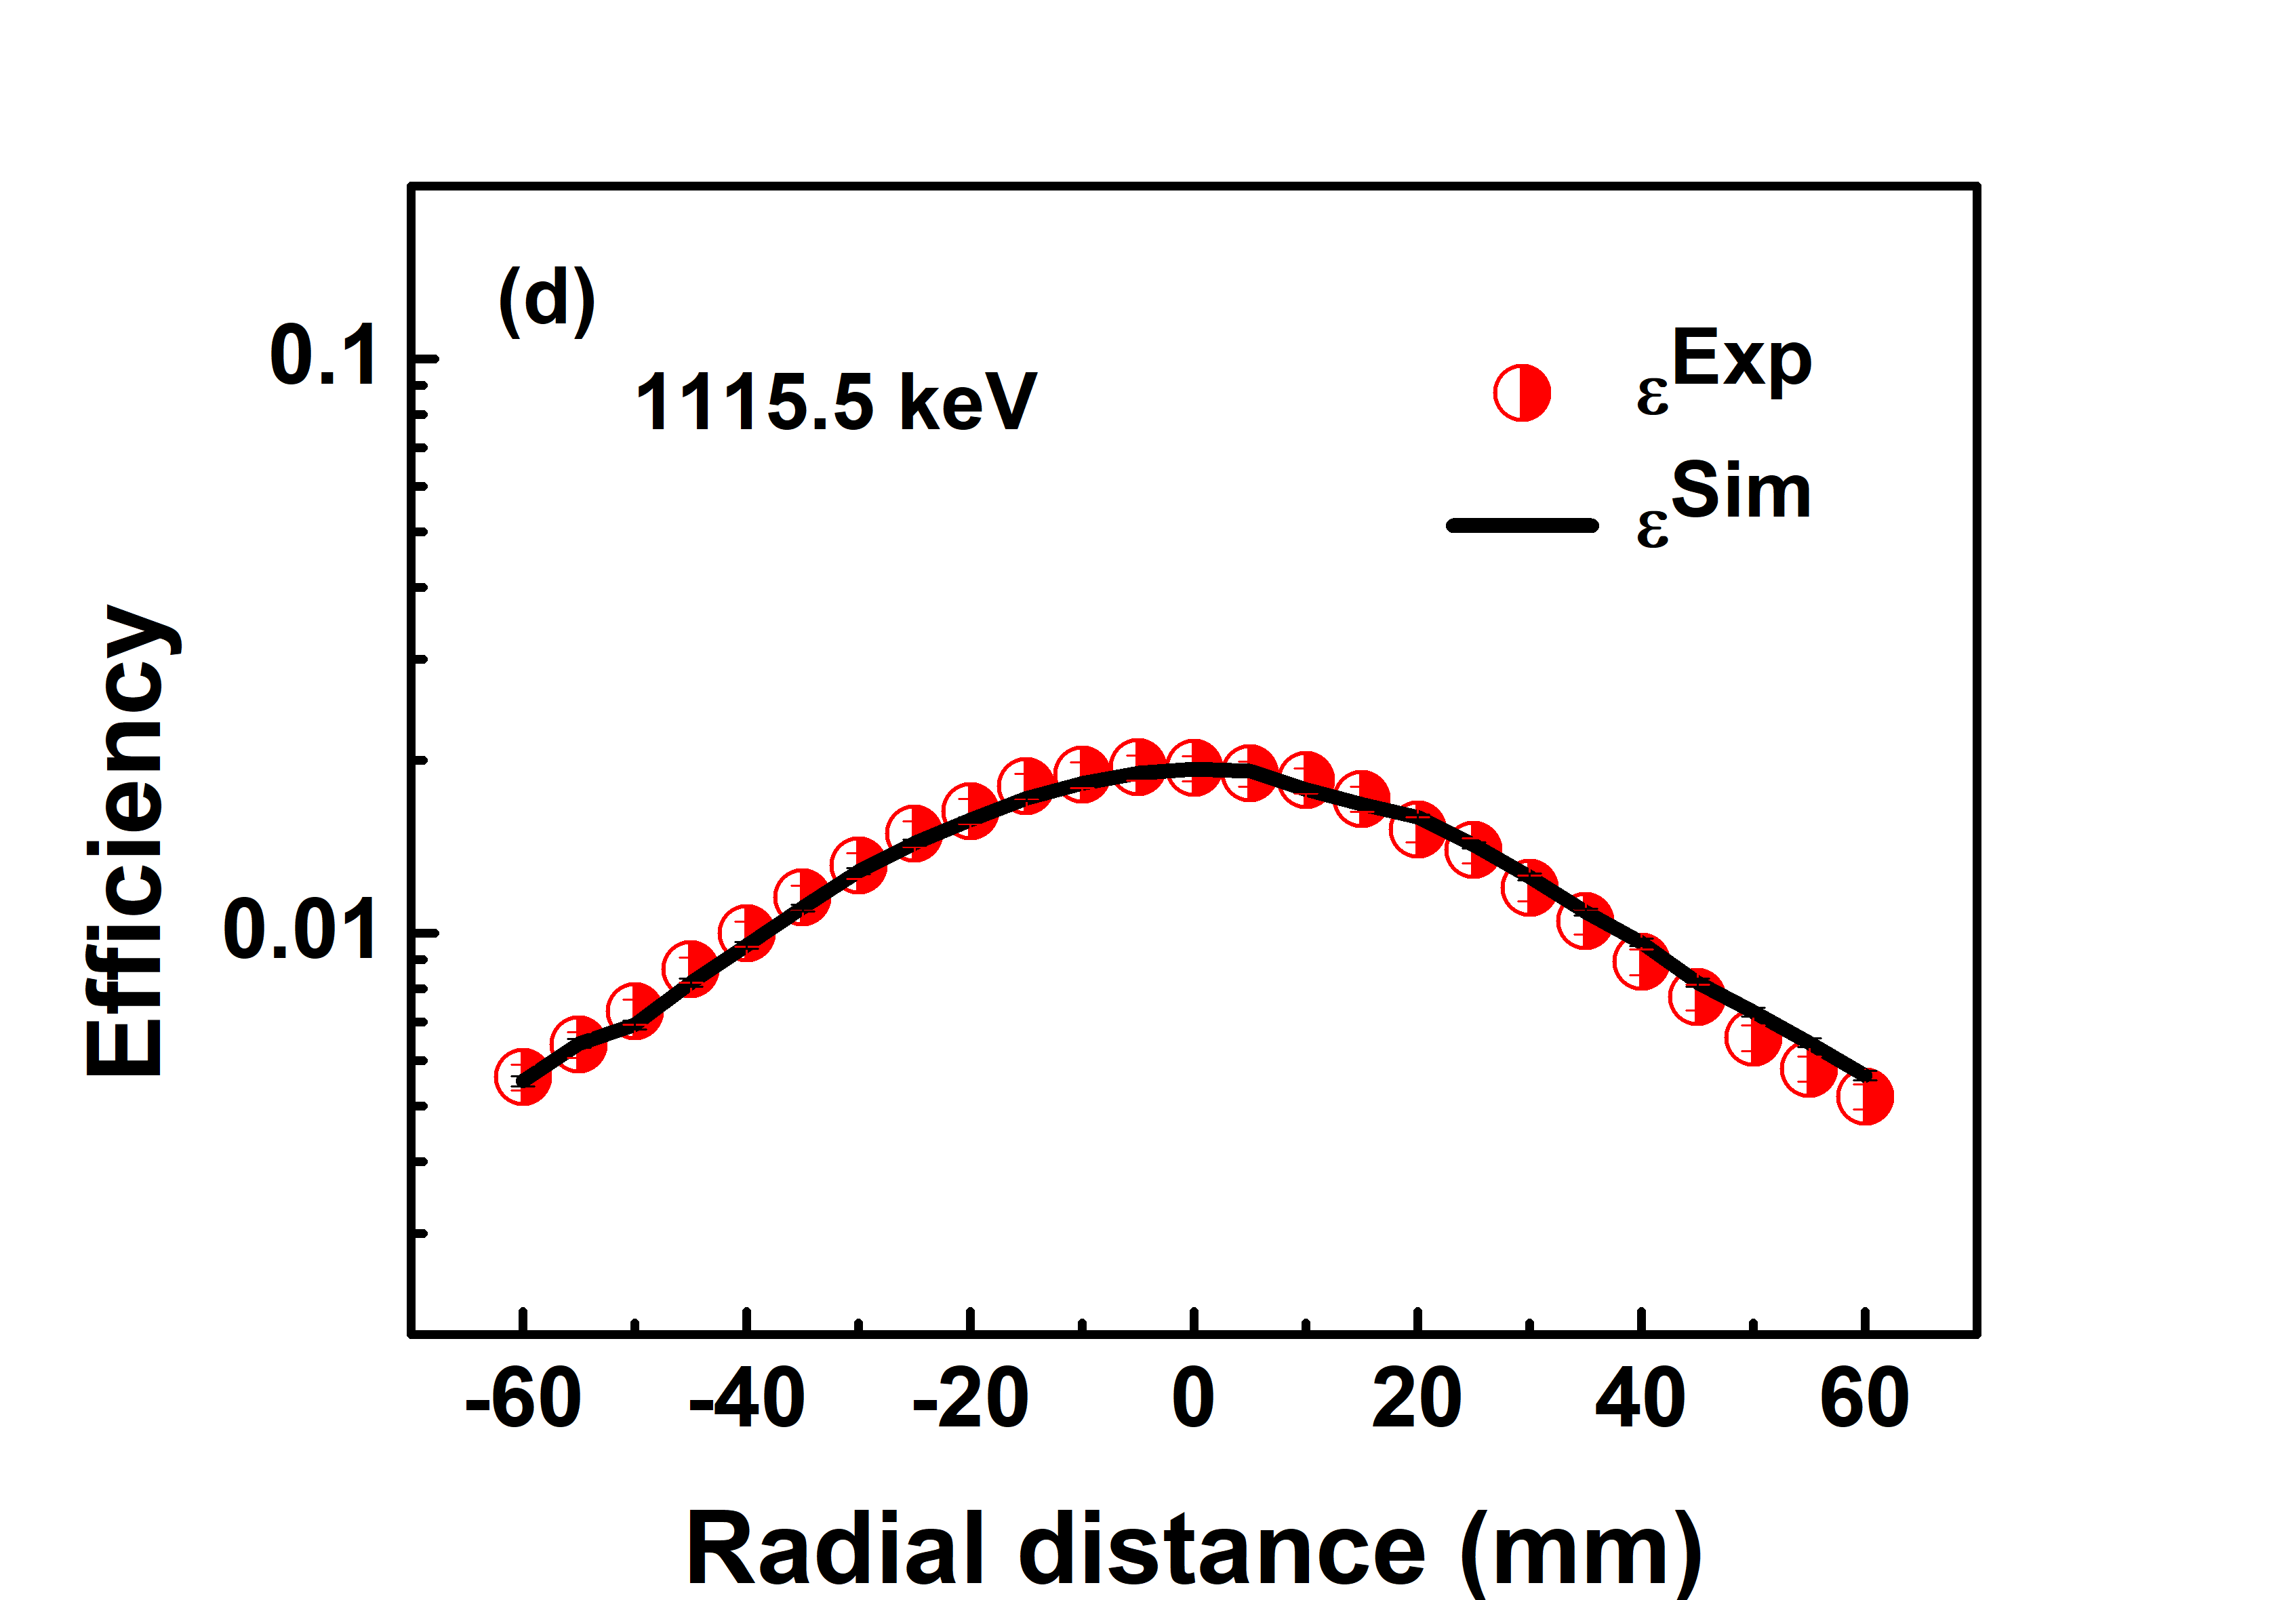
Radiography with X-rays and gamma-rays is used to determine the detector structure and its dimensions. However, an active volume may differ depending upon the electric field configuration inside the crystal [19, 20, 21]. In the present work, radiography is not possible, and hence mono-energetic gamma sources are used to scan the crystal in the energy range of 88-1332.5 keV. In order to characterize the detector geometry, three types of scans, namely, i) Distance scan, ii) Radial scan, and iii) Lateral scan, have been performed around the detector. The scanning schemes of the detector are demonstrated in Figure 2. The radial and lateral scans were carried out using 57Co, 60Co, 137Cs, 54Mn, 65Zn and 109Cd gamma sources, see Table 2 for the reference energies. The radial scan was performed by moving the source parallel to the top detector face at a distance of 10 mm from the top face of the detector endcap (Carbon fiber window) in the position steps of 5 mm. It covered a range of 6.5 cm w.r.t. the center of the detector. For the lateral scan, the gamma source was moved parallel to its cylindrical axis at a distance of 10 mm from the side face of the detector in 5 mm steps and covered a range of -2 cm to 9 cm again w.r.t. the detector endcap. The distance scan was performed with point-like sources at a regular interval from 5 cm to 30 cm along the axial symmetry axis away from the top face of the detector. Typical uncertainty in the positioning of the source in all scans is estimated to be 1 mm. Since some of the parameters are unknown or maybe not even related to the specific detector but are instead averaged over a set of detectors of the same or similar type, generic parameters offered by the manufacturer are typically insufficient. Therefore, parameters must be optimized. In order to determine the actual value of the parameters, optimizations are made to the crystal length (L), crystal radius (R), hole length (), front gap, and dead layers. Given relatively low source strengths, no pileup effects have been observed in the spectra. Errors associated with the photopeak efficiency were computed, including statistical and systematic errors. Typical errors obtained in the present work were estimated to be 0.2% in radial/lateral scans for = 88 keV, 0.5% for = 122.1 keV, 0.4% for = 661.7 keV and 0.1% for = 1115.5 keV. It should be noted that the statistical errors are mainly due to the difference in strengths of various sources and energy-dependent variation in detection efficiency. Similarly, scan errors in the experiment were 0.1% for the axial distances. Measurements were also performed with multi-gamma sources such as 60Co, 152Eu and 133Ba at z 10 cm to ensure that the coincidence summing is negligible. Data have been acquired for at least 10,000 counts for characterization measurements to reduce the statistical error to 1%. Detector dead time has been monitored throughout the measurement and maintained to be less than 1%. No significant worsening of energy resolution and shift in energy was observed at different times of long counting measurements of soil samples. The data of the background spectrum was recorded in a timestamp of 24 h. The raw data is then converted and analyzed using LAMPS [22] software. Each photopeak is fitted to the sum of Gaussian and second-order polynomials for a background to extract the net photopeak area.
| Compound | Mass fraction | Compound | Mass fraction |
| SiO2 | 0.5890 | K2O | 0.0325 |
| Al2O3 | 0.1625 | Na2O | 0.0235 |
| Fe2O3 | 0.1340 | MgO | 0.0135 |
| CaO | 0.0360 | TiO2 | 0.0090 |
3 Results and Analysis
3.1 Spectroscopic performance of the detector
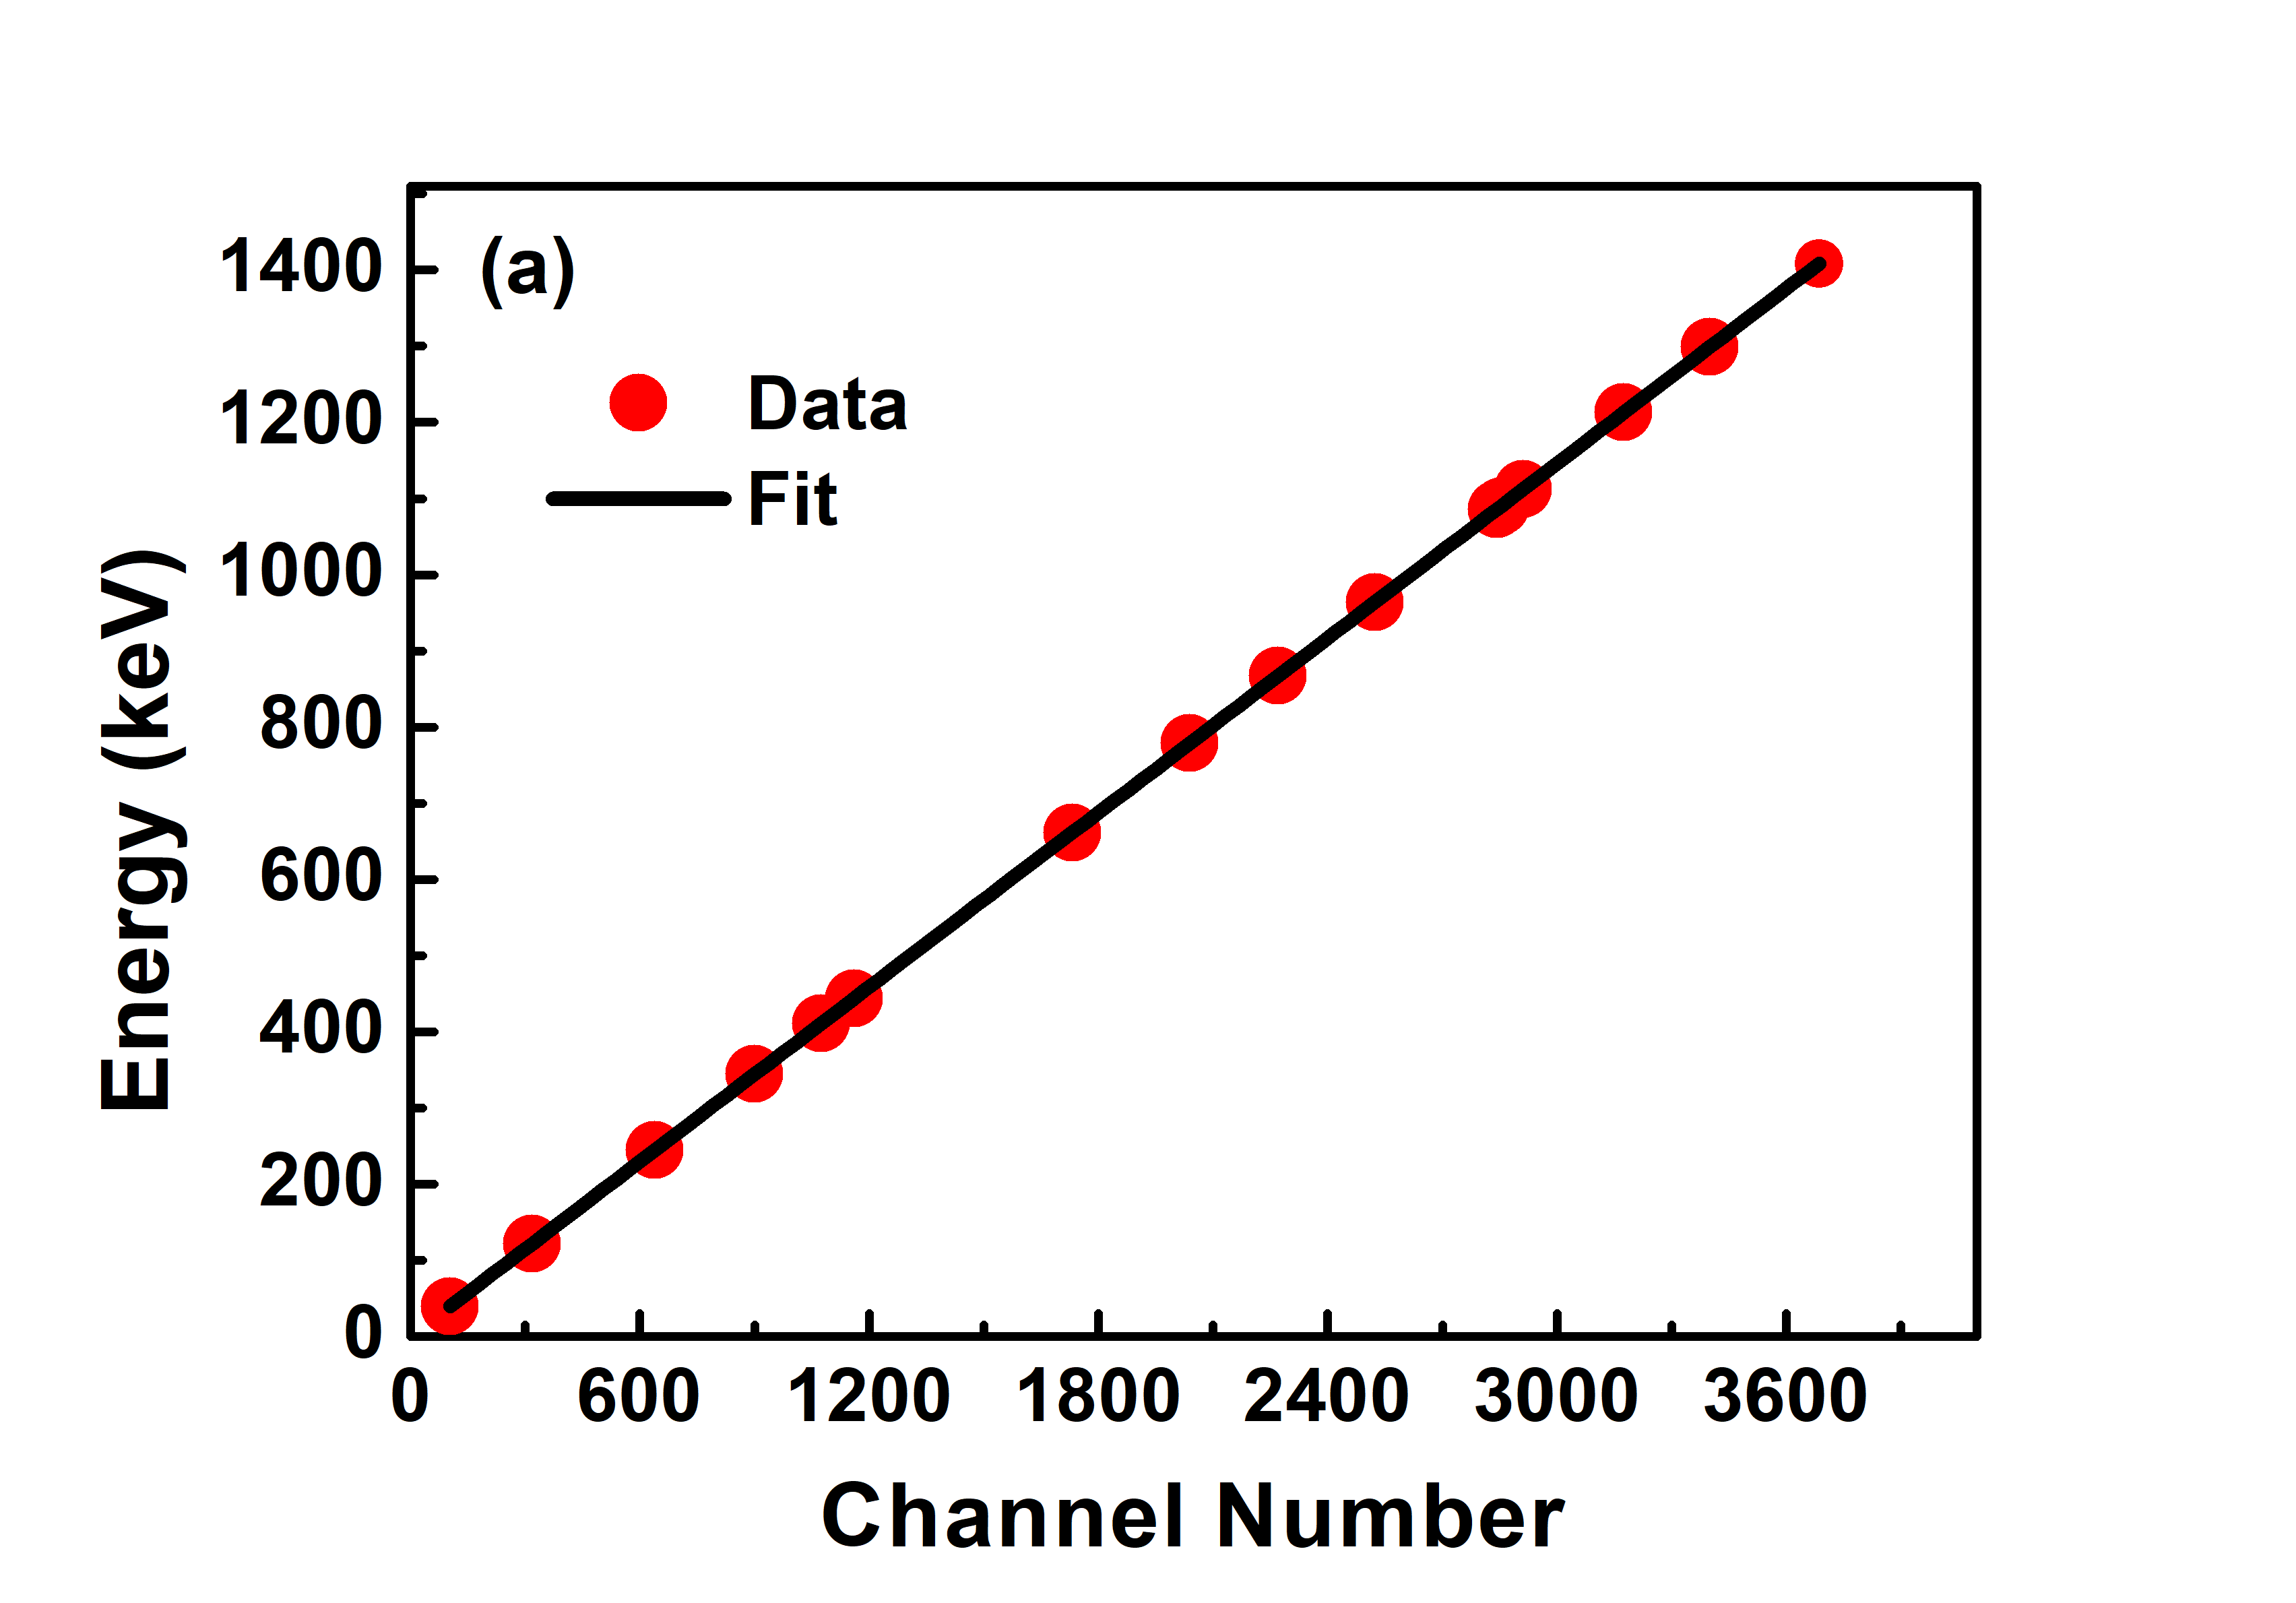
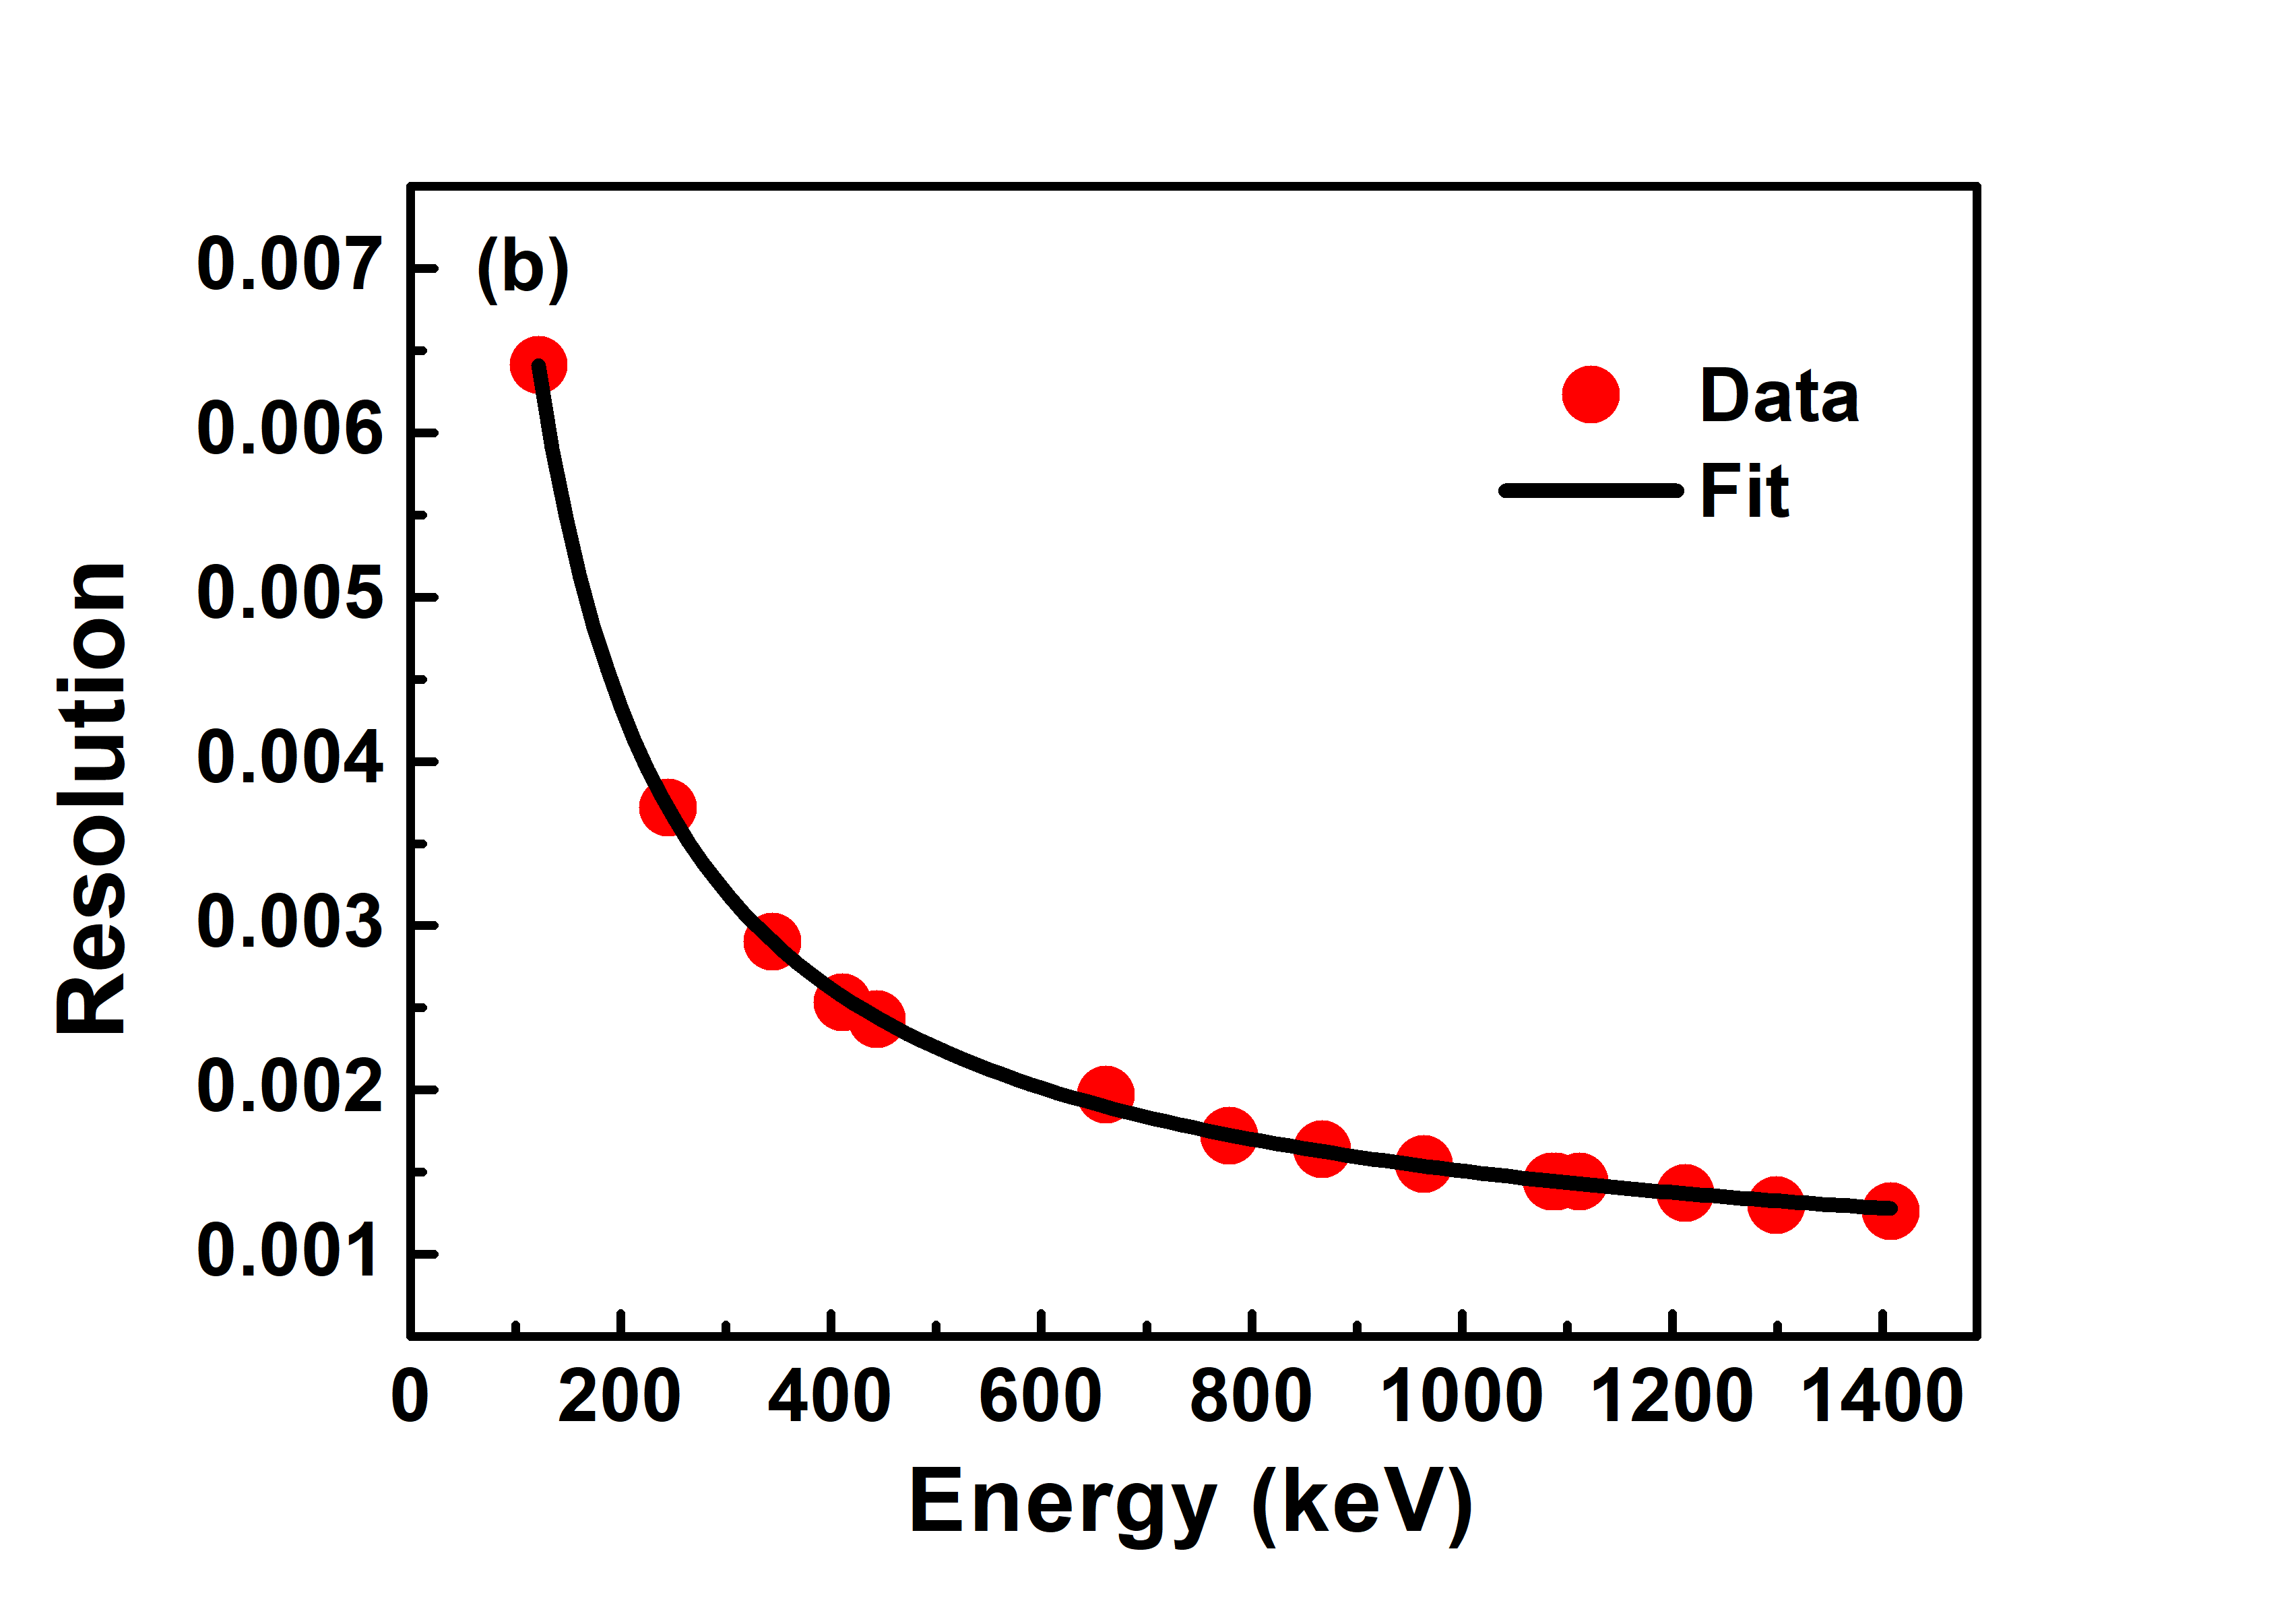
The accuracy of the measurements depends profoundly on the performance and stability of the detector and associated electronics. Different characteristics of the HPGe detector, such as energy calibration and resolution, peak shape and Peak-to-Compton ratio (P/C), Full energy peak efficiency (FEPE), and Figure of Merit (FoM), are determined as a function of gamma-ray energies against the warranted values provided by the manufacturer. The radioactive gamma sources used in the scanning of the detector are given in Table 2. For the present HPGe detector, R.E. was found to be 33 (0.3)% in the laboratory test, which is 6% lower than the measured value provided by the manufacturer. The HPGe detector has been calibrated using different standard gamma sources and shown in Figure 3 (a). The line through the data points represents a fitting function of type y = a + , where a = 0.4 0.03 and b = 0.38185 1.59279 . As can be noticed from this figure, a good linear relationship with the channel number can be observed. The statistical correlation coefficient is found to be 1 for each measured data point with the detector. The energy resolution measures the width (FWHM) of a single energy peak at a specific energy, usually expressed in keV for germanium detectors. It may be pointed out that the typical energy resolution of NaI and HPGe detectors are found to be 50 keV and 1.5 keV at 1332.5 keV, respectively [24]. Hence, HPGe is preferred over NaI detectors for high-resolution gamma-ray spectroscopy, even though the NaI is likely to have greater counting efficiency. Generally, the energy resolution of a detector is expressed as the ratio of FWHM to the gamma-ray energy. The distribution of energy resolution with different gamma-rays is shown in Figure 3 (b) and fitted to an empirical three-parameter function of type,
| (1) |
The best-fit values to the fitted parameters A, B, and C are 0.4 0.03, 0.9 0.01 and 6.42229 3.43594 , where A and B are in keV. The typical energy resolution of this detector at 1332.5 keV is 1.72 keV and found to be similar to another LN2 based HPGe detector of similar relative efficiency present in the laboratory. No worsening of the energy resolution has been observed over the running period of about five years. In addition to the FWHM taken at each peak, the full width at one-fifth maximum (FW.2M), full width at one-tenth maximum (FW.1M), and full width at one-fiftieth maximum (FW.02M) are also recorded to check for the worsening of the tail.
|
The peak-to-Compton ratio has been measured from the same gamma line, 1332.5 keV, which has been used for the resolution measurement obtained from 60Co source. The value of this ratio was measured at various axial distances, and the mean value of the peak-to-Compton ratio was found to be 62:1, following the manufacturer data.
The efficiency calibration of a spectrometer is of great importance in analyzing radionuclides of interest. Different physical parameters, such as; the crystal volume and shape, source dimensions, gamma-ray absorption cross-section, attenuation layers in front of the detector, and the distance and position from the source to the detector, determine the efficiency of the detector [19, 20, 25]. Absolute efficiency, also known as full energy peak efficiency (FEPE), is defined as the ratio of the number of photopeak counts detected to the total number emitted by the source and can be determined according to the following equation:
| (2) |
Where Nγ is the net photopeak area (background subtracted), Aγ is the present activity of source (Bq), Iγ is the gamma-ray emission probability. t is the time elapsed (taking into account the analyzer counting losses). Figure 4 shows the efficiency measurements for all the considered gamma-ray energies at a distance of 25 cm.
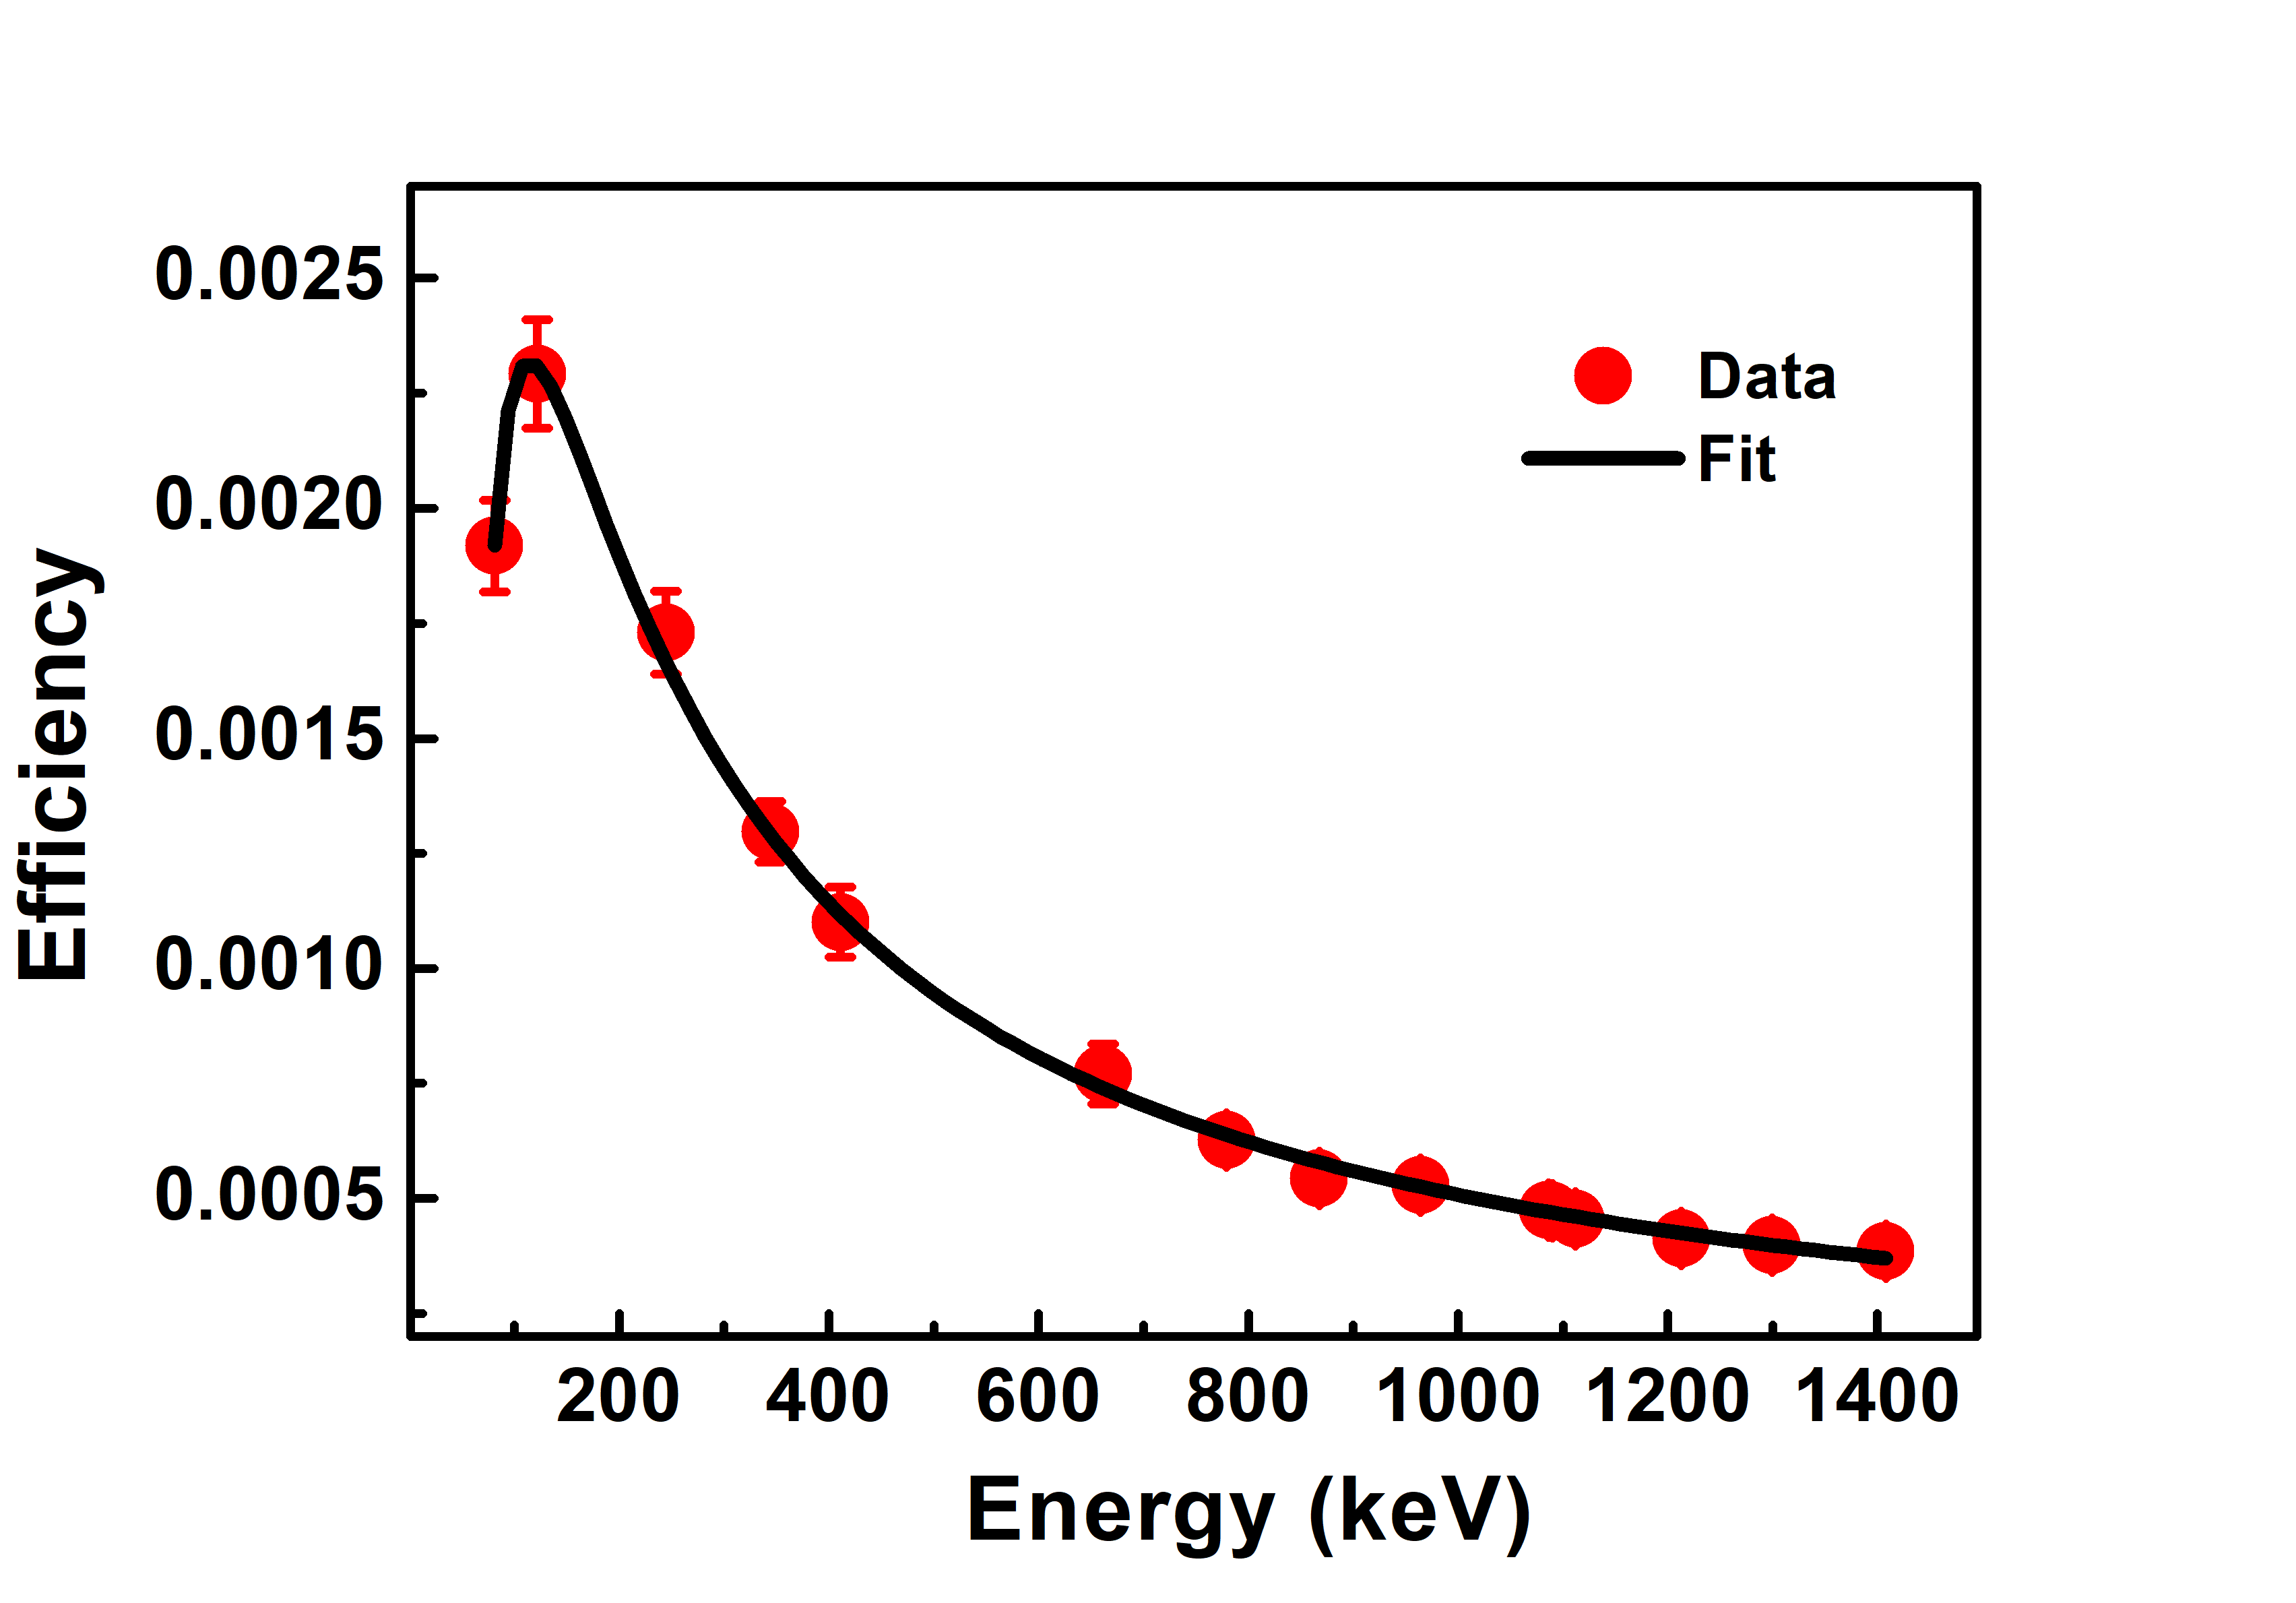
The quoted errors may be due to the number of counts in the photopeak (statistical) and source activities (systematic). As shown in Figure 4, the solid line through the data points represents the best fit to the data. The efficiency curve is fitted using an inverse square fitting function of type,
| (3) |
where is the photopeak efficiency, and E is the gamma-ray energy. The best-fit values to the fitted parameters A, B, and C are found to be 1.23209 0.91263 , 0.5 0.01 and -30 1. The fitting function yields good approximations over different energy ranges and for different crystal sizes. As can be noticed from the figure, some fluctuations in the data points are primarily due to variations in peak shape and low count rates. The HPGe detector has a closed-end coaxial configuration of p-type material and a thick attenuation layer at the detector entrance contact. Correspondingly, the detector’s efficiency was found to be less for low energy gamma-rays below 80.9 keV as clearly visible in Figure 4. The efficiency curve shows a rapid increase from 80.9 keV of 133Ba source, peaks at 121.8 keV of 152Eu, and sharply decreases as a result of an increase in gamma-ray energy. This implies that the efficiency is maximum at low energy and decreases exponentially at higher emitted gamma-rays consistent with similar detectors by ORTEC [17]. The efficiency curve demonstrates the excellent performance of the measurements and analysis applied in this work. Measurement of photopeak efficiencies using the above radioactive sources can help better estimate the detector’s active volume and surrounding materials.
3.2 Detector modelling
The Monte Carlo simulation program was developed using the GEANT4 framework (version 4.10.00.p02). The photopeak efficiencies have been estimated directly by determining the energy deposition in the simulated volume of the detector. The source-detector geometry, as shown in Figure 2, has been implemented using the information provided by the manufacturer. The primary particles were generated from the input files using G4ParticleGenerator class. The 106 photons were generated uniformly from the radioactive source to keep the statistical error below 1%. The photons cutoff energy was set at 1 keV using the electromagnetic processes PhysicsList. The energy calibration obtained from the experiments has been utilized to set up the energy bins in the simulated spectra. In order to avoid summing effects, the photopeak efficiencies were calculated using the mono-energetic sources at close distances. The photons that entirely lose their energy in the active volume of the detector are taken into account for evaluating photopeak efficiencies. The efficiency at the given energy was calculated by generating the histogram for a number of events against the energy deposited inside the active volume of the crystal. The simulation results have been analyzed using the ROOT data analysis framework. The simulated photopeak efficiency () has been determined from the stored energy histograms using the following equation,
| (4) |
Where Nc is the number of photons that deposited energy in the crystal after the background elimination and Ng is the number of photons generated. The relative deviations (R) between simulated and experimental photopeak efficiencies were calculated using equation 5, where n is the total number of data points in each set corresponding to a specific energy and represents the individual data points in the data set.
| (5) |
Equation 6 defines the total relative deviation (), where m is the number of data sets that correspond to the various energy scans and is the relative deviation corresponding to the different energies.
| (6) |
|
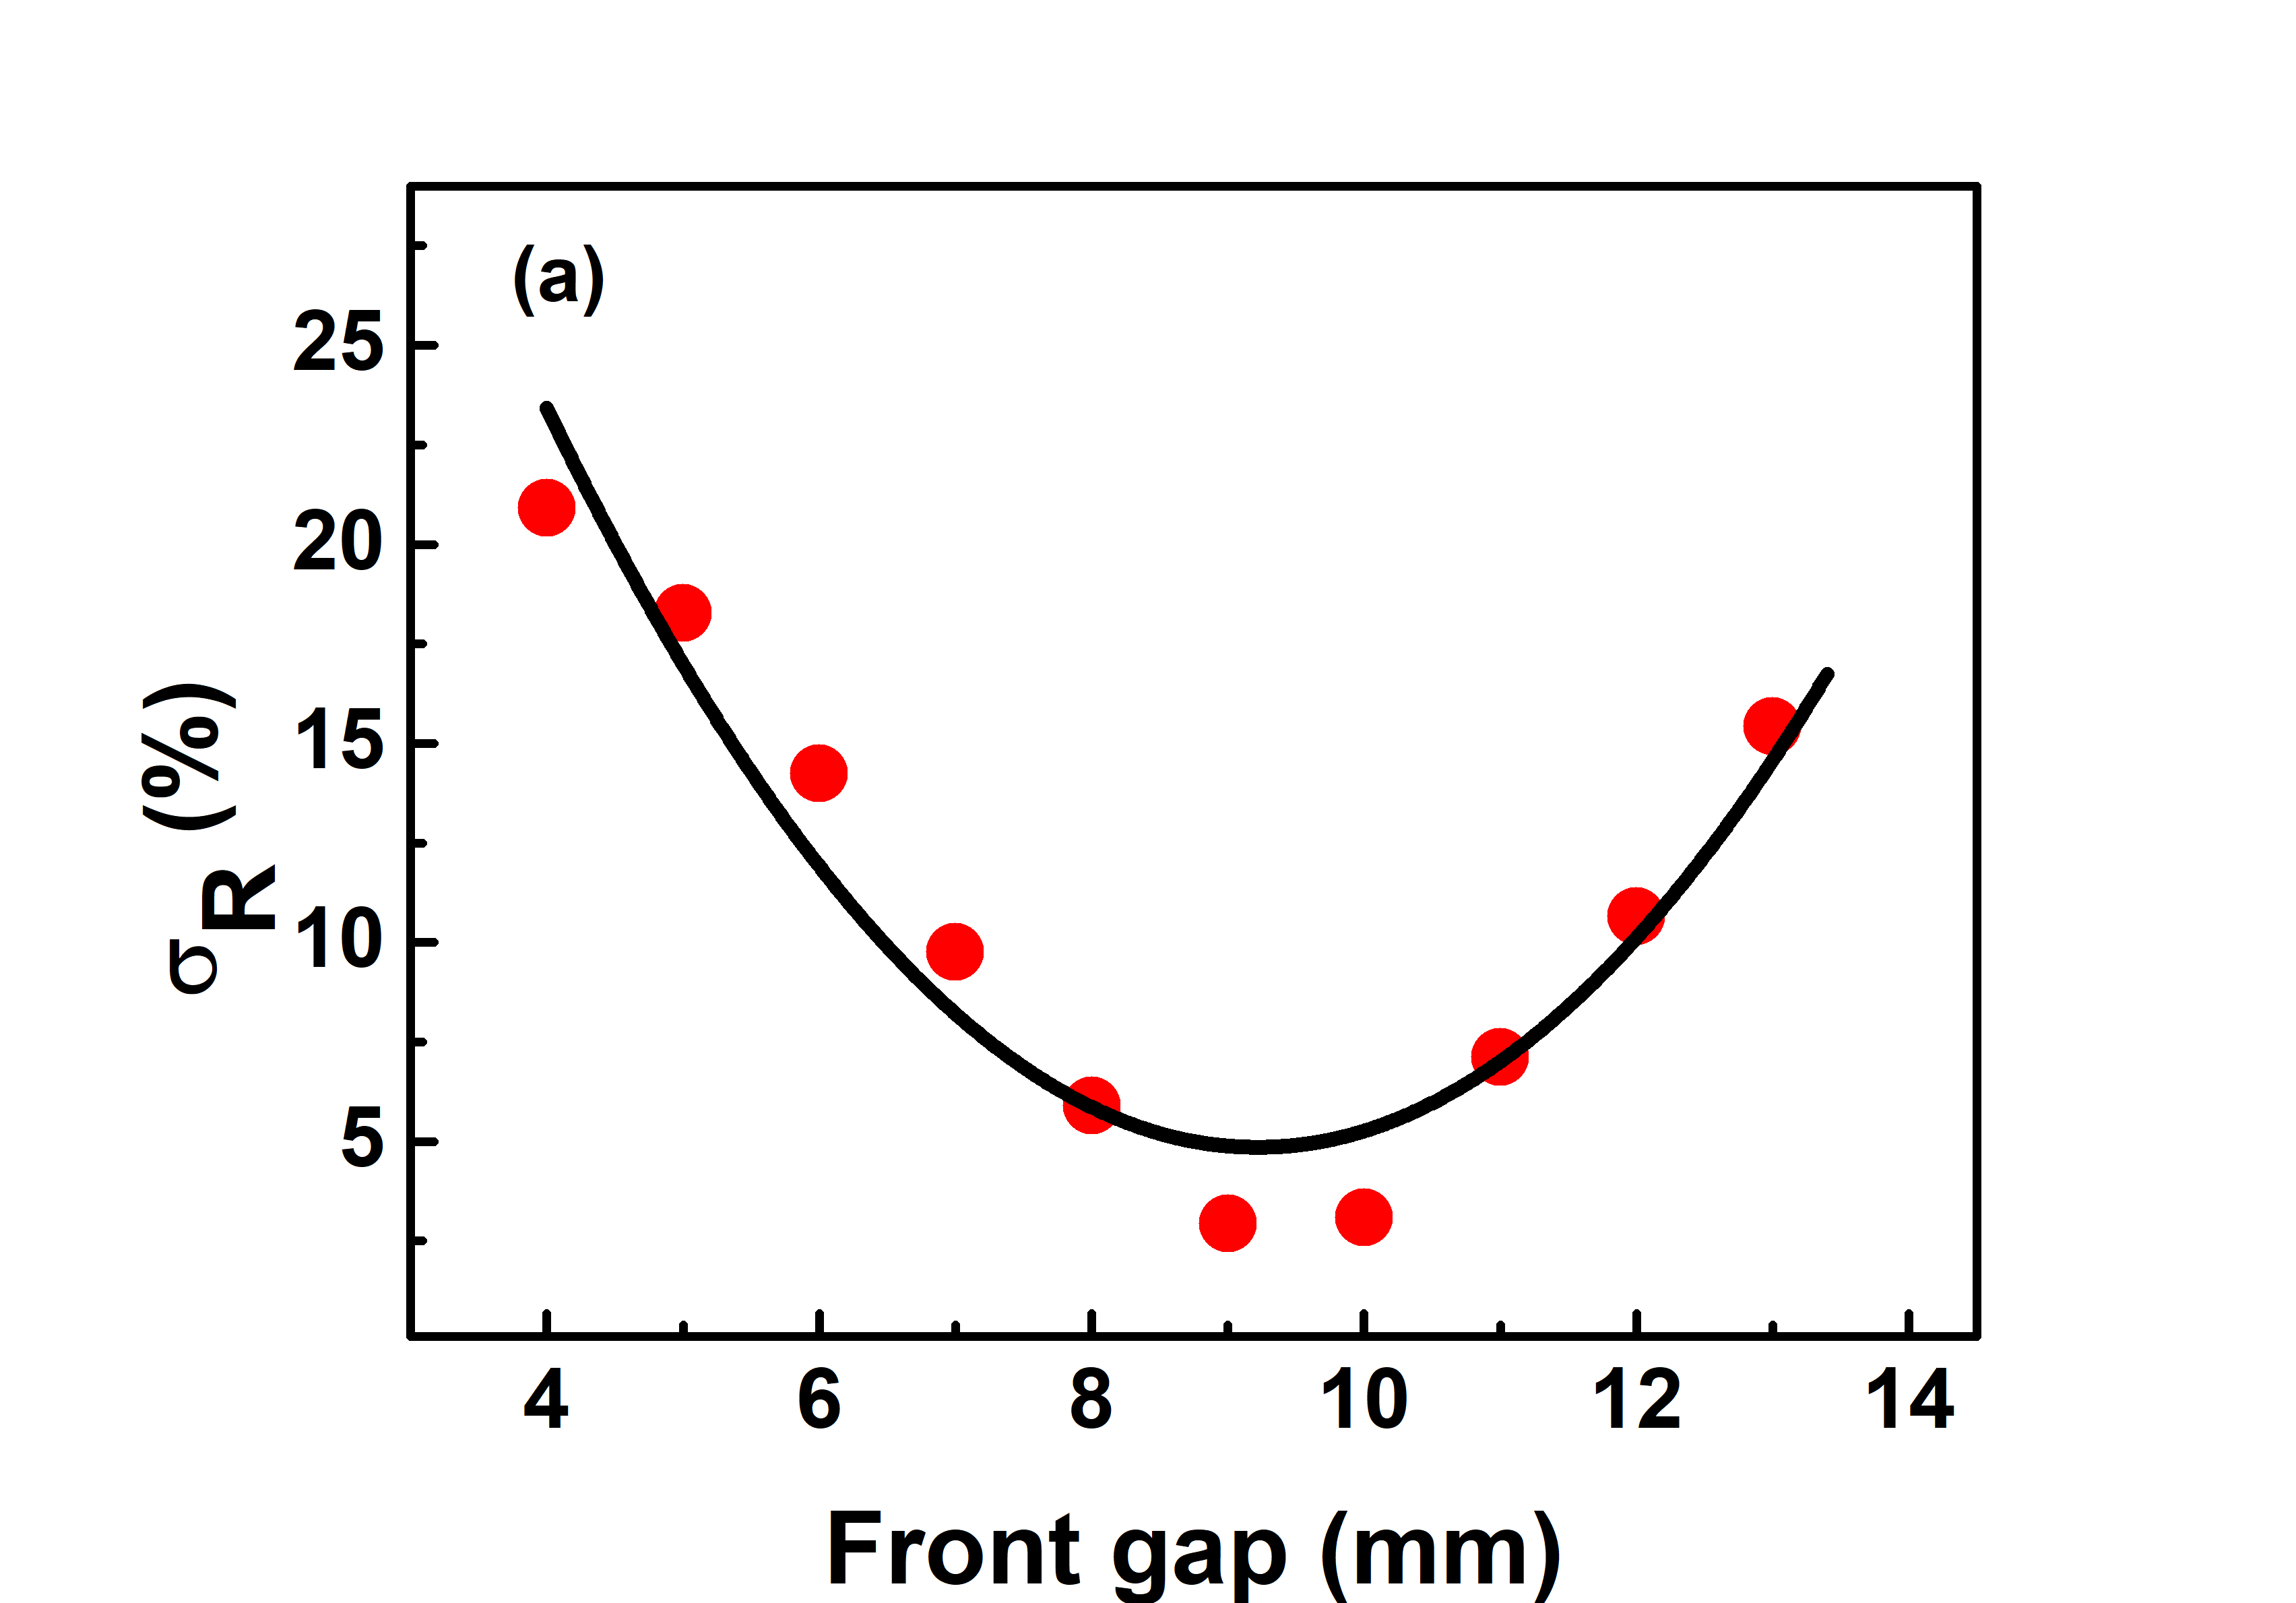
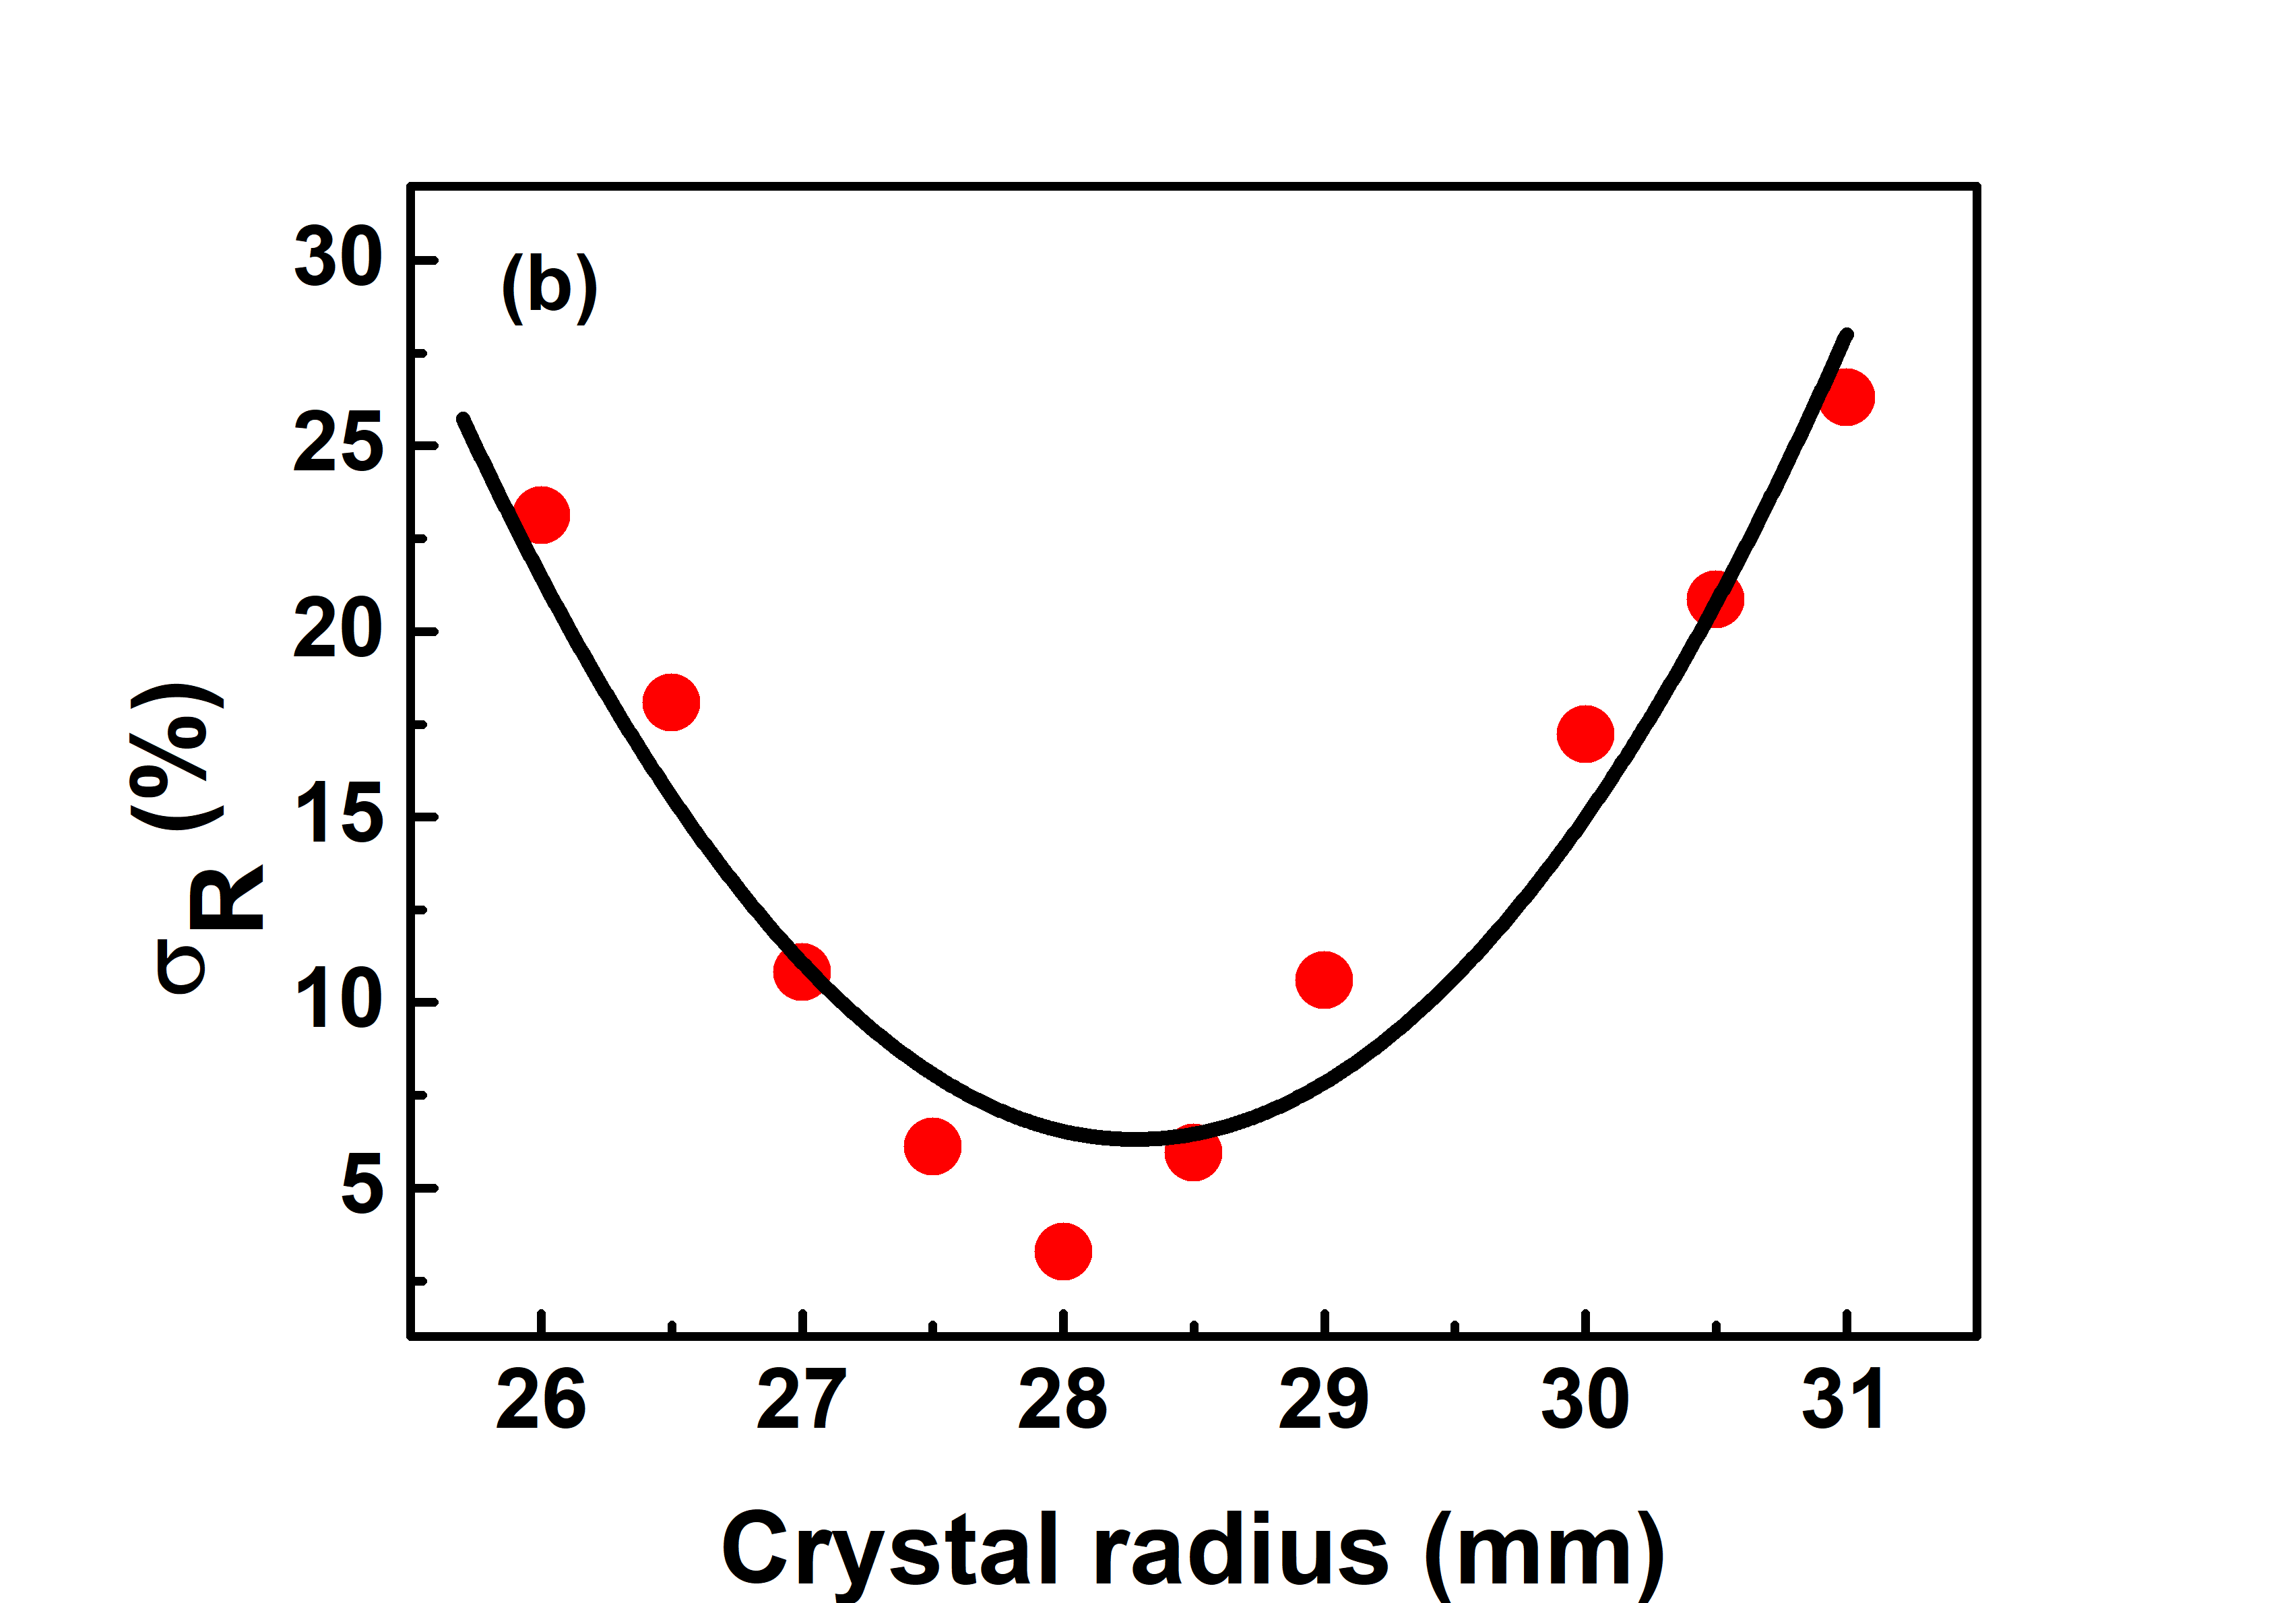
A polynomial function is used to fit the given data points and determine the minimum value of that yields the optimal fit. As low-order polynomials exhibit greater smoothness in comparison to high-order polynomials, the parabolic = + + c function was used to fit the given data. As an illustration, the best-fit values of front gap (g) and crystal radius (R) are shown in Figure 5 (a) and Figure 5 (b), initial estimation was done using 65Zn source.
3.2.1 Parametric study
Initially, the detector model was constructed according to the specifications provided by the manufacturer. Step-by-step adjustments were carried out to optimize the parameters, namely, crystal radius (R), hole depth (Lh), dead layers (td, tb, and ts) and front gap (g) to obtain an effective detector model (see Table 4).
| Parameter | Manufacturer | Varied from | Step size | Optimized |
| (mm) | (mm) | (mm) | (mm) | |
| Crystal Radius (R) | 31 | 25-31 | 0.5 | 29.53 1.2 |
| Hole radius⊕ (hr) | 5.55 | – | – | 5.55 |
| Disc length (L1) | 6.12 | 5.3-6.1 | 0.1 | 5.83 0.1 |
| Hole length (Lh) | 33.7 | 30.4-34.4 | 0.4 | 32.4 |
| Crystal length (L) | 46 | 42-46 | 1 | 44 0.3 |
| Top dead layer (td) | – | 0-2.6 | 0.3 | 1.8 0.2 |
| Side dead layer (ts)∗ | 0.7 | – | – | 1.7 |
| Bottom dead layer (tb) | – | – | – | 2 |
| Front gap (g) | 4 | 4-13 | 1 | 9 1.0 |
| Front carbon fiber⊕ | 0.9 | – | – | 0.9 |
| Side carbon fiber⊕ | 1.6 | – | – | 1.6 |
| Cu cup thickness⊕ | 0.8 | – | – | 0.8 |
| Ge crystal volume (V) | 135 | – | – | 120 4.8 |
| ∗ similar to CRADLE [26] |
To replicate the experimental data, the detector’s size must be optimized. The two main dimensions that have a significant impact on volume are R, and L. Crystal length (L) was constructed as solid and hollow cylinders and optimized in two parts, namely, Disc length (L1) and hole depth (Lh) and optimized independently. Low-energy gamma-rays are considered optimal for estimating the thickness of the top dead layer (td) on a crystal, as this layer attenuates gamma-rays. This has negligible effects on photopeak efficiencies at higher energies. Therefore, 88 and 122.1 keV energies are used for top dead layer determination. Depending on how long the detector has been in operation, it can decrease its active volume. The manufacturer did not supply the td value. Because both detectors are identical, the same side dead layer (ts) as CRADLE [26] was implemented. A passive Ge dead layer with a thickness of b=L-Lopt is introduced into the model when employing the manufacturer’s specified physical length, L. In the simulation, uniform dead layers were employed. The effect of air gap has significant effects on small source-detector distances. However, influence can be considered negligible at large distances. It can also be estimated better with low-energy gamma-rays. The results of the lateral scan, as shown in Figure 7, indicate a significant deviation at the end side of the crystal. However, this issue was successfully addressed after the integration of the bottom dead layer into the model.
|
|
|
|
|
|
|
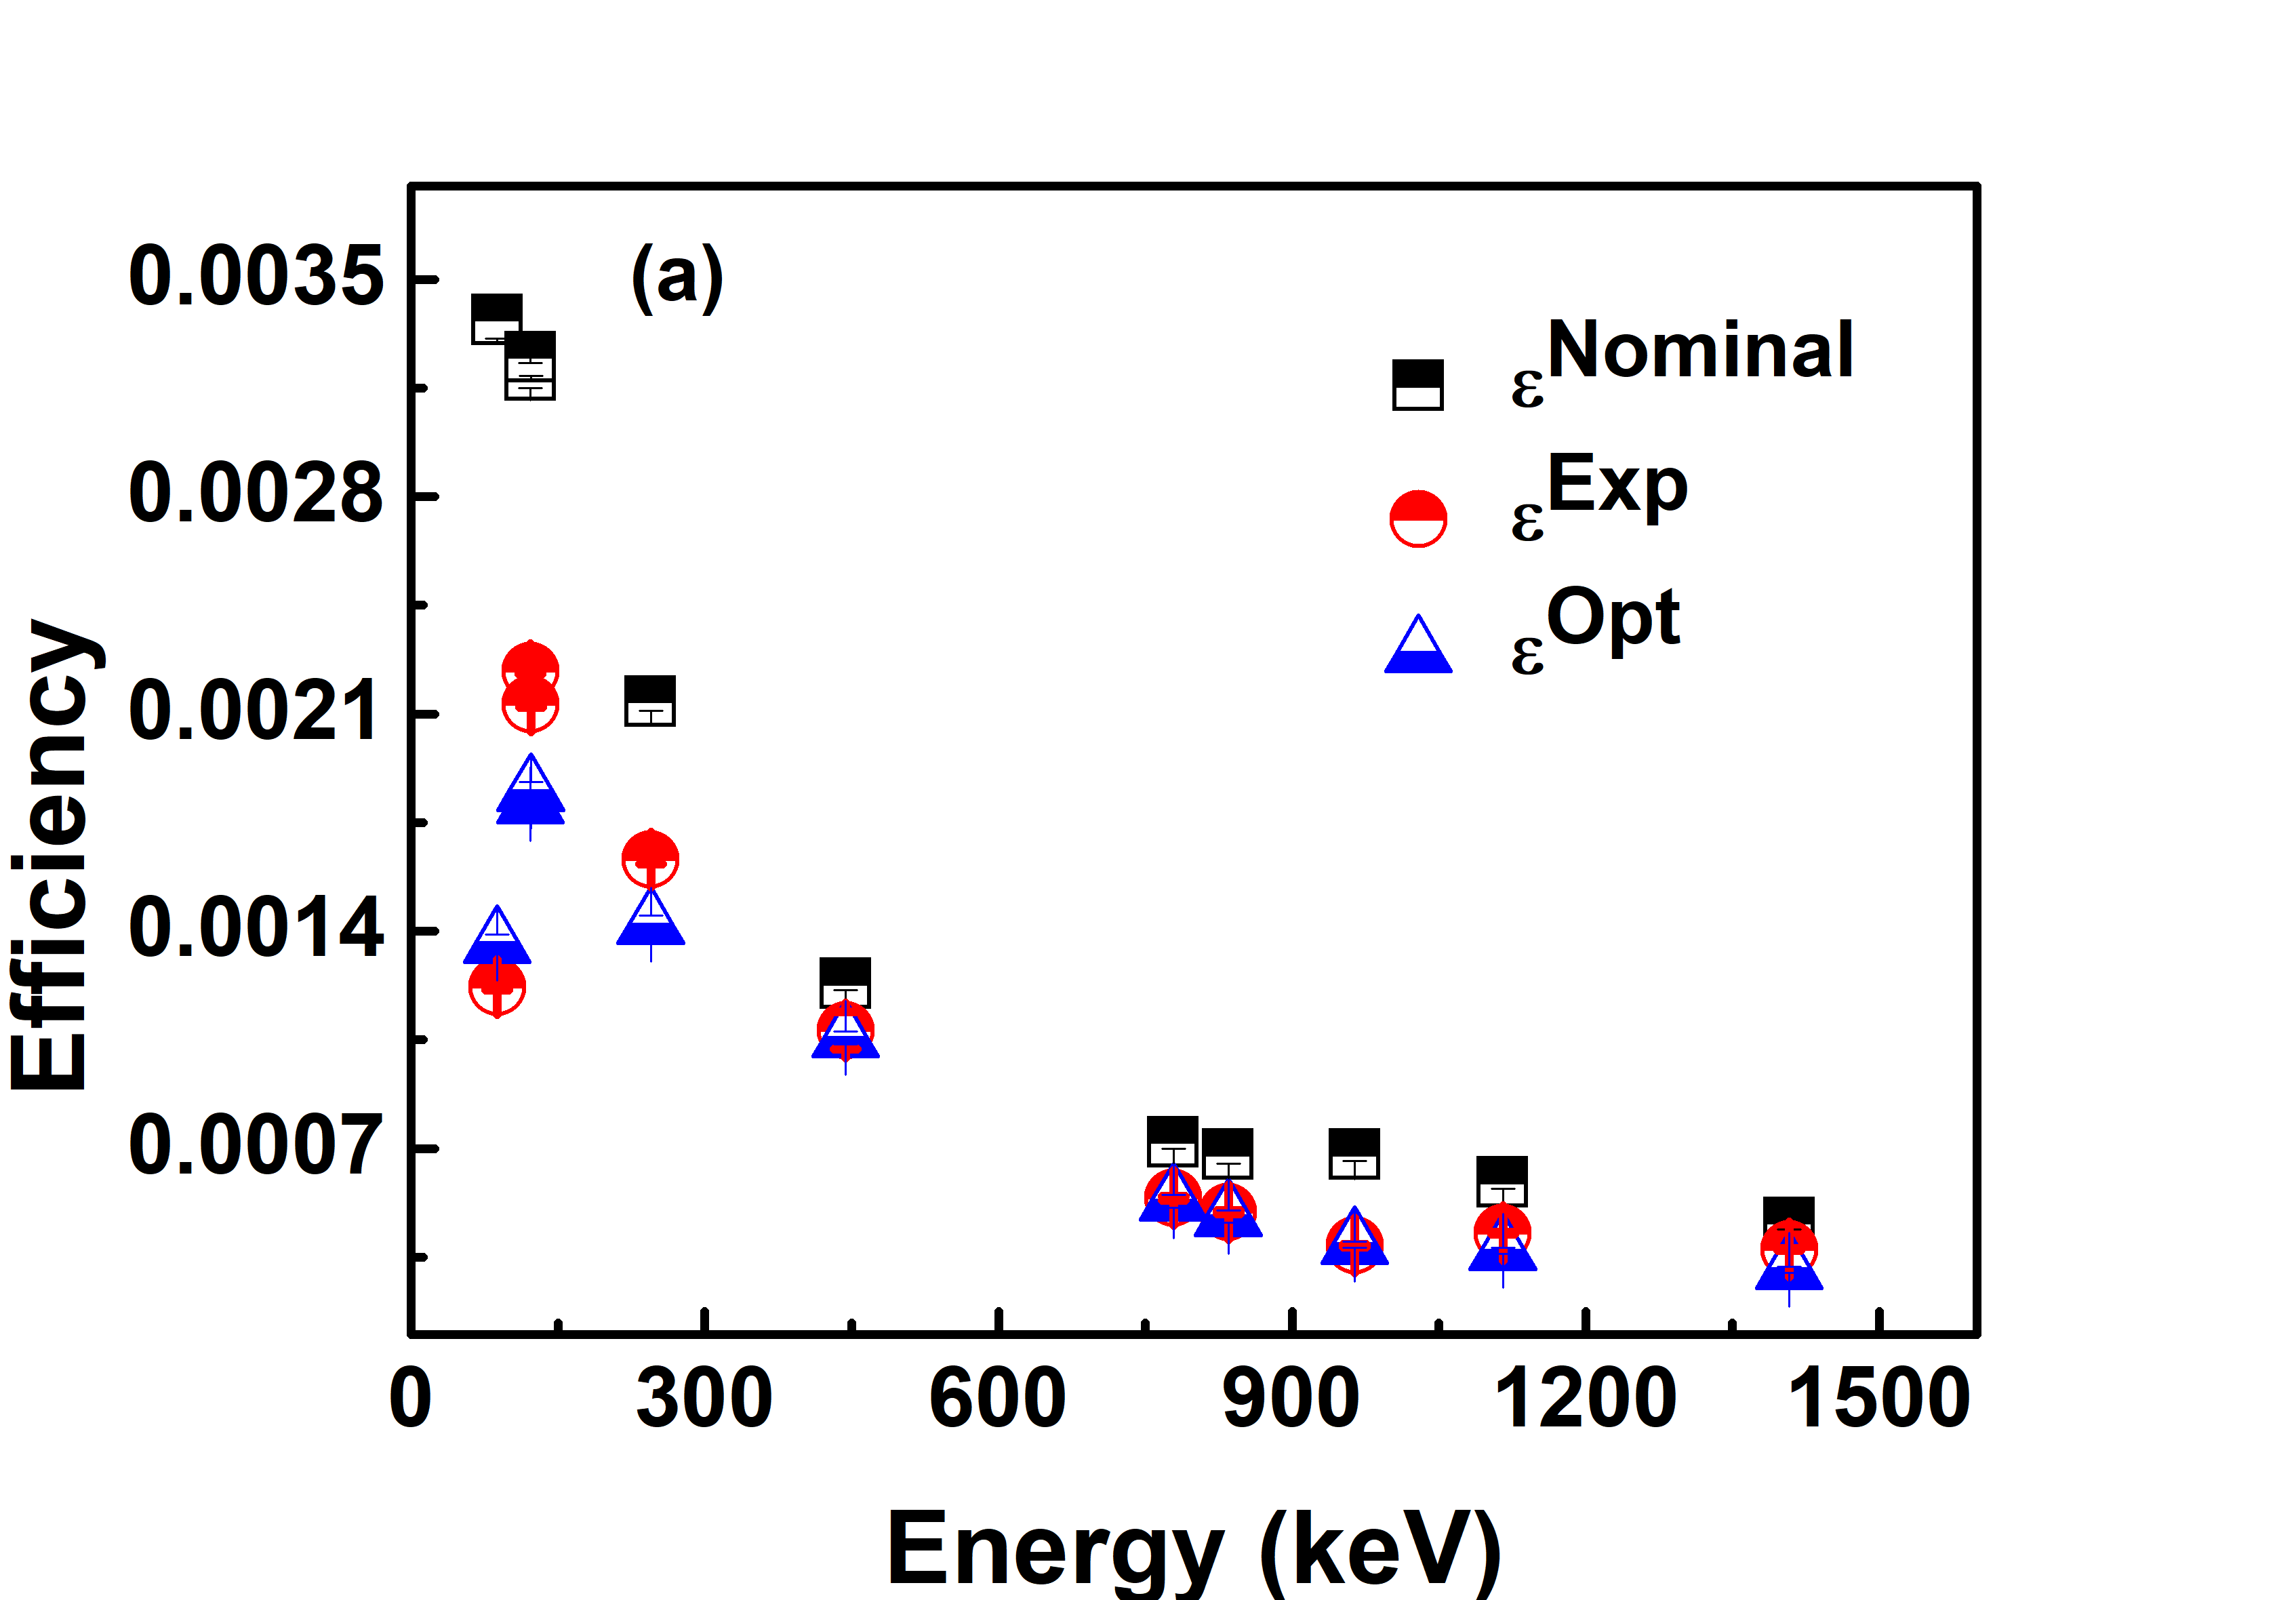
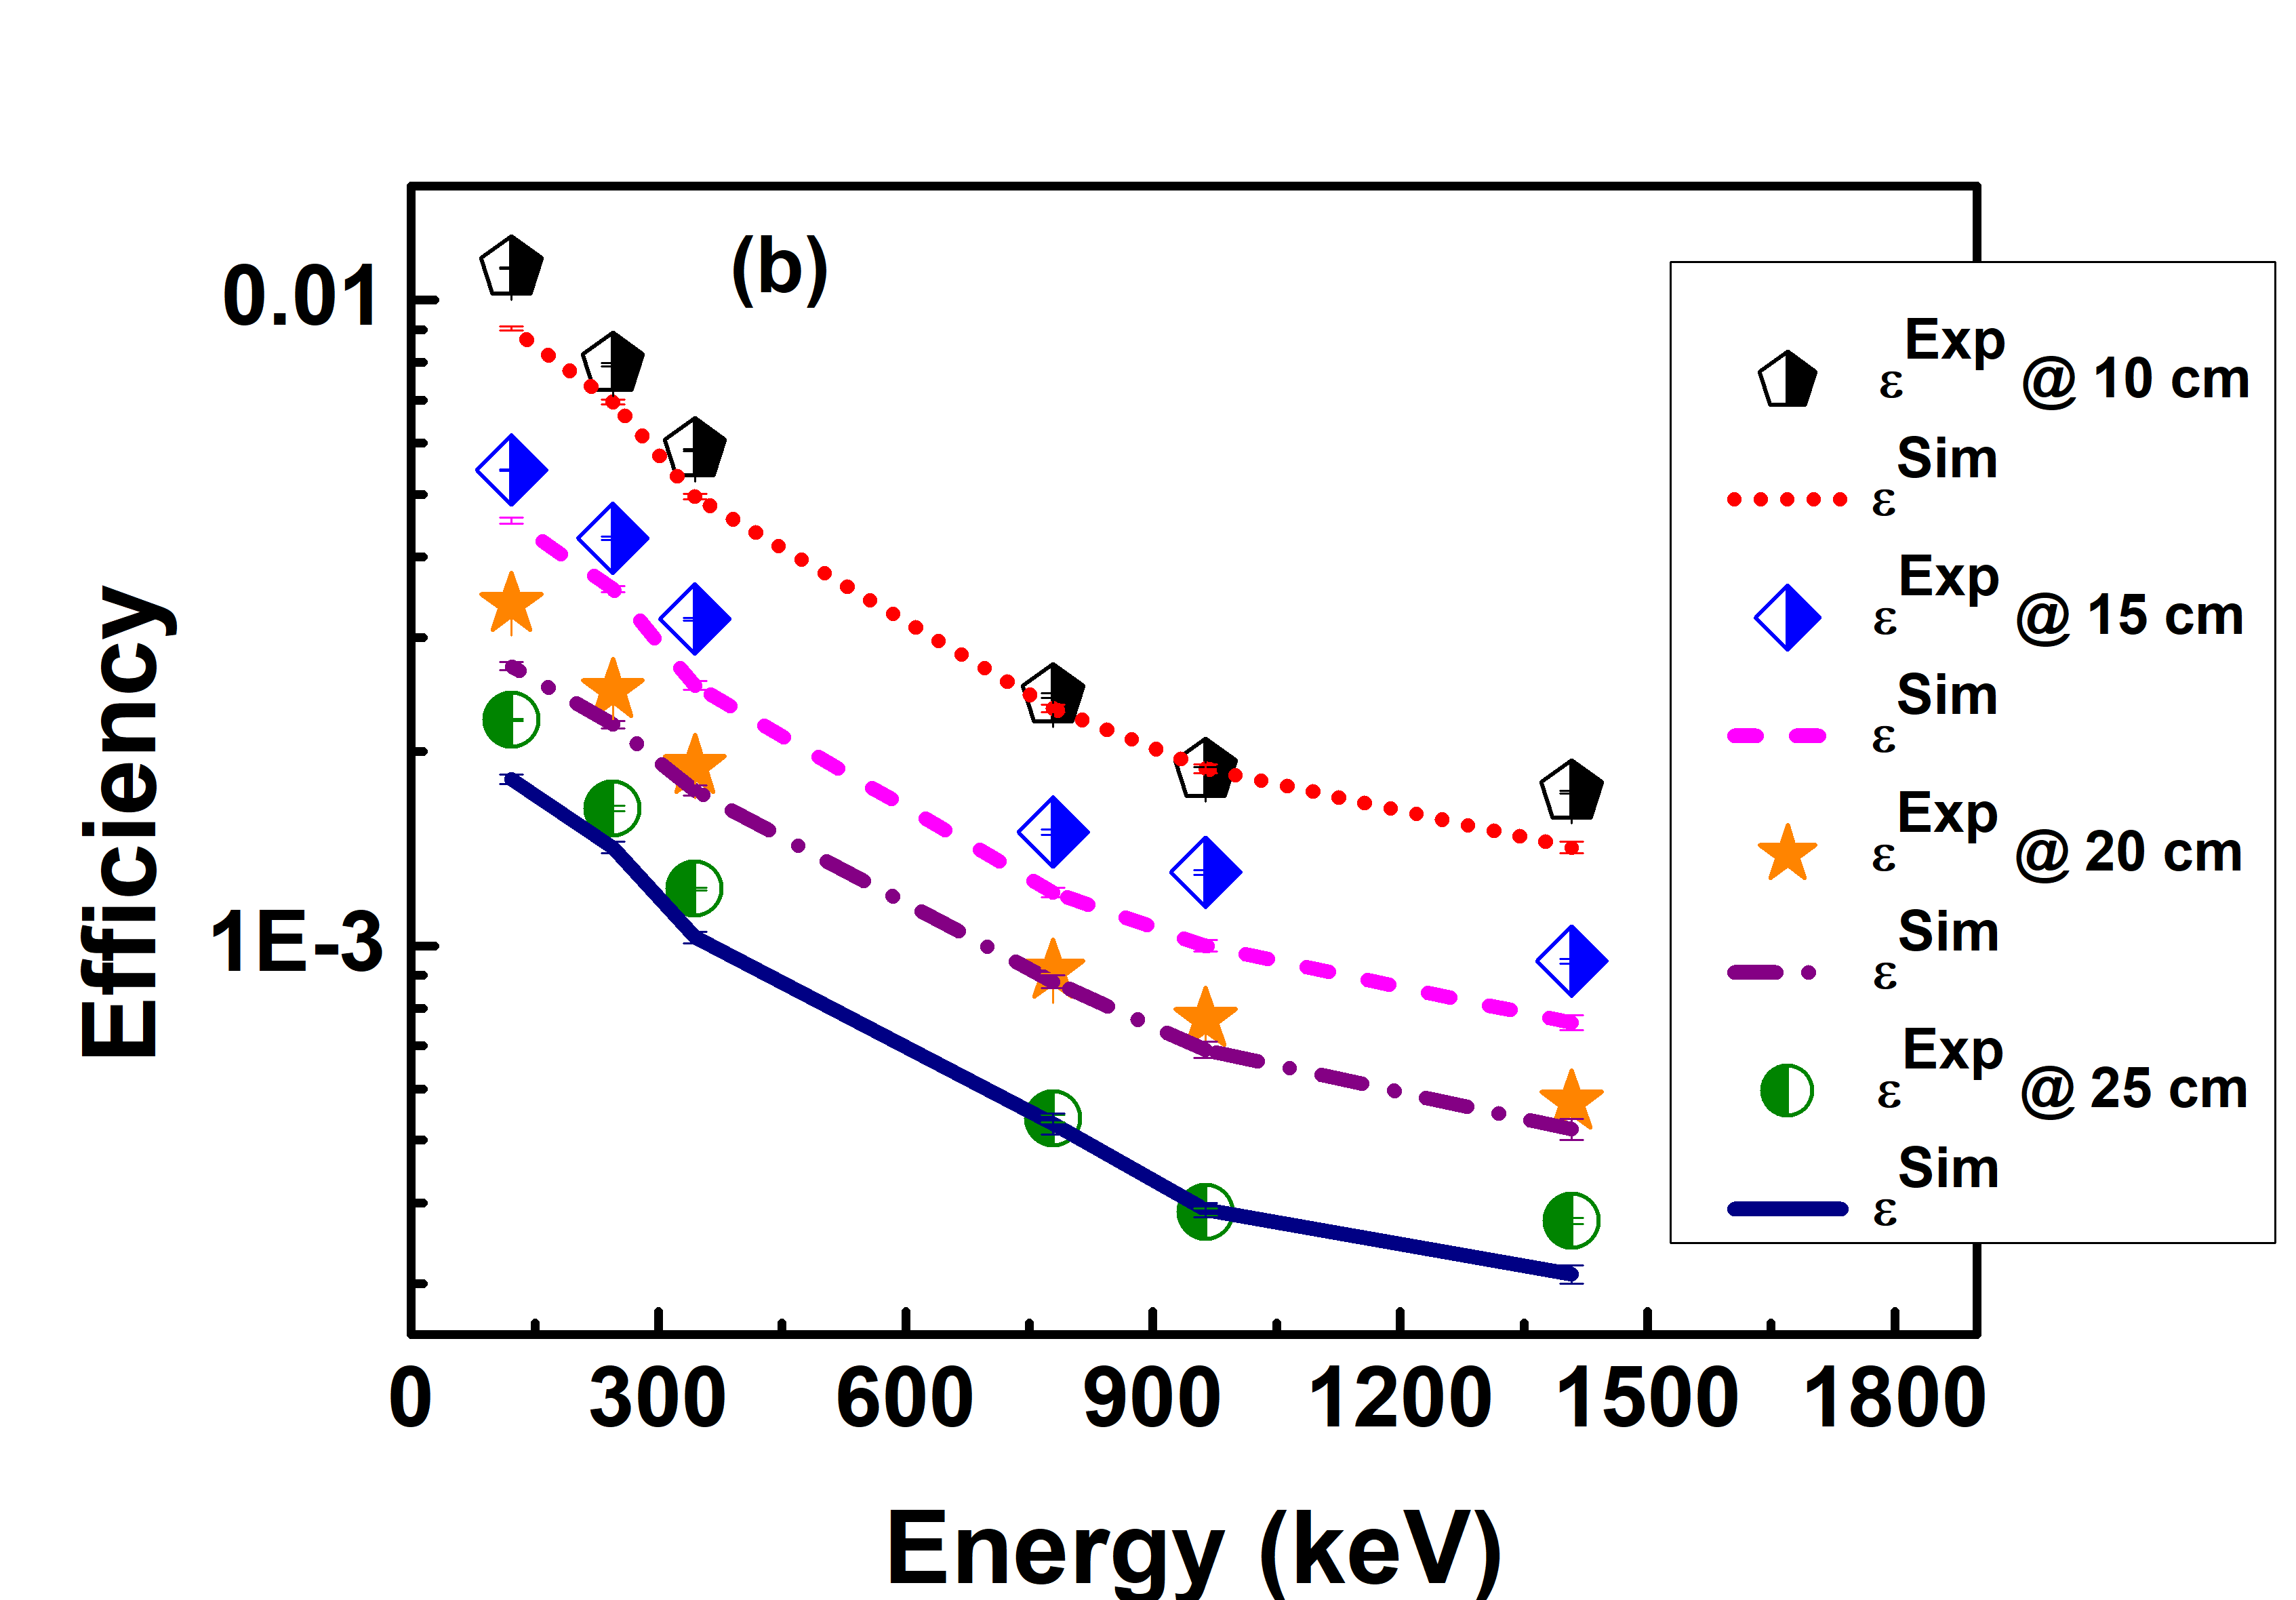
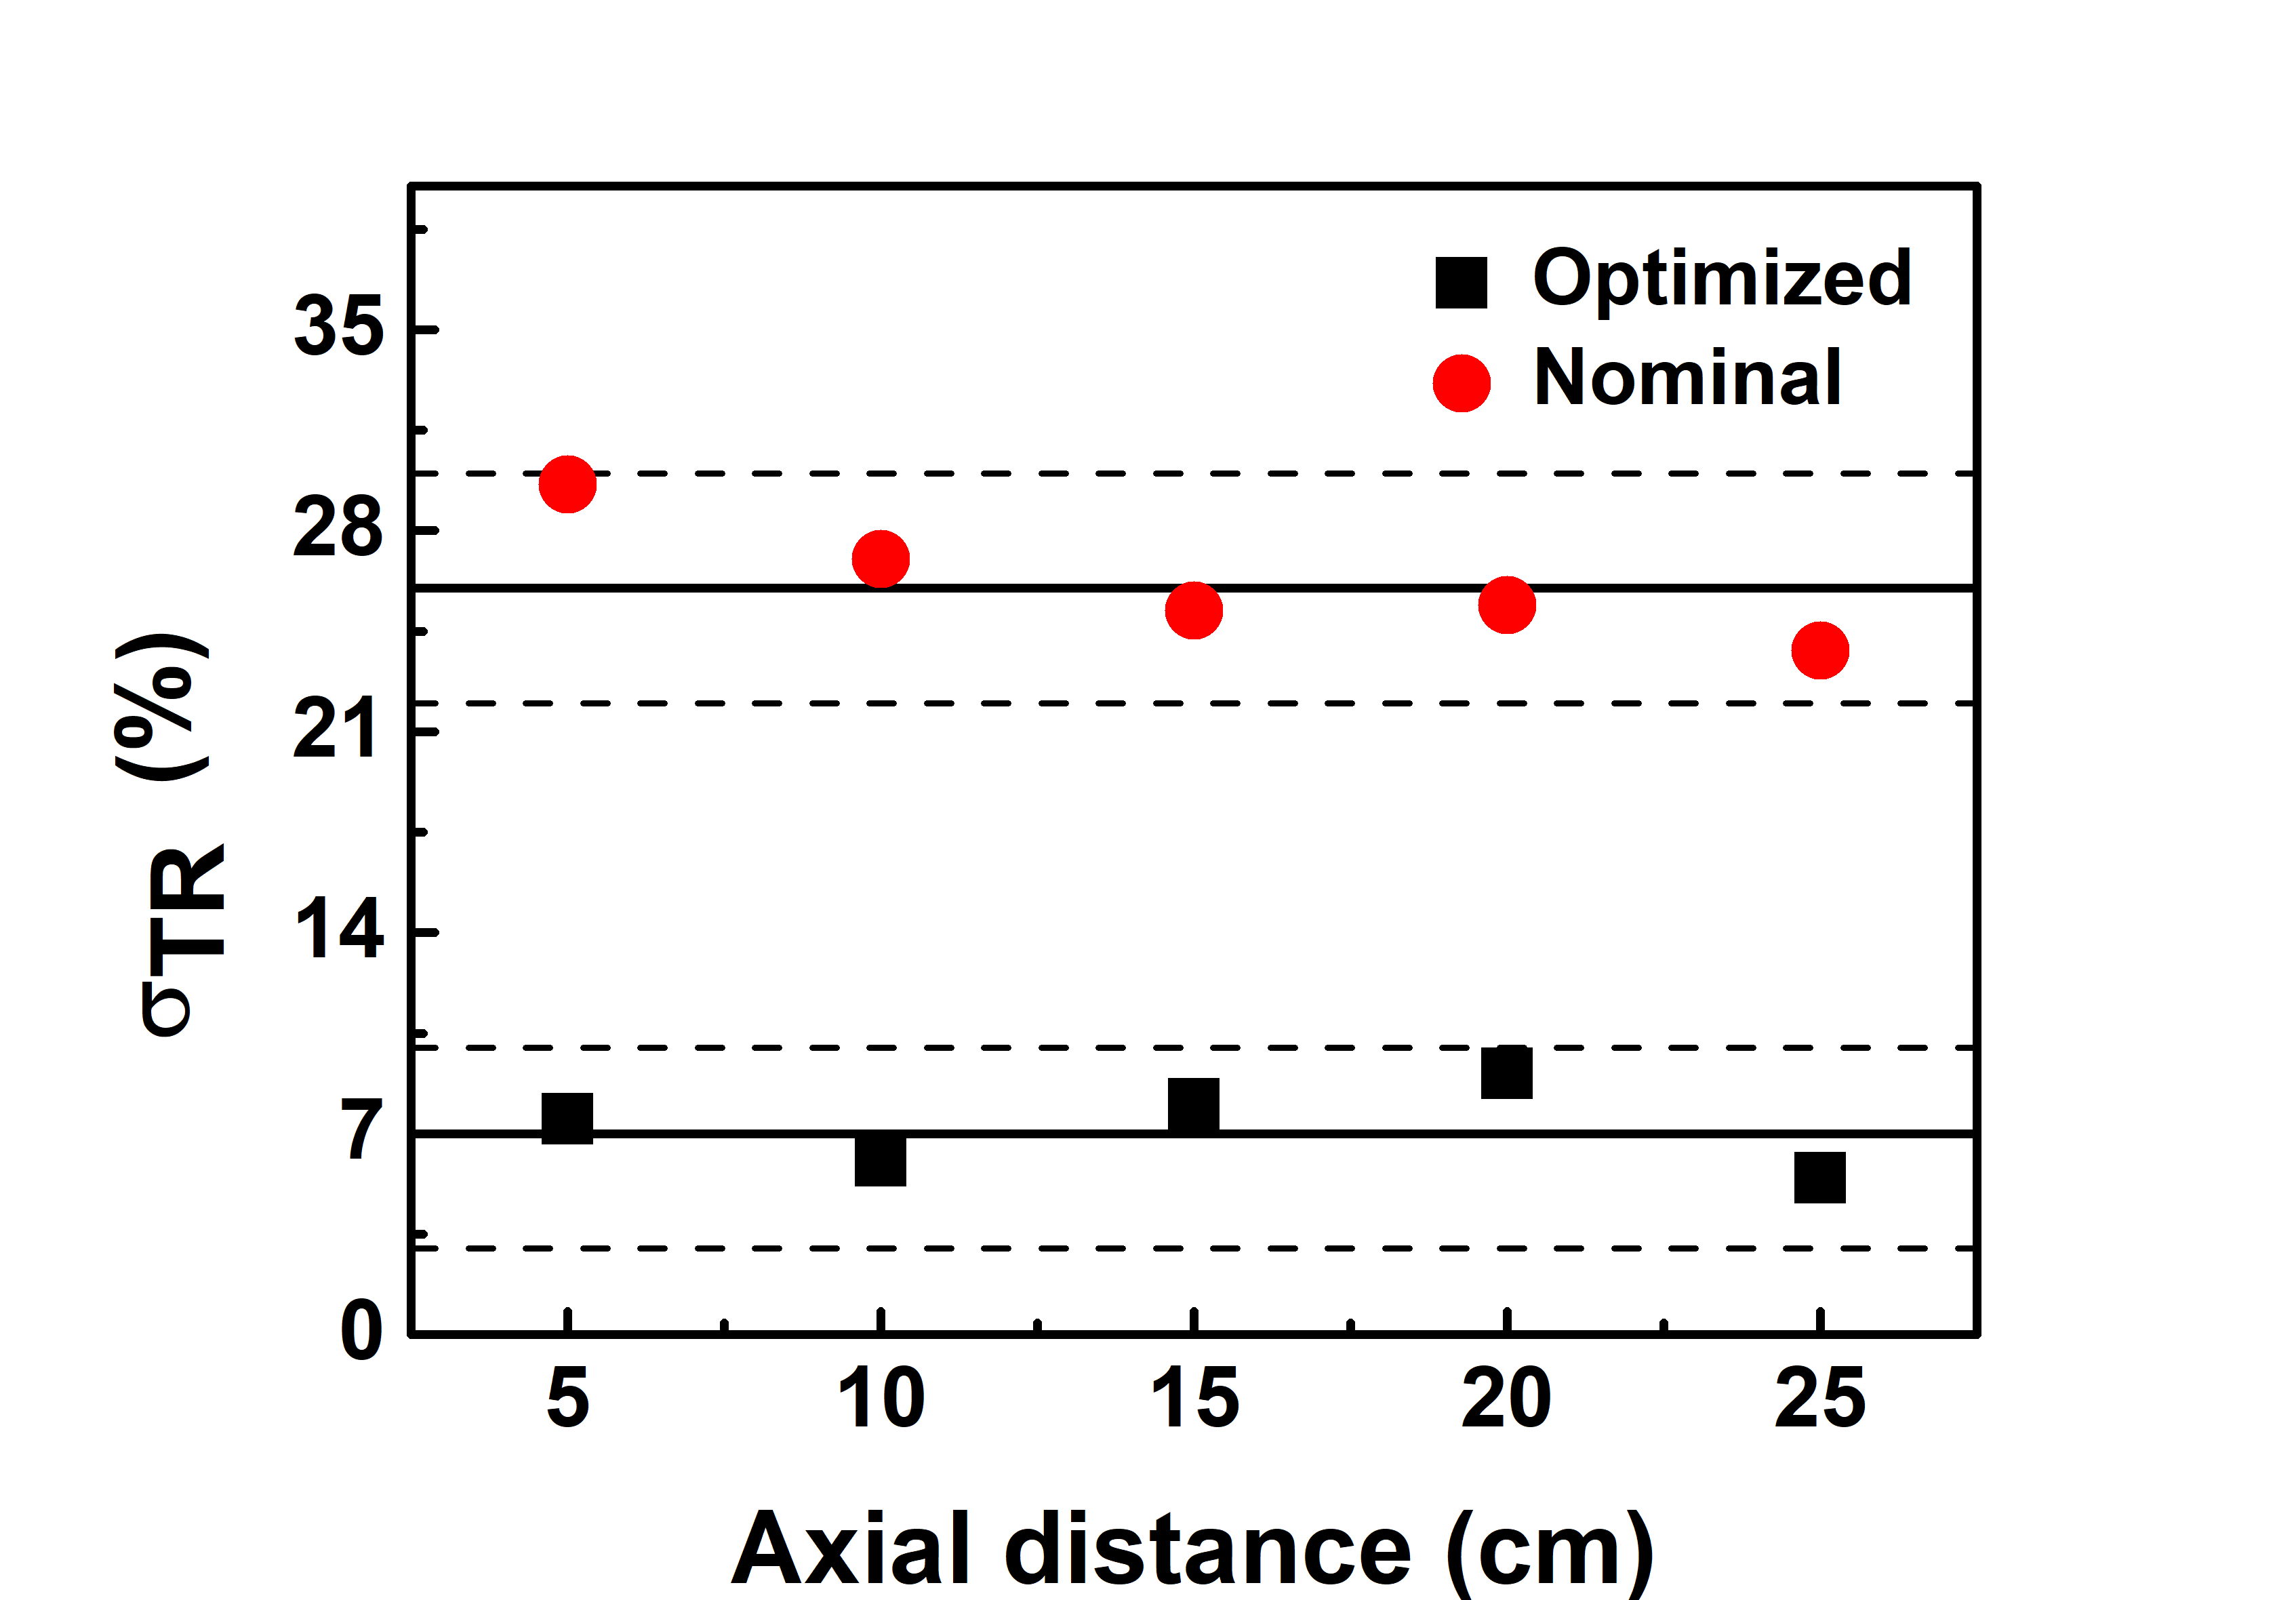
Figure 6 to Figure 7 compares distance, radial, and lateral scan data for gamma-rays of various energies with corresponding simulated data using the optimized detector model. Figure 9 illustrates a comparison of the experimental data with simulated efficiencies within the energy range of 88-1408 keV. It is observed that the measured value of 33% relative efficiency of the detector corresponds to an active volume of about 120 , which is 11% smaller than the manufacturer’s stated value of 135 . As it is clear from the Figure 10 that and using the nominal parameters for E= 122.1-1115.5 keV at d = 5-25 cm produced a significant of 26.2%, which was reduced up to 7% after optimisation.
3.3 Radioactivity measurements
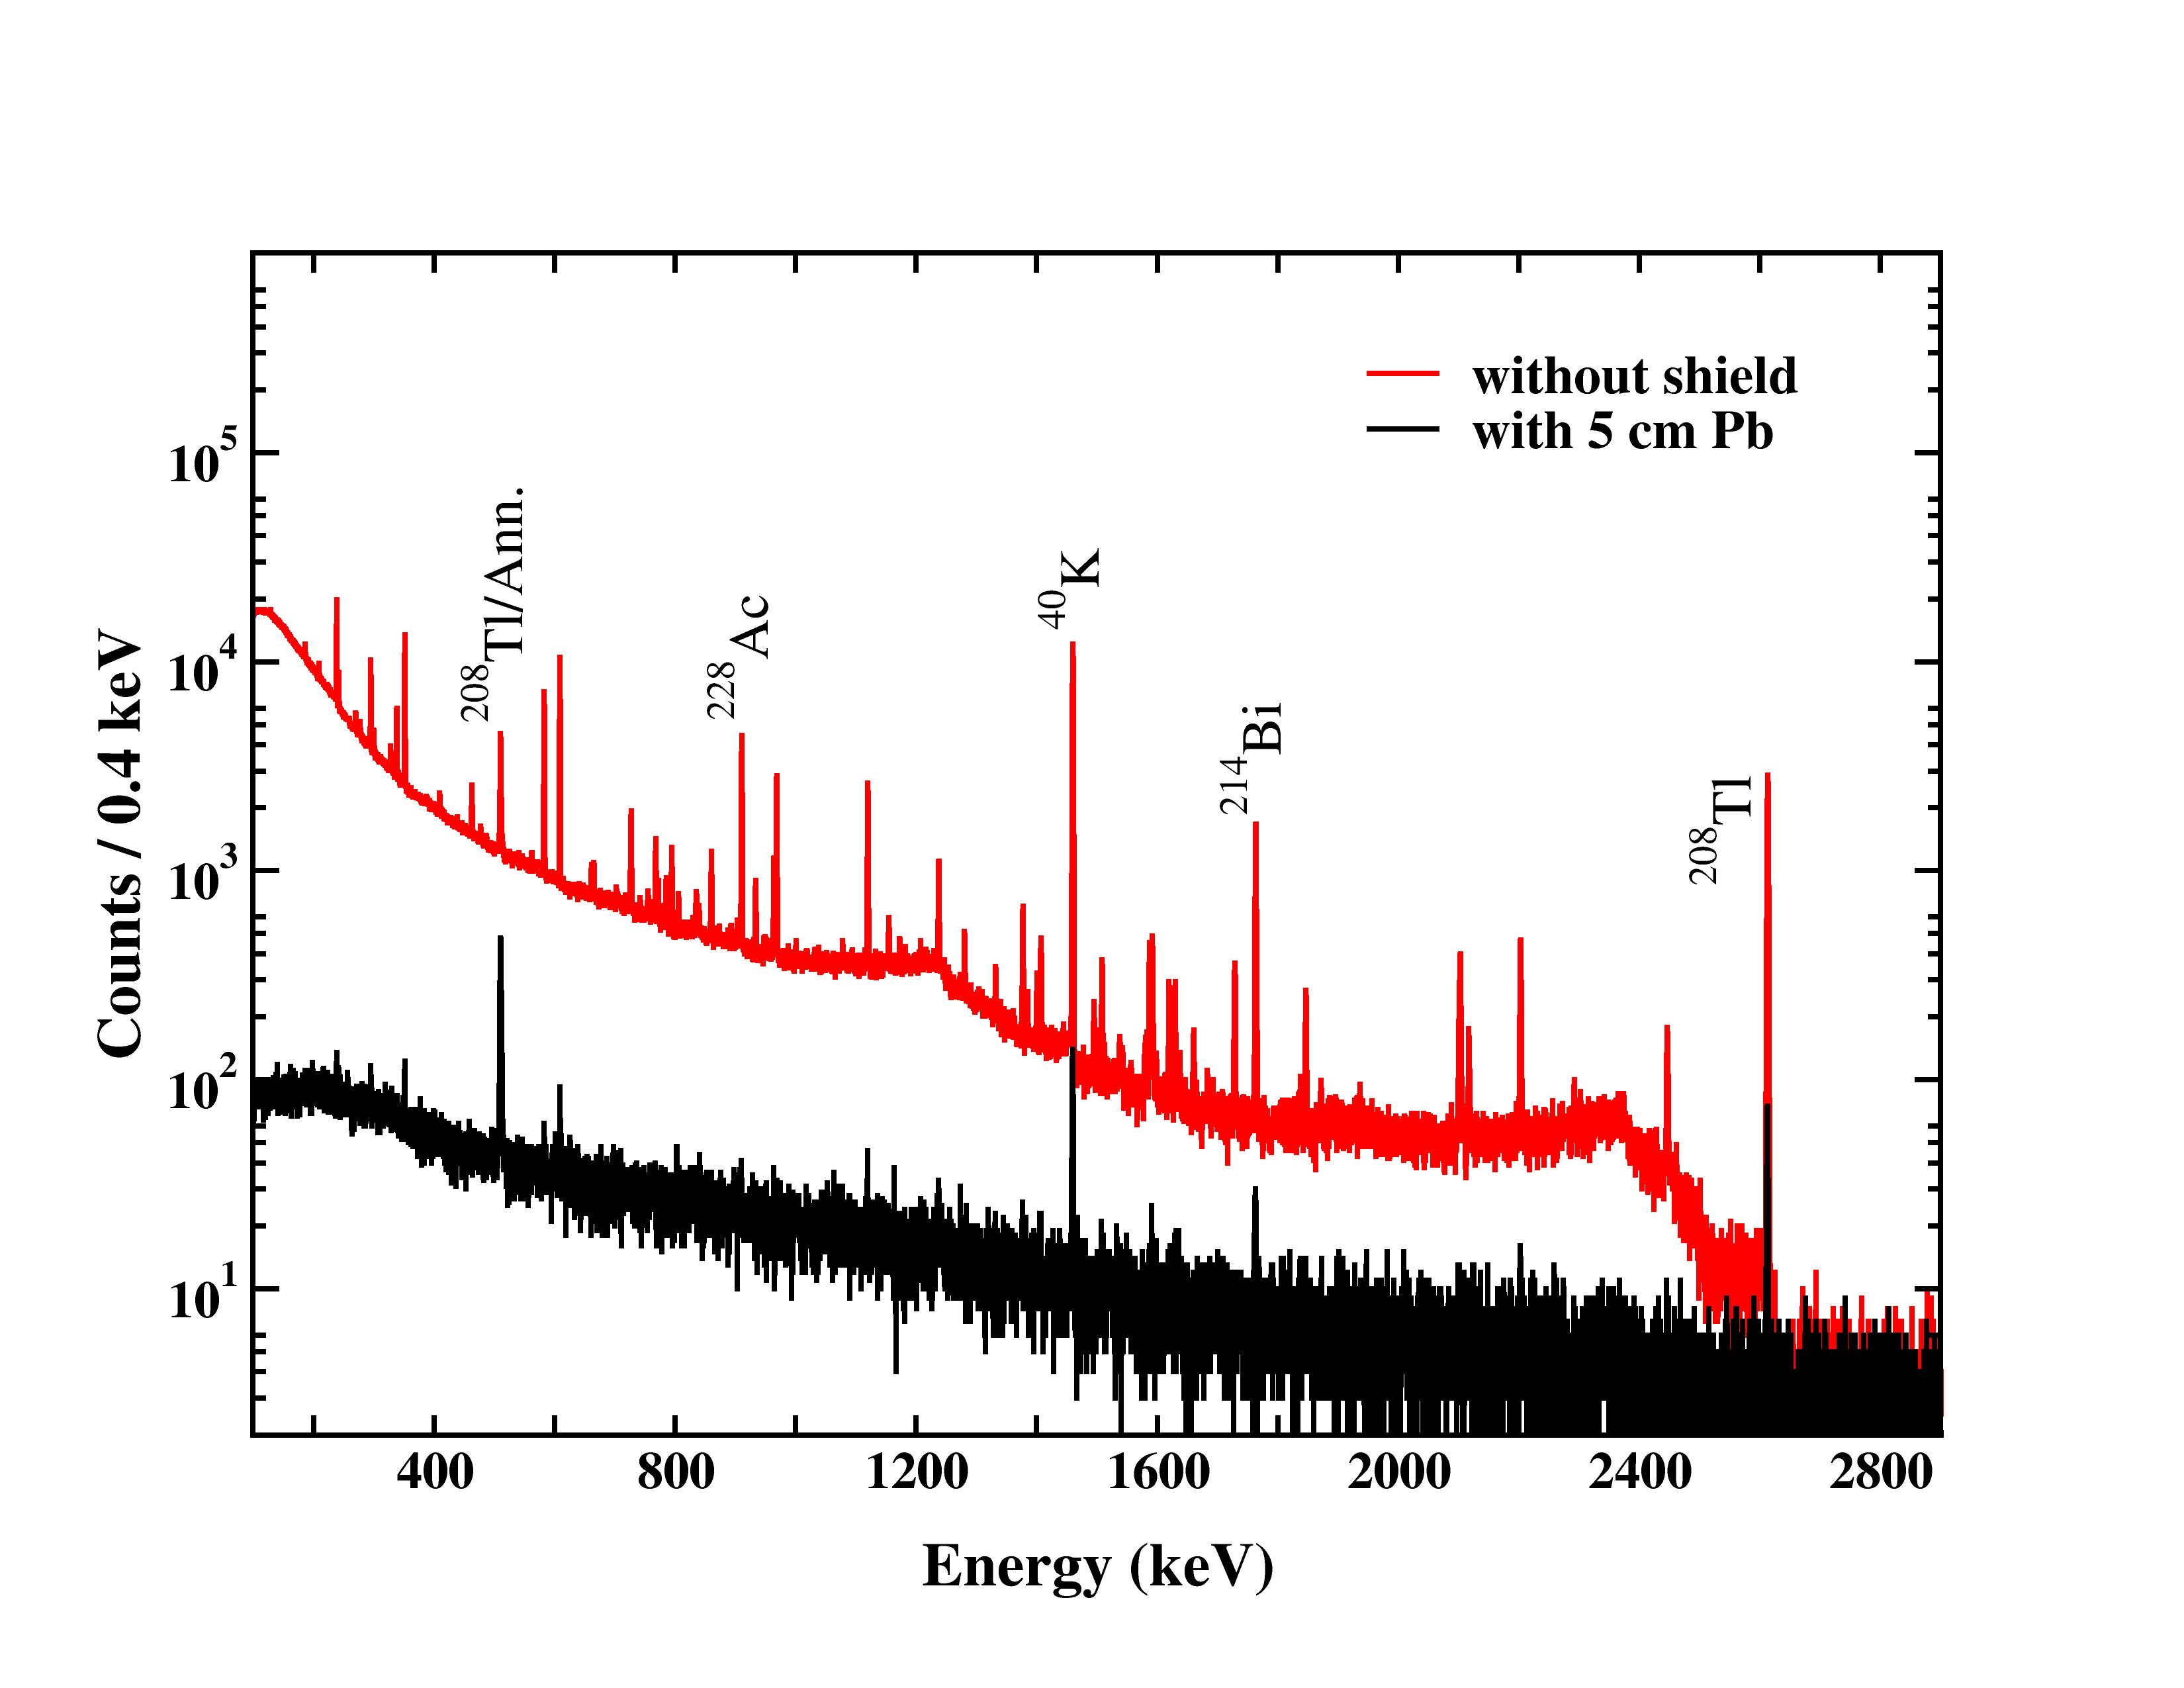
The ambient background in the laboratory has been measured using an HPGe detector without any shielding at different times since its installation to check for possible changes in the background due to incoming and outgoing materials (for impurity control), daily variations of radon concentration, and aperiodic variations of cosmic rays intensity. From a typical gamma-ray background spectrum recorded for 24 h, about 120 gamma lines were identified, emitted from the uranium and thorium decay chains in the room environment around the detector. The prominent radionuclides present in the spectra are due to the airborne radioactivity of radon and its short-lived decay products, i.e., the intermediate members of radioactive decay series of 238U and 232Th. Day-wise investigations of full gamma-ray spectra have shown a considerable variability of the areas of the 226Ra progeny lines (214Pb, 214Bi) in a range of about 14-18%. In contrast, the gamma lines of 1460.8 keV and 2614.5 keV from 40K and 208Tl, respectively, were comparatively constant within the experimental uncertainty. The integral background from energy range of 40 keV to 2700 keV is 5.9 105 /kg/h with a total count rate of 116 counts/day. Long background measurements were also performed to observe the day-wise variation in the overall background and estimate the statistical fluctuation in the prominent gamma peaks. Most of the variations were attributed to radon dynamics in the laboratory, while the background count rate over the energy region of 40–2700 keV is found to be similar. The spectrometer exhibits good gain stability and negligible calibration drifts (1 keV) over a long duration of measurements. A one-day ambient background spectrum of HPGe detector without and with Pb shielding is shown as a representative case in Figure 11. As a result of lead shielding, the overall background has been significantly reduced from 116 to 2 counts/day in the energy range of 40-2700 keV. The background rate for 1460.8 keV (40K) and 2614.5 keV (208Tl) lines is 634 and 443 counts/day, respectively. It can be seen that the Pb shield effectively stops most of the gamma-ray from entering the active volume of the detector crystal. At the same time, the reduction ratio of the integration of the count rate depends on the gamma-ray energy. The background reduction achieved has been compared with unshielded data for major peaks and various energy ranges. The ratio is reduced to 1.2% at 40–600 keV. In the energy range from 40 to 2700 keV, the ratio is 1.7%. The photopeak intensity reduction of major gamma lines visible in the unshielded setup has been compared with a shielded setup as given in Table 5. For 228U, the activity levels are reduced to 0.52% for 214Bi and 214Pb. In case of 232Th, the ratios fluctuate between 0.25% and 2.46% for 208Tl and 0.57 % for 228Ac. Photopeaks of 137Cs and 60Co are completely disappeared in the shielded setup. The ratio of 40K is 1.14%, and the annihilation peak drops to 20.3% of its original value without shielding.
 |
| Element | Energy | Without Shield (X) | With Shield (Y) | Reduction factor |
| (keV) | (counts/day) | (counts/day) | Y/X(%) | |
| 212Pb | 238.6 | 37812(147) | 127(47) | 0.34(3) |
| 214Pb | 295.3 | 16937(266) | 86(54) | 0.51(20) |
| 214Pb | 351.9 | 31365(329) | 219(25) | 0.70(8) |
| 208Tl/Ann. | 511.0 | 14956(903) | 3039(110) | 20.32(12) |
| 208Tl | 583.2 | 21159(286) | 54(23) | 0.25(8) |
| 214Bi | 609.3 | 32746(349) | 170(23) | 0.52(7) |
| 137Cs | 661.7 | 858(98) | – | – |
| 214Bi | 806.4 | 1084(139) | – | – |
| 228Ac | 835.6 | 1356(133) | – | – |
| 228Ac | 911.2 | 16609(232) | 94(28) | 0.57(12) |
| 214Bi | 1120.3 | 9411(208) | 106(21) | 1.13(10) |
| 60Co | 1173.2 | 654(130) | – | – |
| 60Co | 1332.5 | 464(87) | – | – |
| 40K | 1460.8 | 61137(834) | 700(37) | 1.14(4) |
| 214Bi | 1764.5 | 8916(154) | 199(33) | 2.23(21) |
| 208Tl | 2614.5 | 19101(400) | 469(31) | 2.64(8) |
Ambient background in the shielded setup has been counted for a duration of 49 d over a span of 3 months. It should be mentioned that the stability of the energy scale was monitored with background gamma-rays such as 1460.8 and 2614.5 keV, where calibration with standard sources was only sometimes convenient due to heavy passive shielding. In summed gamma-ray background spectra of 49 d besides gamma-rays emitted by natural radionuclides, another source of background is generated by neutron interactions. The anthropogenic radionuclides 137Cs and 60Co were found below detection limits and no contribution from long-lived cosmogenically produced radionuclides, e.g., 22Na, 60Co and 65Zn were observed. In above-ground low-level gamma spectrometry systems, some peaks associated with the activation of germanium and fast neutron scattering in the shielding material occur in the background spectrum. For example, 139.7 keV gamma line produced via neutron-induced process 74Ge(n,)75Ge. Peaks at 569.7 keV and 1063.3 keV from scattering reaction (n,n’) on lead were also observed. Another gamma ray at 803.3 keV is detectable and corresponds to the de-excitation of 206Pb∗ which can result from the decay of 210Po or from fast neutron scattering on lead. An important characteristic in low activity measurements is the Minimum detectable activity () that defines the least amount of activity in the sample to quantify the radiation level slightly above the unavoidable background. Shorter measurement times and higher background radiation levels would increase the and reduce the sensitivity of all detectors. The detector efficiency significantly affects the detection levels. In addition to the detection efficiency, amount of sample, measurement time, and photon emission probability, the in gamma spectrometry depends on the background level at a specific energy. These background events mainly come from three primary sources: the sample, the Compton continuum, and natural radioactivity. The in Bq/kg at a given gamma-ray energy is calculated using Currie’s method [27] and given by:
| (7) |
Where = 2.7 + 4.65 is minimum detectable counts and is the standard deviation in the background counts, is the branching ratio of the gamma-ray, is the photopeak detection efficiency computed using GEANT4 simulation, m is the mass of the sample and t is the counting time. It should be noted that simulated efficiencies () were obtained with the optimized detector model for 106 events uniformly distributed within the studied sample modeled in GEANT4 similar to the counting geometry kept during the measurement.
3.4 Measurement of Soil and Rock Samples
The sensitivity of the ILM-0 setup was estimated using sub-surface soil (30 cm depth) and rock samples. The soil samples were collected from the Katli village (30.99582 N, 76.534 80 E) in the Ropar region of Punjab (India), and the rock samples were collected from the Aut region of Himachal Pradesh (India). It may be noted that the rock samples were remeasured in the present work to assess the performance of the ILM-0 setup as compared to TiLES measurements reported elsewhere [13]. The soil samples were oven dried (110∘C), fine powered, and then sieved through a 150 m mesh. Each sample was packed and sealed in a cylindrical polypropylene container of 3.5 cm dia. and 2.2 cm height and stored for stabilization. The smaller sample geometries are desirable over voluminous sample geometries because the attenuation of gamma-rays within the sample matrix is negligible. A total of 10 soil samples, average mass ⟨m⟩20 g were counted in compact geometry for 24 h. The mean soil density ⟨⟩, as packed in the container, is estimated to be 1.3 g/cm3 with an overall variation of 10%. It has been reported [28] that the Punjab soil is mainly of clay loam type and thus expected to have a similar composition as listed in table 3.
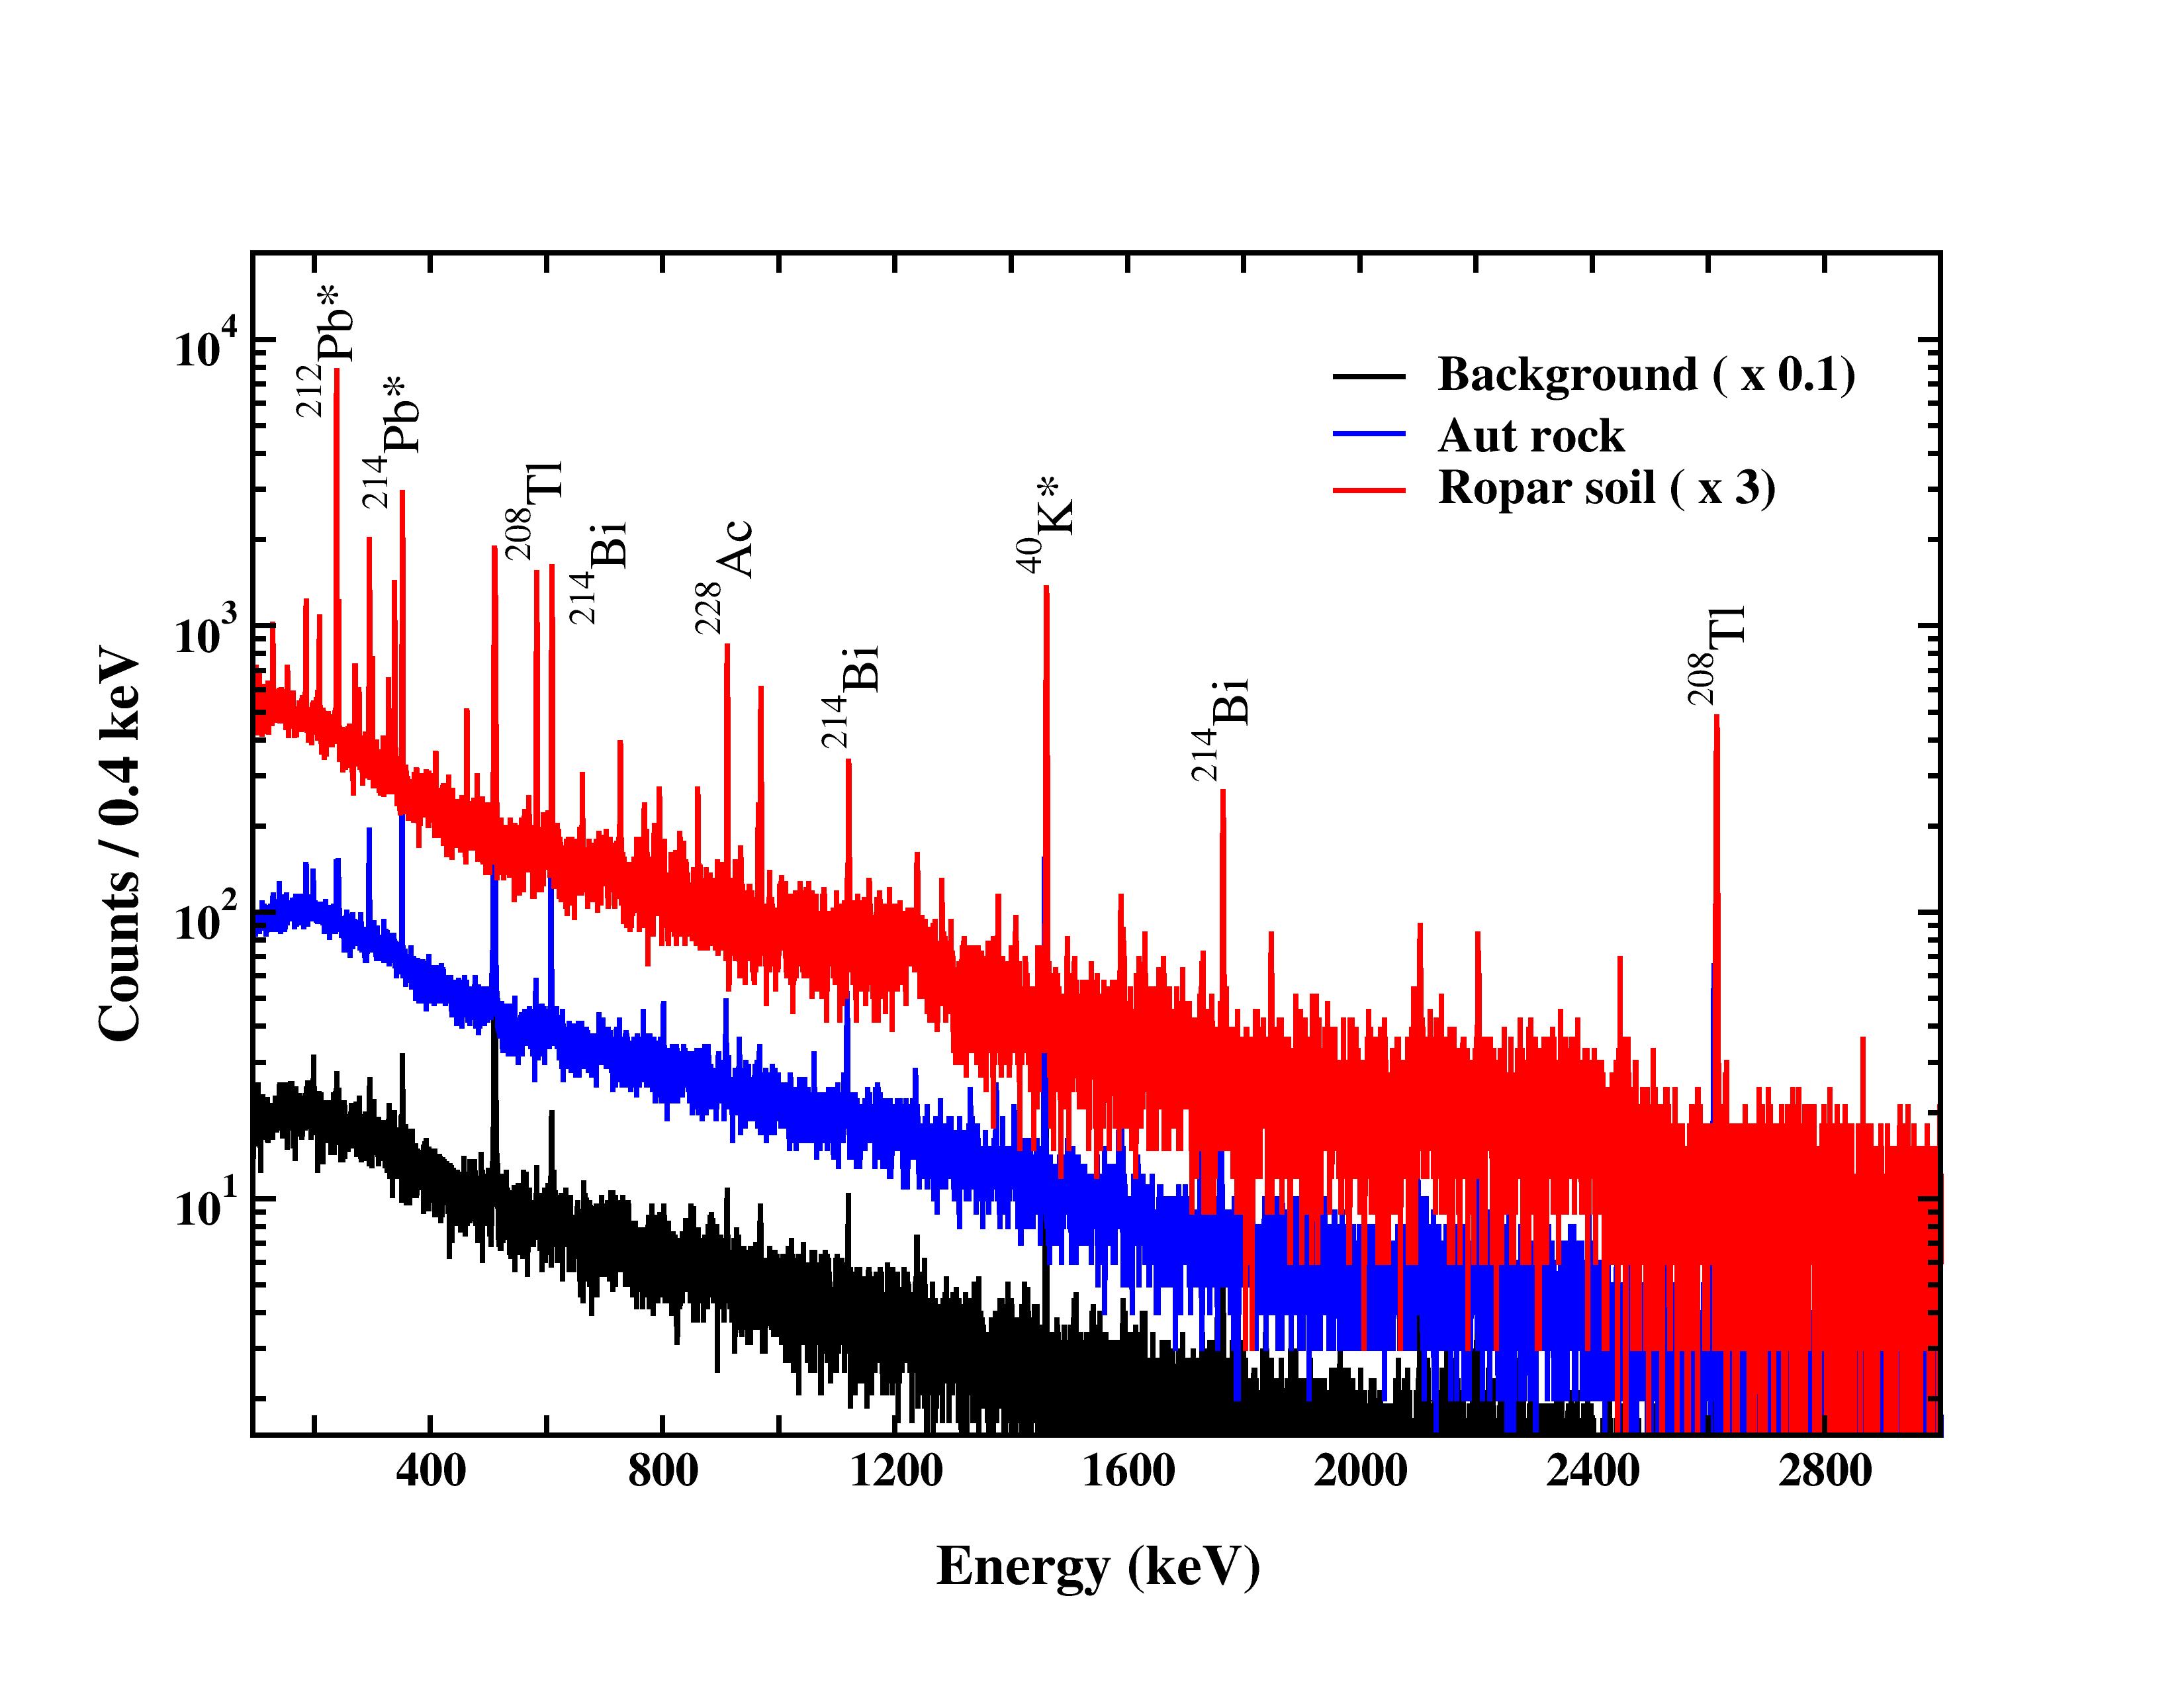
To enhance the counting efficiency, the soil samples were counted on the front of the detector face and confined within 60% of the radial extensions to avoid edge effects. The effect of the elemental composition and sample density were taken into account. The average sample mass of ⟨m⟩20 g was counted in compact geometry for 24 h. The same geometry was adopted for counting of rock samples. Figure 12 compares typical one-day spectra of ambient background (x0.1), Ropar soil (x3), and Aut rock samples. The lines and notations are self-explanatory. In order to determine the detection limit of ILM-0 for low activity measurements, for soil matrices were computed from the minimum detectable counts () using the Eq. 7. In close counting geometry, coincident summing affects the observed photopeak yield [13]. In the present analysis, nuclides in natural radioactive decay chains were considered to be in secular equilibrium, and the gamma-rays with negligible coincidence summing were chosen to estimate activities. is calculated for several radionuclides often encountered in the environmental samples from which the most dominating ones are shown in Table 6. MDA values for 137Cs nuclide have the lowest value and hence determine the nuclide detection limit.
| Radionuclide | Energy | ||
| (/Parent) | (keV) | (counts/day) | (Bq/kg) |
| 212Pb (/232Th) | 238.6 | 65 | 1 |
| 214Bi (/238U) | 1764.5 | 76 | 25 |
| 214Pb (/238U) | 295.3 | 85 | 5 |
| 228Ac (/232Th) | 911.2 | 39 | 4 |
| 137Cs | 661.6 | 3 | 0.1 |
| 60Co | 1332.5 | 38 | 2 |
| 40K | 1460.8 | 120 | 49 |
The specific activities were estimated from the measured photopeak yield after background correction, defined as activity per unit mass corresponding to a given transition of the radionuclide was determined using,
| (8) |
where is the net observed counts in the photopeak after correcting for the ambient background. The uncertainty in the specific activity includes the error in efficiency and peak fitting. Most of the gamma-rays were visible from the uranium and thorium decay chains. However, only those gamma-rays that could be unambiguously assigned to a particular nuclide were considered for further analysis. Therefore, correction factors due to sample self-absorption and coincidence summing can be reasonably neglected. For 238U single gamma line of 214Pb at 295.3 keV, for 232Th gamma line of 212Pb at 238.6 keV and 40K 1460.8 keV were selected for the analysis. The observed specific activity of primordial radionuclides in the soil samples was found to range between 32–67, 66–107, and 590–860 with a mean specific activity of 50, 85, and 670 Bq/kg for 238U, 232Th, and 40K, respectively. The measured activity of 238U and 232Th showed a consistent distribution of primordial radionuclides among all the soil samples, while a somewhat large scatter is observed in 40K data. In the case of rock sample measurements, the measured specific activity of 238U in Aut rock is 7 (1) Bq/kg, which is similar in comparison to the value reported in Ref [13], while for 232Th and 40K no measurable activity could be observed above the ambient background at the present experimental sensitivity. To estimate the activity concentration in rock samples, reducing the overall background by an order of magnitude is necessary, as seen in Figure 12. The existing setup needs augmentation with thicker low activity lead/copper shields to improve the detection limits. As discussed earlier, above-ground laboratories are mostly dominated by muon-induced interactions; therefore, deploying additional cosmic muon veto systems are desirable to improve the sensitivity with an overall background reduction of about 50% in the present setup.
4 Summary and Conclusions
In summary, a moderately shielded low background counting facility has been set up at IIT Ropar to investigate environmental radioactivity and rare decays. The GEANT4 simulations employing Monte Carlo procedures have been performed to determine the photopeak efficiency of the HPGe detector, and an effective detector model has been obtained. Various parameters, such as; crystal radius (R), crystal length (L), front gap (g), dead layers (td, tb, and ts) have been compared and optimized through the lateral, radial and distance scanning measurements. The relative deviations between simulated and experimental efficiencies were found to be 7% within the photon energy range of 80.9–1408 keV, indicating as high as 93% confidence level in the comparison between experimental characterization and simulation. In order to assess the performance of the setup, the trace concentration of radioactive elements has been measured in soil samples from the agricultural test site in Ropar with ILM-0. The studied site has mean specific activity of 50, 85, and 670 Bq/kg for 238U, 232Th, and 40K, respectively. While 238U and 232Th activities among the samples are consistent within overall uncertainty, 40K shows a somewhat more significant variation. The Aut rock measurements have shown specific activity of 238U to be 7 (1) Bq/kg, while for 232Th, and 40K furthur measures to improve signal-to-noise ratio are essential. Efforts are underway to augment the setup with low activity lead shields and plastic veto detectors to improve the sensitivity for studies relevant to rare decay searches. Measurements of the studied site with rich datasets employing two detector configurations are proposed.
5 Acknowledgments
The authors thank Prof. R. G. Pillay and Prof. Vandana Nanal for their suggestions during the development of the setup. The Indian Institute of Technology Ropar acknowledged for an ISIRD grant for setting up ILM-0 for rare decay physics. One of the authors, Swati Thakur thanks the Ministry of Education (MoE), Government of India, for the doctoral fellowship, and iHub - AWaDH, a Technology Innovation Hub established by the Department of Science Technology, Government of India, in the framework of the National Mission on Interdisciplinary Cyber-Physical Systems (NM - ICPS), for financial support to execute this work. Soni Devi and Katyayni Tiwari thank the doctoral fellowships received from the University Grant Commission and DST - INSPIRE, respectively.
References
- [1] S. Thakur, Radiation background investigations for environmental and rare decay studies, Ph.D. thesis, IIT Ropar (2023).
- [2] G. Heusser, Low-radioactivity background techniques, Ann. Rev. Nucl. Part. Sci. 45 (1995) 543–590. doi:10.1146/annurev.ns.45.120195.002551.
-
[3]
C. Arpesella, et al.,
Measurements
of extremely low radioactivity levels in borexino, Astroparticle Physics
18 (1) (2002) 1–25.
doi:https://doi.org/10.1016/S0927-6505(01)00179-7.
URL https://www.sciencedirect.com/science/article/pii/S0927650501001797 -
[4]
M. Laubenstein, et al.,
Underground
measurements of radioactivity, Applied Radiation and Isotopes 61 (2) (2004)
167–172, low Level Radionuclide Measurement Techniques - ICRM.
doi:https://doi.org/10.1016/j.apradiso.2004.03.039.
URL https://www.sciencedirect.com/science/article/pii/S0969804304001009 -
[5]
D. Budjás, et al.,
Gamma-ray spectrometry
of ultra low levels of radioactivity within the material screening program
for the gerda experiment, Applied radiation and isotopes : including data,
instrumentation and methods for use in agriculture, industry and medicine
67 (5) (2009) 755—758.
doi:10.1016/j.apradiso.2009.01.019.
URL https://doi.org/10.1016/j.apradiso.2009.01.019 - [6] M. Köhler, et al., A new low-level gamma-ray spectrometry system for environmental radioactivity at the underground laboratory felsenkeller, Applied radiation and isotopes : including data, instrumentation and methods for use in agriculture, industry and medicine 67 (5) (2009) 736–40. doi:10.1016/j.apradiso.2009.01.027.
- [7] M. J. Dolinski, A. W. Poon, W. Rodejohann, Neutrinoless double-beta decay: Status and prospects, Annual Review of Nuclear and Particle Science 69 (1).
-
[8]
M. Laubenstein, I. Lawson,
Low
background radiation detection techniques and mitigation of radioactive
backgrounds, Frontiers in Physics 8 (2020) 506.
doi:10.3389/fphy.2020.577734.
URL https://www.frontiersin.org/article/10.3389/fphy.2020.577734 -
[9]
P. Bossew,
A
very long-term hpge-background gamma spectrum, Applied Radiation and
Isotopes 62 (4) (2005) 635–644.
doi:https://doi.org/10.1016/j.apradiso.2004.09.006.
URL https://www.sciencedirect.com/science/article/pii/S0969804304005299 -
[10]
L. Dragounová, P. Rulík,
Low
level activity determination by means of gamma spectrometry with respect to
the natural background fluctuation, Applied Radiation and Isotopes 81 (2013)
123–127, 6th International Conference on Radionuclide Metrology - Low Level
Radioactivity Measurement Techniques.
doi:https://doi.org/10.1016/j.apradiso.2013.03.017.
URL https://www.sciencedirect.com/science/article/pii/S096980431300105X - [11] N. K. Mondal, India-based neutrino observatory (INO), The European Physical Journal Plus 127 (9) (2012) 1–6.
- [12] S. Banik, et al., Simulation of neutron background for a dark matter search experiment at JUSL, Journal of Instrumentation 16 (06) (2021) P06022. doi:10.1088/1748-0221/16/06/p06022.
- [13] S. Thakur, A. Mazumdar, N. Jangid, V. Vatsa, et al., Radiopurity studies of a rock sample from the Aut region, Nuclear Instruments and Methods in Physics Research Section A: Accelerators, Spectrometers, Detectors and Associated Equipment (2022) 166892.
-
[14]
M. Hult, S. Geelen, M. Stals, G. Lutter, G. Marissens, H. Stroh, S. Schreurs,
W. Schroeyers, M. Bruggeman, L. Verheyen,
Determination
of homogeneity of the top surface deadlayer in an old hpge detector, Applied
Radiation and Isotopes 147 (2019) 182–188.
doi:https://doi.org/10.1016/j.apradiso.2019.02.019.
URL https://www.sciencedirect.com/science/article/pii/S0969804318311643 -
[15]
E. Uyar, M. H. Bölükdemir,
Characterisation
of two p-type hpge detectors by measurements and monte carlo simulations,
Measurement 204 (2022) 112092.
doi:https://doi.org/10.1016/j.measurement.2022.112092.
URL https://www.sciencedirect.com/science/article/pii/S026322412201288X - [16] N. Dokania, V. Singh, M. Malar, V. Nanal, S. Pal, R. Pillay, Characterization and modeling of a low background hpge detector, Nuclear Instruments and Methods in Physics Research Section A Accelerators Spectrometers Detectors and Associated Equipment 745 (2013) 119–127. doi:10.1016/j.nima.2014.01.064.
-
[17]
A. Aguilar-Arevalo, et al.,
Characterization of
germanium detectors for the first underground laboratory in mexico, Journal
of Instrumentation 15 (11) (2020) P11014–P11014.
doi:10.1088/1748-0221/15/11/p11014.
URL https://doi.org/10.1088/1748-0221/15/11/p11014 -
[18]
A. Subercaze, T. Sauzedde, C. Domergue, C. Destouches, H. Philibert,
C. Fausser, N. Thiollay, G. Gregoire, A. Zoia,
Effect
of the geometrical parameters of an hpge detector on efficiency calculations
using monte carlo methods, Nuclear Instruments and Methods in Physics
Research Section A: Accelerators, Spectrometers, Detectors and Associated
Equipment 1039 (2022) 167096.
doi:https://doi.org/10.1016/j.nima.2022.167096.
URL https://www.sciencedirect.com/science/article/pii/S0168900222005010 -
[19]
J. Boson, et al.,
A
detailed investigation of hpge detector response for improved monte carlo
efficiency calculations, Nuclear Instruments and Methods in Physics Research
Section A: Accelerators, Spectrometers, Detectors and Associated Equipment
587 (2) (2008) 304–314.
doi:https://doi.org/10.1016/j.nima.2008.01.062.
URL https://www.sciencedirect.com/science/article/pii/S0168900208000995 -
[20]
P. Dryak, P. Kovar,
Experimental
and mc determination of hpge detector efficiency in the 40–2754kev energy
range for measuring point source geometry with the source-to-detector
distance of 25cm, Applied Radiation and Isotopes 64 (10) (2006) 1346–1349,
proceedings of the 15th International Conference on Radionuclide Metrology
and its Applications.
doi:https://doi.org/10.1016/j.apradiso.2006.02.083.
URL https://www.sciencedirect.com/science/article/pii/S0969804306000960 -
[21]
M. Koleska, L. Viererbl, M. Marek,
Development
of the mcnpx model for the portable hpge detector, Radiation Physics and
Chemistry 104 (2014) 351–354, 1st International Conference on Dosimetry and
its Applications.
doi:https://doi.org/10.1016/j.radphyschem.2014.03.035.
URL https://www.sciencedirect.com/science/article/pii/S0969806X14001091 -
[22]
Linux advanced multiparameter
sysytem.
URL https://www.tifr.res.in/~pell/lamps.html -
[23]
M. Medhat, N. Demir, U. A. Tarim, O. Gurler,
Calculation of gamma-ray
mass attenuation coefficients of some egyptian soil samples using monte carlo
methods, Radiation Effects and Defects in Solids 169 (8) (2014) 706–714.
arXiv:https://doi.org/10.1080/10420150.2014.918129, doi:10.1080/10420150.2014.918129.
URL https://doi.org/10.1080/10420150.2014.918129 - [24] G. Gilmore, Practical Gamma Ray Spectrometry, John Wiley & Sons, New York U.S.A, 2008.
-
[25]
D. Budjáš, et al.,
Optimisation
of the mc-model of a p-type ge-spectrometer for the purpose of efficiency
determination, Applied Radiation and Isotopes 67 (5) (2009) 706–710, 5th
International Conference on Radionuclide Metrology - Low-Level Radioactivity
Measurement Techniques ICRM-LLRMT’08.
doi:https://doi.org/10.1016/j.apradiso.2009.01.015.
URL https://www.sciencedirect.com/science/article/pii/S0969804309000207 - [26] G. Gupta, et al., Modeling of an electrically cooled HPGe detector, DAE Symposium on Nuclear Physics 63 (2018) 1142–1143.
-
[27]
L. A. Currie, Limits for qualitative
detection and quantitative determination. application to radiochemistry,
Analytical Chemistry 40 (3) (1968) 586–593.
doi:10.1021/ac60259a007.
URL https://doi.org/10.1021/ac60259a007 -
[28]
K. Saini, B. Bajwa,
Mapping
natural radioactivity of soil samples in different regions of punjab, india,
Applied Radiation and Isotopes 127 (2017) 73–81.
doi:https://doi.org/10.1016/j.apradiso.2017.05.013.
URL https://www.sciencedirect.com/science/article/pii/S0969804316308089