MagAO-X and HST high-contrast imaging of the AS209 disk at H
Abstract
The detection of emission lines associated with accretion processes is a direct method for studying how and where gas giant planets form, how young planets interact with their natal protoplanetary disk and how volatile delivery to their atmosphere takes place. H (m) is expected to be the strongest accretion line observable from the ground with adaptive optics systems, and is therefore the target of specific high-contrast imaging campaigns. We present MagAO-X and HST data obtained to search for H emission from the previously detected protoplanet candidate orbiting AS209, identified through ALMA observations. No signal was detected at the location of the candidate, and we provide limits on its accretion. Our data would have detected an H emission with erg s-1 cm-2, a factor 6.5 lower than the HST flux measured for PDS70 b (Zhou et al., 2021). The flux limit indicates that if the protoplanet is currently accreting it is likely that local extinction from circumstellar and circumplanetary material strongly attenuates its emission at optical wavelengths. In addition, the data reveal the first image of the jet north of the star as expected from previous detections of forbidden lines. Finally, this work demonstrates that current ground-based observations with extreme adaptive optics systems can be more sensitive than space-based observations, paving the way to the hunt for small planets in reflected light with extremely large telescopes.
1 Introduction
In recent years observations by the Atacama Large Millimeter and Submillimeter Array (ALMA) and high contrast imagers including SPHERE and GPI revealed that circumstellar disks are highly structured, with gaps, rings and spirals being among the most important observable features (e.g., Andrews et al., 2018; Avenhaus et al., 2018; Tschudi & Schmid, 2021; Bae et al., 2022a; Benisty et al., 2022). While other explanations have been proposed (e.g., snowlines or turbulence, Zhang et al., 2015; Flock et al., 2015), it is widely accepted that at least some of these structures are the result of the interaction with forming planets. This hypothesis is supported by the direct detection of two confirmed protoplanets in the cavity of the transition disk PDS70 (Keppler et al., 2018; Haffert et al., 2019). However, despite significant observational efforts, no other confirmed planet in the cavities of other disks has been detected, neither in the infrared (Asensio-Torres et al., 2021; Cugno et al., 2023) nor in emission lines associated to accretion (Cugno et al., 2019; Zurlo et al., 2020; Xie et al., 2020; Huélamo et al., 2022; Follette et al., 2022). Two candidates have been directly detected through H emission (LkCa15 b and AB Aur b, Sallum et al., 2015; Currie et al., 2022); the first has never been redetected, and near-infrared observations suggest it could be a reprocessed scattered light feature (Currie et al., 2019), while the second one shows H emission consistent with scattered light from the disk (Zhou et al., 2022) and requires further investigation.
An alternative method for inferring the existence of protoplanets and studying their formation is to examine the effect they have on the disk structure (Pinte et al., 2022). Indeed, young gas giant planets leave observational traces on the velocity field of the surrounding gas due to their gravitational force, manifesting as kinks (Pinte et al., 2018, 2020), doppler flips (Casassus & Pérez, 2019), deviations from Keplerian velocity (Teague et al., 2018, 2021), or molecular emission line broadening along the planet orbit (Dong et al., 2019; Izquierdo et al., 2022).
AS209 (alternative name V 1121 Oph) is a young ( Myr, Andrews et al. 2009) K5 ( mag) star with a mass of (Öberg et al., 2021; Teague et al., 2021). Fernandez et al. (1995) measured the H flux of the star to be erg s-1 cm-2, which translates in a mass accretion rate of yr-1 when using the line luminosity vs. accretion luminosity relationship from Fang et al. (2009). This value is in strong agreement with the mass accretion rate of yr-1 obtained by Fang et al. (2018) using multiple emission line luminosities other than H. It is surrounded by a well-studied protoplanetary disk (, Huang et al. 2018) that has been the subject of several major surveys such as DSHARP (Andrews et al., 2018; Huang et al., 2018; Guzmán et al., 2018), DARTTS-S (Avenhaus et al., 2018), and MAPS (Öberg et al., 2021). As part of the MAPS program, Bae et al. (2022b) identified a candidate circumplanetary disk (CPD) detected in 13CO within a gap at au previously identified in 12CO and scattered light observations (Guzmán et al., 2018; Avenhaus et al., 2018). Subsequent kinematic analysis of the molecular line data revealed disk winds emerging from the gap around the candidate, showing a complex interplay between forming planets and disk winds (Galloway-Sprietsma et al., 2023; Izquierdo et al., 2023). A wind from the central star was also inferred through high resolution spectroscopy of forbidden lines (Fang et al., 2018; Banzatti et al., 2019).
In this paper we search for H emission from the the CPD candidate orbiting AS209 with the Magellan Adaptive Optics eXtreme (MagAO-X) instrument (Males et al., 2022a) and with HST/WFC3/UVIS. MagAO-X is a new high-contrast imaging instrument that pushes extreme adaptive optics to visible wavelengths (Males et al., 2018; Close et al., 2018; Males et al., 2022a), including H (Close, 2020). MagAO-X is a successor to MagAO (Close et al., 2014a) and has an increased number of controllable modes (1600 versus 300), AO loop speed (2 kHz versus 1 kHz) and sensitivity (twice the throughput at H). The data reveal a stellar jet at short separations, while no localized H emission at the location of the CPD candidate or anywhere else within the disk is detected. This Paper is structured as follows: in Sect. 2 we present the MagAO-X and HST observations and in Sect. 3 we detail our data reductions. The main results are reported in Sect. 4 and discussed in Sect. 5. The conclusions of our work can be found in Sect. 6.
2 Observations
2.1 MagAO-X
AS209 was observed with the MagAO-X instrument at the Las Campanas Observatory on April 17 2022 and April 20 2022. The observing conditions were very different between the two nights. On April 17, data were taken under very stable conditions, with seeing for most of the night, airmass and photometric sky. Conversely, due to extremely unstable atmospheric conditions on April 20, the second set of data were not usable. As a result, this manuscript focuses solely on the data obtained on April 17.
AS209 was observed in H dual-band imaging mode, which involves splitting the light into the H (m, nm) and nearby continuum (Cnt, m, nm) filters after it has undergone the same optical path through the instrument. This results in the very similar diffraction and speckle pattern in both filters, allowing the continuum image to be used to remove the stellar contribution from the H image without affecting any potential line flux emitted from a protoplanet. Typical protoplanets do not contribute in the continuum image at m due to their relatively low temperatures ( K) compared to stars. For more details on this observational mode and the reasoning behind it we refer to Close et al. (2014b) and Cugno et al. (2019).
We obtained a total of 209 frames in each filter with a Detector Integration Time (DIT) of 60 s per exposure. Thanks to the high sky rotation rate, we achieved a total field rotation of , ensuring a high throughput for the angular differential imaging (ADI; Marois et al., 2006) post-processing algorithm.
2.2 HST/WFC3/UVIS
AS209 was observed with the HST/WFC3/UVIS instrument on 2023-05-03 for three orbits in the F656N (H narrowband, Å, Å) filter using the UVIS2/C512C subarray (field of view ). To improve the spatial sampling, a four-points dithering pattern was used, in which the telescope moves by 0.5 pixels between exposures. In total we obtained 108 frames of 13 s each, for a total time on target amounting to 23.4 min. In order to perform ADI, the roll angle in Orbit 2 differs by 35∘ from those in Orbits 1 and 3.
3 Data reduction
3.1 MagAO-X
The MagAO-X data were reduced using the high-contrast imaging pipeline PynPoint (Amara & Quanz, 2012; Stolker et al., 2019). After dark and flat calibration, frames are flipped along the x-axis to correct for a reflection within the instrument and bad pixels are corrected by 4-sigma clipping. Images are then aligned to each other using cross-correlation and then centered by fitting a 2D Gaussian function to the mean image. Continuum and H frames were found to display an azimuthal offset of about and we corrected this by rotating the continuum images. This process resulted in squared images of in size (MagAO-X pixel scale is ).
We applied a frame selection based on the peak intensity of the PSF in the H filter, measured in an aperture of radius (2.3 pixels) in order not to be biased by the position of the star on the pixel grid. Since the instrument response to a point source is the same for every source, when the stellar PSF has a lower peak due to low Strehl, the same applies to faint protoplanet signals, making them more difficult to detect. We removed images with peak fluxes that deviated by from the maximum value of the entire dataset. This step removed 45 frames out of 209 from the dataset, most of them temporally located towards the end of the night, when weather conditions started to deteriorate.
Two different PSF subtraction techniques were applied. First, we removed the stellar PSF from individual filters (both H and Continuum) using ADI based on principal component analysis (PCA, Amara & Quanz, 2012). We found that at least 10 principal components have to be subtracted in order to remove the bright stellar noise. Second, the PSF was removed using a combination of dual-filter differential imaging (Close et al., 2014b; Cugno et al., 2019) followed by ADI. The continuum frames are first spatially downscaled to match the PSF size (which is ) at the H wavelength111Information on the MagAO-X H filters can be found at https://magao-x.org/docs/handbook/observers/filters.html and their flux is upscaled by a factor 2.1 to match the total flux in the corresponding H image within an aperture of . This is necessary to compensate for the substantial line emission contribution due to stellar accretion in the H filter. We found that the continuum subtraction accurately cancels most of the stellar noise, and only a few components have to be removed to reveal faint sources. After the final residuals were median-combined, we applied a Gaussian filter of the size of the PSF (FWHM=0034) to reduce pixel-to-pixel variation and highlight protoplanetary candidates.
3.2 HST
We initiated the data reduction process using the flc file obtained from the MAST archive. To begin with, we visually inspected the data in order to identify any hot pixels and cosmic rays present. These pixels were then replaced by employing linear interpolations based on the neighboring pixels. Subsequently, we reconstructed Nyquist sampled images by interlacing sets of four dithered images in Fourier space (for details on the image reconstruction we refer the reader to Lauer 1999; Zhou et al. 2021). This step resulted in 27 Nyquist sampled images with pixelscale .
For the primary subtraction, we again employed PynPoint. To align the images, we registered them according to the centroids of the PSFs, which were determined through two-dimensional Gaussian fitting. The centroid-aligned image cube was then fed into the PCA algorithm, where images from one roll position are used to model and subtract the central PSF in the other roll position. For HST data, only a few components were removed. Finally, after derotating and median-combining the frames we applied again the highpass filter (FWHM).
4 Results
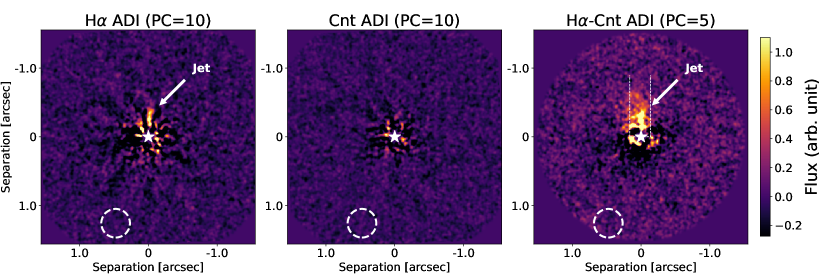
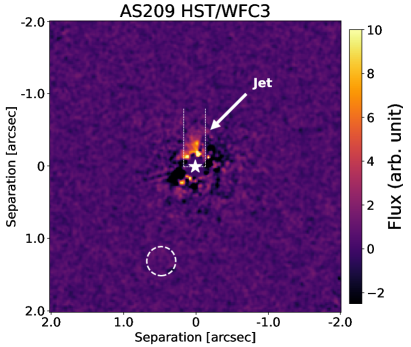
The residual images (shown in Fig. 1 and Fig. 2) do not reveal a signal at the location of the CPD candidate (, Bae et al., 2022b), and in Sect. 4.1 we calculate detection limits at the candidate location and discuss the non-detection. In addition, the residuals show extended emission North of the star coming from a jet both in the MagAO-X and HST data, presented in Sect. 4.2.
4.1 The CPD candidate
The protoplanet candidate surrounded by a circumplanetary disk detected in 13CO by Bae et al. (2022b) was not detected neither with MagAO-X nor with HST in H. Its expected position is shown in the residual images of Fig. 1 and Fig. 2.
To quantify the relevance of the non detection, we estimated detection limits on the presence of H emitting sources. These were obtained with the applefy tool presented in Bonse et al. (2023) based on the metric proposed by Mawet et al. (2014). The detection threshold was fixed to a false positive fraction (FPF) of , equivalent to 5 for large separations and Gaussian noise. Artificial protoplanetary signals were inserted every at four different PAs. The planet signal and the noise were measured in an aperture of pix and 2.0 pix for MagAO-X and HST data (half FWHM), respectively. For every separation the noise for 360 different aperture placements is estimated and we report the median over all results with the standard deviation representing the systematic uncertainty on the contrast measurement (see Bonse et al. 2023 for more details). Because the presence of the bright jet could bias the contrast curves, especially at short separations, we rotated the residuals in the opposite direction before combining them and estimating the noise (Pairet et al., 2019). This approach maintains the stellar and speckle noise, but avoids the presence of physical signals in the images used to sample the noise.
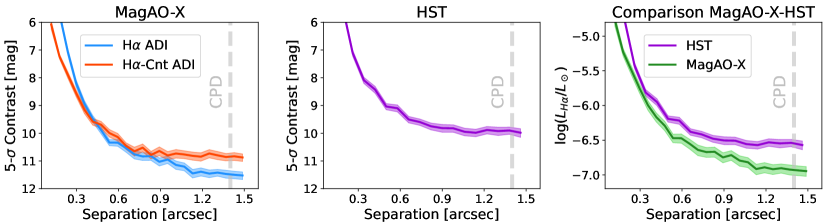
The obtained contrast curves from MagAO-X data are shown in the left panel of Fig. 3, in orange for the HCnt and in blue for the H stack with PCA-ADI PSF-subtraction. For the injection of planets we used the PSF from the continuum filter, as about 25% of the data in the H filter is saturated in the inner few pixels. In addition, stellar line emission may suffer from variability on different timescales and therefore the H flux is more difficult to calibrate. We note that the different filter throughputs might introduce a bias in the flux estimate of a few percent, much smaller than the contrast uncertainties. At small separations, H differential imaging outperforms ADI, providing contrasts mag deeper. At larger separations, simple ADI reaches higher contrasts than H differential imaging. We attribute this behavior to the higher detector and readout noise introduced in the data by the continuum subtraction in the outer regions of the images, where the stellar emission does not dominate.
The contrast limits of the left panel of Fig. 3 show that at the separation of the CPD candidate we reach a 5 contrast of mag. For the absolute calibration, we adopted erg s-1 cm-2 for the stellar flux in the continuum filter of the MagAO-X data (Henden et al., 2015), where the 10% uncertainty was conservatively chosen to include potential variability (the nominal measurement uncertainty is 4%). Combining this value with the contrast limit measured for the CPD candidate, we obtained a H flux limit for the protoplanet of erg s-1 cm-2, which once corrected for the stellar distance ( pc, Gaia Collaboration 2022) corresponds to a luminosity of . The overall luminosity upper limit as a function of separation from the MagAO-X data is shown in green in the right panel of Fig. 3. At each separation, we adopted the higher contrast between the two curves reported in the left panel.
The contrast limits measured by HST are shown in the central panel of Fig. 3. At the separation of the CPD candidate we reach a contrast of mag. The contrast measured with respect to the stellar flux in the only HST filter available is not directly comparable to the one obtained above for the MagAO-X data for two reasons: (i) the HST filter is centred on the H line, while for a more reliable flux calibration the MagAO-X contrast limits were measured with respect to stellar flux obtained in the continuum filter, and (ii) the HST filter has a width of Å, 5 smaller than the MagAO-X filters ( Å). From the HST images, we were able to directly measure the stellar flux in the F656N filter: erg s-1 cm-2 Å-1.Applying the contrast at the separation of the CPD candidate, we obtain a flux limit from the HST data of erg s-1 cm-2, and once corrected for stellar distance a luminosity upper limit of . These two quantities are directly comparable to the MagAO-X data, which provided lower limits and are able to exclude planets with dimmer luminosities. Hence, for the interpretation of the non-detection we will only focus on the upper limits provided by MagAO-X. The comparison of sensitivities achieved by the two observatories is further discussed in Sect. 5.4.
4.2 Jet
Figure 1 and Figure 2 reveal a jet north of the star imaged for the first time in AS209. Its extension in the 2D projected image goes up to a separation of in the MagAO-X data. The jet in the HST data is detected only up to , thus the values provided next only refer to MagAO-X data. Assuming the jet is perpendicular to the disk plane, its physical extension is estimated to be au. Its width in the residuals is , equivalent to au at AS209 distance. This value is in line with FWHM of jets from other TTauri stars (Ray et al., 2007). No receding jet is detected, possibly due to the obscuring effect of the circumstellar disk.
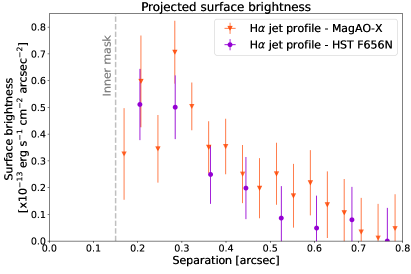
To estimate the jet profile, we applied a rectangular mask ( width for both instruments) to focus only on the image region with the jet signal (see dashed lines in the right panel of Fig. 1 and in Fig. 2). To avoid the more aggressive subtraction induced by PCA, we used residuals produced with classical ADI: given the large field rotation in the MagAO-X data and the roll angle observing strategy used to obtain the HST data, we expect subtraction of the extended jet signal to be minimal (throughput ) at large enough separations. However, some level of self-subtraction is expected in the innermost region of the images. In addition, those same regions suffer from strong speckles residuals from the PSF subtraction. Hence, we masked the inner in each dataset. The flux from the the jet was measured in annuli in steps of 1 FWHM ( pix and pix for MagAO-X and HST data respectively), and normalized to the measurement area, obtaining the surface brightness profile. To calibrate the flux, we estimated the PSF counts within an aperture of and we compare it to the stellar flux as described in Sect. 4.1 to find a count-to-flux conversion factor for each instrument. The obtained conversion factors were applied to the brightness profiles, and the calibrated profiles are reported in Fig. 4. The profiles estimated from the two instruments are in agreement. For the errorbars, we considered two types of uncertainties. The first one, corresponding to the noise induced by stellar residuals, was estimated by considering the residuals outside the jet mask at the same separations and assigning an uncertainty to the measurement corresponding to the fraction of the noise counts over the jet counts (normalized by area). The second one corresponds to photon noise. At each separation we considered the largest source of uncertainty (residuals , photon noise ). The profiles obtained with the two instruments largely agree with each other.
The jet appears rather smooth and does not show significant knots as it was observed for RY Tau (Garufi et al., 2019; Uyama et al., 2022) and HD163296 (Ellerbroek et al., 2014; Xie et al., 2021). However, it seems some intensity variation is present between and in the MagAO-X data, even though with the current data it is difficult to assess if the bumps in the profile are physical or due to the post-processing.
5 Discussion
5.1 The protoplanet mass
AS209 has been observed with VLT/NaCo in the -band as part of the NaCo-ISPY survey (Launhardt et al., 2020). The data, presented in Cugno et al. (2023), exclude the presence of a companion brighter than 17.2 mag, which translates in an absolute magnitude of 11.8 mag at . Even though Cugno et al. (2023) showed the risk of using evolutionary models to transform IR brightness measurements into mass estimates, we use the detection limits to obtain a rough estimate of what near-IR high-contrast imaging can exclude, assuming a clear view of the planet photosphere and no contribution of the accretion luminosity at . For hot-start scenarios like AMES-Cond, NaCo limits exclude objects with , a very tight upper limit. However, for a colder scenario like the for the BEX-Warm models presented in Marleau et al. (2019) the mass limit is (assuming an age of Myr), providing a much more loose constraint. We note that a planet with such a high mass would have opened a much deeper and wider gap in the gas distribution of the disk than observed in 12CO (Kanagawa et al., 2015).
Bae et al. (2022b) used an empirical planet mass gap width relation and calculated the mass of the planet embedded in the CPD candidate to be , depending on the disk viscosity, assuming it is responsible for carving out the gas gap at au. We note however that more recent work suggested that even lower masses are possible from a dynamical point of view. In fact, Galloway-Sprietsma et al. (2023) found disk winds emerging from the gap the CPD candidate is embedded in, and suggested that the kinematics could be dominated by the winds, not the planet. In this case, the planet mass inferred from the gap width could be over-estimated. These mass estimates agree with the VLT/NaCo detection limits.
5.2 The non-detection from the candidate
Different models can be used to transform measured H luminosities to mass accretion rates. Here, we compare two sets of models: the emission model of shock-heated gas for planetary mass objects (Aoyama et al., 2018, 2020), and the magnetospheric accretion model applied to planetary objects presented in Thanathibodee et al. (2019). Based on their non-Local Thermal Equilibrium (non-LTE) models, Aoyama et al. (2021) determined the relation for protoplanets. Applying the relation to our measurement from Sect. 4.1, we obtain . Following Gullbring et al. (1998), the mass accretion rate can then be estimated with
| (1) |
where is the planet radius, is the disk truncation radius, assumed to be , and is the gravitational constant. The mass of the planet has been assumed to be between and (see Sect. 5.1) and radii were drawn uniformly between 1 and .
In order to consider magnetospheric accretion, we use the models from Thanathibodee et al. (2019) to generate a large grid of scenarios producing H lines. For each calculation, we systematically varied the planets’ and model’s parameters encompassing a wide range of values whose boundaries are given either by the AS209 system possible properties or by extreme scenarios. Using masses between 0.5 and 4 , we adopted evolutionary models from Mordasini et al. (2017) to estimate radii for each mass consistent with 1-2 Myr ( in the range). For a given set of mass and radius, we calculate a grid of 4050 models varying the magnetospheric parameters. The mass accretion rate yr was taken between (weak H produced) to (typical stellar accretion rate), the maximum flow temperature from 7000 K to 8000 K (lower temperature don’t produce H)222We note this parameter is very uncertain even for the more studied case of accreting stars (Muzerolle et al., 2001)., the magnetospheric truncation radius from (smaller values would bring the disk too close to the planet) to (larger values require an unlikely strong magnetic field), flow width from to (similar to stellar scenario), and the inclination from 20 to 50 degree (consistent with the circumstellar disk’s inclination). We then calculate the line luminosity from each model and select the model from which the luminosity is within 1 of the upper limits.
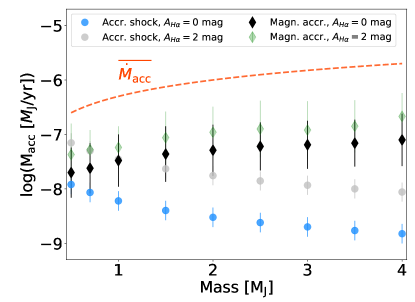
Initially, we did not consider extinction ( mag). Figure 5 shows the mass accretion rate estimate as a function of the planet mass for the H limit of the CPD candidate. The orange dashed line represents the average mass accretion rate necessary to reach the planet mass on the -axis in 2 Myr. As it is still unclear if and how accretion rates onto protoplanets evolve with time and on which timescales, we use as a proxy for a constant mass accretion rate over the stellar lifetime (2 Myr). If , then the planet is either undergoing a period of vigorous (above average) accretion (meaning it underwent lower accretion in the past) or the planet age is lower than 2 Myr. If , then a large fraction of the planet mass was accreted in the past and currently the mass accretion rate is significantly lower than earlier phases. In Fig. 5 the blue circles represent the distribution of possible using the shock-heated gas models, while the black diamonds report the results from the magnetospheric accretion models.
The two models show different trends for increasing planet masses. The reason is that in the magnetospheric accretion model, to the first order, the line flux scales with the flow density (Hartmann et al., 1994, , Eq. 9) and hence for fixed line fluxes does not vary and . Conversely, in the accretion shock models free fall velocity of the infalling material is higher for a more massive planet, increasing the H flux. As a consequence, to produce the same H emission lower is required at higher masses. The comparison betwen and the results for both sets of models suggests that the accretion rate is times lower than . Hence, assuming no extinction, it seems the planet is accreting at a relatively low rate, indicating that in the past the accretion rate was likely much more vigorous.
However, circumstellar and circumplanetary material can strongly affect line emission at H wavelengths, especially in the presence of dust. Avenhaus et al. (2018) detected scattered light from the disk gap in AS209 indicative of the presence of small grains. Moreover, the non-zero disk inclination (, Huang et al. 2018) possibly increases its effect on the detectable line emission. Unfortunately, the extinction properties of the outer regions of a circumstellar disk have never been measured, not to mention that we expect it to vary between sources and within individual sources depending on the location with respect to substructures and disk geometry.
From the non-detection of H and the re-detection of H, Hashimoto et al. (2020) constrained the extinction towards PDS70 b to be mag, while Uyama et al. (2021) inferred and mag for PDS70 b and c respectively considering the non-detection of Pa. Following these estimates, we adopt here mag at the position of the CPD candidate, as it is located, similar to the PDS70 planets, in a deep gap, where the amount of small grains and pebble is expected to be relatively low (but not absent, see Avenhaus et al. 2018).
Including the effect of the extinction from the circumstellar disk material in the gap shifts the results from both models vertically along the -axis of Fig. 5. The new mass accretion rates are now closer to , but still orders of magnitude lower. If this is the case, we conclude again that the protoplanet candidate accreted material much more vigorously in the first phases of its life (Lubow & Martin, 2012; Brittain et al., 2020). The consequence of this early accretion scenario for direct imaging surveys of H emission would be drastic: at younger ages, when planets would accrete at larger rates, stars are still embedded in their envelopes and the direct detection of line emission would likely be hindered by the much larger extinction in the optical.
We note however, that the PDS70 planets (even though located in a different region of the disk) show signs of relatively strong accretion ( yr-1, Hashimoto et al. 2020; Zhou et al. 2021) at much older ages ( Myr, Wang et al., 2021). If the protoplanet candidate continues to accrete material at least at a similar rate, an additional source of attenuation is needed to explain the non-detection, likely from circumplanetary material333We note that Marleau et al. (2022) showed that the accreting material only is not able to substantially increase the extinction along the line of sight.. This scenario would be consistent with the interpretation of the 13CO detection from Bae et al. (2022b), in which a circumplanetary disk surrounds the forming planet. We note that, under the assumption of a planetary atmosphere with physical and chemical properties similar to those of more mature planets, Cugno et al. (2021) estimated the extinction from the circumplanetary environment necessary to suppress molecular features from VLT/SINFONI data of PDS70 b to be mag ( mag). For the same object, Wang et al. (2021) estimated the extinction from fitting the protoplanet’s SED with atmospheric models to be up to mag. A similar value for the extinction towards the protoplanet candidate would allow the upper limits to be consistent with . The much larger extinction from the CPD material is expected to strongly suppress the H signal produced by accretion processes. If this is the case, accretion tracers at longer wavelengths (e.g., Br at m, Br at m) could help reducing the effect of the extinction and confirming the presence of an accreting CPD.
A comparison of the CPD candidate around AS209 with the PDS70 planets reveals significant environmental differences that could explain the non-detection of the former and the multiple detections of the latter. The more advanced developmental stage of the PDS70 system potentially indicates a different evolutionary phase, wherein the planets may be less embedded compared to much younger protoplanetary disks like AS209, as with larger masses and longer times they are more capable of clearing gaps (Szulágyi & Ercolano, 2020; Sanchis et al., 2020). Moreover, the presence of two planets inhabiting the same gap likely ensures an even higher level of gap clearing, thereby mitigating the effect of extinction on the emitted H flux. In order to thoroughly characterize the evolution of forming planets, a greater number of confirmed protoplanet direct detections is necessary, but aforementioned dissimilarities suggest that distinct features are observable during the various phases of their formation.
5.3 A jet in a planet-forming disk
Images of microjets (extensions au) in Class II sources are relatively rare and are mostly confined to forbidden lines (Ray et al., 2007; Pascucci et al., 2022). However, microjets from TTauri stars with high accretion rates are inferred to be common via spatially unresolved spectra of strong forbidden lines such as [O I] (6300) and [S II] (6731), where a ‘high velocity component’ is attributed to collimated outflowing gas with centroids around km s-1, with the red side of the line occulted by the disk (Hartigan et al., 1995). In contrast, detection of a microjet at H in a TTauri star is usually prohibitive due to the high-contrast required to distinguish it from the broad emission arising from magnetospheric accretion onto the star. As an example, in AS209 the equivalent width of H is 113 \textÅ and the line wings extend to 300 km s-1 (Alencar & Basri, 2000). Instruments such as MagAO-X promise to be game changing for imaging microjets at H in accreting Class II sources that, in tandem with forbidden lines, will enable physical parameters, such as density, temperature and mass ejection rates to be determined, as is currently done for resolved jets from Class I and 0 sources (e.g. Nisini et al., 2005).
Of two published profiles of [O I] 6300 in AS209, one from KECK’s HIRES spectrograph (Fang et al., 2018) and the other from Magellan’s MIKE spectrograph (Banzatti et al., 2019), only the second shows a high velocity component associated with jet emission, while both show a low velocity component associated with a slow, extended disk wind. Whether this is due to jet variability or to different slit alignments is unclear. The accretion rate for AS209 has been estimated from calibrated relationships between emission lines and accretion luminosity established from Balmer Jump emission (Alcalá et al., 2017) to be (Fang et al., 2018), sufficiently high for jet emission to be expected (Nisini et al., 2018).
The receding jet was not detected, likely due to absorption from the protoplanetary disk material. Although receding jets are sometimes seen, (for example the Ae/Be star HD163296, see Xie et al., 2021), this is a relatively rare occurrence in TTauri stars.
Future work with instruments like the Visible Integral-field Spectrograph eXtreme (VIS-X, Haffert et al., 2021) will be able to spectrally and spatially resolve the jet at H, allowing for the investigation of its velocity components. In addition, the calculation of ratios with other emission lines in the jet will enable the estimation of the level of ionization and thus jet mass loss rate. Finally, an exciting prospect is the comparison between the stellar and the planetary mass accretion rates, once emission lines, possibly at longer wavelengths, will be detected.
5.4 The future of ground-based high-contrast imaging in the optical
The detection limits reported in Fig. 3 show that in this case the data obtained with MagAO-X are more sensitive than those obtained from space with HST at every separation. Even though at least partially this is due to the very stable weather conditions during the observations and the longer amount of time spent on target (3.5 hr versus 23.4 min)444 Note that including overheads, the amount f time used for MagAO-X and HST observations is comparable, showcasing the efficiency of ground-based imaging., this work demonstrates the success of the recent efforts from the community to improve AO correction at short wavelengths. An additional point to consider is that AS209 is a relatively faint star ( mag) and the AO-correction will be even better for brighter targets like nearby stars. This is an exciting premise for the future development of ground-based high-contrast imagers like ELT/EPICS (Kasper et al., 2010) and GMagAO-X (Males et al., 2022b) that in the next decade will search for small terrestrial planets in reflected light.
6 Summary and Conclusions
We have observed AS209 with the MagAO-X instrument on the 6.5m Magellan Clay telescope at Las Campanas Observatory in dual imaging mode and with the HST/WFC3/UVIS camera in the F656N filter. We detected a collimated jet in H, which can be spectrally resolved with future observations to study the different velocity components. In addition, no signal from the CPD candidate proposed in Bae et al. (2022b) has been detected, suggesting that either the instantaneous mass accretion rate is very low, or that local extinction from the circumstellar and circumplanetary environments is strongly attenuating line emission in the optical.
The interpretation of the protoplanet candidate orbiting AS209 and its mass accretion rate is highly dependent on the flux absorption. Our current inability to accurately characterize the extinction from these elements prevents us from further constraining the accretion onto the protoplanet candidate. Future observations should try to detect other hydrogen recombination lines in the near-IR, where extinction plays a minor role. The comparison of line luminosities will further constrain the extinction from the line emitting region.
References
- Alcalá et al. (2017) Alcalá, J. M., Manara, C. F., Natta, A., et al. 2017, A&A, 600, A20, doi: 10.1051/0004-6361/201629929
- Alencar & Basri (2000) Alencar, S. H. P., & Basri, G. 2000, AJ, 119, 1881, doi: 10.1086/301300
- Amara & Quanz (2012) Amara, A., & Quanz, S. P. 2012, MNRAS, 427, 948, doi: 10.1111/j.1365-2966.2012.21918.x
- Andrews et al. (2009) Andrews, S. M., Wilner, D. J., Hughes, A. M., Qi, C., & Dullemond, C. P. 2009, ApJ, 700, 1502, doi: 10.1088/0004-637X/700/2/1502
- Andrews et al. (2018) Andrews, S. M., Huang, J., Pérez, L. M., et al. 2018, ApJ, 869, L41, doi: 10.3847/2041-8213/aaf741
- Aoyama et al. (2018) Aoyama, Y., Ikoma, M., & Tanigawa, T. 2018, ApJ, 866, 84, doi: 10.3847/1538-4357/aadc11
- Aoyama et al. (2021) Aoyama, Y., Marleau, G.-D., Ikoma, M., & Mordasini, C. 2021, ApJ, 917, L30, doi: 10.3847/2041-8213/ac19bd
- Aoyama et al. (2020) Aoyama, Y., Marleau, G.-D., Mordasini, C., & Ikoma, M. 2020, arXiv e-prints, arXiv:2011.06608. https://arxiv.org/abs/2011.06608
- Asensio-Torres et al. (2021) Asensio-Torres, R., Henning, T., Cantalloube, F., et al. 2021, A&A, 652, A101, doi: 10.1051/0004-6361/202140325
- Avenhaus et al. (2018) Avenhaus, H., Quanz, S. P., Garufi, A., et al. 2018, ApJ, 863, 44, doi: 10.3847/1538-4357/aab846
- Bae et al. (2022a) Bae, J., Isella, A., Zhu, Z., et al. 2022a, arXiv e-prints, arXiv:2210.13314. https://arxiv.org/abs/2210.13314
- Bae et al. (2022b) Bae, J., Teague, R., Andrews, S. M., et al. 2022b, ApJ, 934, L20, doi: 10.3847/2041-8213/ac7fa3
- Banzatti et al. (2019) Banzatti, A., Pascucci, I., Edwards, S., et al. 2019, ApJ, 870, 76, doi: 10.3847/1538-4357/aaf1aa
- Benisty et al. (2022) Benisty, M., Dominik, C., Follette, K., et al. 2022, arXiv e-prints, arXiv:2203.09991. https://arxiv.org/abs/2203.09991
- Bonse et al. (2023) Bonse, M. J., Garvin, E. O., Gebhard, T. D., et al. 2023, arXiv e-prints, arXiv:2303.12030, doi: 10.48550/arXiv.2303.12030
- Brittain et al. (2020) Brittain, S. D., Najita, J. R., Dong, R., & Zhu, Z. 2020, ApJ, 895, 48, doi: 10.3847/1538-4357/ab8388
- Casassus & Pérez (2019) Casassus, S., & Pérez, S. 2019, ApJ, 883, L41, doi: 10.3847/2041-8213/ab4425
- Close (2020) Close, L. M. 2020, The Astronomical Journal, 160, 221
- Close et al. (2014a) Close, L. M., Males, J. R., Follette, K. B., et al. 2014a, in Society of Photo-Optical Instrumentation Engineers (SPIE) Conference Series, Vol. 9148, Adaptive Optics Systems IV, ed. E. Marchetti, L. M. Close, & J.-P. Vran, 91481M, doi: 10.1117/12.2057297
- Close et al. (2014b) Close, L. M., Follette, K. B., Males, J. R., et al. 2014b, ApJ, 781, L30, doi: 10.1088/2041-8205/781/2/L30
- Close et al. (2018) Close, L. M., Males, J. R., Durney, O., et al. 2018, in Society of Photo-Optical Instrumentation Engineers (SPIE) Conference Series, Vol. 10703, Adaptive Optics Systems VI, 107034Y, doi: 10.1117/12.2312280
- Cugno et al. (2019) Cugno, G., Quanz, S. P., Hunziker, S., et al. 2019, A&A, 622, A156, doi: 10.1051/0004-6361/201834170
- Cugno et al. (2021) Cugno, G., Patapis, P., Stolker, T., et al. 2021, A&A, 653, A12, doi: 10.1051/0004-6361/202140632
- Cugno et al. (2023) Cugno, G., Pearce, T. D., Launhardt, R., et al. 2023, A&A, 669, A145, doi: 10.1051/0004-6361/202244891
- Currie et al. (2019) Currie, T., Marois, C., Cieza, L., et al. 2019, ApJ, 877, L3, doi: 10.3847/2041-8213/ab1b42
- Currie et al. (2022) Currie, T., Lawson, K., Schneider, G., et al. 2022, Nature Astronomy, 6, 751, doi: 10.1038/s41550-022-01634-x
- Dong et al. (2019) Dong, R., Liu, S.-Y., & Fung, J. 2019, ApJ, 870, 72, doi: 10.3847/1538-4357/aaf38e
- Ellerbroek et al. (2014) Ellerbroek, L. E., Podio, L., Dougados, C., et al. 2014, A&A, 563, A87, doi: 10.1051/0004-6361/201323092
- Fang et al. (2009) Fang, M., van Boekel, R., Wang, W., et al. 2009, A&A, 504, 461, doi: 10.1051/0004-6361/200912468
- Fang et al. (2018) Fang, M., Pascucci, I., Edwards, S., et al. 2018, ApJ, 868, 28, doi: 10.3847/1538-4357/aae780
- Fernandez et al. (1995) Fernandez, M., Ortiz, E., Eiroa, C., & Miranda, L. F. 1995, A&AS, 114, 439
- Flock et al. (2015) Flock, M., Ruge, J. P., Dzyurkevich, N., et al. 2015, A&A, 574, A68, doi: 10.1051/0004-6361/201424693
- Follette et al. (2022) Follette, K. B., Close, L. M., Males, J. R., et al. 2022, arXiv e-prints, arXiv:2211.02109. https://arxiv.org/abs/2211.02109
- Gaia Collaboration (2022) Gaia Collaboration. 2022, VizieR Online Data Catalog, I/355
- Galloway-Sprietsma et al. (2023) Galloway-Sprietsma, M., Bae, J., Teague, R., et al. 2023, arXiv e-prints, arXiv:2304.03665, doi: 10.48550/arXiv.2304.03665
- Garufi et al. (2019) Garufi, A., Podio, L., Bacciotti, F., et al. 2019, A&A, 628, A68, doi: 10.1051/0004-6361/201935546
- Gullbring et al. (1998) Gullbring, E., Hartmann, L., Briceño, C., & Calvet, N. 1998, ApJ, 492, 323, doi: 10.1086/305032
- Guzmán et al. (2018) Guzmán, V. V., Huang, J., Andrews, S. M., et al. 2018, ApJ, 869, L48, doi: 10.3847/2041-8213/aaedae
- Haffert et al. (2019) Haffert, S. Y., Bohn, A. J., de Boer, J., et al. 2019, Nature Astronomy, 3, 749, doi: 10.1038/s41550-019-0780-5
- Haffert et al. (2021) Haffert, S. Y., Males, J. R., Close, L., et al. 2021, in Society of Photo-Optical Instrumentation Engineers (SPIE) Conference Series, Vol. 11823, Techniques and Instrumentation for Detection of Exoplanets X, ed. S. B. Shaklan & G. J. Ruane, 1182306, doi: 10.1117/12.2594875
- Hartigan et al. (1995) Hartigan, P., Edwards, S., & Ghandour, L. 1995, ApJ, 452, 736, doi: 10.1086/176344
- Hartmann et al. (1994) Hartmann, L., Hewett, R., & Calvet, N. 1994, ApJ, 426, 669, doi: 10.1086/174104
- Hashimoto et al. (2020) Hashimoto, J., Aoyama, Y., Konishi, M., et al. 2020, AJ, 159, 222, doi: 10.3847/1538-3881/ab811e
- Henden et al. (2015) Henden, A. A., Levine, S., Terrell, D., & Welch, D. L. 2015, in American Astronomical Society Meeting Abstracts, Vol. 225, American Astronomical Society Meeting Abstracts #225, 336.16
- Huang et al. (2018) Huang, J., Andrews, S. M., Dullemond, C. P., et al. 2018, ApJ, 869, L42, doi: 10.3847/2041-8213/aaf740
- Huélamo et al. (2022) Huélamo, N., Chauvin, G., Mendigutía, I., et al. 2022, A&A, 668, A138, doi: 10.1051/0004-6361/202243918
- Izquierdo et al. (2022) Izquierdo, A. F., Facchini, S., Rosotti, G. P., van Dishoeck, E. F., & Testi, L. 2022, ApJ, 928, 2, doi: 10.3847/1538-4357/ac474d
- Izquierdo et al. (2023) Izquierdo, A. F., Testi, L., Facchini, S., et al. 2023, arXiv e-prints, arXiv:2304.03607, doi: 10.48550/arXiv.2304.03607
- Kanagawa et al. (2015) Kanagawa, K. D., Muto, T., Tanaka, H., et al. 2015, ApJ, 806, L15, doi: 10.1088/2041-8205/806/1/L15
- Kasper et al. (2010) Kasper, M., Beuzit, J.-L., Verinaud, C., et al. 2010, in Society of Photo-Optical Instrumentation Engineers (SPIE) Conference Series, Vol. 7735, Ground-based and Airborne Instrumentation for Astronomy III, ed. I. S. McLean, S. K. Ramsay, & H. Takami, 77352E, doi: 10.1117/12.856850
- Keppler et al. (2018) Keppler, M., Benisty, M., Müller, A., et al. 2018, A&A, 617, A44, doi: 10.1051/0004-6361/201832957
- Lauer (1999) Lauer, T. R. 1999, PASP, 111, 227, doi: 10.1086/316319
- Launhardt et al. (2020) Launhardt, R., Henning, T., Quirrenbach, A., et al. 2020, A&A, 635, A162, doi: 10.1051/0004-6361/201937000
- Lubow & Martin (2012) Lubow, S. H., & Martin, R. G. 2012, ApJ, 749, L37, doi: 10.1088/2041-8205/749/2/L37
- Males et al. (2018) Males, J. R., Close, L. M., Miller, K., et al. 2018, in Society of Photo-Optical Instrumentation Engineers (SPIE) Conference Series, Vol. 10703, Adaptive Optics Systems VI, 1070309, doi: 10.1117/12.2312992
- Males et al. (2022a) Males, J. R., Close, L. M., Haffert, S., et al. 2022a, in Society of Photo-Optical Instrumentation Engineers (SPIE) Conference Series, Vol. 12185, Adaptive Optics Systems VIII, ed. L. Schreiber, D. Schmidt, & E. Vernet, 1218509, doi: 10.1117/12.2630584
- Males et al. (2022b) Males, J. R., Close, L. M., Haffert, S. Y., et al. 2022b, in Society of Photo-Optical Instrumentation Engineers (SPIE) Conference Series, Vol. 12185, Adaptive Optics Systems VIII, ed. L. Schreiber, D. Schmidt, & E. Vernet, 121854J, doi: 10.1117/12.2630619
- Marleau et al. (2019) Marleau, G.-D., Mordasini, C., & Kuiper, R. 2019, ApJ, 881, 144, doi: 10.3847/1538-4357/ab245b
- Marleau et al. (2022) Marleau, G. D., Aoyama, Y., Kuiper, R., et al. 2022, A&A, 657, A38, doi: 10.1051/0004-6361/202037494
- Marois et al. (2006) Marois, C., Lafrenière, D., Doyon, R., Macintosh, B., & Nadeau, D. 2006, ApJ, 641, 556, doi: 10.1086/500401
- Mawet et al. (2014) Mawet, D., Milli, J., Wahhaj, Z., et al. 2014, ApJ, 792, 97, doi: 10.1088/0004-637X/792/2/97
- Mordasini et al. (2017) Mordasini, C., Marleau, G. D., & Mollière, P. 2017, A&A, 608, A72, doi: 10.1051/0004-6361/201630077
- Muzerolle et al. (2001) Muzerolle, J., Calvet, N., & Hartmann, L. 2001, ApJ, 550, 944, doi: 10.1086/319779
- Nisini et al. (2018) Nisini, B., Antoniucci, S., Alcalá, J. M., et al. 2018, A&A, 609, A87, doi: 10.1051/0004-6361/201730834
- Nisini et al. (2005) Nisini, B., Bacciotti, F., Giannini, T., et al. 2005, A&A, 441, 159, doi: 10.1051/0004-6361:20053097
- Öberg et al. (2021) Öberg, K. I., Guzmán, V. V., Walsh, C., et al. 2021, ApJS, 257, 1, doi: 10.3847/1538-4365/ac1432
- Pairet et al. (2019) Pairet, B., Cantalloube, F., Gomez Gonzalez, C. A., Absil, O., & Jacques, L. 2019, MNRAS, 487, 2262, doi: 10.1093/mnras/stz1350
- Pascucci et al. (2022) Pascucci, I., Cabrit, S., Edwards, S., et al. 2022, arXiv e-prints, arXiv:2203.10068. https://arxiv.org/abs/2203.10068
- Pinte et al. (2022) Pinte, C., Teague, R., Flaherty, K., et al. 2022, arXiv e-prints, arXiv:2203.09528, doi: 10.48550/arXiv.2203.09528
- Pinte et al. (2018) Pinte, C., Price, D. J., Ménard, F., et al. 2018, ApJ, 860, L13, doi: 10.3847/2041-8213/aac6dc
- Pinte et al. (2020) —. 2020, ApJ, 890, L9, doi: 10.3847/2041-8213/ab6dda
- Ray et al. (2007) Ray, T., Dougados, C., Bacciotti, F., Eislöffel, J., & Chrysostomou, A. 2007, in Protostars and Planets V, ed. B. Reipurth, D. Jewitt, & K. Keil, 231. https://arxiv.org/abs/astro-ph/0605597
- Sallum et al. (2015) Sallum, S., Follette, K. B., Eisner, J. A., et al. 2015, Nature, 527, 342, doi: 10.1038/nature15761
- Sanchis et al. (2020) Sanchis, E., Picogna, G., Ercolano, B., Testi, L., & Rosotti, G. 2020, MNRAS, 492, 3440, doi: 10.1093/mnras/staa074
- Stolker et al. (2019) Stolker, T., Bonse, M. J., Quanz, S. P., et al. 2019, A&A, 621, A59, doi: 10.1051/0004-6361/201834136
- Szulágyi & Ercolano (2020) Szulágyi, J., & Ercolano, B. 2020, ApJ, 902, 126, doi: 10.3847/1538-4357/abb5a2
- Teague et al. (2018) Teague, R., Bae, J., Bergin, E. A., Birnstiel, T., & Foreman-Mackey, D. 2018, ApJ, 860, L12, doi: 10.3847/2041-8213/aac6d7
- Teague et al. (2021) Teague, R., Bae, J., Aikawa, Y., et al. 2021, ApJS, 257, 18, doi: 10.3847/1538-4365/ac1438
- Thanathibodee et al. (2019) Thanathibodee, T., Calvet, N., Bae, J., Muzerolle, J., & Hernández, R. F. 2019, ApJ, 885, 94, doi: 10.3847/1538-4357/ab44c1
- Tschudi & Schmid (2021) Tschudi, C., & Schmid, H. M. 2021, A&A, 655, A37, doi: 10.1051/0004-6361/202141028
- Uyama et al. (2021) Uyama, T., Xie, C., Aoyama, Y., et al. 2021, AJ, 162, 214, doi: 10.3847/1538-3881/ac2739
- Uyama et al. (2022) Uyama, T., Takami, M., Cugno, G., et al. 2022, AJ, 163, 268, doi: 10.3847/1538-3881/ac67a0
- Wang et al. (2021) Wang, J. J., Vigan, A., Lacour, S., et al. 2021, AJ, 161, 148, doi: 10.3847/1538-3881/abdb2d
- Xie et al. (2020) Xie, C., Haffert, S. Y., de Boer, J., et al. 2020, A&A, 644, A149, doi: 10.1051/0004-6361/202038242
- Xie et al. (2021) —. 2021, A&A, 650, L6, doi: 10.1051/0004-6361/202140602
- Zhang et al. (2015) Zhang, K., Blake, G. A., & Bergin, E. A. 2015, ApJ, 806, L7, doi: 10.1088/2041-8205/806/1/L7
- Zhou et al. (2021) Zhou, Y., Bowler, B. P., Wagner, K. R., et al. 2021, AJ, 161, 244, doi: 10.3847/1538-3881/abeb7a
- Zhou et al. (2022) Zhou, Y., Sanghi, A., Bowler, B. P., et al. 2022, ApJ, 934, L13, doi: 10.3847/2041-8213/ac7fef
- Zurlo et al. (2020) Zurlo, A., Cugno, G., Montesinos, M., et al. 2020, A&A, 633, A119, doi: 10.1051/0004-6361/201936891