11email: maciek.wielgus@gmail.com 22institutetext: Institute of Physics, Silesian University in Opava, Bezručovo nám. 13, CZ-746 01 Opava, Czech Republic 33institutetext: Center for Astrophysics — Harvard & Smithsonian, 60 Garden Street, Cambridge, MA 02138, USA 44institutetext: NASA Hubble Fellowship Program, Einstein Fellow 55institutetext: Departament d’Astronomia i Astrofísica, Universitat de València, C. Dr. Moliner 50, E-46100 Burjassot, València, Spain 66institutetext: Observatori Astronòmic, Universitat de València, C. Catedrático José Beltrán 2, E-46980 Paterna, València, Spain 77institutetext: Department of Astrophysics, Institute for Mathematics, Astrophysics and Particle Physics (IMAPP), Radboud University, P.O. Box 9010, 6500 GL Nijmegen, The Netherlands 88institutetext: Instituto de Astronomia, Geofísica e Ciências Atmosféricas, Universidade de São Paulo, R. do Matão, 1226, São Paulo, SP 05508-090, Brazil 99institutetext: Dipartimento di Fisica, Universitá degli Studi di Cagliari, SP Monserrato-Sestu km 0.7, I-09042 Monserrato (CA), Italy 1010institutetext: INAF - Osservatorio Astronomico di Cagliari, via della Scienza 5, I-09047 Selargius (CA), Italy 1111institutetext: INFN, sezione di Cagliari, I-09042 Monserrato (CA), Italy 1212institutetext: National Radio Astronomy Observatory, 520 Edgemont Road, Charlottesville, VA 22903, USA
The internal Faraday screen of Sagittarius A*
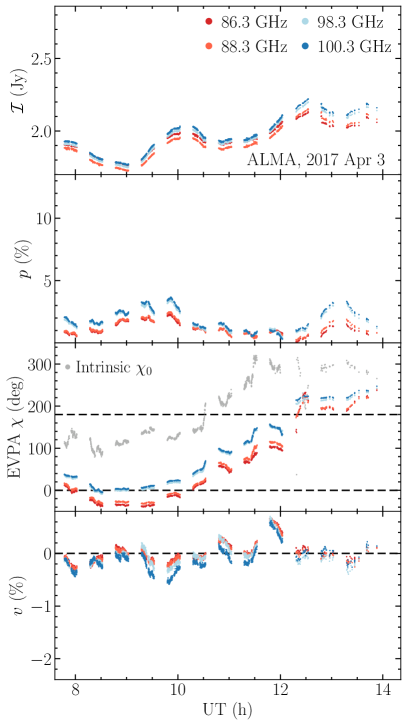
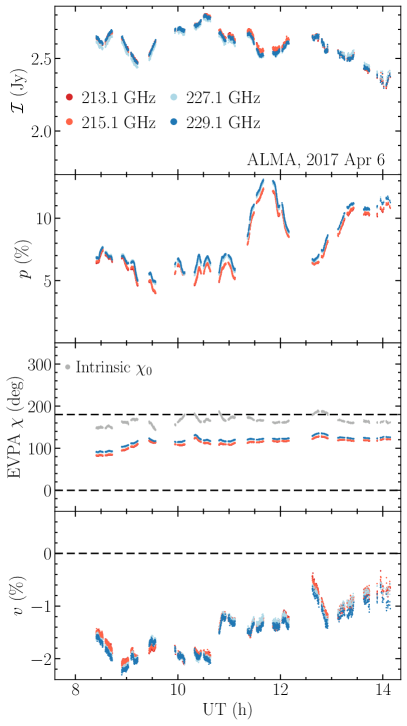
We report on 85-101 GHz light curves of the Galactic Center supermassive black hole, Sagittarius A* (Sgr~A*), observed in April 2017 with the Atacama Large Millimeter/submillimeter Array (ALMA). This study of high-cadence full-Stokes data provides new measurements of the fractional linear polarization at a 1-2% level resolved in 4 s time segments, and stringent upper limits on the fractional circular polarization at 0.3%. We compare these findings to ALMA light curves of Sgr~A* at 212-230 GHz observed three days later, characterizing a steep depolarization of the source at frequencies below about 150 GHz. We obtain time-dependent rotation measure (RM) measurements, with the mean RM at 85-101 GHz being a factor of two lower than that at 212-230 GHz. Together with the rapid temporal variability of the RM and its different statistical characteristics in both frequency bands, these results indicate that the Faraday screen in Sgr~A* is largely of internal character, with about half of the Faraday rotation taking place inside the inner 10 gravitational radii, contrary to the common external Faraday screen assumption. We then demonstrate how this observation can be reconciled with theoretical models of radiatively inefficient accretion flows for a reasonable set of physical parameters. Comparisons with numerical general relativistic magnetohydrodynamic simulations suggest that the innermost part of the accretion flow in Sgr~A* is much less variable than what these models predict, in particular, the observed magnetic field structure appears to be coherent and persistent.
Key Words.:
black holes – galaxies: individual: Sgr A* – Galaxy: center – techniques: interferometric – techniques: polarimetric1 Introduction
Sagittarius A* (Sgr~A*) is the radio source associated with a 410 supermassive black hole (SMBH) located in our Galactic Center (Do2019; Gravity2022; SgraP1). The source is characterized by a particularly low mass accretion rate of (Quatertaet2000; Yuan2003; SgraP5). Spectral energy distribution (SED) analysis allowed to identify it as an advection dominated / radiatively inefficient type of accretion flow (ADAF/RIAF; Narayan1995; Yuan2014; SgraP2; SgraP5). The SED of Sgr~A* exhibits a maximum at a turnover frequency in the range of several hundred GHz that can be attributed to synchrotron emission from the hot thermal electrons in the marginally optically thin innermost region of the accretion disk (Yuan2003). Despite significant progress on the theoretical front and multiple observational studies across the electromagnetic spectrum since Sgr~A* was first identified in 1974 (Balick1974), our detailed understanding of this object and the accretion flow surrounding it remains incomplete (for a recent review see, e.g., Morris2023).
Very long baseline interferometric (VLBI) radio observations indicate that the intrinsic size of Sgr~A* decreases with frequency, reaching event horizon scales at 230 GHz (e.g., Doeleman2008; SgraP1). At 90 GHz the intrinsic diameter of the VLBI image corresponds to about 20 gravitational radii (Shen2005; Bower2006; Lu2011; Issaoun2019), hence the emission originates in large part from a layer external to the innermost scales . Therefore, observations at different radio frequencies can be used to probe distinct regions of the accretion flow. Linear (LP) and circular (CP) polarization, rotation measure (RM), as well as temporal variability of these observed quantities, provide additional constraints on Sgr~A* models (e.g., Quatertaet2000; Bower2003; Marrone2007; Sharma2007; Pang2011; Ressler2023).
The CP of Sgr~A* was first reported by Bower1999_CP at 4.8 GHz, while the first LP detections were obtained by Aitken2000 in the 150-400 GHz range. Multiple subsequent observations showed LP values of 5-10% at around 230 GHz (Bower2003; Marrone2007; Bower2018; Wielgus2022_LP). The source becomes strongly depolarized at lower frequencies, and there is a very limited number of LP detections below 150 GHz in the literature (Bower1999_LP; Macquart2006; Liu2016). Measurements of weak negative CP were reported at frequencies below 20 GHz (Bower1999_CP; Bower2002). Above 200 GHz a stronger CP appears (Munoz2012; Bower2018; Wielgus2022_LP). Only weak upper limits were known for intermediate frequencies so far (Tsuboi2003).
In this paper we present a study of ALMA light curves in the 85-101 GHz range (ALMA band 3), including unambiguous high-time-cadence detections of variable LP, stringent upper limits on CP, and time-resolved measurements of Faraday rotation. We compare these results to the study of 212-230 GHz (ALMA band 6) light curves obtained in a quasi-contemporaneous epoch (Wielgus2022_LC; Wielgus2022_LP). At both frequency bands we build on the results of Goddi2021, where a preliminary analysis of Sgr~A* polarization in the same ALMA observations, reduced under an unphysical static source assumption, was presented. The main consequence of our results for the Sgr~A* system is the observationally-demonstrated presence of a significant internal component of the Faraday screen, which must be located within the central 10 region (Section 2). We discuss the implications of this measurement for the RIAF accretion flow model, utilizing VLBI observations to constrain the radial distribution of the electron temperature (Section LABEL:sec:interpretation). We also compare the measurements with predictions from general relativistic magnetohydrodynamic (GRMHD) simulations (Section LABEL:sec:grmhd). A brief summary is given in Section LABEL:sec:summary.
2 Observations and data analysis
| Band 3, 2017 Apr 3 | Band 6, 2017 Apr 6 | ||||||||
| (GHz) | 86.3 | 88.3 | 98.3 | 100.3 | 213.1 | 215.1 | 227.1 | 229.1 | |
| (Jy) | |||||||||
| (mJy) | |||||||||
| (%) | |||||||||
| (deg) | |||||||||
| (mJy) | |||||||||
| (%) | |||||||||
| — | |||||||||
| RM | |||||||||
scaled up by 4% to account for the CN absorption line (Appendix H.1. of Goddi2021); calculated using directional statistics;
band 3 values are consistent with nondetection, upper limit of ; in the units of rad m