UNCOVER: A NIRSpec Identification of a Broad Line AGN at
Abstract
Deep observations with JWST have revealed an emerging population of red point-like sources that could provide a link between the postulated supermassive black hole seeds and observed quasars. In this work we present a JWST/NIRSpec spectrum from the JWST Cycle 1 UNCOVER Treasury survey, of a massive accreting black hole at , displaying a clear broad-line component as inferred from the H line with FWHM = km s-1, typical of the broad line region of an active galactic nucleus (AGN). The AGN nature of this object is further supported by high ionization, as inferred from emission lines, and a point-source morphology. We compute the black hole mass of log, and a bolometric luminosity of erg s-1. These values imply that our object is accreting at of the Eddington limit. Detailed modeling of the spectral energy distribution in the optical and near-infrared, together with constraints from ALMA, indicate an upper limit on the stellar mass of log, which would lead to an unprecedented ratio of black hole to host mass of at least . This is orders of magnitude higher compared to the local QSOs, but is consistent with recent AGN studies at high redshift with JWST. This finding suggests that a non-negligible fraction of supermassive black holes either started out from massive seeds and/or grew at a super-Eddington rate at high redshift. Given the predicted number densities of high- faint AGN, future NIRSpec observations of larger samples will allow us to further investigate the galaxy-black hole co-evolution in the early Universe.
1 Introduction
Over the past decades, observations have established a sample of more than 200 bright active galactic nuclei (AGN) at , powered by accretion onto massive black holes (e.g. Fan et al., 2001; Kashikawa et al., 2015; Matsuoka et al., 2018). Lying well within the first billion years, many of these black holes are massive ( ; Bañados et al., 2018; Inayoshi et al., 2020) with the heaviest black hole having a mass of about only 700 million years after the Big Bang (Wang et al., 2021). The presence of such super massive black holes (SMBHs) is extremely hard to reconcile with black hole formation and growth scenarios since they require extremely massive seeds (of ) to form shortly after the Big Bang and then continuously and rapidly accrete gas at the Eddington rate (a physical limit at which outward radiation pressure balances inward gravitational force). One possible solution to explain the presence of such SMBHs lies in invoking super-Eddington accretion rates (e.g. Haiman & Loeb, 2001; Alexander & Natarajan, 2014) to drive the growth of low mass black hole seeds ( ) formed from the first (metal-free Population III) stars (Madau & Rees, 2001). Another possible solution is to start from massive seeds which includes “nuclear clusters” of from the collapse or coalescence of massive stars in compact stellar clusters (Omukai et al., 2008; Schleicher et al., 2022) or even heavier “direct collapse black hole seeds” of M⊙ from the collapse of pristine gas in early halos (Rees, 1984; Loeb & Rasio, 1994).
Observations with the James Webb Space Telescope (JWST) have started to discover previously missing UV-faint AGN. These have been identified through a combination of broad and high ionization lines (Furtak et al., 2023a; Goulding et al., 2023; Harikane et al., 2023; Kocevski et al., 2023; Larson et al., 2023; Maiolino et al., 2023a, b; Übler et al., 2023) or from color and morphology (Barro et al., 2023; Matthee et al., 2023; Yang et al., 2023). In common across these selections are extremely red rest-frame optical colors, flat UV continuum and generally a very compact morphology. When spectra are available, broad Balmer series lines, such as H or H are a tell-tale sign of ongoing accretion. While these are UV-faint, they span a large range of bolometric luminosities erg s-1 and black hole (BH) masses , with some of them being strongly dust obscured, up to (Furtak et al., 2023a). In addition, recently Labbé et al. (2023a, b) presented a large photometrically selected sample of AGN in the UNCOVER Cycle I JWST program. These have been modeled with a composite SED model, which consists of a dust-reddened Type I AGN, plus an additional UV component, attributed to either the scattered light or star formation. The unique finding present across all of these works are the high number densities of reddened QSOs, suggesting than a non-negligible fraction of BH growth at these epochs is taking place behind a thick veil of dust.
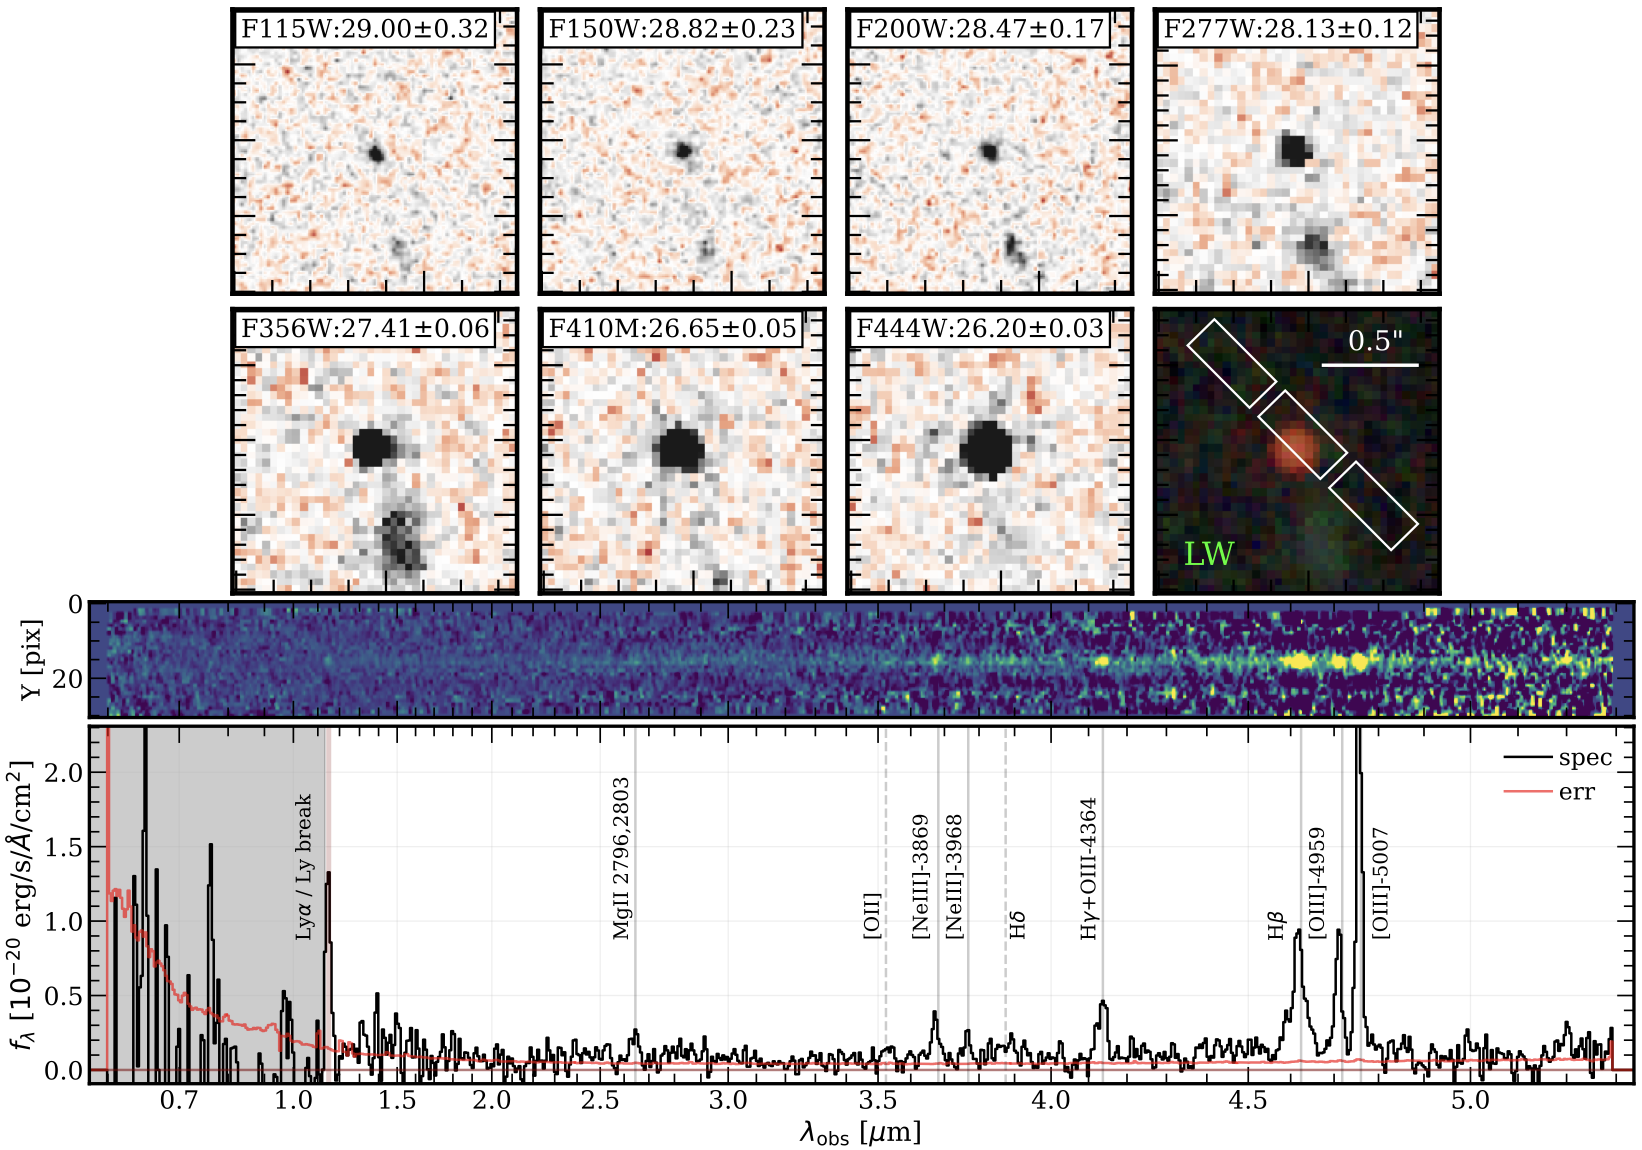
In this work we report a secure detection of the broad-line AGN emission at . The point source hosting the AGN was first identified as one of the “little red-dots” (Greene et al., 2023; Labbé et al., 2023b) in the UNCOVER NIRCam sample. Here we report the results from /NIRSpec Micro-Shutter Assembly (MSA) observations of this source in the UNCOVER field (PIs: I. Labbé, R. Bezanson; Bezanson et al. 2022). The exquisite high S/N NIRSpec spectrum allows us to resolve a multitude of lines, including and [OIII] 4959,5007 Å, and clearly demonstrate the presence of the broad line emission in . The [OIII] 4959,5007 Å lines however only display narrow emission, which in conjunction with a near point-like morphology and presence of highly ionized gas provide strong evidence for AGN activity in our source. A clear broad line (BL) emission in would make our source the highest redshift BL AGN with a secure (S/N) Balmer BL identification to date (see also Larson et al., 2023).
Throughout this work we assume a flat CDM cosmology with , and H km s-1 Mpc-1, and a Chabrier (2003) initial mass function (IMF) between . All magnitudes are expressed in the AB system (Oke, 1974).
2 Observations and Data
2.1 NIRSpec Setup
Initially identified as a potential high- AGN candidate via the broad and medium band NIRCam photometry (Weaver et al., 2023; Labbé et al., 2023a, b), UNCOVER ID: 20466111 Corresponds to the MSA ID, taken from internal UNCOVER catalog v2.2.1 is located at R.A. = 3.640408∘, Dec = -30.386438∘. The target was observed for a total of 2.7 hours with the low-resolution PRISM on July 31 2023, as a part of the MSA follow-up program of the UNCOVER JWST field, Abell 2744 (Bezanson et al., 2022). These observations employed a 2-POINT-WITH-NIRCam-SIZE2 dither pattern and a 3 shutter slitlet nod pattern at an aperture angle of 44.0∘. We show the positions of these slits overlaid on a 20 cutout of our source in Figure 1. For further details of the observational setup see Bezanson et al. (2022) and Price et al. (2023, in prep).
2.2 PRISM Data Reduction and Calibration
The UNCOVER micro-shutter array (MSA) spectra were reduced by using the msaexp (v0.6.10, Brammer, 2022), starting from the level 2 data products obtained from MAST222Available from: http://dx.doi.org/10.17909/8k5c-xr27. The pipeline applies corrections to the noise, identifies artifacts (e.g. “snowballs”) in the calibrated files, as well as removes bias in individual exposures by computing a simple median (e.g. see Rigby et al. 2023). Additional parts of the JWST reduction pipeline are used to set the slit WCS, perform slit-level flat-fielding and compute the path-loss corrections. Each of the 2D slits are then extracted and drizzled onto a common pixel grid. The local background subtraction is performed by using the shifted, stacked 2D spectra. To obtain the final 1D spectrum, msaexp performs an adaptive optimal extraction of the background subtracted 2D trace by fitting a Gaussian model where the center and width are allowed to vary (e.g., Horne, 1986), a similar procedure was used in Goulding et al. (2023) and Wang et al. (2023).
It is important to note that the absolute normalization of the spectrum can be affected by many factors, which include, but are not necessarily limited to the path-loss correction, calibration uncertainty333Can be of the order of 10-20%: https://jwst-docs.stsci.edu/jwst-near-infrared-spectrograph, the astrometric slit position uncertainty, the location and extent of the source within a slitlet, and finally source self-subtraction when correcting for the local background effects. To account for these potential calibration issues and to determine a total slitloss correction, we perform an additional flux rescaling by convolving the extracted 1D spectrum with all the broad/medium band NIRCam filters and compare our flux densities to the total photometry presented in Weaver et al. (2023). The wavelength dependent linear correction is then computed by fitting a first order polynomial. A complete description of the data reduction and flux calibration will be presented in Price et al. (2023, in prep.).
. R.A. Dec 1 (H/H) [mag] (continuum) [mag] log FWHMnarrow [km s-1] FWHMbroad [km s-1] log (H) log () [erg s-1] Ly EW0 [Å] 24030
-
† Corrected for the lensing magnification.
-
1
From the latest UNCOVER v3.0.1 catalog
3 Data Analysis
3.1 Spectroscopic Redshift
In order to compute the spectroscopic redshift, we use msaexp to fit sets of Gaussian continuum splines and emission lines templates to our spectrum. As an input parameter, we set nsplines=11 and allow to search for the minimal value across the a wide range of . As indicated in Figure 1, a clear Lyman break and several emission lines are clearly present in our spectrum, which results in an unambiguous redshift of . This closely matches the initial redshift estimate of obtained by fitting the broad and medium band NIRCam data (Weaver et al., 2023) with eazy (Brammer et al., 2008).
For the analysis presented in this work, we used an updated version (v1.1) of the Furtak et al. (2023b) analytic strong lens model of the cluster. This new model includes one additional multiple image system in the northern substructure, and more importantly, an additional spectroscopic redshift in the north-western sub-structure from new VLT/MUSE observations of the cluster (Bergamini et al., 2023). Together with our secure for the source, we recover a magnification of .
3.2 Broad Line AGN Emission
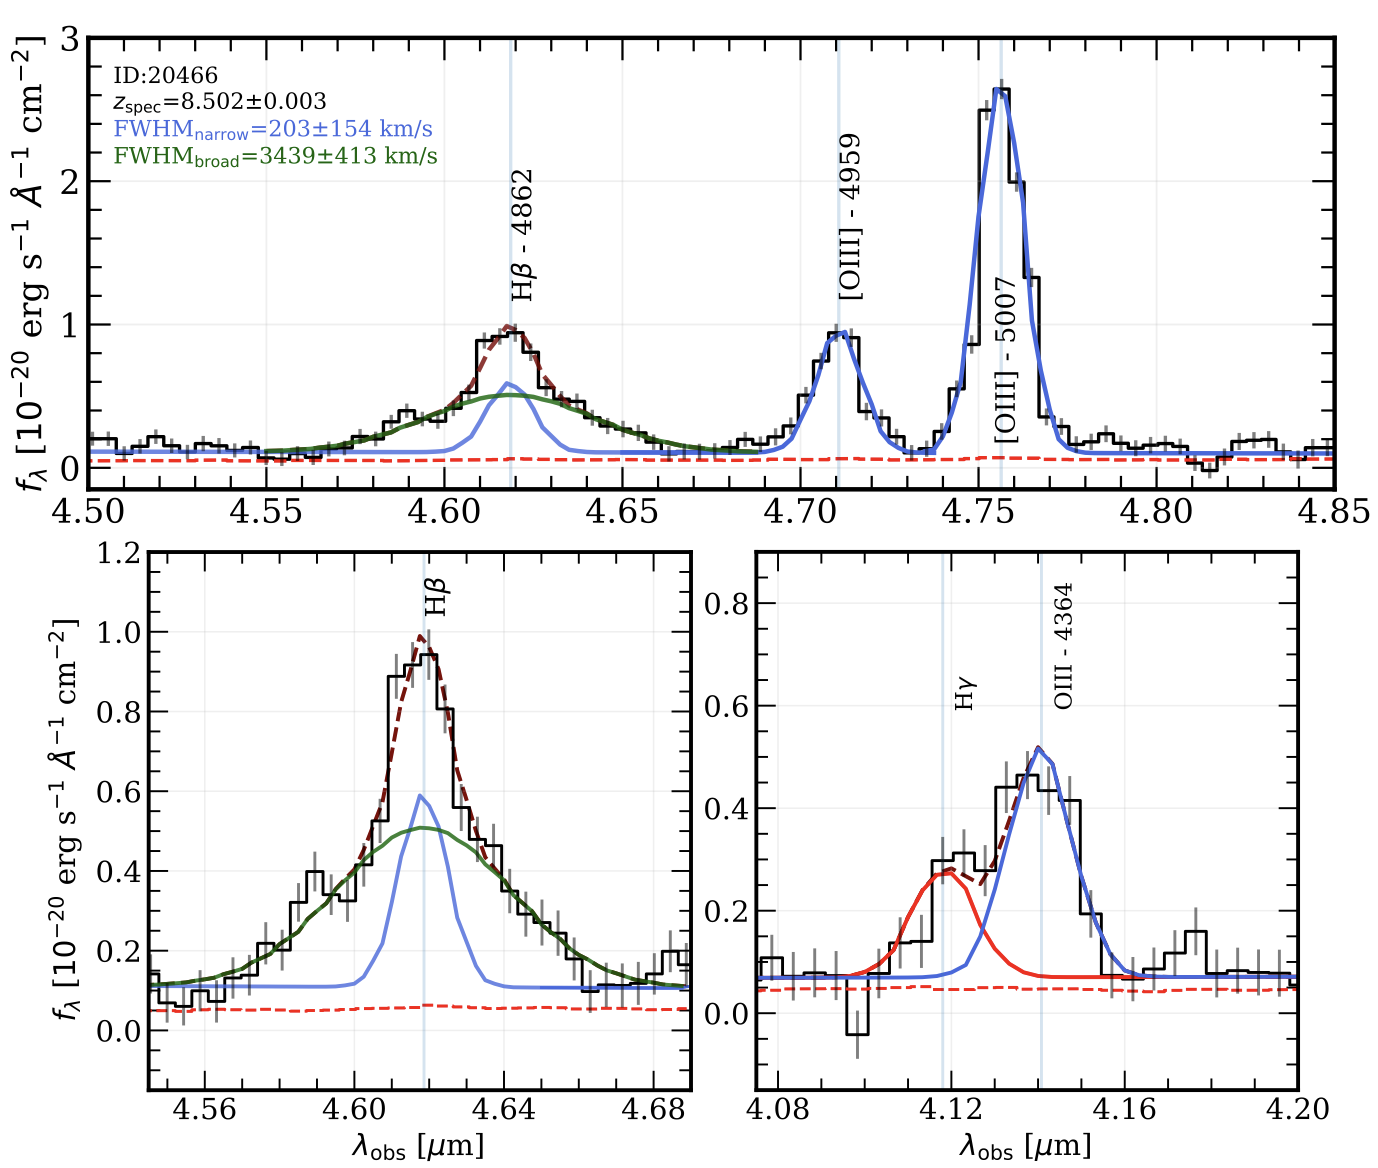
The spectrum of our object presented in Figure 1 shows a clear broad component present in the H emission line when contrasted to the narrower profiles of the adjacent [OIII] 4959,5007 Å lines. To evaluate the potential significance of this broad feature we perform a combined Gaussian fit to the entire line complex. For the two [OIII] lines we only consider a single narrow component, while the H is fit with both narrow and broad models. We allow the velocities of the narrow and broad components to vary between and km s-1, respectively. In our fitting, we assume that the width of the narrow component for all three lines is the same, and a fixed ratio [OIII]5007/[OIII] (Storey & Zeippen, 2000). In addition to that, we also model the local continuum with a first order polynomial. We fix the redshift to the one obtained from msaexp.
We initialize the fit by first creating a set of models on the over-sampled wavelength grid. To mimic the variable resolution of the PRISM, we interpolate our model onto a variable step grid, while making sure that the total integrated flux is preserved. Early NIRSpec/MSA results (de Graaff et al., 2023) have shown that the spectral resolution of a point-like source falling within a slitlet is higher, compared to a uniformly illuminated slit, sometimes up to a factor of two. We therefore conservatively increase the nominal spectral resolution by a factor of 1.7. To take into account the effects of the line spread function, we additionally convolve our model with Gaussian of variable resolution (de Graaff et al., 2023; Isobe et al., 2023). The best fit is then found via non-linear least squares minimization.
From our fit we securely confirm the presence of a distinct broad component in H, with a FWHM km s-1. We measure the width of the narrow component to be km s-1. In Figure 2 we show the best fit model to the entire line complex, with the narrow and broad components highlighted in blue and green, respectively. The flux of the broad component was measured to be higher than that of the narrow component.
Emission lines in AGN are typically separated into permitted (e.g., Lyman and Balmer series of hydrogen) and (semi-) forbidden lines (e.g., [OIII]). The distinction between the two classes is thought to arise from two physically distinct regions around an actively accreting black hole (see Osterbrock 1978; Vanden Berk et al. 2001), the parsec scale broad-line region (BLR) and the kiloparsec-scale narrow-line region (NLR). We find significant line broadening present in the line, strongly hinting that some of the emission originates from the BLR of a Type 1 AGN. While broad emission line features can also be an indicator of large-scale outflows, if such a scenario was indeed the case, a similar broadening would be present in the forbidden [OIII] lines (Amorín et al., 2012; Hogarth et al., 2020). We do not however find any evidence of that, on the contrary, the measured width of the narrow component is too low to be consistent with an outflow.
3.3 Balmer Decrement
The ratio between observed fluxes of Balmer series lines can be used to determine the dust extinction. For this purpose we will use the H/H ratio. As shown in the bottom right panel of Figure 1, the H line is blended with the [OIII]4364. We however can use the prior information from the fit to the H+[OIII]4959,5007 complex and fix the narrow line widths to km/s. Similarly to H, the H line would also contain a BLR component. However, the S/N of the broad component in H is too low to reliably perform a double component fit. Due to this we assume that the primary contribution to the total H flux is coming from the NLR, and compute the Balmer decrement by only considering ratio between the narrow component of the H line and our derived H flux. In this case we ensure that both line fluxes are obtained by integrating similar velocity ranges. From this calculation we find H/H.
To compute the we adopt the Small Magellanic Cloud (SMC) reddening law (Gordon et al., 2003), which has been found to match well the dust attenuation in high- galaxies (Capak et al., 2015; Reddy et al., 2015, 2018) and reddened quasars (e.g. see Hopkins et al., 2004). Given Case B recombination, the intrinsic ratio between the lines is (H/H)int=2.14 (Osterbrock, 1989). We find that the observed line ratio implies a high attenuation of .
3.4 Template Fitting
While it is likely that the contribution from the host galaxy to the total flux is small, as indicated by the mostly point-source like morphology of the source, obtaining an upper limit on the can still yield some crucial clues regarding the nature of our source. We follow the joint template fitting procedure described in Labbé et al. (2023b), fixing the redshift at . Briefly, the Labbé et al. method employs a custom fitting procedure which combines dust-obscured stellar population models from FSPS (Conroy et al., 2009) with empirical AGN models based on composite optical/near-infrared spectra of SDSS quasars (Vanden Berk et al., 2001; Glikman et al., 2006). To fit the stellar population we utilize three independent FSPS models: a dust-free and dust obscured star forming components together with an old quiescent component. A constant SFH is assumed for the star forming components, while the quiescent part uses an exponentially declining SFH with Myr. These templates are reddened by using a Calzetti (2001) attenuation law and . The attenuated AGN light is re-emitted in the mid-to-far infrared and modeled with the CLUMPY torus models (Nenkova et al., 2008a, b) as included with FSPS. The far-infrared dust emission associated with dust-obscured star formation is based in a set of Draine et al. (2007) templates employed within FSPS. NIRSpec observations are simulated using the published line spread function, increased by a factor 1.4 to account for a fact that this is a point source. For a full description of the fitting procedure, assumptions and potential caveats please refer to Appendix A in Labbé et al. (2023b).
With these models we fit the NIRCam spectroscopy, all available NIRCam broad and medium band photometry, plus the point source flux from ALMA Band 6 at 1.2 mm (Fujimoto et al., 2023a, b) extracted using the NIRCam location as a prior. No flux is detected in ALMA to Jy, , which strongly limits the contribution of massive star formation (see Labbé et al., 2013).
Three types of model fits are performed: AGN-only, AGN+stars, stars-only. The AGN-only model fits a separate unreddened blue and reddened AGN template. Two templates are needed because of the remarkable dichotomy that the SEDs of typical “litte red dots” display, where the SED at m (1000 - 1000 Å rest) is blue () while the SED at m (3100 - 5200 Å rest) is red ().
The best-fit blue component is only % of the bolometric luminosity of the red component, consistent with being scattered AGN light. The absence of clearly detectable broad UV lines (e.g., CIV, MgII) is consistent with expectations from the blue SDSS QSO template given the simulated NIRSpec PRISM resolution and depth. The best-fit dust attenuation is , when converted from Calzetti (2001) to the SMC law with , consistent with estimates based on the Balmer Decrement. Secondly, joint AGN+stars fit are performed. These should yield the most realistic constraint on the stellar mass from an underlying host galaxy. From these joint fits we derive an upper limit on the stellar mass of log based on the percentile of the posterior distribution of the mass of the stellar components. The stellar mass is primarily constrained by the combination of red NIRCam colors and the ALMA non-detection, which limits the amount of cold dust emission. We also note that evolved stellar populations are not seen in our spectrum, due to a lack of a Balmer break. As such the red continuum will most likely correspond to the dusty star formation, therefore allowing ALMA to further constrain the shape of our SED (see Labbé et al. 2023b for further details). To derive an upper limit on the stellar mass, we assume that all emission originates from stars. For the stars-only fit we find log based on the of the posterior on the total stellar mass. We adopt this as a conservative upper limit on the .
As an additional test, we hypothesize what could be the maximum amount of the present in this object if we assume a more evolved stellar population and ignore the observed shape of the SED. For this we use a dust free model based on the exponentially declining SFH ( Myr), that has formed 300 Myr ago at . This is then scaled directly to the depth of our NIRCam images at the position of 20466 (Weaver et al., 2023). The resultant limit is then log. We note however that such a model is not consistent with the photometry or the spectrum.
Finally, it is also possible to envision that the AGN can be embedded within an extremely dusty galaxy, which surrounds the object and yet remains completely JWST-dark, due to dust obscuration and low surface brightness. The implications of such dusty galaxies existing at high- have been briefly explored in Kokorev et al. (2023), who present an overview of a highly obscured () galaxy at . By adapting the full UV to sub-mm SED from Kokorev et al. and scaling it to our ALMA photometry, we compute a stellar mass limit of log. This might be an overestimate, because the low redshift has a best-fit stellar age of 0.53 Gyr, implying that all mass is formed at , which is not realistic. While definitive evidence for a significant presence of dust in galaxies only 500 Myr after the Big Bang is still lacking, deeper NIRCam observations of lensed fields could assist in uncovering the diffuse and dusty host galaxies surrounding reddened AGN.
3.5 Other Emission Lines
Beyond the lines discussed in earlier sections, our spectrum reveals emissions from Ly, the MgII doublet, and [NeIII] 3869,3968. In this section, we outline the methods and underlying assumptions employed to determine the final flux of each line. All measured line fluxes can be found in Table 2.
The Ly is fit with a single Gaussian model, where the FWHM is allowed to vary. Using this fit we extract both the line intensity and the rest-frame equivalent width (EW0), with the latter being measured at 24030 Å.
In our spectrum we identify the MgII 2796,2804 doublet feature. It is expected that, similarly to H, this permitted transition will contain both the narrow and broad components. However, the spectral resolution of PRISM at the observed wavelength of MgII does not allow us to securely separate the lines and perform a multiple component fit. We therefore fit the doublet with a single Gaussian model, where the FWHM is allowed to vary.
The [NeIII] 3869,3968 lines are nicely separated in our spectrum as seen in Figure 1. As discussed previously, the emission from the forbidden lines is generally expected to arise from the NLR (Vanden Berk et al., 2001), as such we fix the FWHM of [NeIII] to be the same as that of the [OIII] 4959,5007.
In addition to the detected lines, we also report a 3 upper limit for the low S/N () [OII] 3727,3729 doublet and H.
3.6 Size Measurement
As can be seen in Figure 1, the source is very compact and is just barely resolved in our imaging. We measure the effective radius in all available JWST bands using GALFIT (Peng et al., 2002, 2010), accounting for the effect of the empirically measured (Weaver et al., 2023) point spread function. The light is modeled with a Sérsic profile with the center, brightness, effective radius, Sérsic index, and axis ratio as free parameters. From the best-fits we find that the measured sizes in short wavelength bands (F115W, F150W, F200W) are comparable to the ones at the long wavelength (F277W, F356W, F410M, F444W) and range from 0035 to 004, which is consistent with or even smaller than the FWHM of the NIRCam PSF for those bands. The consistency of sizes across all bands, coupled with a pure PSF fit being sufficient to describe the light from 20466 provides a further evidence of high degree of central concentration in our object. Finally, we derive the physical effective radius to be 16520 pc, when corrected for the lensing magnification.
. Line [Å] Flux [10-20 erg s-1 cm-2] Ly 1215.4 MgII 2796.5,2803.1 OII 3727.0,3729.9 NeIII 3869.9 NeIII 3968.6 H 4102.9 H (narrow+broad) 4341.7 OIII 4364.4 H (narrow) 4862.7 H (broad) 4862.7 OIII 4959.5 OIII 5007.2
4 Results
4.1 AGN Properties
Reverberation mapping of quasars has revealed a correlation between the distance to the BLR in AGN and the width of the H line (e.g. Kaspi et al., 2000; Greene & Ho, 2005), which allows for the black hole mass to be estimated from single-epoch measurements. Using the standard relations presented in Greene & Ho (2005) we compute the black-hole mass () from both the luminosity and the width of the broad component of the H line and the rest-frame luminosity of the continuum.
Using our best fit models for lines and the continuum and accounting for the effects of lensing and dust obscuration, we find log and log. The uncertainties in this case are primarily dominated by the scatter ( dex) in the virial relation used to derive the mass, rather than the errors on the measurements themselves (e.g. see Kollmeier et al. 2006). From the fact that both methods return a consistent result we can conclude that the rest-frame 5100 Å luminosity of 20466 is almost entirely dominated by the light from the AGN. This allows us to further justify the assumptions made when modeling the spectrum in Section 3.4. We adopt the derived from H line luminosity as our final result.
In addition to the mass, the broad H can be used to compute the bolometric luminosity () of the AGN. Typically is computed from the luminosity of H, which we lack. However we can assume a broad-line intrinsic ratio of H/H (Dong et al., 2008), and use it in conjunction with (Richards et al., 2006; Stern & Laor, 2012). Assuming that the dust attenuation within NLR and BLR are similar, we correct the H luminosity for dust attenuation and magnification effects, thus obtaining erg s-1. These results suggest that our object is accreting at % of the Eddington rate, with , suggesting a sub-Eddington accretion scenario. All of the estimated parameters are presented in Table 1.
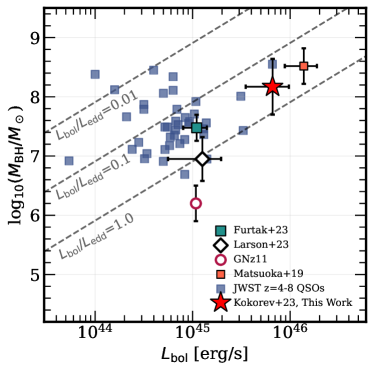
In Figure 3 we show the estimated and for our object. The mass exceeding , and luminosity brighter than erg s-1, indicate that our source is more massive and luminous than the majority of quasars at range identified with JWST (Furtak et al., 2023a; Harikane et al., 2023; Kocevski et al., 2023). The object presented in Larson et al. (2023) at is only Myr younger, however shows an almost 1 dex difference in the derived BH mass. This suggests that CEERS_1019 and 20466 might have followed vastly different evolutionary scenarios. On the other hand, we find similar (within 1) mass and luminosity when compared to a quasar presented in Matsuoka et al. (2019).
4.2 Ionization Mechanisms
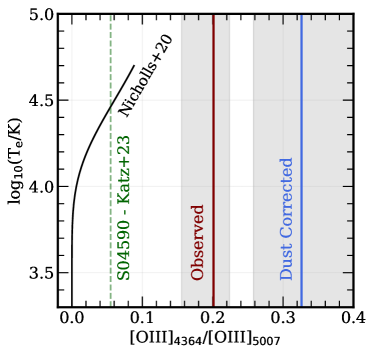
In this section we briefly explore the ratios between the measured emission lines to investigate the potential ionization mechanisms in our source. We observe an unusually high ratio between the auroral [OIII]4364 line and [OIII]5007 (RO3) of 0.32. In Figure 4 we explore the typical “allowed” RO3 for a range of electron temperatures and densities from the models presented in Nicholls et al. (2020), alongside our observed and dust corrected RO3. When compared to the models, our object appears to be a significant outlier, regardless of the adopted and values. Extreme values of RO3 have already been reported in recent JWST spectra, for example a galaxy presented in Katz et al. (2023) shows RO3 of 0.048, when corrected for dust. Elevated RO3 are not new and have been discussed in the context of low- Seyfert galaxies (e.g. Koski & Osterbrock, 1976; Osterbrock, 1978; Ferland & Netzer, 1983; Dopita & Sutherland, 1995; Nagao et al., 2001; Baskin & Laor, 2005; Binette et al., 2022). In fact, the photoionization models of Baskin & Laor (2005) suggest that it is possible to reach the required densities and temperatures to produce extreme RO3 within the NLR around an AGN.
In addition we can investigate our source in the context of the often utilized “OHNO” diagnostic, which compares the [OIII]5007/H and [NeIII]3869/[OII]3727,3729 ratios. This diagnostic has been used at low and high- to ascertain whether the ionization is powered purely by star formation or by an AGN (Backhaus et al., 2022; Cleri et al., 2022; Larson et al., 2023). After dust correction, we find log10([OIII]5007/H) and a lower limit of log10([NeIII]3870/[OII]). These line ratios, while not as high as reported in other AGN candidates (Larson et al., 2023), are still indicative of high ionization in 20466.
4.3 Massive Accreting Black Hole at
With all the information in hand, we would like to remark on the most probable nature of our source. The spectrum of 20466 shows a clear broad line component present in the line. With a confidence level of we estimate the FWHM of the broad profile to be km s-1. The adjacent [OIII] lines are well fit with a much narrower Gaussian ( km s-1), ruling out potential outflows (e.g. see Chisholm et al. 2015. This leads us to conclude that broad H emission most likely originates within a BLR of an AGN. Furthermore, we note high ionization present in our source, as indicated by the extreme RO3 ratio as well as the “OHNO” diagnostic. These values are difficult to reconcile with photoionization by young stars alone, highlighting the strong ionizing nature of this source. Combining the above with a near point-like source morphology observed across all NIRCam bands leads us to conclude that 20466 is a massive and luminous Type - 1 AGN, observed just 580 Myr after the Big Bang.
5 Discussion and Conclusion
5.1 Black Hole Formation Mechanisms
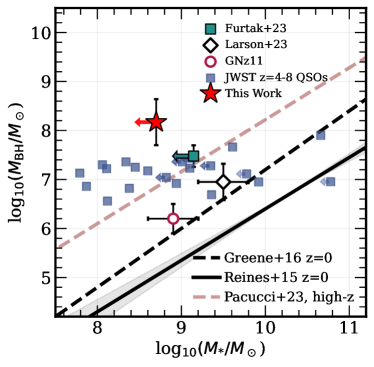
A significant unresolved question which remains to be answered, is how these supermassive black holes come to be. In Figure 5 we present the vs an upper limit on the , derived from the template fitting, compared to the relations for QSOs at , JWST detected AGN at , as well as those recently identified at high-. We find an extremely high ratio of black hole to host mass of at least , which is orders of magnitude higher compared to the local QSOs, and also elevated when compared to other massive AGN at high-. Predictions from “direct collapse black hole” (DCBH) formation models suggest that this ratio can indeed be high close to the seeding epoch (Natarajan, 2011; Natarajan et al., 2017), compared to the local values. Moreover, reaching high from light seeds would require growing the without also growing the galaxy mass, which does not seem feasible. This gives us a first hint regarding the potential formation and accretion mechanisms of our source.
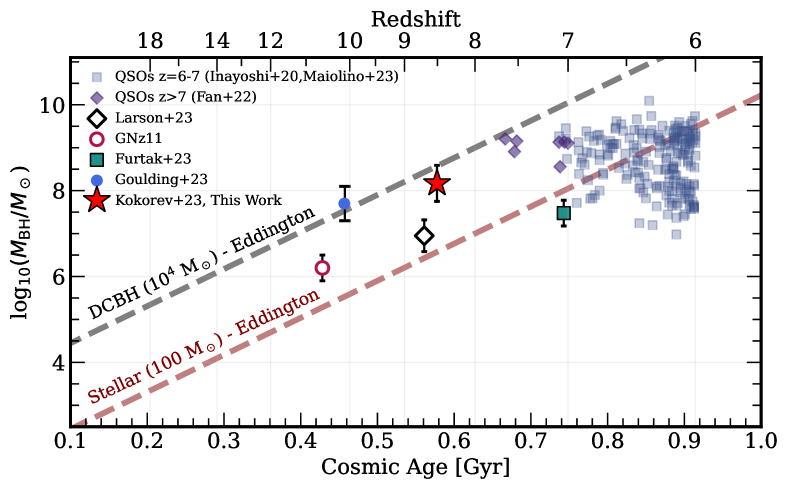
We further explore this in Figure 6 which presents the as a function of cosmic age for our AGN, alongside previous measurements for high- QSOs. It is possible to explain the existence of these SMBH via the super-Eddington accretion rates (e.g. Haiman & Loeb, 2001; Alexander & Natarajan, 2014) in low mass black hole seeds ( ), formed from the Population III stars (Madau & Rees, 2001). Another possible solution is to start from heavy DCBH seeds from the collapse of pristine gas in early halos (e.g. Rees, 1984; Loeb & Rasio, 1994). In this work we consider both options, starting with low (100 ) and high ( ) mass seeds at , we explore different accretion rates required to grow a black hole to 108 by . In Figure 6 we show that the observed can be reproduced by continuous Eddington accretion driven growth in a DCBH seed at 104 , with the Eddington limited stellar mass seed scenario being unlikely. Furthermore, it would be difficult to explain a radical change in over these early times, which would naively mean that the high black hole to galaxy ratio that we find also favors heavy seeds. Alternatively, simulations show that it is also possible to grow an SMBH via super-Eddington accretion onto a stellar mass seed (Jeon et al., 2012; Massonneau et al., 2023), however the feasibility of such extreme accretion modes is yet to be conclusively determined.
Recent detection and NIRSpec observations of an X-ray quasar at - UHZ-1 (Bogdan et al., 2023; Goulding et al., 2023) find a , comparable to the ratio we derive in this work. MSA ID 20466 and UHZ-1 are located in the same field, in a relatively small area, which suggests that black holes that form from direct collapse could be more common than previously thought and some early overmassive SMBHs may indeed originate from heavy seeds (Eilers et al., 2023; Natarajan et al., 2023; Pacucci et al., 2023; Stone et al., 2023).
However, we note that the elevated to host stellar mass trends, might not manifest when using the dynamical mass of the galaxy instead. A recent work by Maiolino et al. (2023b) finds little deviation between - relation in broad line AGN and that of local QSOs. This in return might imply that the black hole formation is more strongly connected with the mass assembly itself, rather than star formation in the host galaxy.
5.2 Final Remarks
Using the NIRSpec/PRISM and NIRCam data from JWST UNCOVER survey we present the discovery of an actively accreting SMBH at . The spectrum of our object shows an unambiguous () broad-line component present in the H line, exhibiting a FWHM of km s-1. Although comparable velocities could potentially stem from large scale outflows, a corresponding broadening effect should manifest in the adjacent [OIII]4959 and [OIII]5007 lines. We do not, however, find any evidence which can support this. By examining the RO3 and the “OHNO” line diagnostic, we find values which are consistent with high ionization present in the source. These findings, compounded by near point source morphology, lead us to deduce that the underlying cause behind the extended broad-line region can only be attributed to the AGN activity.
From the flux and FWHM of the H we compute the black hole mass of log and a luminosity of erg s-1, suggesting an accretion rate at of the Eddington limit. We also find that the derived from the H is consistent to the one computed from rest-frame 5100 Å continuum within one standard deviation, potentially indicating that the spectrum of this object is strongly, or almost entirely dominated by the AGN emission.
Finally, we explore multiple scenarios which can lead to a presence of such massive BH by =8.50. We find that the BH mass can not be reproduced by Eddington-limited accretion from a stellar seed, unless super-Eddington regimes can be achieved. It is worth noting that this would require a gas rich disk providing material for accretion while remaining unaffected by BH feedback. Even in our models that start at , this SMBH would need to grow at sustained rates for Myr, all the while remaining in a super-Eddington regime, which is beyond physically plausible scenarios. On the other hand, such a mass can also be attained via Eddington accretion driven growth for DCBH ( ) seeds. A direct collapse model would then also be able to potentially explain the extreme BH to host ratio of least % found in our source.
While their formation pathways are still largely uncertain, the high number of AGN detected with JWST at high-, given the relatively small areas covered so far, implies that extremely massive SMBH are already in place at , just Myr after the Big Bang (Wang et al., 2021; Furtak et al., 2023a; Goulding et al., 2023; Greene et al., 2023; Larson et al., 2023; Pacucci et al., 2023). The clues of high black hole to stellar mass ratios, exceeding several tens of percent, will allow us to place stronger constraints on the sizes of BH seeds and accretion modes required to produce such massive objects (Bogdan et al., 2023; Goulding et al., 2023). Interestingly, the Ly line is clearly detected from 20466 despite its heavily dusty nature, and 20466 turns out to reside in a huge ionized bubble with a radius of 7.6 proper Mpc (Fujimoto et al., 2023c). These results may indicate that the recent abundant AGN population identified with JWST provides a non-negligible contribution of ionizing flux to cosmic reionization. It is also possible that these AGN are residing in galaxy overdensities, which may have reionized the Universe earlier in their environments. The identification of 20466, along with similar massive quasars at high-, suggests we still lack a comprehensive understanding of AGN and host galaxy co-evolution in the early Universe, which we only recently started exploring with JWST.
References
- Alexander & Natarajan (2014) Alexander, T., & Natarajan, P. 2014, Science, 345, 1330, doi: 10.1126/science.1251053
- Amorín et al. (2012) Amorín, R., Pérez-Montero, E., Vílchez, J. M., & Papaderos, P. 2012, ApJ, 749, 185, doi: 10.1088/0004-637X/749/2/185
- Bañados et al. (2018) Bañados, E., Carilli, C., Walter, F., et al. 2018, ApJ, 861, L14, doi: 10.3847/2041-8213/aac511
- Backhaus et al. (2022) Backhaus, B. E., Trump, J. R., Cleri, N. J., et al. 2022, ApJ, 926, 161, doi: 10.3847/1538-4357/ac3919
- Barro et al. (2023) Barro, G., Perez-Gonzalez, P. G., Kocevski, D. D., et al. 2023, arXiv e-prints, arXiv:2305.14418, doi: 10.48550/arXiv.2305.14418
- Baskin & Laor (2005) Baskin, A., & Laor, A. 2005, MNRAS, 358, 1043, doi: 10.1111/j.1365-2966.2005.08841.x
- Bergamini et al. (2023) Bergamini, P., Acebron, A., Grillo, C., et al. 2023, ApJ, 952, 84, doi: 10.3847/1538-4357/acd643
- Bezanson et al. (2022) Bezanson, R., Labbe, I., Whitaker, K. E., et al. 2022, arXiv e-prints, arXiv:2212.04026. https://arxiv.org/abs/2212.04026
- Binette et al. (2022) Binette, L., Villar Martín, M., Magris C., G., et al. 2022, Rev. Mexicana Astron. Astrofis., 58, 133, doi: 10.22201/ia.01851101p.2022.58.01.11
- Bogdan et al. (2023) Bogdan, A., Goulding, A., Natarajan, P., et al. 2023, arXiv e-prints, arXiv:2305.15458, doi: 10.48550/arXiv.2305.15458
- Brammer (2022) Brammer, G. 2022, msaexp: NIRSpec analyis tools, 0.3, doi: 10.5281/zenodo.7299500
- Brammer (2023) Brammer, G. 2023, grizli, 1.8.2, Zenodo, Zenodo, doi: 10.5281/zenodo.7712834
- Brammer et al. (2008) Brammer, G. B., van Dokkum, P. G., & Coppi, P. 2008, ApJ, 686, 1503, doi: 10.1086/591786
- Calzetti (2001) Calzetti, D. 2001, PASP, 113, 1449, doi: 10.1086/324269
- Capak et al. (2015) Capak, P. L., Carilli, C., Jones, G., et al. 2015, Nature, 522, 455, doi: 10.1038/nature14500
- Chabrier (2003) Chabrier, G. 2003, PASP, 115, 763, doi: 10.1086/376392
- Chisholm et al. (2015) Chisholm, J., Tremonti, C. A., Leitherer, C., et al. 2015, ApJ, 811, 149, doi: 10.1088/0004-637X/811/2/149
- Cleri et al. (2022) Cleri, N. J., Trump, J. R., Backhaus, B. E., et al. 2022, ApJ, 929, 3, doi: 10.3847/1538-4357/ac5a4c
- Conroy et al. (2009) Conroy, C., Gunn, J. E., & White, M. 2009, ApJ, 699, 486, doi: 10.1088/0004-637X/699/1/486
- de Graaff et al. (2023) de Graaff, A., Rix, H.-W., Carniani, S., et al. 2023, arXiv e-prints, arXiv:2308.09742, doi: 10.48550/arXiv.2308.09742
- Dong et al. (2008) Dong, X., Wang, T., Wang, J., et al. 2008, MNRAS, 383, 581, doi: 10.1111/j.1365-2966.2007.12560.x
- Dopita & Sutherland (1995) Dopita, M. A., & Sutherland, R. S. 1995, ApJ, 455, 468, doi: 10.1086/176596
- Draine et al. (2007) Draine, B. T., Dale, D. A., Bendo, G., et al. 2007, ApJ, 663, 866, doi: 10.1086/518306
- Eilers et al. (2023) Eilers, A.-C., Simcoe, R. A., Yue, M., et al. 2023, ApJ, 950, 68, doi: 10.3847/1538-4357/acd776
- Fan et al. (2022) Fan, X., Banados, E., & Simcoe, R. A. 2022, arXiv e-prints, arXiv:2212.06907, doi: 10.48550/arXiv.2212.06907
- Fan et al. (2001) Fan, X., Narayanan, V. K., Lupton, R. H., et al. 2001, AJ, 122, 2833, doi: 10.1086/324111
- Ferland & Netzer (1983) Ferland, G. J., & Netzer, H. 1983, ApJ, 264, 105, doi: 10.1086/160577
- Fujimoto et al. (2023a) Fujimoto, S., Kohno, K., Ouchi, M., et al. 2023a, arXiv e-prints, arXiv:2303.01658, doi: 10.48550/arXiv.2303.01658
- Fujimoto et al. (2023b) Fujimoto, S., Bezanson, R., Labbe, I., et al. 2023b, arXiv e-prints, arXiv:2309.07834, doi: 10.48550/arXiv.2309.07834
- Fujimoto et al. (2023c) Fujimoto, S., Wang, B., Weaver, J., et al. 2023c, arXiv e-prints, arXiv:2308.11609, doi: 10.48550/arXiv.2308.11609
- Furtak et al. (2023a) Furtak, L. J., Labbé, I., Zitrin, A., et al. 2023a, arXiv e-prints, arXiv:2308.05735. https://arxiv.org/abs/2308.05735
- Furtak et al. (2023b) Furtak, L. J., Zitrin, A., Weaver, J. R., et al. 2023b, MNRAS, 523, 4568, doi: 10.1093/mnras/stad1627
- Glikman et al. (2006) Glikman, E., Helfand, D. J., & White, R. L. 2006, ApJ, 640, 579, doi: 10.1086/500098
- Gordon et al. (2003) Gordon, K. D., Clayton, G. C., Misselt, K. A., Landolt, A. U., & Wolff, M. J. 2003, ApJ, 594, 279, doi: 10.1086/376774
- Goulding et al. (2023) Goulding, A. D., Greene, J. E., Setton, D. J., et al. 2023, arXiv e-prints, arXiv:2308.02750, doi: 10.48550/arXiv.2308.02750
- Greene & Ho (2005) Greene, J. E., & Ho, L. C. 2005, ApJ, 630, 122, doi: 10.1086/431897
- Greene et al. (2016) Greene, J. E., Seth, A., Kim, M., et al. 2016, ApJ, 826, L32, doi: 10.3847/2041-8205/826/2/L32
- Greene et al. (2023) Greene, J. E., Labbe, I., Goulding, A. D., et al. 2023, arXiv e-prints, arXiv:2309.05714, doi: 10.48550/arXiv.2309.05714
- Haiman & Loeb (2001) Haiman, Z., & Loeb, A. 2001, ApJ, 552, 459, doi: 10.1086/320586
- Harikane et al. (2023) Harikane, Y., Zhang, Y., Nakajima, K., et al. 2023, arXiv e-prints, arXiv:2303.11946, doi: 10.48550/arXiv.2303.11946
- Hogarth et al. (2020) Hogarth, L., Amorín, R., Vílchez, J. M., et al. 2020, MNRAS, 494, 3541, doi: 10.1093/mnras/staa851
- Hopkins et al. (2004) Hopkins, P. F., Strauss, M. A., Hall, P. B., et al. 2004, AJ, 128, 1112, doi: 10.1086/423291
- Horne (1986) Horne, K. 1986, PASP, 98, 609, doi: 10.1086/131801
- Inayoshi et al. (2020) Inayoshi, K., Visbal, E., & Haiman, Z. 2020, ARA&A, 58, 27, doi: 10.1146/annurev-astro-120419-014455
- Isobe et al. (2023) Isobe, Y., Ouchi, M., Nakajima, K., et al. 2023, arXiv e-prints, arXiv:2301.06811, doi: 10.48550/arXiv.2301.06811
- Jeon et al. (2012) Jeon, M., Pawlik, A. H., Greif, T. H., et al. 2012, ApJ, 754, 34, doi: 10.1088/0004-637X/754/1/34
- Kashikawa et al. (2015) Kashikawa, N., Ishizaki, Y., Willott, C. J., et al. 2015, ApJ, 798, 28, doi: 10.1088/0004-637X/798/1/28
- Kaspi et al. (2000) Kaspi, S., Smith, P. S., Netzer, H., et al. 2000, ApJ, 533, 631, doi: 10.1086/308704
- Katz et al. (2023) Katz, H., Saxena, A., Cameron, A. J., et al. 2023, MNRAS, 518, 592, doi: 10.1093/mnras/stac2657
- Kocevski et al. (2023) Kocevski, D. D., Onoue, M., Inayoshi, K., et al. 2023, arXiv e-prints, arXiv:2302.00012, doi: 10.48550/arXiv.2302.00012
- Kokorev et al. (2023) Kokorev, V., Jin, S., Magdis, G. E., et al. 2023, ApJ, 945, L25, doi: 10.3847/2041-8213/acbd9d
- Kollmeier et al. (2006) Kollmeier, J. A., Onken, C. A., Kochanek, C. S., et al. 2006, ApJ, 648, 128, doi: 10.1086/505646
- Koski & Osterbrock (1976) Koski, A. T., & Osterbrock, D. E. 1976, ApJ, 203, L49, doi: 10.1086/182017
- Labbé et al. (2013) Labbé, I., Oesch, P. A., Bouwens, R. J., et al. 2013, ApJ, 777, L19, doi: 10.1088/2041-8205/777/2/L19
- Labbé et al. (2023a) Labbé, I., van Dokkum, P., Nelson, E., et al. 2023a, Nature, 616, 266, doi: 10.1038/s41586-023-05786-2
- Labbé et al. (2023b) Labbé, I., Greene, J. E., Bezanson, R., et al. 2023b, arXiv e-prints, arXiv:2306.07320, doi: 10.48550/arXiv.2306.07320
- Larson et al. (2023) Larson, R. L., Finkelstein, S. L., Kocevski, D. D., et al. 2023, arXiv e-prints, arXiv:2303.08918, doi: 10.48550/arXiv.2303.08918
- Loeb & Rasio (1994) Loeb, A., & Rasio, F. A. 1994, ApJ, 432, 52, doi: 10.1086/174548
- Madau & Rees (2001) Madau, P., & Rees, M. J. 2001, ApJ, 551, L27, doi: 10.1086/319848
- Maiolino et al. (2023a) Maiolino, R., Scholtz, J., Witstok, J., et al. 2023a, arXiv e-prints, arXiv:2305.12492, doi: 10.48550/arXiv.2305.12492
- Maiolino et al. (2023b) Maiolino, R., Scholtz, J., Curtis-Lake, E., et al. 2023b, arXiv e-prints, arXiv:2308.01230, doi: 10.48550/arXiv.2308.01230
- Massonneau et al. (2023) Massonneau, W., Volonteri, M., Dubois, Y., & Beckmann, R. S. 2023, A&A, 670, A180, doi: 10.1051/0004-6361/202243170
- Matsuoka et al. (2018) Matsuoka, Y., Strauss, M. A., Kashikawa, N., et al. 2018, ApJ, 869, 150, doi: 10.3847/1538-4357/aaee7a
- Matsuoka et al. (2019) Matsuoka, Y., Onoue, M., Kashikawa, N., et al. 2019, ApJ, 872, L2, doi: 10.3847/2041-8213/ab0216
- Matthee et al. (2023) Matthee, J., Naidu, R. P., Brammer, G., et al. 2023, arXiv e-prints, arXiv:2306.05448, doi: 10.48550/arXiv.2306.05448
- Nagao et al. (2001) Nagao, T., Murayama, T., & Taniguchi, Y. 2001, ApJ, 546, 744, doi: 10.1086/318300
- Natarajan (2011) Natarajan, P. 2011, Bulletin of the Astronomical Society of India, 39, 145, doi: 10.48550/arXiv.1104.4797
- Natarajan et al. (2017) Natarajan, P., Pacucci, F., Ferrara, A., et al. 2017, ApJ, 838, 117, doi: 10.3847/1538-4357/aa6330
- Natarajan et al. (2023) Natarajan, P., Pacucci, F., Ricarte, A., et al. 2023, arXiv e-prints, arXiv:2308.02654, doi: 10.48550/arXiv.2308.02654
- Nenkova et al. (2008a) Nenkova, M., Sirocky, M. M., Ivezić, Ž., & Elitzur, M. 2008a, ApJ, 685, 147, doi: 10.1086/590482
- Nenkova et al. (2008b) Nenkova, M., Sirocky, M. M., Nikutta, R., Ivezić, Ž., & Elitzur, M. 2008b, ApJ, 685, 160, doi: 10.1086/590483
- Nicholls et al. (2020) Nicholls, D. C., Kewley, L. J., & Sutherland, R. S. 2020, PASP, 132, 033001, doi: 10.1088/1538-3873/ab6818
- Oke (1974) Oke, J. B. 1974, ApJS, 27, 21, doi: 10.1086/190287
- Omukai et al. (2008) Omukai, K., Schneider, R., & Haiman, Z. 2008, ApJ, 686, 801, doi: 10.1086/591636
- Osterbrock (1978) Osterbrock, D. E. 1978, Phys. Scr, 17, 285, doi: 10.1088/0031-8949/17/3/024
- Osterbrock (1989) —. 1989, Astrophysics of gaseous nebulae and active galactic nuclei
- Pacucci et al. (2023) Pacucci, F., Nguyen, B., Carniani, S., Maiolino, R., & Fan, X. 2023, arXiv e-prints, arXiv:2308.12331, doi: 10.48550/arXiv.2308.12331
- Peng et al. (2002) Peng, C. Y., Ho, L. C., Impey, C. D., & Rix, H.-W. 2002, AJ, 124, 266, doi: 10.1086/340952
- Peng et al. (2010) —. 2010, AJ, 139, 2097, doi: 10.1088/0004-6256/139/6/2097
- Reddy et al. (2015) Reddy, N. A., Kriek, M., Shapley, A. E., et al. 2015, ApJ, 806, 259, doi: 10.1088/0004-637X/806/2/259
- Reddy et al. (2018) Reddy, N. A., Oesch, P. A., Bouwens, R. J., et al. 2018, ApJ, 853, 56, doi: 10.3847/1538-4357/aaa3e7
- Rees (1984) Rees, M. J. 1984, ARA&A, 22, 471, doi: 10.1146/annurev.aa.22.090184.002351
- Reines & Volonteri (2015) Reines, A. E., & Volonteri, M. 2015, ApJ, 813, 82, doi: 10.1088/0004-637X/813/2/82
- Richards et al. (2006) Richards, G. T., Strauss, M. A., Fan, X., et al. 2006, AJ, 131, 2766, doi: 10.1086/503559
- Rigby et al. (2023) Rigby, J., Perrin, M., McElwain, M., et al. 2023, PASP, 135, 048001, doi: 10.1088/1538-3873/acb293
- Schleicher et al. (2022) Schleicher, D. R. G., Reinoso, B., Latif, M., et al. 2022, MNRAS, 512, 6192, doi: 10.1093/mnras/stac926
- Stern & Laor (2012) Stern, J., & Laor, A. 2012, MNRAS, 423, 600, doi: 10.1111/j.1365-2966.2012.20901.x
- Stone et al. (2023) Stone, M. A., Lyu, J., Rieke, G. H., & Alberts, S. 2023, ApJ, 953, 180, doi: 10.3847/1538-4357/acebe0
- Storey & Zeippen (2000) Storey, P. J., & Zeippen, C. J. 2000, MNRAS, 312, 813, doi: 10.1046/j.1365-8711.2000.03184.x
- Übler et al. (2023) Übler, H., Maiolino, R., Curtis-Lake, E., et al. 2023, arXiv e-prints, arXiv:2302.06647, doi: 10.48550/arXiv.2302.06647
- Vanden Berk et al. (2001) Vanden Berk, D. E., Richards, G. T., Bauer, A., et al. 2001, AJ, 122, 549, doi: 10.1086/321167
- Wang et al. (2023) Wang, B., Fujimoto, S., Labbe, I., et al. 2023, arXiv e-prints, arXiv:2308.03745, doi: 10.48550/arXiv.2308.03745
- Wang et al. (2021) Wang, L., Gao, F., Best, P. N., et al. 2021, A&A, 648, A8, doi: 10.1051/0004-6361/202038811
- Weaver et al. (2023) Weaver, J. R., Cutler, S. E., Pan, R., et al. 2023, arXiv e-prints, arXiv:2301.02671, doi: 10.48550/arXiv.2301.02671
- Yang et al. (2023) Yang, G., Caputi, K. I., Papovich, C., et al. 2023, ApJ, 950, L5, doi: 10.3847/2041-8213/acd639