Meta-Stock: Task-Difficulty-Adaptive Meta-learning for Sub-new Stock Price Prediction
Abstract
Sub-new stock price prediction, forecasting the price trends of stocks listed less than one year, is crucial for effective quantitative trading. While deep learning methods have demonstrated effectiveness in predicting old stock prices, they require large training datasets unavailable for sub-new stocks. In this paper, we propose Meta-Stock: a task-difficulty-adaptive meta-learning approach for sub-new stock price prediction. Leveraging prediction tasks formulated by old stocks, our meta-learning method aims to acquire the fast generalization ability that can be further adapted to sub-new stock price prediction tasks, thereby solving the data scarcity of sub-new stocks. Moreover, we enhance the meta-learning process by incorporating an adaptive learning strategy sensitive to varying task difficulties. Through wavelet transform, we extract high-frequency coefficients to manifest stock price volatility. This allows the meta-learning model to assign gradient weights based on volatility-quantified task difficulty. Extensive experiments on datasets collected from three stock markets spanning twenty-two years prove that our Meta-Stock significantly outperforms previous methods and manifests strong applicability in real-world stock trading. Besides, we evaluate the reasonability of the task difficulty quantification and the effectiveness of the adaptive learning strategy.
Introduction
Sub-new stocks are stocks listed for less than one year. Compared to stocks listed for longer periods, the price trends of sub-new stocks are more volatile, allowing investors to profit from short-term trading (Mingli et al. 2022). Consequently, predicting the price of sub-new stocks can be valuable for both stock traders and quantitative finance researchers.
Due to short listing time, data scarcity is the main challenge for sub-new stock price prediction, and introducing supplement information is the most direct approach to address this issue. Previously, textual data such as social media information (Sawhney et al. 2021c, d) and company relations extracted via graph neural networks (Sawhney et al. 2021b) have been examined to facilitate stock price prediction. Although these methods can tackle limited data availability in theory, high-quality supplementary data remains difficult to obtain and assess (Dong et al. 2020; Batra and Daudpota 2018).
Apart from introducing supplement data, transfer learning and meta-learning are two machine learning techniques employed to tackle data scarcity. Specifically, transfer learning obtains a pre-trained model via large amounts of source data and fine-tunes the model on limited target domain data (Li et al. 2022). Acquiring useful features via source data, transfer learning, to some extent, allows the fine-tuned model to solve target tasks with smaller datasets. However, when data distributions of source tasks and target tasks significantly differ, transfer learning underperforms since the pre-trained models may overfit source data and thus fail to adapt to target data (Yang et al. 2020). In contrast to data-focused transfer learning, meta-learning is task-focused, emphasizing generalizing practical learning strategies instead of transferring low-level features (Chang et al. 2021). By learning "how to learn" on source tasks, meta-learning enables a model to quickly adapt and generalize to unseen tasks, relying less on task similarity and domain match. However, these two learning techniques have not been applied to sub-new stock price prediction, with their performance remaining unknown. Given the non-stationarity of stock price series (Zhang et al. 2017; Wen et al. 2019), significant differences exist between old and sub-new stock data. Therefore, meta-learning is a more reasonable approach for sub-new stock price prediction.
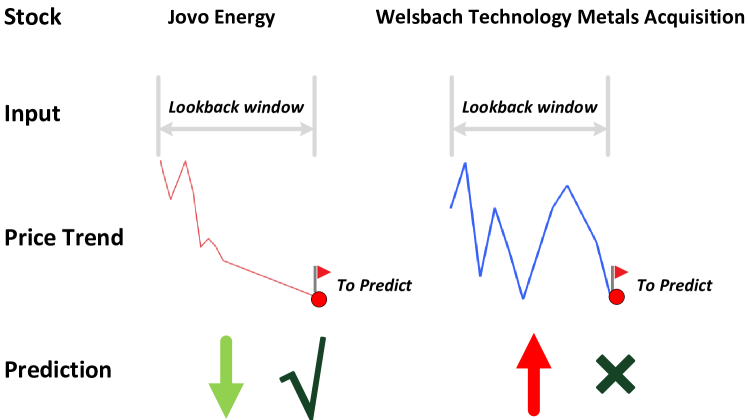
However, applying meta-learning to sub-new stock price prediction still faces challenges. Firstly, meta-learning is a task-based approach, but most existing methods for stock price prediction are data-focused (Ang and Lim 2022; Sawhney et al. 2021a, b), with little research on task construction for stock price prediction. Therefore, constructing tasks in stock price prediction contexts is crucial before employing meta-learning. Additionally, the difficulty levels of prediction tasks are disparate due to the varying volatility of price series. For example, as shown in Figure 1, the price trend of Welsbach Technology Metals Acquisition (higher volatility) may be more difficult to predict than that of Jovo Energy (lower volatility). However, traditional meta-learning performs equivalent training on each task (Finn et al. 2017; Chang et al. 2021), failing to deal with tasks based on their difficulty levels. This weakness undermines the effectiveness of meta-learning in capturing task-specific knowledge and acquiring fast generalization ability vital for sub-new stock price prediction.
To address the above issues, we propose a task-difficulty-adaptive meta-learning model: Meta-Stock. With numerous old stock price prediction tasks, Meta-Stock employs meta-learning to adapt the generalization ability acquired from these tasks to the sub-new stocks, overcoming sub-new stock data scarcity. Besides this traditional meta-learning process, we incorporate an adaptive learning strategy to tackle disparate task difficulty levels, thereby enhancing meta-learning effectiveness. Specifically, task difficulty levels can be measured by price volatility in stock price prediction contexts (Xiang et al. 2022). Based on this assumption, we employ wavelet transform to measure the volatility of stock price series. Instead of using wavelet transform to extract low-frequency components for capturing general price trends (Teng et al. 2020; Luo 2021; Wu et al. 2021), we employ it to extract high-frequency coefficients manifesting irregular volatility (Lahmiri 2014) and utilize them to measure task difficulty levels. Consequently, the optimized meta-learning model can assign gradient weights according to varying task difficulties. With such an enhanced meta-learning process, Meta-Stock can acquire the generalization ability adapted to predict sub-new stock prices more effectively. The main contributions of this paper can be summarized as follows:
-
•
We propose Meta-Stock, a task-difficulty-adaptive meta-learning approach to address the price prediction problem targeting sub-new stocks, flexible to different backbones. Meta-Stock adapts the generalization ability acquired from old stock price prediction tasks to those of sub-new stocks, thus overcoming sub-new stock data scarcity.
-
•
We introduce a task-difficulty-adaptive learning strategy to enhance the meta-learning process. We define task difficulty as price volatility measured by high-frequency coefficients extracted via wavelet transform.
-
•
We show that Meta-Stock outperforms previous methods and demonstrate its applicability in real-world trading via extensive experiments on three stock markets spanning twenty-two years. Given the high profitability of sub-new stocks, Meta-Stock is valuable for stock traders and finance professionals.
Related Work
Stock Price Prediction
Modern methods based on the Efficient Market Hypothesis (Malkiel 1989) leverage natural language features to analyze market sentiment (Sawhney et al. 2020c), supplementing original price data. The textual features can be extracted from news (Sawhney et al. 2021d), social media (Xu and Cohen 2018), and public earning calls (Qin and Yang 2019). For instance, Sawhney et al. (Sawhney et al. 2021c, 2020b) propose hierarchical temporal attention and cross-modal attention fusion for NLP-enhanced stock prediction. The efforts show how natural language data can complement price-based methods in capturing the effect of events like market surprises, mergers and acquisitions over stock returns.
Recent work also attempts to model company relations using stock prices (Matsunaga et al. 2019; Kim et al. 2019; Feng et al. 2019b) and text data (Sawhney et al. 2021b, 2020a) with the GNNs (Graph Neural Networks). For example, Sawhney et al. (Sawhney et al. 2021a) and Ang and Lim (Ang and Lim 2022) propose the hyperbolic stock graph attention network and guided attention multimodal multitask network respectively to capture the inter-company relationship and temporal dependencies in stock prices, promoting accurate stock prediction.
However, despite these competitive results, text-based approaches require a large-scale, high-quality corpus to extract helpful information accurately (Dong et al. 2020; Batra and Daudpota 2018). The demand in quantity and quality can result in significant time and money. Moreover, most existing approaches only focus on old stocks that have been listed for over a year and consume substantial training data. They ignore the significance of sub-new stocks for quantitative trading and thus fail to take the challenge of sub-new stock price prediction into consideration. To address this problem, we have to uncover the price series’ characteristics: volatility, and utilize the valuable information effectively. The volatility manifests the stock prediction difficulty, which motivates our task-difficulty-adaptive meta-learning design.
Meta-learning
Meta-learning, also known as learning to learn, emerges as an efficient method for learning to solve a new task with a limited amount of data by leveraging the generalization capability acquired from previous tasks (Hospedales et al. 2021). The idea of meta-learning has been taken to solve the data scarcity problems in many areas, such as recommendation system (Chen et al. 2022) and text classification (Lei et al. 2022).For stock price prediction, Shin-Hung et al. (Chang et al. 2021) adopt MAML (Model-agnostic Meta-learning) for model training (Finn et al. 2017). However, despite its great success in solving the data scarcity problem for stock price prediction, MAML has to differentiate through the SGD steps, consuming lots of time. Moreover, this method treats tasks with different difficulties equally and fails to consider the inherent volatility of the stock price series (Chang et al. 2021). Unlike the existing method, we choose Reptile, an efficient meta-learning algorithm without differentiating through the SGD steps (Nichol et al. 2018). To tackle the sub-new stock price prediction problem, we incorporate old stocks and construct meta-learning tasks for the model to acquire a fast generalization ability. We further improve the meta-learning process with an adaptive learning strategy that assigns weights to tasks according to their difficulty measured by volatility.
Methodology
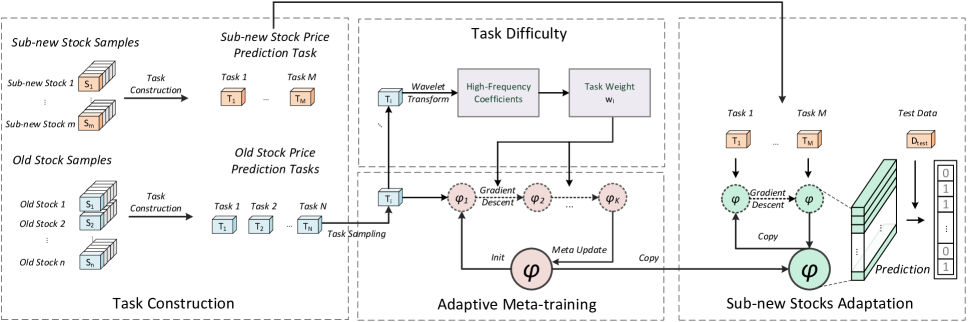
Figure 2 presents an overview of our proposed Meta-Stock. In the following subsections, we first describe the formulation of the sub-new stock price prediction problem (§Problem Formulation). We then articulate the construction of stock price prediction tasks (§Task Construction) and elaborate the quantification of task difficulties (§Task Difficulty). Adaptive Meta-training from abundant old stock prediction tasks is introduced in (§Adaptive Meta-training), which enables the model to generalize fast across homogeneous tasks. Lastly, we introduce Sub-new Stocks Adaptation to adapt the model with task-agnostic knowledge to sub-new stock prediction with limited samples (§Sub-new Stocks Adaptation).
Problem Formulation
Stock price prediction can be formulated as the time-series classification problem. Given the -th stock sample in a stock dataset , the stock sample can be denoted as , where denotes the time window length of a stock sample. The feature of stock sample on the -th day can be denoted as , where and denotes the feature dimension of corresponding timestep. Following (Feng et al. 2019a), the label of stock sample can be defined as:
| (1) |
where denotes the adjusted closing price of on the -th day. denotes the adjusted closing price rises, and denotes it drops. We denote the old stock dataset as and the sub-new stock dataset as , and our model Meta-Stock aims to acquire the generalization ability from to facilitate the prediction on .
Task Construction
By learning from a diverse set of tasks in the source domain, our model acquires the ability to adapt to target tasks with limited data. To achieve this, we devise a task construction strategy that ensures diversity in the meta-training tasks by sampling randomly from old stock data with different distributions, where denotes the number of samples in a task. Likewise, we also construct a few sub-new stock price prediction tasks . With the sub-new stock tasks, the meta-learning model can adapt to these tasks after meta-training. Specifically, the data samples are obtained via sliding window over stock feature series calculated by the adjusted closing price and volume (More details are provided in the Section A of the appendix). By updating the model with gradient descent on both old and sub-new stock tasks that share same task sizes , Meta-Stock achieves improved generalization for sub-new stock price prediction.
Task Difficulty
The difficulty of stock price prediction tasks lies in the inherent volatility of stock price series. To measure this, we compute a difficulty score for each training task . To determine the scores , we calculate a sample difficulty score for each data sample with the following approach. For each data sample , reflects the temporal volatility in price and volume signals present in . However, quantifying price volatility in the time domain is challenging. Therefore, we use wavelet transform techniques to analyze the volatility in the frequency domain instead.
One common approach is the Fourier transform (FT) (FT), which creates a representation of the signal in the frequency domain. However, the Wavelet transform (WT) (WT) provides more localized information of the signal in both the time and frequency domains. Hence, we employ the Discrete Wavelet Transform (DWT) (DWT) to decompose the multivariate time series stock sample into its smooth (low-frequency) coefficients and its detail (high-frequency) coefficients .
During DWT, the original multivariate time series is convolved with a low-pass filter and a high-pass filter, and their outputs are downsampled to obtain the smooth (low-frequency) coefficients and the detail (high-frequency) coefficients , respectively. The frequency-domain volatility of the time series can now be quantified with the DWT coefficients as follows:
| (2) |
| (3) |
where and are, respectively, the father and mother wavelets, and and are, respectively, the scaling and translation parameters. The father wavelet approximates the smooth (low-frequency) components of the signal, and the mother wavelet approximates the detail (high-frequency) components. The father wavelet and the mother wavelet are defined as follows:
| (4) |
| (5) |
The two wavelets and satisfy the following condition:
| (6) |
| (7) |
The detail coefficients along the temporal dimension contain high-frequency information and indicates the volatility and associated risk of the financial time-series (Gllavata et al. 2004). We thus quantify the sample difficulty with volatility measured by high-frequency components after discrete wavelet transform . Once we obtain every sample’s difficulty in the task , we can measure the task difficulty by their root sum of squares:
| (8) |
where the task contains samples.
Adaptive Meta-training
As Figure 2 shows, our model learns from numerous old stock price prediction tasks to extract task-agnostic knowledge and acquires the fast generalization capability, which can be measured by the model’s average predicting performance for meta-training steps on task . Therefore, we establish the objective of Adaptive Meta-training to minimize the expected loss given a selected task :
| (9) |
where , the model learning on task . When learning on task , Reptile optimizes the model , where , with gradient descent for meta-training steps as follows:
| (10) |
where denotes the fixed learning rate and represents the loss on task . In contrast to the Reptile algorithm, Meta-Stock aims to capture a better learning strategy of stock price prediction by assigning weights to a given stock price prediction task according to varying task difficulty .
| (11) |
However, if we retain the extreme values or outliers in weights , the weighted gradients can be too large, and thus bypass the local minimum and overshoot. Otherwise, it can be too small, and hence increases the total computation time to a very large extent. Therefore, we normalize the task difficulty by a softmax function to get a weight vector for all the old-stock tasks , where there are old-stock tasks in total. The softmax normalization is a way of reducing the influence of extreme values or outliers in the weight vector without removing data points from the set. For task , the weight of this task is computed with all samples in as:
| (12) |
In Equation 11, we train the model by minimizing the cross-entropy loss , given as:
| (13) |
where denotes the true price movement of a stock sample from the training data of the tasks . denotes the prediction of the model for the stock sample . After learning from the tasks , we can optimize the meta-learning objective as shown below:
| (14) |
where denotes the meta-learning rate. Here, we aggregate meta-training task gradients to obtain a meta-gradient . With the meta-gradient, we move the initial parameter of the model in the direction of the average of the task model parameters . Hence, the model converges towards a solution close (in Euclidean distance) to each task ’s manifold of optimal solutions (Nichol et al. 2018). Because the meta-learning model parameters are close to the optimal parameters of each task , only a few gradient updates are required to obtain the optimal solutions for each task . Therefore, Meta-Stock enables the model to generalize on different tasks with task-agnostic knowledge. To show more details, we outline the optimization process in Algorithm 1.
Sub-new Stocks Adaptation
After acquiring the generalization ability on old-stock tasks, our model can generalize efficiently to sub-new stock tasks with a handful of training data via a few gradient steps and obtain the adapted parameters. This fast adaptation comes from the fact that we have already simulated fast learning on multiple tasks with limited data in the Adaptive Meta-training phase. In particular, we minimize the loss in on the sub-new stock price prediction tasks through gradient descent.
| (15) |
where denotes the cross-entropy loss on the sub-new stock price prediction task and refers to the learning rate.
Experiments and Setup
| Method | Backbone | US-STOCKS | CN-STOCKS | HK-STOCKS | ||||||
|---|---|---|---|---|---|---|---|---|---|---|
| ACC | MCC | F1 | ACC | MCC | F1 | ACC | MCC | F1 | ||
| Train on sub-new stocks | LSTM-FCN | 56.29 | 4.00 | 52.66 | 51.50 | 3.69 | 46.21 | 50.54 | 1.34 | 43.92 |
| ResCNN | 53.24 | -0.70 | 51.25 | 51.75 | 0.89 | 46.71 | 51.24 | -2.99 | 46.31 | |
| ResNet | 55.19 | 3.38 | 53.08 | 53.72 | 4.90 | 51.48 | 54.93 | 0.57 | 47.78 | |
| InceptionTime | 53.67 | -0.42 | 51.25 | 51.30 | 0.46 | 46.58 | 51.18 | -0.23 | 45.44 | |
| Transfer Learning | LSTM-FCN | 56.31 | 4.09 | 52.73 | 53.91 | 6.69 | 53.61 | 53.65 | 0.23 | 49.95 |
| ResCNN | 53.71 | 3.77 | 53.41 | 54.03 | 7.56 | 54.02 | 53.34 | -0.30 | 49.83 | |
| ResNet | 56.23 | 4.80 | 53.43 | 54.61 | 7.42 | 53.05 | 55.61 | 1.66 | 47.18 | |
| InceptionTime | 55.49 | 3.05 | 52.64 | 55.07 | 8.25 | 53.39 | 53.77 | 1.75 | 51.28 | |
| Reptile | LSTM-FCN | 55.65 | 6.54 | 54.83 | 56.17 | 10.27 | 53.98 | 54.66 | 3.94 | 52.38 |
| ResCNN | 55.71 | 2.54 | 52.01 | 55.94 | 10.09 | 54.72 | 51.79 | 1.44 | 51.65 | |
| ResNet | 55.00 | 4.99 | 54.09 | 55.53 | 8.91 | 53.56 | 53.01 | 4.22 | 53.56 | |
| InceptionTime | 56.85 | 5.04 | 52.80 | 55.17 | 8.40 | 53.80 | 56.61 | 3.48 | 41.10 | |
| Meta-Stock | LSTM-FCN | 55.90 | 9.42∗ | 55.93∗ | 56.23∗ | 10.35∗ | 53.86 | 53.92 | 6.39∗ | 53.95∗ |
| ResCNN | 54.89 | 8.59∗ | 55.13∗ | 56.39∗ | 10.90∗ | 54.77 | 56.47∗ | 8.48∗ | 54.75∗ | |
| ResNet | 54.78 | 9.68∗ | 55.09∗ | 56.75∗ | 11.47∗ | 53.71 | 57.28∗ | 9.49∗ | 54.65∗ | |
| InceptionTime | 56.26 | 8.86∗ | 55.90∗ | 56.48∗ | 11.33∗ | 55.47∗ | 56.35∗ | 6.71∗ | 52.83∗ |
Dataset
For the dataset, we choose the stock markets in US, mainland China and Hong Kong due to their large capitalization and numerous companies. We then collect the dataset from AKShare (King 2019) on the three real-world stock markets, from 01/01/2000 to 22/02/2022 and denote the market as US-STOCKS, CN-STOCKS and HK-STOCKS, respectively. We preprocess data and shift a 5-day lookback window along the trading days to generate samples following (Sawhney et al. 2021c). We label and filter the samples based on the movement percentage of the adjusted closing price. For example, samples with movements 0.55 and -0.5 are labeled as positive and negative, respectively, and the remained samples are filtered out. To distinguish old and sub-new stocks, we split the dataset into old stock datasets ranging from 01/01/2000 to 22/02/2021 and sub-new stock datasets ranging from 23/02/2021 to 22/02/2022. We further split the sub-new stock datasets in the proportion of 6:2:2 and obtain training data from 22/02/2021 to 22/09/2021, validation data from 23/09/2021 to 02/12/2021 and test data from 03/12/2021 to 22/02/2022. The detailed statistics of our proposed dataset are shown in the Section A of the appendix.
Training Setup
We perform all experiments on an Nvidia GeForce GTX 1080Ti GPU. We train Meta-Stock for 50 epochs with AdamW optimizer. We use grid search to find optimal hyperparameters for Meta-Stock based on validation performance. We set the length of stock sample , training steps , meta batch size , batch size , weight decay rate , learning rate for Meta-Stock. Here, the number of samples in a task , which is equal to and the number of old stock tasks and sub-new stock tasks can be calculated with , the total number of old stock samples and the total number of sub-new stock samples. We repeat each experiment 5 times and record the average performance. For model evaluation in stock price prediction, we follow the metrics in (Feng et al. 2019a) calculate the Accuracy (ACC), Matthews Correlation Coefficient (MCC) and F1-score (F1). For model evaluation in stock trading, we choose the Annual Return Ratio (ARR), Sharpe Ratio (SR) (Sharpe 1994), Maximum Drawdown (MDD) (Magdon-Ismail et al. 2004), Sortino Ratio (SoR) (Sortino and Price 1994), Calmar Ratio (CR) (Young 1991) and Omega Ratio (OR) (Keating and Shadwick 2002). We formulate the evaluation metrics and explain their details in the Section A of the appendix.
Baselines and Backbones
We choose the following baseline approaches to train different backbones and compare their performances with Meta-Stock:
-
•
Train on sub-new stocks: The backbones are trained on the training set of sub-new stocks and then tested on the test set of sub-new stocks.
-
•
Transfer Learning: The backbones are pre-trained on the old stocks and then finetuned on the training set of sub-new stocks. Finally, we test the backbones on the test set of sub-new stocks.
-
•
Reptile: The backbones are meta-trained on the old stocks and then adapted to the training set of sub-new stocks. Finally, we test the backbones on the test set of sub-new stocks.
For backbones, we choose LSTM-FCN (Čeponis and Goranin 2020), ResCNN (Zou et al. 2019), ResNet (Li et al. 2020) and InceptionTime (Wang et al. 2021). We provide backbone details in the Section A of the appendix. Note that recent NLP-based stock price prediction models are not considered as comparison due to the limited availability of text data for sub-new stocks.
Results and Discussion
Performance Comparison
We compare Meta-Stock with various approaches. Meta-Stock achieves a state-of-the-art performance in terms of ACC, MCC, and F1 as shown in Table 1. Moreover, following (Sawhney et al. 2021b), we employ Wilcoxon’s signed rank test (Groggel 2000) and reveal significant improvements of Meta-Stock over the compared methods. With such an advance, Meta-Stock validates its effectiveness, though facing both bullish and bearish conditions in three markets. We attribute the improvement of Meta-Stock over other approaches to three reasons. First, Meta-Stock formulates the sub-new stock prediction problem from a new task-based perspective, allowing our model to learn from various tasks and capture a better learning strategy on stock price prediction tasks. With the mastered strategy, Meta-Stock improves generalization across homogeneous tasks and thus learns faster than many state-of-the-art methods. Second, we design a strategy to construct training tasks with various data distribution, which enable Meta-Stock to better learn the homogeneous data pattern in different distributions. By perceiving similar data patterns between old and sub-new stocks, Meta-Stock can utilize old stock data more efficiently and generalize better to sub-new stock price prediction. Third, when finetuning the meta-learning model on the sub-new stock data, we keep the training strategy on sub-new stock data the same as that on old stock data, which enable the model to better apply the obtained task-agnostic knowledge to the prediction of sub-new stocks.
Profit Analysis
| Method | AR | MDD | SR | SoR | CR | OR |
|---|---|---|---|---|---|---|
| Reptile | -0.793 | -0.801 | -2.084 | -2.165 | -0.99 | 0.449 |
| Meta-Stock | 1.413 | -0.205 | 2.048 | 6.653 | 6.744 | 1.805 |
We examine the practical applicability of Meta-Stock to real-world stock trading by analyzing the pure returns (Annual Return Rate), risk-adjusted returns (Sharpe ratio, Sortino Ratio, Calmar Ratio, Omega Ratio) and the maximum risk (Maximum Drawdown) associated with the trades using ResNet across stocks in US, CN and HK markets. We follow a trading strategy: if the model predicts the rise of a stock’s price the next day, we will buy the stock at the closing price and sell it at the closing price when the model speculates a price fall. We first train ResNet with Reptile, which is Meta-Stock without adaptive learning for stock trading, and observe poor performance in terms of profits and a high risk for all markets as shown in Table 2. This observation indicates that Reptile takes riskier trading decisions and often experiences enormous losses. However, when we train ResNet using Meta-Stock, we observe significant improvements in risk-adjusted returns (781.21%) and a substantial reduction in maximum losses (73.75%). Such improvements indicate the efficacy of Meta-Stock in enhancing the real-world applicability of neural stock prediction methods. We further elucidate the benefits of Meta-Stock via a qualitative study.
Probing Task Difficulty
| Task Difficulty Score () | MCC Relative Gains in CN-STOCKS (%) |
|---|---|
| Easy | 1.06% |
| Medium | 0.88% |
| Hard | -0.53% |
In this study, we investigate the performance improvements achieved by training on samples of varying difficulty levels for 1 epoch in the beginning. To this end, we divide our dataset into three groups of tasks with different levels of difficulty: easy, medium, and hard. Specifically, we distribute three task groups with the same amount of tasks by their difficulty scores. For instance, the tasks with the top 1/3 difficulty scores are assigned to hard groups, and those with the bottom 1/3 are assigned to easy groups. The resulting performance gains obtained through the Reptile algorithm are presented in Table 3. Our results highlight the effectiveness of Reptile in improving the performance of stock price prediction tasks over data with varying levels of difficulty, with improvements observed for both easy and medium difficulty levels. However, the algorithm exhibits a decline in predicting ability for the hard-level group of tasks. Interestingly, we also note that at the beginning of the learning process, the relative improvement for stock price prediction increases as the task difficulty decreases from hard to medium to easy. These findings are consistent with the typical learning curve of humans, that is, learning with increasing difficulty. Learning complex tasks ahead of time can be frustrating for humans if they cannot solve simple tasks. Therefore, the observations validate the effective quantification of task difficulty.
Analyzing the Effectiveness of Meta-Stock
| Task Difficulty () | ACC Relative Gains (%) | ||
| US-STOCKS | CN-STOCKS | HK-STOCKS | |
| Easy | 3.36% | 7.64% | 2.69% |
| Medium | 2.27% | 6.07% | 9.44% |
| Hard | 3.93% | 5.70% | 8.15% |
We now study the performance improvements obtained via Meta-Stock over Reptile against samples of varying difficulty levels. In Table 4 we divide the dataset into groups of easy, medium, and hard tasks according to the task difficulty . We observe significant improvements over all three difficulty levels on all evaluation metrics, demonstrating that Meta-Stock improves performance across sub-new stock price prediction tasks with varying difficulty levels (more results about improvements on the MCC and F1 scores can be referred to in the Section B of the appendix). We contribute these improvements to Meta-Stock’s adaptive learning strategy that assigns more weight to complicated tasks. Once Meta-Stock can better handle complicated tasks, the easier ones can also be solved better.
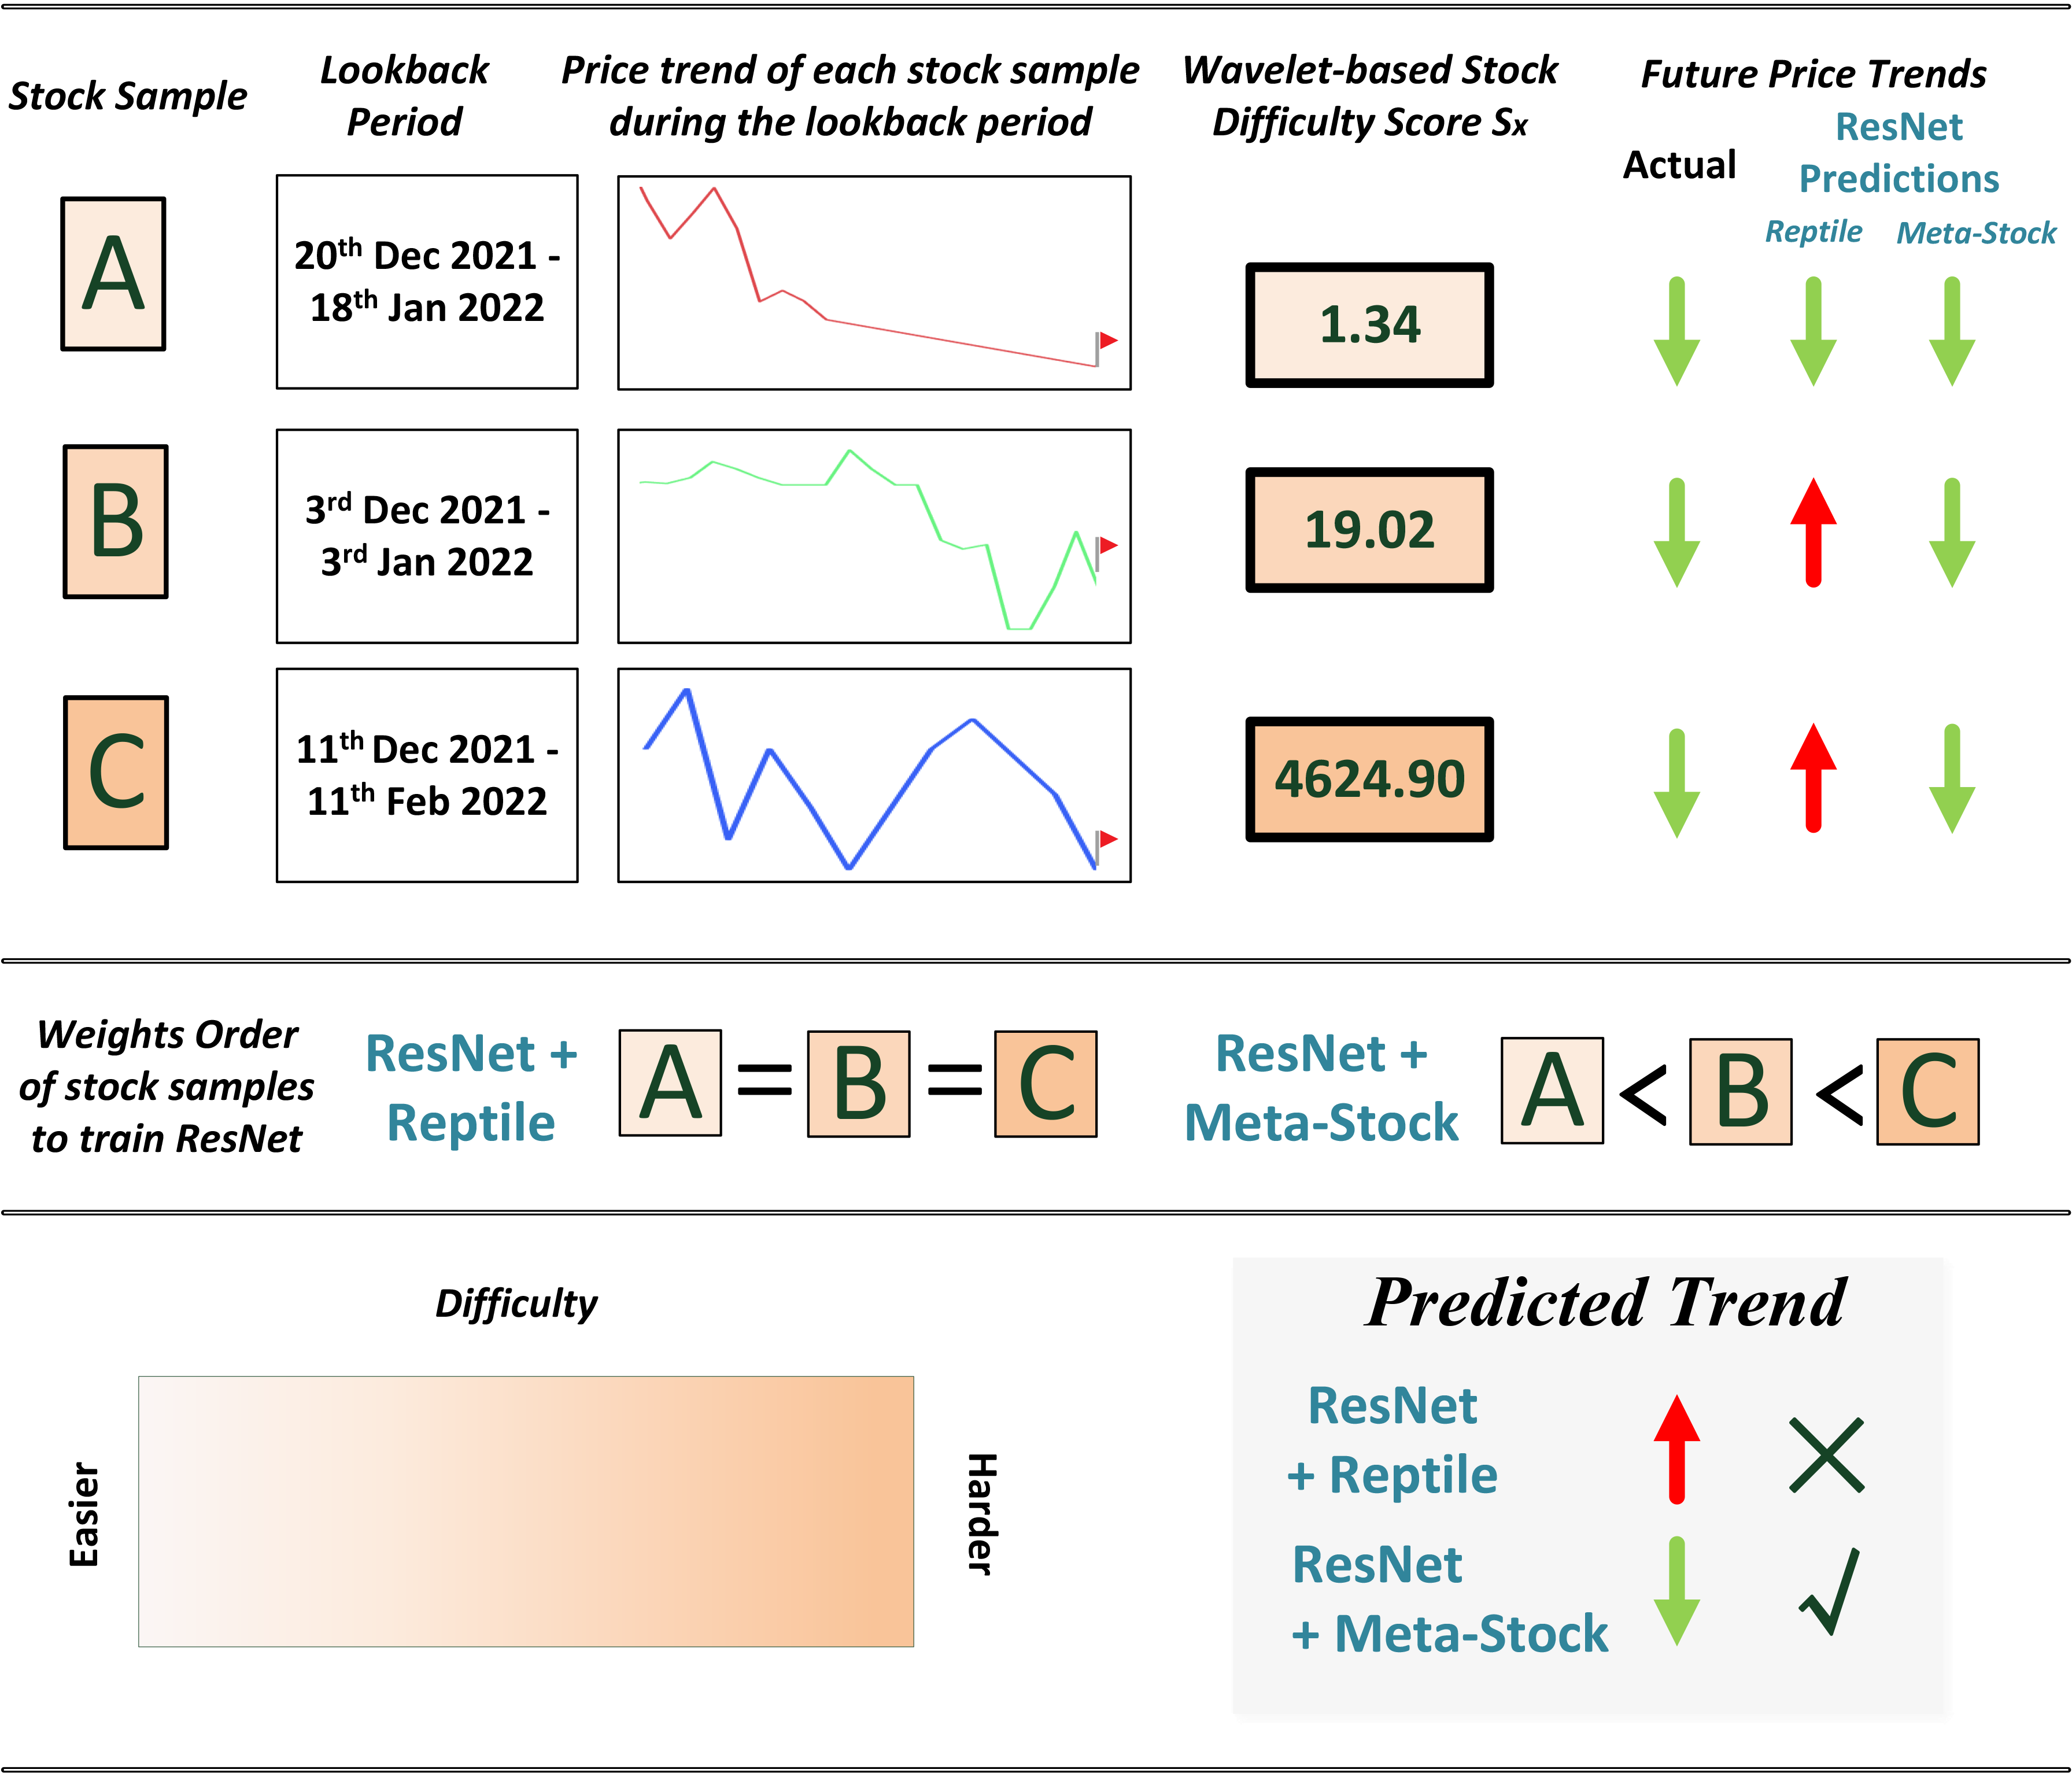
Qualitative Analysis
We further conduct an extended study to elucidate the benefits of Meta-Stock for stock prediction, as shown in Figure 3. Price series in training sample C possess a volatile trend, making it hard to analyze the future trend of the stock. We show that for a moderately complex test-data sample C, its movement is incorrectly classified when training ResNet without the adaptive learning. However, when training with Meta-Stock, its price trend is classified accurately. We attribute Meta-Stock+ResNet’s overall improved performance to the generated task weights that ameliorates the efficiency of the learning process.
Conclusion
In this paper, we propose Meta-Stock, a task-difficulty-adaptive meta-learning approach to predict sub-new stock price trends. Our meta-learning approach seeks to solve the data scarcity of sub-new stocks by leveraging old stocks and acquiring the fast generalization ability that can be extended to sub-new stock price prediction. Furthermore, we improve the entire meta-learning process by introducing adaptive learning according to volatility levels. We display Meta-Stock’s applicability in sub-new stock price prediction and real-world trading through extensive quantitative and qualitative experiments on real market data. In future work, we intend to extend Meta-Stock’s architecture to enhance its scalability in cross-market scenarios.
References
- (1)
- Ang and Lim (2022) Gary Ang and Ee-Peng Lim. 2022. Guided Attention Multimodal Multitask Financial Forecasting with Inter-Company Relationships and Global and Local News. In Proceedings of the 60th Annual Meeting of the Association for Computational Linguistics (Volume 1: Long Papers), ACL 2022, Dublin, Ireland, May 22-27, 2022, Smaranda Muresan, Preslav Nakov, and Aline Villavicencio (Eds.). Association for Computational Linguistics, 6313–6326. https://doi.org/10.18653/v1/2022.acl-long.437
- Batra and Daudpota (2018) Rakhi Batra and Sher Muhammad Daudpota. 2018. Integrating StockTwits with sentiment analysis for better prediction of stock price movement. In 2018 international conference on computing, mathematics and engineering technologies (ICoMET). IEEE, 1–5.
- Čeponis and Goranin (2020) Dainius Čeponis and Nikolaj Goranin. 2020. Investigation of dual-flow deep learning models LSTM-FCN and GRU-FCN efficiency against single-flow CNN models for the host-based intrusion and malware detection task on univariate times series data. Applied Sciences 10, 7 (2020), 2373.
- Chang et al. (2021) Shin-Hung Chang, Cheng-Wen Hsu, Hsing-Ying Li, Wei-Sheng Zeng, and Jan-Ming Ho. 2021. Short-Term Stock Price-Trend Prediction Using Meta-Learning. In 2021 IEEE International Conference on Systems, Man, and Cybernetics, SMC 2021, Melbourne, Australia, October 17-20, 2021. IEEE, 2900–2905. https://doi.org/10.1109/SMC52423.2021.9658607
- Chen et al. (2022) Junyu Chen, Qianqian Xu, Zhiyong Yang, Ke Ma, Xiaochun Cao, and Qingming Huang. 2022. Recurrent Meta-Learning against Generalized Cold-start Problem in CTR Prediction. In MM ’22: The 30th ACM International Conference on Multimedia, Lisboa, Portugal, October 10 - 14, 2022, João Magalhães, Alberto Del Bimbo, Shin’ichi Satoh, Nicu Sebe, Xavier Alameda-Pineda, Qin Jin, Vincent Oria, and Laura Toni (Eds.). ACM, 2636–2644. https://doi.org/10.1145/3503161.3548118
- Chicco and Jurman (2020) Davide Chicco and Giuseppe Jurman. 2020. The advantages of the Matthews correlation coefficient (MCC) over F1 score and accuracy in binary classification evaluation. BMC genomics 21, 1 (2020), 1–13.
- Dong et al. (2020) Yingzhe Dong, Da Yan, Abdullateef Ibrahim Almudaifer, Sibo Yan, Zhe Jiang, and Yang Zhou. 2020. Belt: A pipeline for stock price prediction using news. In 2020 IEEE International Conference on Big Data (Big Data). IEEE, 1137–1146.
- Feng et al. (2019a) Fuli Feng, Huimin Chen, Xiangnan He, Ji Ding, Maosong Sun, and Tat-Seng Chua. 2019a. Enhancing Stock Movement Prediction with Adversarial Training. In Proceedings of the Twenty-Eighth International Joint Conference on Artificial Intelligence, IJCAI 2019, Macao, China, August 10-16, 2019, Sarit Kraus (Ed.). ijcai.org, 5843–5849. https://doi.org/10.24963/ijcai.2019/810
- Feng et al. (2019b) Fuli Feng, Xiangnan He, Xiang Wang, Cheng Luo, Yiqun Liu, and Tat-Seng Chua. 2019b. Temporal relational ranking for stock prediction. ACM Transactions on Information Systems (TOIS) 37, 2 (2019), 1–30.
- Finn et al. (2017) Chelsea Finn, Pieter Abbeel, and Sergey Levine. 2017. Model-Agnostic Meta-Learning for Fast Adaptation of Deep Networks. In Proceedings of the 34th International Conference on Machine Learning, ICML 2017, Sydney, NSW, Australia, 6-11 August 2017 (Proceedings of Machine Learning Research, Vol. 70), Doina Precup and Yee Whye Teh (Eds.). PMLR, 1126–1135. http://proceedings.mlr.press/v70/finn17a.html
- Gllavata et al. (2004) J. Gllavata, R. Ewerth, and B. Freisleben. 2004. Text detection in images based on unsupervised classification of high-frequency wavelet coefficients. In Proceedings of the 17th International Conference on Pattern Recognition, 2004. ICPR 2004., Vol. 1. 425–428 Vol.1. https://doi.org/10.1109/ICPR.2004.1334146
- Groggel (2000) David J. Groggel. 2000. Practical Nonparametric Statistics. Technometrics 42, 3 (2000), 317–318. https://doi.org/10.1080/00401706.2000.10486067
- Hospedales et al. (2021) Timothy Hospedales, Antreas Antoniou, Paul Micaelli, and Amos Storkey. 2021. Meta-learning in neural networks: A survey. IEEE transactions on pattern analysis and machine intelligence 44, 9 (2021), 5149–5169.
- Kalais and Chatzis (2022) Konstantinos Kalais and Sotirios Chatzis. 2022. Stochastic Deep Networks with Linear Competing Units for Model-Agnostic Meta-Learning. In International Conference on Machine Learning, ICML 2022, 17-23 July 2022, Baltimore, Maryland, USA (Proceedings of Machine Learning Research, Vol. 162), Kamalika Chaudhuri, Stefanie Jegelka, Le Song, Csaba Szepesvári, Gang Niu, and Sivan Sabato (Eds.). PMLR, 10586–10597. https://proceedings.mlr.press/v162/kalais22a.html
- Keating and Shadwick (2002) Con Keating and William F Shadwick. 2002. A universal performance measure. Journal of performance measurement 6, 3 (2002), 59–84.
- Kim et al. (2019) Raehyun Kim, Chan Ho So, Minbyul Jeong, Sanghoon Lee, Jinkyu Kim, and Jaewoo Kang. 2019. HATS: A Hierarchical Graph Attention Network for Stock Movement Prediction. CoRR abs/1908.07999 (2019). arXiv:1908.07999 http://arxiv.org/abs/1908.07999
- King (2019) Albert King. 2019. AKShare. https://github.com/akfamily/akshare.
- Lahmiri (2014) Salim Lahmiri. 2014. Wavelet low-and high-frequency components as features for predicting stock prices with backpropagation neural networks. Journal of King Saud University-Computer and Information Sciences 26, 2 (2014), 218–227.
- Lei et al. (2022) Tianyi Lei, Honghui Hu, Qiaoyang Luo, Dezhong Peng, and Xu Wang. 2022. Adaptive Meta-learner via Gradient Similarity for Few-shot Text Classification. In Proceedings of the 29th International Conference on Computational Linguistics, COLING 2022, Gyeongju, Republic of Korea, October 12-17, 2022, Nicoletta Calzolari, Chu-Ren Huang, Hansaem Kim, James Pustejovsky, Leo Wanner, Key-Sun Choi, Pum-Mo Ryu, Hsin-Hsi Chen, Lucia Donatelli, Heng Ji, Sadao Kurohashi, Patrizia Paggio, Nianwen Xue, Seokhwan Kim, Younggyun Hahm, Zhong He, Tony Kyungil Lee, Enrico Santus, Francis Bond, and Seung-Hoon Na (Eds.). International Committee on Computational Linguistics, 4873–4882. https://aclanthology.org/2022.coling-1.431
- Li et al. (2020) Hung-Yang Li, Vincent S Tseng, and S Yu Philip. 2020. Enhancing Stock Trend Prediction Models by Mining Relational Graphs of Stock Prices. In 2020 International Conference on Pervasive Artificial Intelligence (ICPAI). IEEE, 110–117.
- Li et al. (2022) Yang Li, Hong-Ning Dai, and Zibin Zheng. 2022. Selective transfer learning with adversarial training for stock movement prediction. Connection Science 34, 1 (2022), 492–510.
- Luo (2021) Ji Wei Luo. 2021. A study on stock graph recognition based on wavelet denoising and DTW algorithm. Mathematical Problems in Engineering 2021 (2021), 1–15.
- Magdon-Ismail et al. (2004) Malik Magdon-Ismail, Amir F Atiya, Amrit Pratap, and Yaser S Abu-Mostafa. 2004. On the maximum drawdown of a Brownian motion. Journal of applied probability 41, 1 (2004), 147–161.
- Malkiel (1989) Burton G Malkiel. 1989. Efficient market hypothesis. Finance (1989), 127–134.
- Matsunaga et al. (2019) Daiki Matsunaga, Toyotaro Suzumura, and Toshihiro Takahashi. 2019. Exploring Graph Neural Networks for Stock Market Predictions with Rolling Window Analysis. CoRR abs/1909.10660 (2019). arXiv:1909.10660 http://arxiv.org/abs/1909.10660
- Mingli et al. (2022) Zhang Mingli, Zhang Yijie, Qin Simeng, and Gong Juhong. 2022. Empirical study on the impact of major asset restructuring on the price of sub-new stocks in Chinese A-shares. International Journal of Finance & Economics 27, 1 (2022), 1461–1472.
- Nichol et al. (2018) Alex Nichol, Joshua Achiam, and John Schulman. 2018. On First-Order Meta-Learning Algorithms. CoRR abs/1803.02999 (2018). arXiv:1803.02999 http://arxiv.org/abs/1803.02999
- Qin and Yang (2019) Yu Qin and Yi Yang. 2019. What you say and how you say it matters: Predicting stock volatility using verbal and vocal cues. In Proceedings of the 57th Annual Meeting of the Association for Computational Linguistics. 390–401.
- Sawhney et al. (2021b) Ramit Sawhney, Shivam Agarwal, Arnav Wadhwa, Tyler Derr, and Rajiv Ratn Shah. 2021b. Stock Selection via Spatiotemporal Hypergraph Attention Network: A Learning to Rank Approach. In Thirty-Fifth AAAI Conference on Artificial Intelligence, AAAI 2021, Thirty-Third Conference on Innovative Applications of Artificial Intelligence, IAAI 2021, The Eleventh Symposium on Educational Advances in Artificial Intelligence, EAAI 2021, Virtual Event, February 2-9, 2021. AAAI Press, 497–504. https://ojs.aaai.org/index.php/AAAI/article/view/16127
- Sawhney et al. (2020a) Ramit Sawhney, Shivam Agarwal, Arnav Wadhwa, and Rajiv Ratn Shah. 2020a. Deep Attentive Learning for Stock Movement Prediction From Social Media Text and Company Correlations. In Proceedings of the 2020 Conference on Empirical Methods in Natural Language Processing, EMNLP 2020, Online, November 16-20, 2020, Bonnie Webber, Trevor Cohn, Yulan He, and Yang Liu (Eds.). Association for Computational Linguistics, 8415–8426. https://doi.org/10.18653/v1/2020.emnlp-main.676
- Sawhney et al. (2021a) Ramit Sawhney, Shivam Agarwal, Arnav Wadhwa, and Rajiv Ratn Shah. 2021a. Exploring the Scale-Free Nature of Stock Markets: Hyperbolic Graph Learning for Algorithmic Trading. In WWW ’21: The Web Conference 2021, Virtual Event / Ljubljana, Slovenia, April 19-23, 2021, Jure Leskovec, Marko Grobelnik, Marc Najork, Jie Tang, and Leila Zia (Eds.). ACM / IW3C2, 11–22. https://doi.org/10.1145/3442381.3450095
- Sawhney et al. (2020b) Ramit Sawhney, Arshiya Aggarwal, Piyush Khanna, Puneet Mathur, Taru Jain, and Rajiv Ratn Shah. 2020b. Risk Forecasting from Earnings Calls Acoustics and Network Correlations.. In INTERSPEECH. 2307–2311.
- Sawhney et al. (2020c) Ramit Sawhney, Puneet Mathur, Ayush Mangal, Piyush Khanna, Rajiv Ratn Shah, and Roger Zimmermann. 2020c. Multimodal multi-task financial risk forecasting. In Proceedings of the 28th ACM international conference on multimedia. 456–465.
- Sawhney et al. (2021c) Ramit Sawhney, Arnav Wadhwa, Shivam Agarwal, and Rajiv Ratn Shah. 2021c. FAST: Financial News and Tweet Based Time Aware Network for Stock Trading. In Proceedings of the 16th Conference of the European Chapter of the Association for Computational Linguistics: Main Volume, EACL 2021, Online, April 19 - 23, 2021, Paola Merlo, Jörg Tiedemann, and Reut Tsarfaty (Eds.). Association for Computational Linguistics, 2164–2175. https://doi.org/10.18653/v1/2021.eacl-main.185
- Sawhney et al. (2021d) Ramit Sawhney, Arnav Wadhwa, Shivam Agarwal, and Rajiv Ratn Shah. 2021d. Quantitative Day Trading from Natural Language using Reinforcement Learning. In Proceedings of the 2021 Conference of the North American Chapter of the Association for Computational Linguistics: Human Language Technologies, NAACL-HLT 2021, Online, June 6-11, 2021, Kristina Toutanova, Anna Rumshisky, Luke Zettlemoyer, Dilek Hakkani-Tür, Iz Beltagy, Steven Bethard, Ryan Cotterell, Tanmoy Chakraborty, and Yichao Zhou (Eds.). Association for Computational Linguistics, 4018–4030. https://doi.org/10.18653/v1/2021.naacl-main.316
- Sharpe (1994) William F. Sharpe. 1994. The Sharpe Ratio.
- Sortino and Price (1994) Frank A Sortino and Lee N Price. 1994. Performance measurement in a downside risk framework. the Journal of Investing 3, 3 (1994), 59–64.
- Teng et al. (2020) Xiao Teng, Tuo Wang, Xiang Zhang, Long Lan, and Zhigang Luo. 2020. Enhancing stock price trend prediction via a time-sensitive data augmentation method. Complexity 2020 (2020), 1–8.
- Wang et al. (2021) Heyuan Wang, Shun Li, Tengjiao Wang, and Jiayi Zheng. 2021. Hierarchical Adaptive Temporal-Relational Modeling for Stock Trend Prediction. In Proceedings of the Thirtieth International Joint Conference on Artificial Intelligence, IJCAI 2021, Virtual Event / Montreal, Canada, 19-27 August 2021, Zhi-Hua Zhou (Ed.). ijcai.org, 3691–3698. https://doi.org/10.24963/ijcai.2021/508
- Wen et al. (2019) Min Wen, Ping Li, Lingfei Zhang, and Yan Chen. 2019. Stock market trend prediction using high-order information of time series. Ieee Access 7 (2019), 28299–28308.
- Wu et al. (2021) Dingming Wu, Xiaolong Wang, and Shaocong Wu. 2021. A hybrid method based on extreme learning machine and wavelet transform denoising for stock prediction. Entropy 23, 4 (2021), 440.
- Xiang et al. (2022) Sheng Xiang, Dawei Cheng, Chencheng Shang, Ying Zhang, and Yuqi Liang. 2022. Temporal and Heterogeneous Graph Neural Network for Financial Time Series Prediction. In Proceedings of the 31st ACM International Conference on Information & Knowledge Management. 3584–3593.
- Xu and Cohen (2018) Yumo Xu and Shay B. Cohen. 2018. Stock Movement Prediction from Tweets and Historical Prices. In Proceedings of the 56th Annual Meeting of the Association for Computational Linguistics, ACL 2018, Melbourne, Australia, July 15-20, 2018, Volume 1: Long Papers, Iryna Gurevych and Yusuke Miyao (Eds.). Association for Computational Linguistics, 1970–1979. https://doi.org/10.18653/v1/P18-1183
- Yang et al. (2020) Guanglei Yang, Haifeng Xia, Mingli Ding, and Zhengming Ding. 2020. Bi-directional generation for unsupervised domain adaptation. In Proceedings of the AAAI conference on artificial intelligence, Vol. 34. 6615–6622.
- Young (1991) Terry W Young. 1991. Calmar ratio: A smoother tool. Futures 20, 1 (1991), 40.
- Zhang et al. (2017) Liheng Zhang, Charu Aggarwal, and Guo-Jun Qi. 2017. Stock price prediction via discovering multi-frequency trading patterns. In Proceedings of the 23rd ACM SIGKDD international conference on knowledge discovery and data mining. 2141–2149.
- Zou et al. (2019) Xiaowu Zou, Zidong Wang, Qi Li, and Weiguo Sheng. 2019. Integration of residual network and convolutional neural network along with various activation functions and global pooling for time series classification. Neurocomputing 367 (2019), 39–45.