Do the Outburst Properties of M31N 2008-12a Depend on the Time Since the Previous Eruption?
Abstract
Photometric observations spanning the UV to the near IR during the nine most recent eruptions (2014–2022) of the extragalactic nova M31N 2008-12a are presented and analyzed in order to explore whether the lightcurve properties for a given eruption, specifically the peak magnitudes and fade rates, are correlated with the time interval since the previous eruption. No significant correlation between the pre-eruption interval and the rate of decline was found, however it appears that the brightness at the peak of an outburst may be positively correlated with the time interval since the previous eruption.
1 Introduction
M31N 2008-12a was discovered by Koichi Nishiyama and Fujio Kabashima, on 2008 Dec. 26.48 UT in the outskirts of M31111http://www.cbat.eps.harvard.edu/iau/CBAT_M31.html#2008-12a. After the object was seen again in the fall of 2011 and 2012, Shafter et al. (2012) speculated that the object was either a recurrent nova or a slow nova undergoing multiple rebrightenings. When the object erupted again in the fall of 2013, the recurrent nova nature of the object became clear Darnley et al. (2014); Tang et al. (2014). Based on timings of the 15 eruptions observed every year since 2008, the mean recurrence time is d, or yr, which is the shortest of any known nova.
The yr recurrence time offers an exceptional opportunity to study how the properties of a nova progenitor affects the outburst behavior. In the case of 2008-12a, the short recurrence time requires that the white dwarf in the system must be near the Chandrashekhar mass and accreting at a rate a few times yr-1 (e.g., Kato et al., 2014).
Starting in 2014 a worldwide campaign to monitor 2008-12a has produced a wealth of photometric data (e.g., see Darnley & Henze, 2020, and references therein). Here, we analyze lightcurve data from 2014 to the most recent eruption in 2022. Our primary goal is to explore whether properties of the UV and optical lightcurves are affected by the time since the previous eruption ().
2 Photometric Data
Optical (Johnson and Sloan ) and UVOT (UVW1 and UVW2) photometry for eruptions from 2014 to 2022 have been analyzed to determine lightcurve parameters. The optical data were gleaned from the literature, while the UVOT photometry was obtained from the Swift archive. The UVOT data were reanalyzed using the HEASoft tool uvotmaghist to achieve the largest temporal coverage available, while using smaller apertures ( instead of the used in the default Swift calibration) and multiple background regions to maximize the signal-to-noise. Unfortunately, the UVOT data were not always obtained using the same filters making direct comparisons between the various eruptions difficult. Both the UVW1 ( Å) and UVW2 ( Å) filters were used in 2014, while in subsequent years only one filter was employed: UVW1 in 2015, and UVW2 from 2016 onwards.
3 LightCurve Parameters
Linear least-square fits to 2 mag below peak were performed on the rise (when observed) and fall from maximum light. When the rise was observed, the intersection of the two linear fits was taken to be the time of maximum light, and the extrapolated magnitude at that time was taken to be the peak magnitude. When the rise was not captured, we took the brightest observed point to represent maximum light222Formally, this represents a lower limit to the actual peak magnitude, but due to the sustained monitoring around the world, observations were typically made within hours of discovery, and thus likely close to peak brightness.. In all cases, the rate of decline from maximum light was used to determine the corresponding times (the time to decline by 2 mag from maximum light) for each eruption. There were some years where only a few data points in a particular filter were measured, not enough to measure a meaningful time. In these cases, we also adopted the brightest measured magnitude as maximum light.
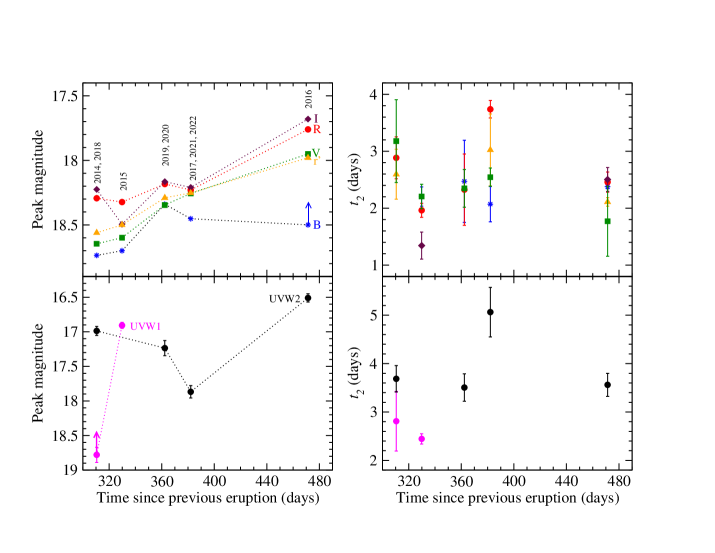
The peak magnitudes and times are shown in Figure 1 where we have plotted the parameters as a function of the time interval since previous eruption, . Given that was (remarkably!) nearly identical for several epochs, we averaged the maximum magnitudes and times for those pre-eruption intervals. This process resulted in five mean intervals of = 310.49 d (2014/2018), 329.83 d (2015), 362.34 d (2019/2020), 382.09 d (2017/2021/2022), and 471.34 d (2016).
No correlation is apparent between the and times, however we do find tentative evidence for a correlation between the peak brightness and . The most compelling evidence is provided by the 2016 eruption, which had the longest pre-eruption interval of d. In 4 out of the 5 optical filters, and in the UVW2 filter, the peak brightness of the 2016 eruption is largest seen, even though the peak was not captured in any filter that year. On the other hand, the 2014 and 2018 eruptions, which had the shortest pre-eruption mean interval ( d), were the faintest of the nine most recent eruptions (in all but the and filters), although the 2018 lightcurve morphology was somewhat complicated exhibiting a double-peaked maximum: a dip after the original peak followed by a short resurgence. It is unclear whether the double-peak structure of the outburst is related to the short pre-eruption interval, but it will be interesting to see if 2008-12a exhibits similar behavior during future eruptions with short . There is no obvious double-peaked structure in the 2014 eruption, but the data are limited.
4 Conclusions
Our analysis has failed to reveal any obvious relationship between the time and . However, we did find tentative evidence that the peak optical brightness reached by M31N 2008-12a increases with the time since the previous eruption. The trend is not obvious in the UV likely because the Swift observations were always triggered after the eruption was discovered in the optical giving the nova more time to fade before the UV photometry could be performed.
The accreted mass required to trigger an eruption depends on and the mean accretion rate onto the white dwarf’s surface (e.g., Townsley & Bildsten, 2005). A longer implies a lower between eruptions. The observed trend of peak brightness with may be the result of increased degeneracy in the accreted layer that would be expected for this slightly lower accretion rate. Continued monitoring of 2008-12a during future eruptions will be required in order to confirm this finding, and if warranted, to explore its origin.
References
- Darnley & Henze (2020) Darnley, M. J., & Henze, M. 2020, Advances in Space Research, 66, 1147, doi: 10.1016/j.asr.2019.09.044
- Darnley et al. (2014) Darnley, M. J., Williams, S. C., Bode, M. F., et al. 2014, A&A, 563, L9, doi: 10.1051/0004-6361/201423411
- Kato et al. (2014) Kato, M., Saio, H., Hachisu, I., & Nomoto, K. 2014, ApJ, 793, 136, doi: 10.1088/0004-637X/793/2/136
- Shafter et al. (2012) Shafter, A. W., Hornoch, K., Ciardullo, J. V. R., Darnley, M. J., & Bode, M. F. 2012, The Astronomer’s Telegram, 4503, 1
- Tang et al. (2014) Tang, S., Bildsten, L., Wolf, W. M., et al. 2014, ApJ, 786, 61, doi: 10.1088/0004-637X/786/1/61
- Townsley & Bildsten (2005) Townsley, D. M., & Bildsten, L. 2005, ApJ, 628, 395, doi: 10.1086/430594
| (d) | Mag | (d) | Filter | Sourceaa 1: ATel #12181, 2: ATel #12190, 3: ATel #12200, 4: ATel #12205, 5: ATel #12203, 6: ATel #6543, 7: ATel #6546, 8: ATel #6535, 9: ATel #7965, 10: ATel #7967, 11: ATel #7969, 12: ATel #7980, 13: ATel #7984, 14: ATel #8029, 15: ATel #8038, 16: ATel #7974, 17: ATel #7976, 18: ATel #7979, 19: ATel #14130, 20: ATel #14131, 21: ATel #13279, 22: ATel #13281, 23: ATel #13302, 24: ATel #15037, 25: ATel #15039, 26: ATel #15068, 27: ATel #15038, 28: ATel #15797, 29: ATel #15786, 30: ATel #15788, 31: ATel #15789, 32: ATel #15795, 33: ATel #15802, 34: ATel #15902, 35: ATel #11118, 36: ATel #11125, 37: ATel #11126, 38: ATel #11124, 39: ATel #9864, 40: ATel #9861, 41: ATel #9857, 42: ATel #9881. |
|---|---|---|---|---|
| 310.35 | This work | |||
| 310.35 | 1,2,3,4 | |||
| 310.35 | 1,2,3,4 | |||
| 310.35 | 1,2,3,4 | |||
| 310.35 | 4,5 | |||
| 310.35 | 1,2,3,4 | |||
| 310.64 | This work | |||
| 310.64 | This work | |||
| 310.64 | 6,7 | |||
| 310.64 | 6,7 | |||
| 310.64 | 6,7 | |||
| 310.64 | 8 | |||
| 310.64 | 6,7 | |||
| 329.83 | This work | |||
| 329.83 | 9,10,11,12,13,14,15 | |||
| 329.83 | 9,10,11,12,13,14,15,16,17,18 | |||
| 329.83 | 10,11,17 | |||
| 329.83 | 9,12,13 | |||
| 329.83 | 10,11,17 | |||
| 359.37 | This work | |||
| 359.37 | This work | |||
| 359.37 | 19,20 | |||
| 359.37 | This work | |||
| 365.31 | This work | |||
| 365.31 | 21,22,23 | |||
| 365.31 | 21,22,23 | |||
| 365.31 | 21,22,23 | |||
| 365.31 | 21,23 | |||
| 379.18 | This work | |||
| 379.18 | 24 | |||
| 379.18 | 24,25,26 | |||
| 379.18 | This work | |||
| 379.18 | 24,25,26,27 | |||
| 383.16 | This work | |||
| 383.16 | 28 | |||
| 383.16 | 28 | |||
| 383.16 | 28 | |||
| 383.16 | 29,30,31,32,33,34 | |||
| 383.98 | This work | |||
| 383.98 | 35,36,37 | |||
| 383.98 | 35,36,37,38 | |||
| 383.98 | 35,36,37,38 | |||
| 383.98 | 36,37,38 | |||
| 471.37 | This work | |||
| 471.37 | 39 | |||
| 471.37 | 39,40 | |||
| 471.37 | 39,40,41 | |||
| 471.37 | 40,41,42 | |||
| 471.37 | 39,40 |