[]\fnmZ. \surKhalid
]\orgdivElectrical Engineering, \orgnameLUMS, \orgaddress\cityLahore, \postcode54792, \statePunjab, \countryPakistan
Logistics Hub Location Optimization: A K-Means and P-Median Model Hybrid Approach Using Road Network Distances
Abstract
Logistic hubs play a pivotal role in the last-mile delivery distance; even a slight increment in distance negatively impacts the business of the e-commerce industry while also increasing its carbon footprint. The growth of this industry, particularly after Covid-19, has further intensified the need for optimized allocation of resources in an urban environment. In this study, we use a hybrid approach to optimize the placement of logistic hubs. The approach sequentially employs different techniques. Initially, delivery points are clustered using K-Means in relation to their spatial locations. The clustering method utilizes road network distances as opposed to Euclidean distances. Non-road network-based approaches have been avoided since they lead to erroneous and misleading results. Finally, hubs are located using the P-Median method. The P-Median method also incorporates the number of deliveries and population as weights. Real-world delivery data from Muller and Phipps (M&P) is used to demonstrate the effectiveness of the approach. Serving deliveries from the optimal hub locations results in the saving of 815 (10%) meters per delivery.
keywords:
Urban logistics, Optimization, Last mile delivery, Machine Learning, K-Means, P-Median, Geographical Information SystemThe authors declare no conflict of interests.
1 Introduction
The need for urban logistics has been expanding quickly in terms of both scope and intensity throughout the current economic globalisation and e-commerce boom [34]. The Covid-19 pandemic has further accelerated this trend by changing people’s traditional buying habits, as observed by the improved financial performance of logistics organizations in the year 2020 [3]. For instance, the e-commerce sector generated $3.351 trillion in global sales in 2019 and is predicted to reach $6.169 trillion by 2023 [16]. Because of this upward trend, small, medium-sized, and micro businesses have been able to bear the brunt of Covid-19. Similar growth has been observed in Pakistan, where the value of the e-commerce sector was $548.89 million in 2021 with a growth of 35% in the first quarter [28].
This growth has consequently led to more delivery parcels being packed, shipped, and transported by logistics providers. The parcels invariably pass through a Logistics Hub (LH) on their way to the customer. A LH may be defined as a distribution center that connects other transportation systems including local, national, and international inside which parcels may be sorted, consolidated, stored, and finally shipped to their respective locations [26]. The logistics system as a whole is affected by the decision of where to locate facilities across the network. The unoptimized location of a LH leads to delivery vehicles traveling longer distances and hence leading to negative spillovers such as the emission of harmful gasses into the environment. As a result, a LH has a significant effect on the carbon emissions in the delivery process [11] since logistics transportation considerably contributes to environmental pollution and to the greenhouse gas effects [1]. For example, road freight transport emitted over 1.8 billion tonnes of CO2 in 2019 [12]. The spillovers also include higher delivery costs. Last-mile delivery accounts for nearly of total shipping costs [21]. The fuel costs account for approximately to percent of the overall last-mile delivery expenses [8]. Traveling longer distances due to unoptimized hub locations leads to more fuel consumption and therefore higher total costs for last-mile deliveries. Moreover, our discussion with logistics operators also highlighted the location of LH as one of the most significant problems to solve.
The hub location problem is a significant issue with several applications in fields like telecommunications and transportation [25]. One such domain is the logistics industry. Most studies that try to solve this Multi-Facility Location Problem (MFLP) use non-road network distances. Euclidean or other sorts of distance calculations are used [6]. Numerous optimization techniques have been used to tackle the problem of hub location optimization. Shahparvari et al used multiple criteria techniques for selecting suitable locations of LH. The novel Mixed Integer Quadratic Constrained Programming (MIQCP) method was used to cluster the centroids representing the most suitable sites [26]. A weighted K-Means algorithm has also been employed in studies to determine the optimal location of container storage and distribution centers [19], [10]. Multiple characteristics of potential locations as weights were used to determine optimal points. Sharma et al propose a two-part method. First make use of K-Means clustering after which in the second part, for each cluster a Mixed Integer Linear Programming (MILP) technique is implemented to help determine the maximum profit-yielding facility [27]. Esnaf et al utilized a Fuzzy clustering-based hybrid method to locate multiple facilities. Firstly, customers were grouped based on geographical location using cluster analysis. Then, the cluster centers were used to locate facilities. Finally, each cluster was solved independently, treating each as a single facility location problem. The center of gravity method was used to improve facility location [9]. Similarly, Onden et al applied fuzzy analytic hierarchy process, spatial statistics, and analysis approaches to determine logistics center locations [20].

Li et al use a two-part methodology to optimize hub placement. In the first part, employ Axiomatic Fuzzy Set (AFS) clustering method to evaluate the logistics center location. In the second part, a Technique for Order Preference by Similarity to Ideal Solution (TOPSIS) is used to determine the final selection [17]. Ozceylan et al use a Multi-Criteria Decision Making (MCDM) model built on a Geographic Information System (GIS) to assess suitable sites for freight communities. A four-step model was used to define weight through the Analytical Network Process (ANP) and to find the optimal location using the TOPSIS technique [22]. Yang et al focus on Intermodal Hub-and-Spoke (IH&S) network design and optimization taking into account mixed uncertainties in both transportation cost and trip time [33]. Ulutas et al. employs fuzzy SWARA and CoCoSo methods to locate logistics centers [29]. However, the distance metric used for optimization in all these studies was based on non-road network distances, with Euclidean calculations being the most common. Euclidean distance is defined as the straight line distance between two points in a plane [4]. It underestimates the road network distance as presented in Fig. 1. Non-road network-based approaches could lead to erroneous and misleading results since they misrepresent ground distances. Some researchers have tried to overcome the issue by multiplying the Euclidean distance with a constant factor of 1.25 to transform them into real-world distances [9]. Similarly, Mulesa et al use a novel optimization method to determine the location of the logistics hub which was closer to the most distant of the roads. Roads are considered to be straight lines and use custom, non-road network distances in the algorithm [19]. Wen et al implemented a variation of Euclidean distance for cluster analysis. In this approach, weighted spatial patterns were used to find optimal locations for LH. For the distance metric, the Euclidean distance was used from the centroid to the point. The distance is normalized by the sum of distances from all centroids [30]. Nevertheless, these approaches do not incorporate the true network distance for LH optimization.
In the literature, road network has been used widely for station location and other problems to determine the most optimal site. Yang et al use road network distance for optimal dynamic traffic network planning [32]. Bozkaya et al use road networks as input to determine the optimal set of locations in the supply chain of a firm that is operating under competition [5]. Kuby et al use road networks with average speeds to determine the optimal location of hydrogen stations in Florida [14]. However, the road network distance matrix has not been employed to solve the problem of location optimization for LH. The contributions of this study are as follows:
-
1.
Incorporate ground truth road network for the computation of accurate distances in the location optimization problem.
-
2.
Propose a hybrid approach utilizing both K-Means and P-Median to determine the optimal hub locations serving the deliveries while minimizing travel distance.
-
3.
Demonstrate the effectiveness of the proposed approach using real-world delivery data.
The rest of the paper is structured as follows: Methodology (section 2) explains the hybrid approach using road network distances, Application and Analysis (section 3) outlines our case study area and data sources used including baseline measures, Results (section 4) demonstrates the effectiveness of the proposed approach and Conclusion (section 5) provides the concluding remarks.
2 Methodology
2.1 Problem Description and Formulation
The proposed approach attempts to answer the following question: Given number of LH clusters defined as a set of spatial points and total delivery points, where should the hubs be placed such that the average road network distance from the hubs to the respective locations per delivery is minimized? This can be formulated as the following optimization problem with an objective function minimizing the average distance traveled per delivery:
| (1) |
where is unique delivery location and = 1 if cluster, else = 0. The function returns the road network distance from the hub of cluster to point . Distance between points is calculated using a road network with directions incorporated indicating whether a road is two-way or one-way.
2.2 Cluster Formation
To optimize the above objective function, the proposed approach makes use of the K-Means algorithm which follows two steps. In the first step, the distance between all the points and initial centroids is calculated. The initial centroids can be any random points on the map and not necessarily LH. Based on these distances, points are associated with the nearest centroid. In the second step, based on the new association of points with the nearest centroid, the location of the centroids of each cluster is updated. These steps are repeated until the maximum number of iterations is reached or changes in the location of the centroids are minimal. The maximum number of iterations and the change cutoff are input to the algorithm [13]. The distances in the first step are calculated using the QNEAT3 plugin in QGIS which makes use of the road network. The plugin uses Dijkstra’s algorithm to determine the shortest distance between the origin and the destination [7].
2.3 Hub Location Optimization
Traditionally, the centroid update step (second step) uses the mean position of the points in the cluster to update the centroids. However, this approach is not suitable since the centroids/LH need to be updated depending on the road network distances. To account for this point, we use the well-defined P-Median model as part of the algorithm. The P-Median model is defined as follows:
| (2) | ||||
| such that | (3) | |||
| (4) | ||||
| (5) |
where is the total possible hub locations , is the total number of unique delivery locations, is the weight of delivery location, quantifies the road network distance between -th delivery location and -th hub location, is 1 if is assigned to else 0, is 1 if LH is located at else 0 and is the number of LH to be determined. The first constraint ensures that an is assigned to only one . The second constraint makes sure that an is assigned to only if a LH exists at . The third constraint is there to make certain that the total number of LH is . Since this approach locates only 1 center when updating the centroid for each cluster, is set to 1. To determine , the cluster is divided into a grid of resolution 1 km x 1 km. The center of the grid is attached to the nearest road network node. Using these as possible hub locations, the P-Median problem mentioned above is solved using the QNEAT3 plugin with road network distances with directions. For weight , the number of deliveries performed at unique location is used in phase 1. In phase 2, the above methodology is repeated using a layer of population estimates to make the approach more robust. For this purpose, WorldPop data set is used that provides population estimates at a 1km x 1km resolution. Each pixel in the dataset provides value of the population in that pixel i.e., population per pixel (ppp) [31]. Using this data set, the pixels are converted to 1km x 1km polygons, and their centroids are determined. These points are used to form clusters and determine LH. Weight of each point, is calculated as follows:
| (6) |
where is the number of normalized deliveries performed and is the normalized ppp in grid . is a hyper-parameter quantifying the weight to be given for each term in . The proposed approach in the form of an iterative procedure is summarized as Algorithm 1 below. The algorithm runs for iterations or terminates if the maximum value of the distance between new and initial centroids (taken as inputs) is below the pre-defined cutoff value, denoted by .
3 Application and Analysis
This study takes Lahore, Pakistan as a case to draw inferences about LH optimization. The city has a population of around 11.13 million, with approximately 1,744,755 households [23, 24]. The GDP of the city is estimated to be over 1 trillion rupees [28] with the services sector having the highest share in the economy [15]. These high demographic and GDP numbers also correspond with a higher e-commerce activity in Lahore [2].
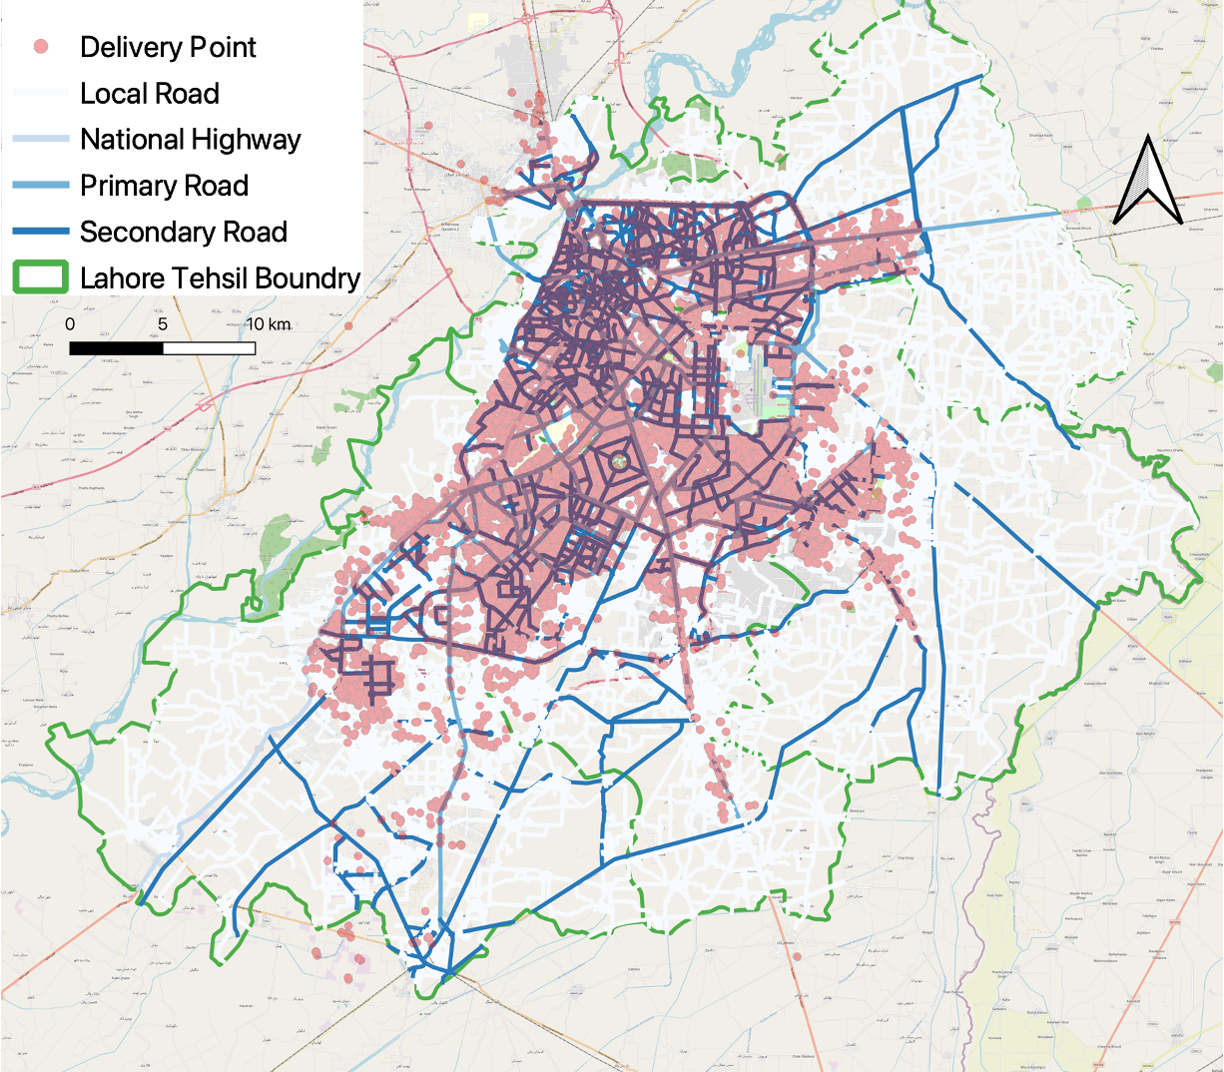
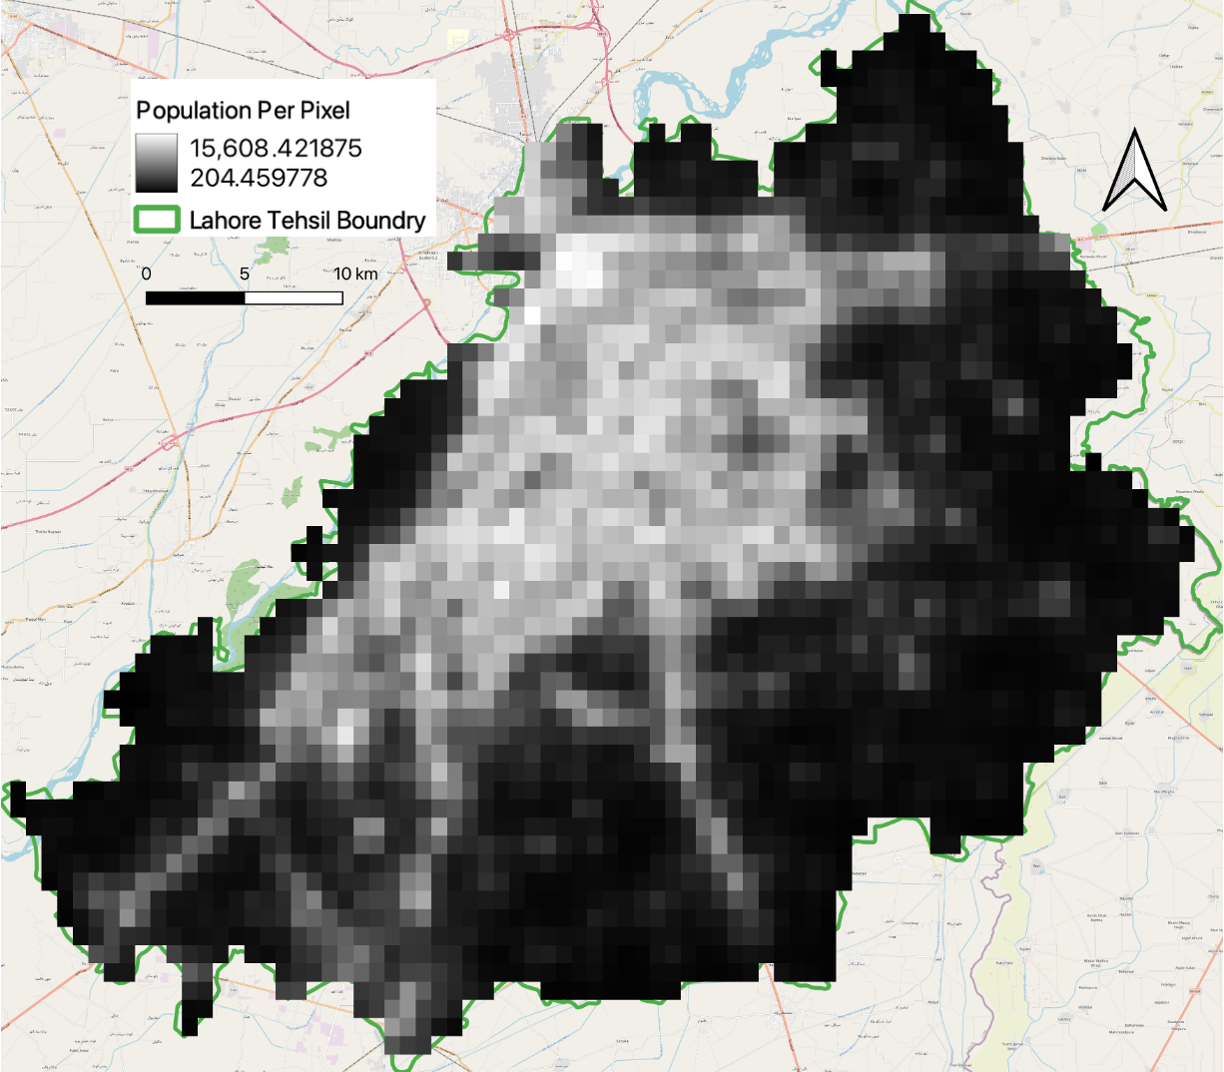
The data sources for this research mainly include delivery data, road network and population distribution. The delivery data, shown in Fig. 2a, is gathered from Muller and Phips (M&P) logistics. M&P is one the largest logistics operators and provides services all across Pakistan. The road network dataset, also shown in Fig. 2a, has been prepared by the National Transport Research Centre (NTRC). NTRC is a government department that deals with transportation research and policy across the country. Worldpop data shown in Fig 2b is used to draw inferences about population distribution. The delivery data set consists of 26,837 ‘unique Geo-Coordinate’ deliveries spread across Lahore. The bulk of these deliveries were performed in the months of January and February of 2022, over a span of 46 days. Deliveries with ‘unique Geo-Coordinate’ are defined as those that have distinct pin locations. For instance, a rider may have delivered 10 packages at any particular pin position, which would be represented in the data collection as 10 different entries. Since each of these deliveries would have the same pin location, they will all be counted as having a single ‘unique Geo-Coordinate’. The road network acquired by the NTRC includes the following types of roads: primary, secondary, local, motorway, metro, and highway. Motorways and the metro were deleted from the network. This is because according to M&P, most of their deliveries are made using motorbikes which cannot travel on the deleted roads due to local regulations. A direction field is also present in the network for each road segment. Each segment may have one of the following values: North Bound (NB), South Bound (SB), East Bound (EB), West Bound (WB), and None. None roads are two-way direction.
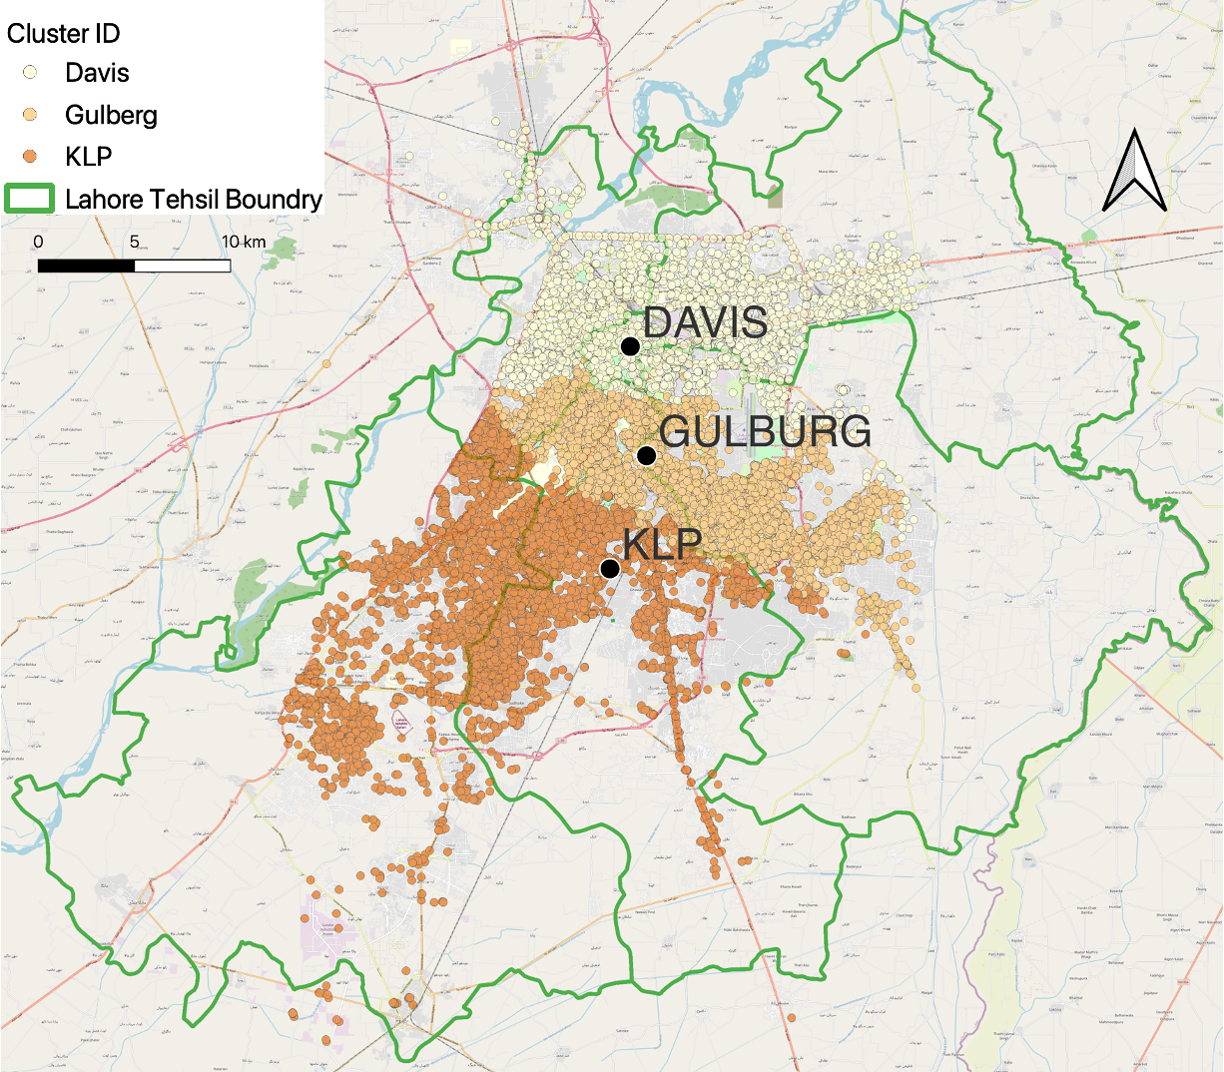
As a baseline, we clustered the data points according to the existing M&P hubs shown in Fig. 2c using QNEAT3 plugin in QGIS. The points were clustered based on the shortest distance. The delivery point which was closest to a given hub was assigned to that hub. As mentioned previously, QNEAT3 takes road network with directions, hub locations and delivery locations as input. The Origin-Destination (OD) matrix is computed by the plugin which contains the shortest distance between an origin-destination pair. The distances are determined using the road network. The clusters are shown in Fig. 2c. The average distance traveled per delivery from a hub to a delivery location is 7801 meters. It is worth mentioning the delivery model of M&P at this point. The riders collect their parcels from LH and travel to their respective areas. Therefore, only the first delivery made by the riders should be taken into consideration for the purposes of this study. However, given the spread of deliveries across Lahore is uniformly distributed, any one delivery can be the first delivery of the day.


4 Results
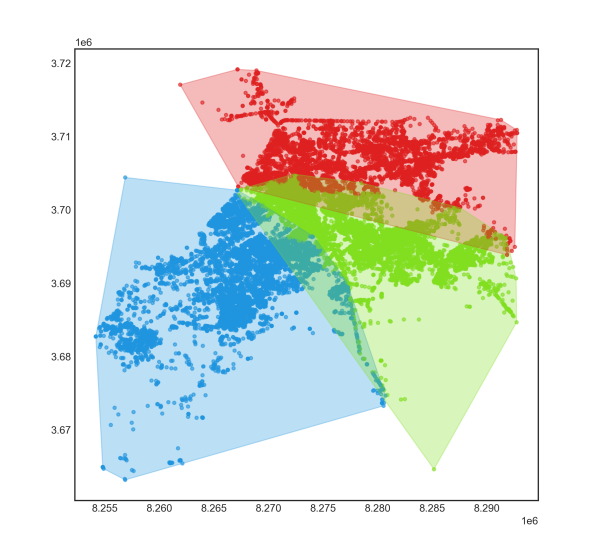
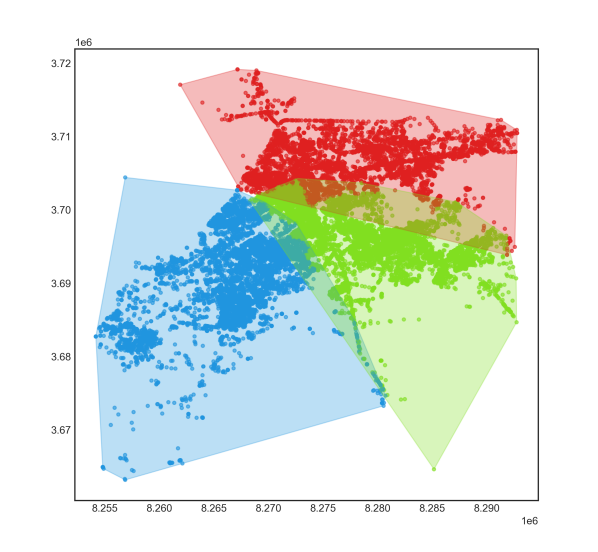
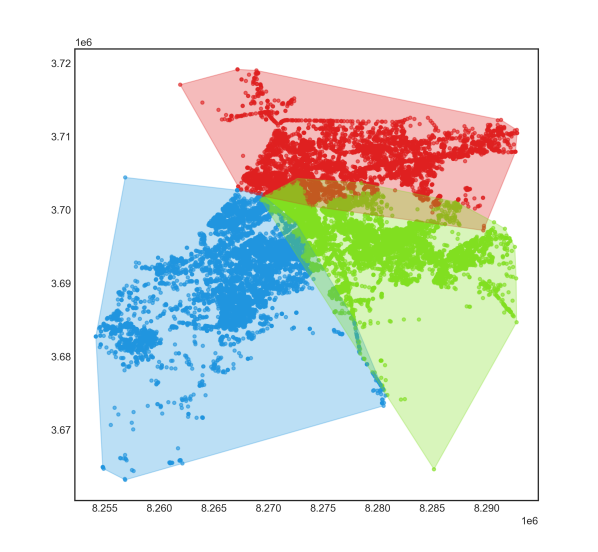
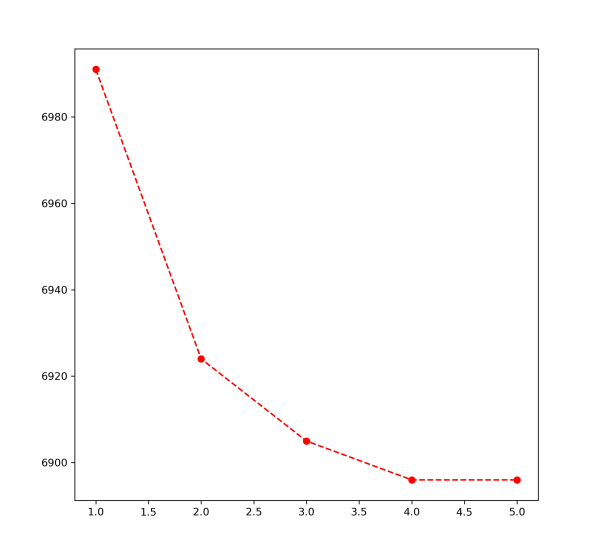
In phase 1, using the M&P deliveries data, we ran our algorithm for value of 10. Current M&P hubs seen in Fig. 2c are used as initial centroids. The cutoff value is 10 meters. The total number of deliveries made at a ‘unique Geo-Coordinate’ are used as weights. For phase 2, the Worldpop dataset is used for clustering where the normalized number of deliveries and normalized ppp are used as weights. Using these weights, the algorithm is run for values of 0.5 and 0. The cutoff and values remain the same. Fig. 3 shows the average distance per delivery for each iteration along with convex hulls of clusters formed for phase 1. Fig. 3f is a monotonically decreasing graph which means that the algorithm is minimizing the average distance during last-mile delivery.
| Centroid phase 1 | Phase 2 = 0.5 / m | Phase 2 = 0 / m |
|---|---|---|
| 0 | 1047 | 2692 |
| 1 | 6931 | 8072 |
| 2 | 12324 | 12743 |
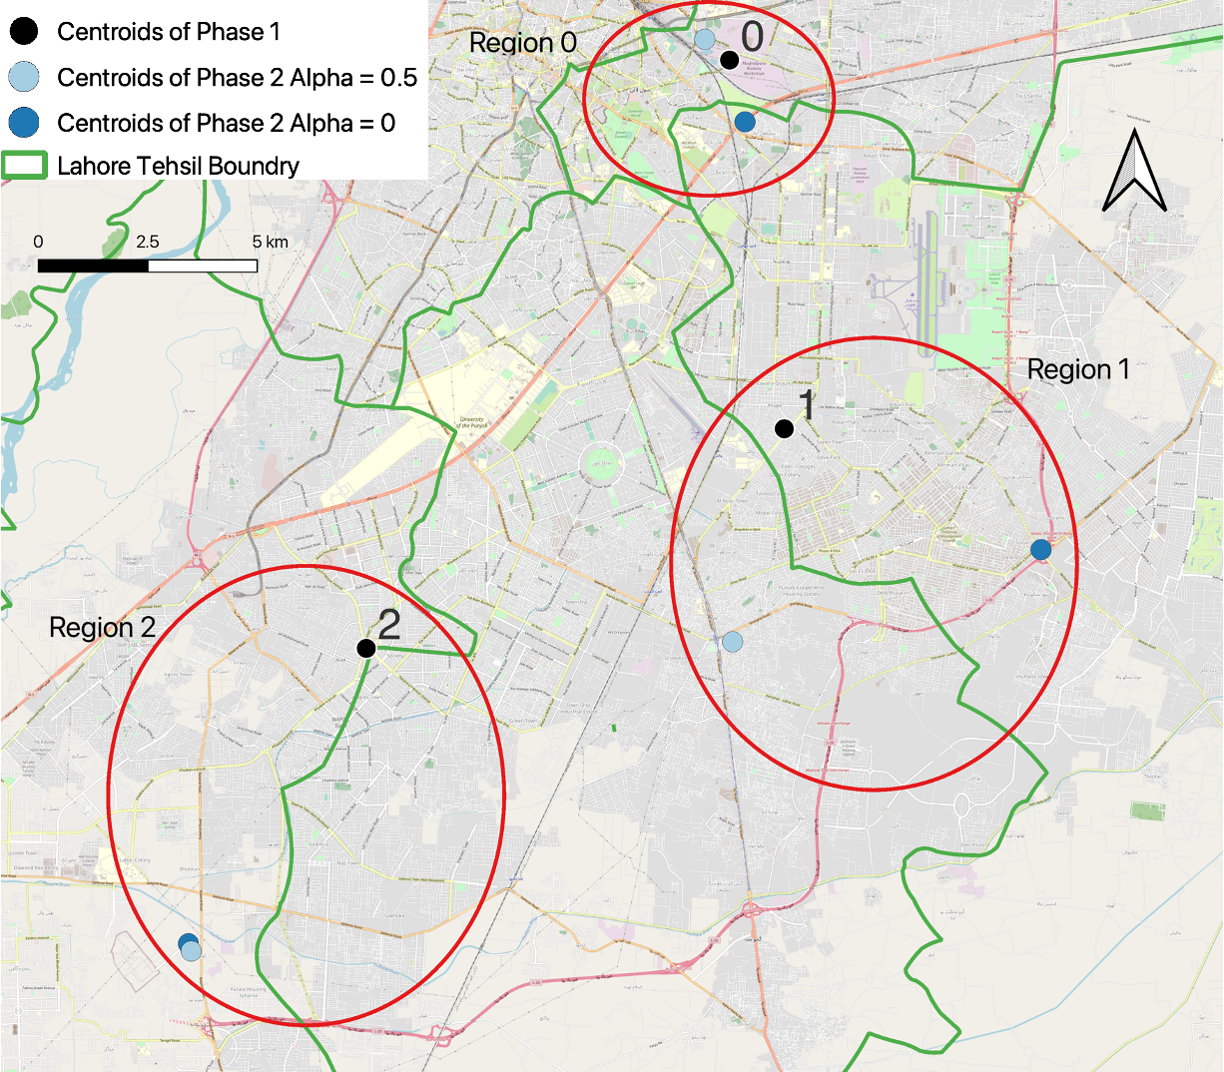
With the new clusters and LH in iteration 5, the average distance traveled per delivery decreases from 7801 meters to 6986 meters. The proposed framework reduces the average distance per delivery by 815 meters. The algorithm stops at iteration number 6 since the cutoff criterion is met. Fig. 4 shows all the centroids when using only the number of deliveries as a weight (phase-1) and incorporating population as a weight (phase-2). For regions 0 and 1, the centroids in phase 2 get closer to the centroid of phase 1 as the value of increases. For region 2, there is no significant change in the centroids for phase 2 as the value of increases. This shows that for regions 0 and 1, the “pull” of the number of deliveries as weight is significant as compared to region 2. This effect can also be seen in Table 1.
5 Conclusion
Previous research focuses on a non-road network-based distance matrix to solve the problem of LH optimization. However, this matrix does not provide a precise measure for distance calculations between points and could lead to misleading results. The most noteworthy attempt that has been made to offset this problem has been to multiply the distance with a constant factor to sort of emulate the road network distances. This study intends to bridge the gap in the literature by solving the problem of LH optimization using road network-based distance calculations. A hybrid approach has been developed that utilizes the K-Means algorithm to cluster delivery points. Based on these clusters, a P-Median approach is adopted to find the location of LH. Delivery data points, road network, and population data are used as input. Results show that optimized allocation of LH can significantly reduce the average distance traveled per delivery. The reduction in the average distance would lead to less fuel and time being spent on a particular journey. This would not only positively impact the financial and operational workings of logistics companies, but would also ensure a cleaner environment due to a reduction in greenhouse gases produced by rider vehicles. This work will inspire industry-standard geo-spatial solutions which would help alleviate operational concerns of the logistics industry in developing countries and provide a breathing space for the already degrading environment.
A possible area of further research is rider optimization: determining the optimal number of riders to be allocated to a region based on the number of deliveries in that region to reduce operations and management costs. Another area would be to replicate the approach in this study while determining the weights of each possible hub location using various factors. These factors could include CO2 emissions, created job opportunities, noise level, accident risk, and others [18].
6 Acknowledgement
We acknowledge the support provided by M&P logistics and NTRC for their active collaboration and for providing us with the necessary data sets used in this research work.
7 Compliance with Ethical Standards
Funding: This work was supported under the Grand Challenge Fund of the Higher Education Commission, Pakistan (Grant Number: GCF-521).
Ethical approval: This article does not contain any studies with human participants or animals performed by any of the authors.
References
- Agyabeng-Mensah et al. [2020] Y. Agyabeng-Mensah, E. Ahenkorah, E. Afum, E. Dacosta, and Z. Tian. Green warehousing, logistics optimization, social values and ethics and economic performance: the role of supply chain sustainability. The International Journal of Logistics Management, 31(3):549–574, 2020.
- Ahmed [2016] S.O. Ahmed. Cracking E-commerce 2.0: Whitepaper on taking 500,000 merchants online in Pakistan, 2016. Accessed November 15, 2022, https://karandaaz.com.pk/wp-content/uploads/2017/02/Cracking-E-commerce-2.0.pdf.
- Atayah et al. [2021] O.F. Atayah, M.M. Dhiaf, K. Najaf, and G.F. Frederico. Impact of covid-19 on financial performance of logistics firms: evidence from G-20 countries. Journal of Global Operations and Strategic Sourcing, 15(2):172–196, 2021.
- Black [2004] P. E. Black. Euclidean Distance. In Dictionary of Algorithms and Data Structures. 2004. Accessed December 15, 2022, https://www.nist.gov/dads/HTML/euclidndstnc.html.
- Bozkaya et al. [2010] B. Bozkaya, S. Yanik, and S. Balcisoy. A GIS-based optimization framework for competitive multi-facility location-routing problem. Networks and Spatial Economics, 10:297–320, 2010.
- Celik Turkoglu and Erol Genevois [2020] D. Celik Turkoglu and M. Erol Genevois. A comparative survey of service facility location problems. Annals of Operations Research, 292:399–468, 2020.
- Dijkstra [2022] E.W Dijkstra. A note on two problems in connexion with graphs. In Edsger Wybe Dijkstra: His Life, Work, and Legacy, pages 287–290. 2022.
- DispatchTrack [2021] DispatchTrack. Breaking Down Last Mile Delivery Costs, 2021. Accessed December 20, 2022, https://www.dispatchtrack.com/blog/last-mile-delivery-costs-breakdown.
- Esnaf and Küçükdeniz [2009] Ş. Esnaf and T. Küçükdeniz. A fuzzy clustering-based hybrid method for a multi-facility location problem. Journal of Intelligent Manufacturing, 20:259–265, 2009.
- Gocer and Sener [2022] F. Gocer and N. Sener. Spherical fuzzy extension of AHP-ARAS methods integrated with modified k-means clustering for logistics hub location problem. Expert Systems, 39(2):e12886, 2022.
- Higgins [2011] C. Higgins. An exploration of the freight village concept and its applicability to Ontario, 2011. Accessed February 1, 2023, https://macsphere.mcmaster.ca/bitstream/11375/18911/1/MITL_Freight_Villages_January.pdf.
- ITF [2019] ITF. International Transport Outlook, 2019. Accessed January 13, 2023, https://read.oecd-ilibrary.org/transport/itf-transport-outlook-2019_transp_outlook-en-2019-en#page1.
- Jin and Han [2010] X. Jin and J. Han. K-Means Clustering. In C. Sammut and G.I. Webb, editors, Encyclopedia of Machine Learning, pages 563–564. Boston, MA, 2010.
- Kuby et al. [2009] M. Kuby, L. Lines, R. Schultz, Z. Xie, J.G. Kim, and S. Lim. Optimization of hydrogen stations in Florida using the flow-refueling location model. International journal of hydrogen energy, 34(15):6045–6064, 2009.
- LCCI [2017] LCCI. The Size and Growth of the Economy of Lahore, 2017. Accessed November 15, 2022, https://lcci.com.pk/The_Size.pdf.
- Leblow [2021] S. Leblow. Worldwide ecommerce continues double-digit growth following pandemic push to online, 2021. Accessed January 12, 2023, https://www.emarketer.com/content/worldwide-ecommerce-continues-double-digit-growth-following-pandemic-push-online.
- Li et al. [2011] Y. Li, X. Liu, and Y. Chen. Selection of logistics center location using Axiomatic Fuzzy Set and TOPSIS methodology in logistics management. Expert systems with applications, 38(6):7901–7908, 2011.
- Mrabti et al. [2022] N. Mrabti, N. Hamani, Y. Boulaksil, M.A. Gargouri, and L. Delahoche. A multi-objective optimization model for the problems of sustainable collaborative hub location and cost sharing. Transportation Research Part E: Logistics and Transportation Review, 164:102821, 2022.
- Mulesa et al. [2021] O. Mulesa, O. Mitsa, T. Radivilova, I. Povkhan, and O Melnyk. Development of a Method to Find the Location of a Logistics Hub. In IT&I, pages 263–271, 2021.
- Önden et al. [2018] İ. Önden, A.Z. Acar, and F. Eldemir. Evaluation of the logistics center locations using a multi-criteria spatial approach. Transport, 33(2):322–334, 2018.
- OptimoRoute [2022] OptimoRoute. What Is Last Mile Delivery? Costs & How to Optimize, 2022. Accessed December 1, 2022, https://optimoroute.com/last-mile-delivery/.
- Özceylan et al. [2016] E. Özceylan, M. Erbaş, M. Tolon, M. Kabak, and T. Durğut. Evaluation of freight villages: A GIS-based multi-criteria decision analysis. Computers in Industry, 76:38–52, 2016.
- PBS [2017a] PBS. Table 25 - Selected Population Statistics of Urban Localities, 2017a. Accessed November 30, 2022, https://www.pbs.gov.pk/census-2017-district-wise/results/053.
- PBS [2017b] PBS. Table 26 - Selected Housing Characteristics of Urban Localities, 2017b. Accessed November 30, 2022, https://www.pbs.gov.pk/census-2017-district-wise/results/053.
- Qin and Gao [2017] Z. Qin and Y. Gao. Uncapacitated p-hub location problem with fixed costs and uncertain flows. Journal of Intelligent Manufacturing, 28(3):705–716, 2017.
- Shahparvari et al. [2020] S. Shahparvari, A. Nasirian, A. Mohammadi, S. Noori, and P. Chhetri. A GIS-LP integrated approach for the logistics hub location problem. Computers and Industrial Engineering, 146:106488, 2020.
- Sharma and Jalal [2017] A. Sharma and A. Jalal. Clustering based hybrid approach for facility location problem. Management Science Letters, 7(12):577–584, 2017.
- Shezad [2021] A. Shezad. Pakistan e-commerce platform Daraz aims to beef up as Amazon eyes market, 2021. Accessed January 20, 2023 https://www.reuters.com/business/retail-consumer/pakistan-e-commerce-platform-daraz-aims-beef-up-amazon-eyes-market-2021-11-25/.
- Ulutaş et al. [2020] A. Ulutaş, C.B. Karakuş, and A. Topal. Location selection for logistics center with fuzzy SWARA and CoCoSo methods. Journal of Intelligent & Fuzzy Systems, 38(4):4693–4709, 2020.
- Wen et al. [2016] R. Wen, W. Yan, and A.N. Zhang. Weighted clustering of spatial pattern for optimal logistics hub deployment. In IEEE International Conference on Big Data, pages 3792–3797, 2016.
- WorldPop [2018] WorldPop. The spatial distribution of population in 2020 Pakistan, 2018. Accessed November 15, 2022, https://hub.worldpop.org/geodata/summary?id=33136.
- Yang et al. [2020] J. Yang, Y. Han, Y. Wang, Jiang, Lv B., Z., and H. Song. Optimization of real-time traffic network assignment based on IoT data using DBN and clustering model in smart city. Future Generation Computer Systems, 108:976–986, 2020.
- Yang et al. [2016] K. Yang, L. Yang, and Z. Gao. Planning and optimization of intermodal hub-and-spoke network under mixed uncertainty. Transportation Research Part E: Logistics and Transportation Review, 95:248–266, 2016.
- Yang et al. [2022] Z. Yang, X. Chen, R. Pan, and Q. Yuan. Exploring location factors of logistics facilities from a spatiotemporal perspective: A case study from Shanghai. Journal of Transport Geography, 100:103318, 2022.