Deep Semi-supervised Anomaly Detection with Metapath-based Context Knowledge
Abstract
Graph anomaly detection has attracted considerable attention in recent years. This paper introduces a novel approach that leverages metapath-based semi-supervised learning, addressing the limitations of previous methods. We present a new framework, Metapath-based Semi-supervised Anomaly Detection (MSAD), incorporating GCN layers in both the encoder and decoder to efficiently propagate context information between abnormal and normal nodes. The design of metapath-based context information and a specifically crafted anomaly community enhance the process of learning differences in structures and attributes, both globally and locally. Through a comprehensive set of experiments conducted on seven real-world networks, this paper demonstrates the superiority of the MSAD method compared to state-of-the-art techniques. The promising results of this study pave the way for future investigations, focusing on the optimization and analysis of metapath patterns to further enhance the effectiveness of anomaly detection on attributed networks.
Index Terms:
Graph anomaly detection, graph neural network, node anomaly, attributed graphI INTRODUCTION
Graph anomaly detection aims to identify nodes that significantly deviate from the majority, and has drawn much attention from various domains [2, 15], such as fraud detection [45] and IoT network intrusion detection [47]. Early works [30, 19, 29] on graph anomaly detection have been largely dependent on domain knowledge and statistical methods. Recently, deep learning approaches have proved that they can effectively handle large-scale high-dimensional data and extract patterns from the data, thereby achieving satisfactory performance without the burden of handcrafting features [40, 18, 15].
Graph neural networks (GNNs), more recently, have been adopted to efficiently and intuitively detect anomalies from graphs due to the highly expressive capability via the message passing mechanism in learning graph representations (e.g., [8, 21]). The message passing mechanism in GNNs treats all messages equally without considering their relative importance or relevance [16]. Frequently, particular messages or neighboring nodes may carry more valuable information [39, 42]. Hence, efficiently capturing these important messages or nodes can be a key to an advancement for graph anomaly detection.
Existing methods are predominantly developed in an unsupervised manner for graph anomaly detection [30, 19, 29, 11, 8, 21, 22, 28, 23] since labeling anomalies are labor-intensive and require specific domain knowledge. Among the existing methods, most approaches are based on graph autoencoder (GAE) [8, 21, 29, 11, 28, 23], which measures the abnormality of each node with its reconstruction errors. Unfortunately, the detected anomalies may be found to be noises or data instances that we are not interested in and one of possible reasons can be the absence of the prior knowledge about anomalies looking for [10, 9, 37]. Without the prior knowledge or anomaly-aware information, it may be less effective to obtain the results that we exactly want from unsupervised approaches [37]. The above issue can be solved by using a few or limited number of labeled anomalies as the prior information to catch anomaly-informed features [24, 26]. In practice, it is often recommended to utilize as much labeled data as possible [1]. Furthermore, in real-world scenarios, we might be able to collect a small set of labeled anomalies [24, 10].
Semi-supervised learning properly resolves the issues from unsupervised learning by using few anomaly labeled data and sufficient unlabeled data to detect underlying anomalies [24]. Recently, a variety of research adopts semi-supervised learning for graph anomaly detection tasks, bringing on notable advances in anomaly-aware techniques [27, 10, 32, 37]. However, it is non-trivial to separate more valuable normality and abnormality representations with few labeled anomaly data and carefully designed GNN-based models [26]. Effectively separating anomalies from normal nodes remains a challenge for semi-supervised anomaly detection [24].
Various research [33, 10, 17] attempts to effectively distinguish the more important features and to leverage label information in semi-supervised manner, resulting in noticeable improvements for semi-supervised anomaly detection. However, there are still two significant limitations on these existing semi-supervised approaches. First, the existing methods are not fully efficient to leverage labeled information as a prior knowledge. Accordingly, the detection performance can be improved depending on the strategy of utilizing the label information. Second, the model of existing methods is not highly effective to identify more valuable information with the prior knowledge since it is not deep enough to exploit the important characteristics from graphs.
To alleviate aforementioned limitations, we propose metapath-based anomaly context information with attention mechanism as shown in Figure 1. The context information in a graph can be derived from various sources (e.g., node and edge attributes, graph structure, neighborhood information, and metapath) [6, 2, 5]. Metapath is an ordered sequence of types of nodes or edges on a network schema and it can provide higher-level structural context and can be used to extract meaningful information about relationships between nodes. Based on the normal and abnormal types of each node, well-designed metapaths, which enhance normality- and abnormality-specific information in the form of attention, are employed to obtain the context information of anomaly and normality. Therefore, we can capture the context information of specific paths and analyze the significance of such patterns on the attributed graphs. We explain the details about how to handle the context features.
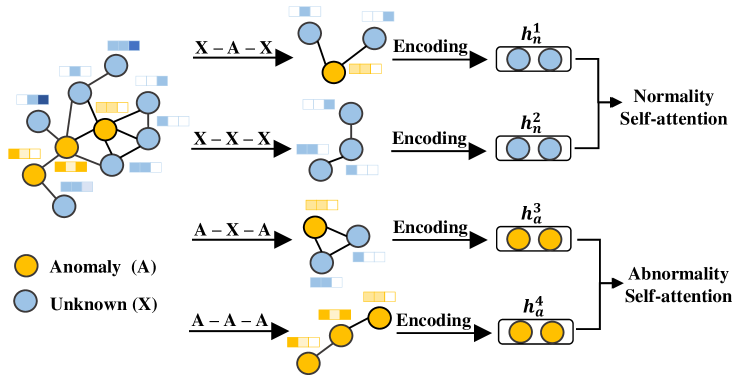
Metapath-based context information. As shown in Figure 1, there are multiple metapaths, which represent different relations between unknown (blue) and/or abnormal (orange) nodes, such as Unknown-Anomaly-Unknown (X-A-X), Unknown-Unknown-Unknown (X-X-X), Anomaly-Unknown-Anomaly (A-X-A), and Anomaly-Anomaly-Anomaly (A-A-A). Additionally, the unknown nodes are most certainly to be normal nodes since the number of normal nodes are much larger than the number of abnormal nodes. For this reason, it is reasonable that unknown nodes X can be considered as normal nodes. Hence, A-X-A and A-A-A represent two different relations between anomalous nodes. X-X-X and A-A-A express the patterns of normal and anomalous nodes respectively. X-A-X expresses the patterns of a few anomalies in majority of normal nodes, and A-X-A represents the patterns of a few normal nodes in majority of anomalies. Therefore, by incorporating multiple metapaths, features between normal nodes and anomalous nodes become more distinguishable and we can leverage specific context information to detect anomalies. In addition, attention mechanism allows a model to dynamically focus on relevant metapaths and adaptively weigh the importance of different metapaths based on its relevance, enabling more context-aware anomaly detection as described in Figure 1. This combination of metapaths and attention mechanism can lead to more accurate and effective detection performance compared to the previous GNN-based approaches.
In summary, our main contributions are listed below:
-
•
To the best of our knowledge, the proposed method is the first attempt to adopt the metapath-based context information and attention mechanism for graph anomaly detection in semi-supervised manner. The combination of metapath-based context information and attention mechanism enables normal and abnormal representations to be more distinguishable and it resolves the anomaly-aware issue in semi-supervised anomaly detection.
-
•
We augment anomaly data by iterative sampling strategy of metapaths and this strategy alleviates class imbalance problem of graph anomaly detection.
-
•
We conduct extensive experiments on seven real-world datasets to show the performance of our framework. The results demonstrate the superiority of our method by comparing with the state-of-the-art approaches.
| Methods |
|
|
|
|
|
|
|||||||||||||
|---|---|---|---|---|---|---|---|---|---|---|---|---|---|---|---|---|---|---|---|
| Unsupervised Methods | DOMINANT [8] | ||||||||||||||||||
| SpecAE [21] | |||||||||||||||||||
| HCM [14] | |||||||||||||||||||
| ComGA [23] | |||||||||||||||||||
| Semi-supervised Methods | Semi-GNN [17] | ||||||||||||||||||
| GDN [10] | |||||||||||||||||||
| Ours |
II RELATED WORK
In this section, we present methods for graph anomaly detection, ranging from traditional methods to state-of-the-art GNN-based approaches, in both unsupervised and semi-supervised settings. Additionally, the summary of state-of-the-art methods is listed in Table I.
Traditional Methods. The research area of graph anomaly detection has been attracting significant attention in recent times. The earlier methods [4, 43] consider only the structure or attribute to detect anomalous nodes in a graph. Afterward, CODA [12] presents a probabilistic model to detect anomalous nodes on communities. AMEN [30] builds the ego-graphs with each node in order to detect anomalous communities on attributed graphs. Additionally, other traditional approaches [25, 31, 35, 34] attempt to detect anomalies by using attribute information. Also, some research [19, 29] employs residual analysis techniques and ANOMALOUS [29] combines the residual analysis and CUR decomposition in order to detect anomalous nodes.
Unsupervised GNN-based Methods. With the advent of GNNs [13, 16, 39], various GNN-based approaches for graph anomaly detection have been presented with skyrocketing growth of GNN techniques. DOMINANT [8] firstly adopts GCN-based GAE, which encodes structure and attribute information and then decodes the structure and attribute features respectively for anomalous node detection. CoLA [22] proposes contrastive self-supervised learning for anomalous node detection by sampling local subgraphs and comparing the subgraphs with target nodes. However, these above methods may not effectively work on real-world networks since the patterns of anomalies are much more irregular. SpecAE [21] attempts to detect global and community anomalies by using Laplacian sharpening technique to alleviate over-smoothing problem of convolution mechanism. HCM [14] considers both global and local contextual anomalies on the basis of hop count-based subgraphs as self-supervised manner. ComGA [23] captures global, local, and structure anomalies by utilizing structure information of community structure, attribute and structure features of the whole graph.
Semi-supervised GNN-based Methods. Several methods using graphs in semi-supervised way have been presented and these methods propagate labelled information to unlabelled nodes [36, 46, 48]. Although GNN-based node classification methods in a semi-supervised way have achieved huge success [13, 16, 41, 44], these methods do not consider the class imbalance issue in the graph anomaly detection task. There are only a few GNN-based approaches detecting anomalies in semi-supervised manner. Kumagai et al. present a simple GCN-based embedding method in semi-supervised manner for graph anomaly detection [17]. Meta-GDN [10] introduce Graph Deviation Networks (GDN), which leverages a few labels to deviate abnormal nodes from normal nodes, with cross-network meta-learning algorithm. In this paper, we propose GNN-based anomaly detection method in semi-supervised manner with metapath-based context information.
III PROBLEM STATEMENT
In this section, we formally define key concepts, including attributed graph, metapath, and anomaly community, and present the problem statement.
Definition 1.
Attributed Graph. An attributed graph can be denoted as where is a set of nodes with , is a set of edges with , and contains attributes associated with nodes. The -th row of is is associated with node , where is the attribute of on the -th attribute .
Definition 2.
Metapath. A metapath is a path in the form of , which defines a composite relation between types of nodes and , where denotes the composition operator on relations.
Definition 3.
Metapath-based Anomaly Community. A metapath-based anomaly community is a set of sampled metapath on given metapath schema , where and . Types of an anomaly community are either anomaly type or unknown type . The anomaly community is recursively sampled with random walk sampling strategy.
As graph anomaly detection is commonly formulated as a ranking problem [2], we formally define the metapath-based graph anomaly detection problem as follows:
Problem 1.
Metapath-based Anomaly Detection. Given an attributed graph with a set of nodes , the task is to score each node with by preserving the metapath-based context information. The anomaly score is the degree of abnormality of node . Based on the score, anomalous nodes can be detected in accordance with the ranking.
IV THE PROPOSED APPROACH
Here, we present three modules of our framework: (i) Community Generation Module, (ii) Graph Embedding Module, and (iii) Anomaly Detection Module, as in Figure 2.
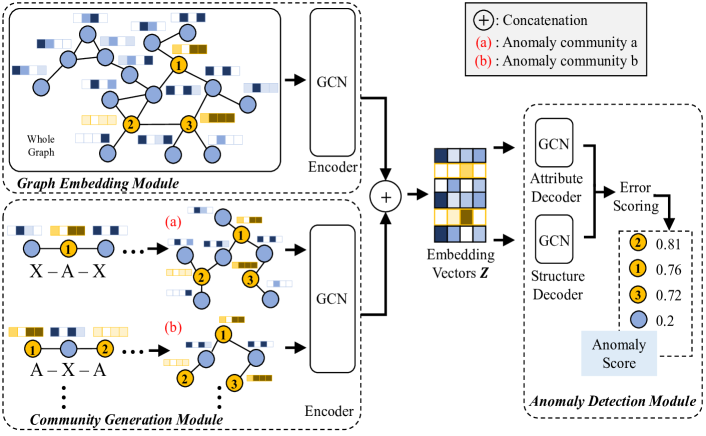
IV-A Community Generation Module
In this module, the anomaly community is generated on the basis of node types of A and X with metapath schema. Afterward, the community is encoded by multiple GCN layers to extract important information, such as A-X relations, structure, and attribute features in the community.
Specifically, some of labelled anomaly nodes are set to type A and the others of the remaining nodes are set to type X since it is uncertain which node is either anomalous or not. On the basis of metapath schema, which contains at least one A type, each node is randomly sampled by random walk sampling strategy. The sampled nodes will be an anomaly community, which represents normal-abnormal patterns as well as structure, attribute information in the community as defined in Definition 3. For example, given a metapath schema, X-A-X, every matching pattern is sampled from whole graph. If there are many links between nodes, then a random walker will randomly pick one node among linked nodes with probability . The randomwalk-based sampling can be described as follows:
| (1) |
where is the adjacency matrix between nodes in type and nodes in type , and is the degree matrix with . A random walker samples each type of node on the basis of the probability following the number of sampling round . For example, if a random walker starts sampling from a node in type , the next node will be in type with the probability .
Note that the proposed anomaly community guarantees that there is at least one anomaly in each community and it sufficiently represents anomalous patterns between normal and abnormal. These information in community will be efficiently encoded by multi-stacked GCN layers and will enhance anomaly detection performance by making normal and abnormal more distinguishable. Each GCN layer can be shown as follows:
| (2) |
where is the subgraph adjacency with self-loop, is the degree matrix of local subgraph, is the weight matrix of the -th layer, and is the activation function, such as ReLU and Sigmoid.
IV-B Graph Embedding Module
In this module, GCN-based encoder, which is the same as the encoder in Community Generation Module, embeds structure and attribute information of the attributed graph. The multiple GCN layers in the encoder extract global node attribute and structure information.
Specifically, the GCN layers capture non-linearity of network and complex relations on attributed networks as described in Equation 2. The embedding representation is concatenated with representation of embedded anomaly community and it composes embedding vector , which consists of X-A linking patterns and information of node attribute and structure in anomaly community and whole graph as described in Equation 3.
| (3) |
Consequently, the embedding vector represents global, local, and X-A connecting features as well as attribute and structure characteristics.
IV-C Anomaly Detection Module
In this module, two GCN-based decoders reconstruct structures and attributes embedding vector respectively. Subsequently, anomalous nodes are detected on the basis of anomaly scores. We explain each decoder and scoring function in below section.
Structure Decoder. In this section, we explain how the structure decoder reconstructs the original graph structure with latent representations . The reconstruction error of structure is described as , where denotes estimated adjacency matrix. Additionally, if a node shows low probability of being anomalous, the structure decoder well reconstructs topological information of the graph. On the other hand, if the decoder properly reconstructs the topological information, then its topology does not follow majority structures in a graph. Thus, expresses that node has a higher anomaly probability on the perspective of network structure. We use structure decoder with the latent representation as input to reconstruct the graph structure:
| (4) |
Specifically, given the latent representations as input, the decoder predicts whether there is a link between each pair of two nodes as follows:
| (5) |
Attribute Decoder. In this section, we describe how this attribute decoder reconstructs the original node attributes of the graph with . The reconstruction error of attribute is expressed as , where denotes predicted attributes. The attribute decoder employs GCN layers to predict the original attributes as follows:
| (6) |
| Datasets | |||||
|---|---|---|---|---|---|
| Ground-truth | Amazon | 1,418 | 3,695 | 28 | 28 |
| Injected Anomaly | Cora | 2,708 | 5,429 | 1,433 | 150 |
| Citeseer | 3,327 | 4,732 | 3,703 | 150 | |
| Pubmed | 19,717 | 44,338 | 500 | 600 | |
| BlogCatalog | 5,196 | 171,742 | 8,189 | 300 | |
| Flickr | 7,575 | 239,738 | 12,074 | 450 | |
| ACM | 16,484 | 71,980 | 8,337 | 600 |
Anomaly Detection. In order to learn the structure and attribute reconstruction errors, the objective function can be defined as:
| (7) |
where is a balance parameter, which controls importance between structure and attribute reconstruction errors. The joint reconstruction errors are used to measure anomalous nodes by minimizing the objective function above. The anomaly score of each node is described as follows:
| (8) |
| Methods | Amazon | Cora | Citeseer | Pubmed | BlogCatalog | Flickr | ACM | |
|---|---|---|---|---|---|---|---|---|
| Unsupervised Methods | AMEN [30] | 47.00 | 47.00 | 62.66 | 61.54 | 77.13 | 65.73 | 56.26 |
| Radar [19] | 58.00 | 65.87 | 67.09 | 62.33 | 74.01 | 73.99 | 72.47 | |
| ANOMALOUS [29] | 60.20 | 57.70 | 63.07 | 73.16 | 72.37 | 74.34 | 70.38 | |
| DOMINANT [8] | 62.50 | 81.55 | 82.51 | 80.81 | 74.68 | 74.42 | 76.01 | |
| AnomalyDAE [11] | 53.61 | 76.27 | 72.71 | 81.03 | 78.34 | 75.08 | 75.13 | |
| ResGCN [28] | 71.00 | 84.79 | 76.47 | 80.79 | 78.50 | 78.00 | 76.80 | |
| CoLA [22] | 47.26 | 87.79 | 89.68 | 95.12 | 78.54 | 75.13 | 82.37 | |
| ComGA [23] | 63.07 | 88.40 | 91.67 | 92.20 | 81.40 | 79.90 | 84.96 | |
| Semi-supervised Methods | DeepSAD [33] | 56.10 | 56.70 | 54.60 | 51.10 | 54.80 | 53.90 | 53.00 |
| Semi-GNN [17] | 66.95 | 67.65 | 81.74 | 66.30 | 84.42 | 73.39 | 84.90 | |
| GDN [10] | 68.15 | 83.17 | 85.48 | 84.72 | 70.90 | 71.03 | 78.12 | |
| MSAD (ours) | 65.01 | 92.29 | 94.69 | 92.52 | 81.48 | 79.96 | 89.87 |
V EXPERIMENTS
In this section, various experiments on seven real-world networks were conducted to demonstrate the superiority of the proposed MSAD framework.
Datasets. Among the seven datasets, only Amazon dataset provides ground-truth label and the other six datasets provide injected anomalies. Previous methods for graph anomaly detection mostly utilized the injected anomaly networks for their experiments [7, 8, 11, 21, 22] since the ground-truth information is rare in real-world datasets [14, 28, 29]. To demonstrate the performance of MSAD, we conduct experiments on one ground-truth network and six injected anomaly networks [8, 22, 10]. The statistics of these networks are listed in Table II, and more details are given as follows:
- •
-
•
Injected anomaly graphs [7, 8, 11, 21, 22, 10]: ACM, Cora, Citeseer, Pubmed, BlogCatalog, and Flickr are the six attributed networks with the injected anomalies. The first four datasets (ACM, Cora, Citeseer, and Pubmed) are widely used citation networks. Each node represents paper, and each edge expresses citation relation with other papers, respectively. The title and abstract information of papers are used as attributes of the nodes. BlogCatalog and Flickr are the two attributed networks and common social networks. Each node denotes the website user, and each edge represents the relations between users, respectively. User-related tag information, such as posting blogs or sharing photos is employed as node attributes.
Baselines. We introduce eight famous unsupervised and three semi-supervised methods for graph anomaly detection to compare with our proposed framework MSAD.
-
•
AMEN [30] extracts both attribute and structure features to detect anomalies in ego-network by comparing correlations of nodes.
-
•
Radar [19] analyzes residuals and coherence of network information for graph anomaly detection.
-
•
ANOMALOUS [29] uses CUR decomposition and residual to detect node anomalies.
-
•
DOMINANT [8] is based on GAE to extract node representation for graph anomaly detection.
-
•
AnomalyDAE [11] extracts structure and attribute features by using two autoencoders.
-
•
ResGCN [28] adopts attention mechanism in residuals to detect anomalous node with GCN.
-
•
CoLA [22] is a GNN-based framework using contrastive learning to learn relations between target nodes and subgraphs.
-
•
HCM [14] is a novel self-supervised learning method with hop-based sub-structures of graphs.
-
•
DeepSAD [33] is a deep learning-based method for semi-supervised anomaly detection.
-
•
GDN [10] employs a small set of anomaly labels to discover significant deviations between abnormal and normal nodes with cross-network meta-learning.
-
•
Semi-GNN [17] embeds nodes on hyper-sphere space with GCN layer.
-
•
ComGA [23] uses community-specific representations with GCN layers to consider local anomalies.
Parameter Settings. In the this experiments, we use 4 GCN layers for each encoder and decoder. The dimension of each GCN layer in both encoder and decoder is 1024-512-128-64. We use random search strategy [3, 20], which optimizes model by randomly selecting and testing the hyper-parameters within specific ranges in order to obtain the optimized learning rate and balance parameter . Additionally, we follow experimental settings reported in corresponding papers of the other baselines.
Anomaly Detection Results. In this section, anomaly detection performance is evaluated with our method MSAD and other eight baseline frameworks. For the evaluation metric, we employ AUC values, which estimates the probability that a randomly selected anomalous node has higher ranking than a normal node. The anomaly detection results are shown in Table III, and on the basis of the performance results, we present the following observations:
-
•
Among the seven datasets, the proposed MSAD shows the remarkable performance on five datasets, except for Amazon and Pubmed. Specifically, the best result of our method in comparison with the baseline methods among the five dataset is 4.91% on ACM dataset. For the result on Amazon and Pubmed dataset, our MSAD achieves comparable performance. On the other hand, MSAD works less efficiently in capturing representative features from networks, which has relatively small number of anomaly or attribute, such as Amazon and Pubmed dataset, since the context information is derived from attribute features as well as structure information.
-
•
Comparing with the shallow deep learning-based methods such as AMEN, Radar, and ANOMALOUS and previous GNN-based methods such as DOMINANT, AnomalyDAE, and ResGCN, our MSAD outperforms these previous approaches. The anomaly communities make anomalous node characteristics more distinct, and stacked GCN layers in the encoder and decoder efficiently extract node features in detecting anomalies.
-
•
When comparing with state-of-the-art semi-supervised methods, our MSAD achieves notable performance on six datasets, except for Amazon. The main reason is that MSAD efficiently utilizes various information (e.g., context, attribute, and structure information both globally and locally) and the prior knowledge with attention mechanism.
Parameter Study. In this section, we conduct extended experiments to find out performance changes according to the number of metapath sampling and the length of metapath.
-
•
Effect of the number of sampling rounds : We conduct more experiments in order to observe relations between the performance and the number of sampling and the values of are set to 1, 3, and 5. The performance for each value is shown in Figure 4. On most datasets, when value of is 5, the results show better performance when it comes to max and average AUC values. The reason is that training data is augmented following the number of sampling round and it helps using more patterns between abnormal and normal nodes in training. Even though the sampling round affects performance of proposed method, the effect is somehow limited and it means that the performance of MSAD is guaranteed with small number of anomaly communities.
-
•
Effect of metapath length : In this experiment, we further investigate effect of metapath length , which is set to 3, 4, and 5. The performance change for each is depicted in Figure 3. We discover a tendency that the smallest anomaly community (length 3) achieves better performance on graphs, which have smaller number of nodes, while the biggest community (length 5) reports higher AUC values on graphs, which have larger number of nodes. The possible reasons is that the small community on the large graphs may not contain enough patterns between anomaly and normal. On the other hand, the large community on small graphs consists of much noise information since the community and graph become alike. However, we observe that performance is not quite sensitive to metapath length .
Ablation Study. In this experiment, we explore sensitivity of our method following the ratio of anomalies on five datasets. We conduct this experiments on different number of anomalies, such as 1%, 3%, 5%, and 10% of all labeled anomalies. As shown in Figure 5, performance tends to be higher, when the number of anomaly is larger on citation networks: ACM, Cora, Citeseer, and Pubmed. On the other hand, the social networks, BlogCatalog and Flickr, report decreasing performance as the number of anomaly is bigger. These two social networks are much denser than the citation networks. Since each abnormal node is intricately connected with normal node on the social networks, more information can be extracted from relatively smaller number of anomalies. Therefore, employing more anomalies become noises on social networks.
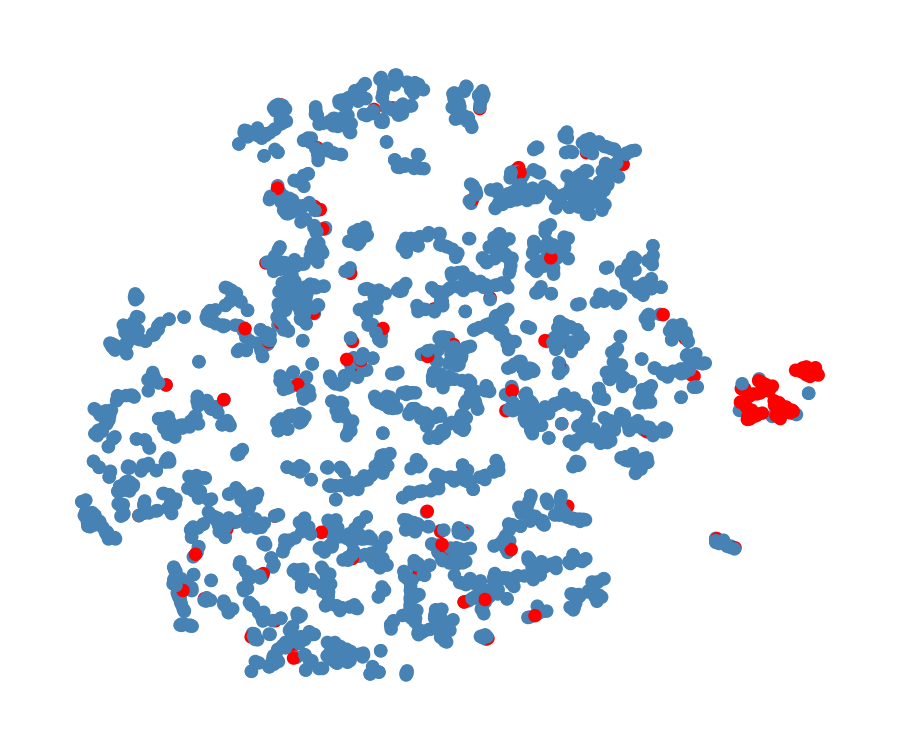
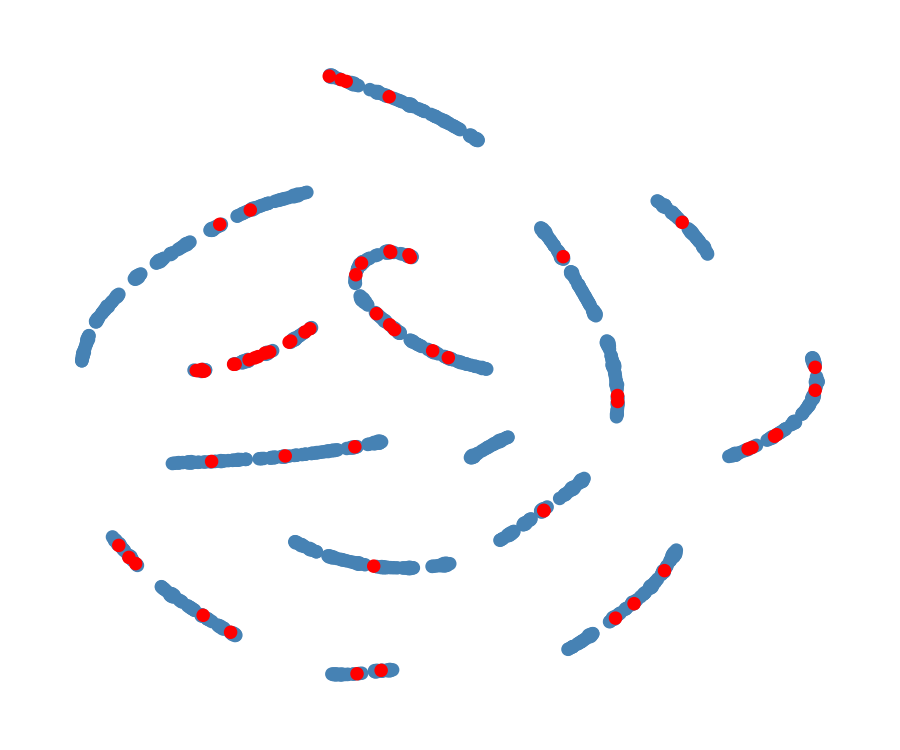
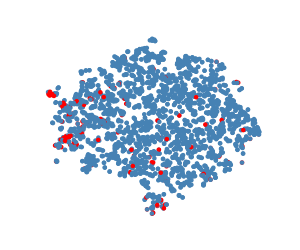
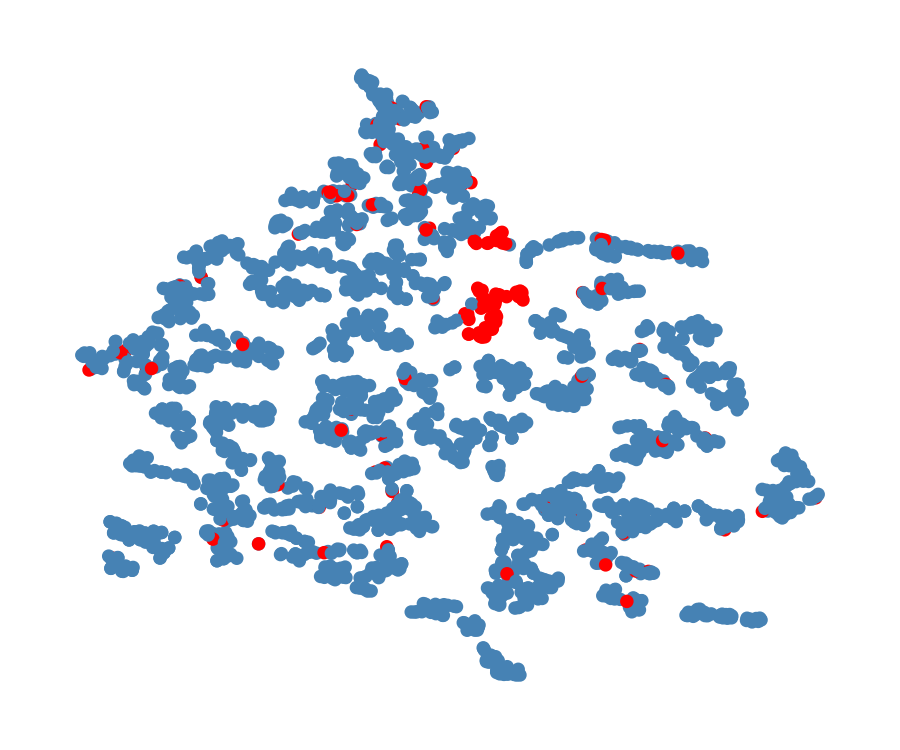
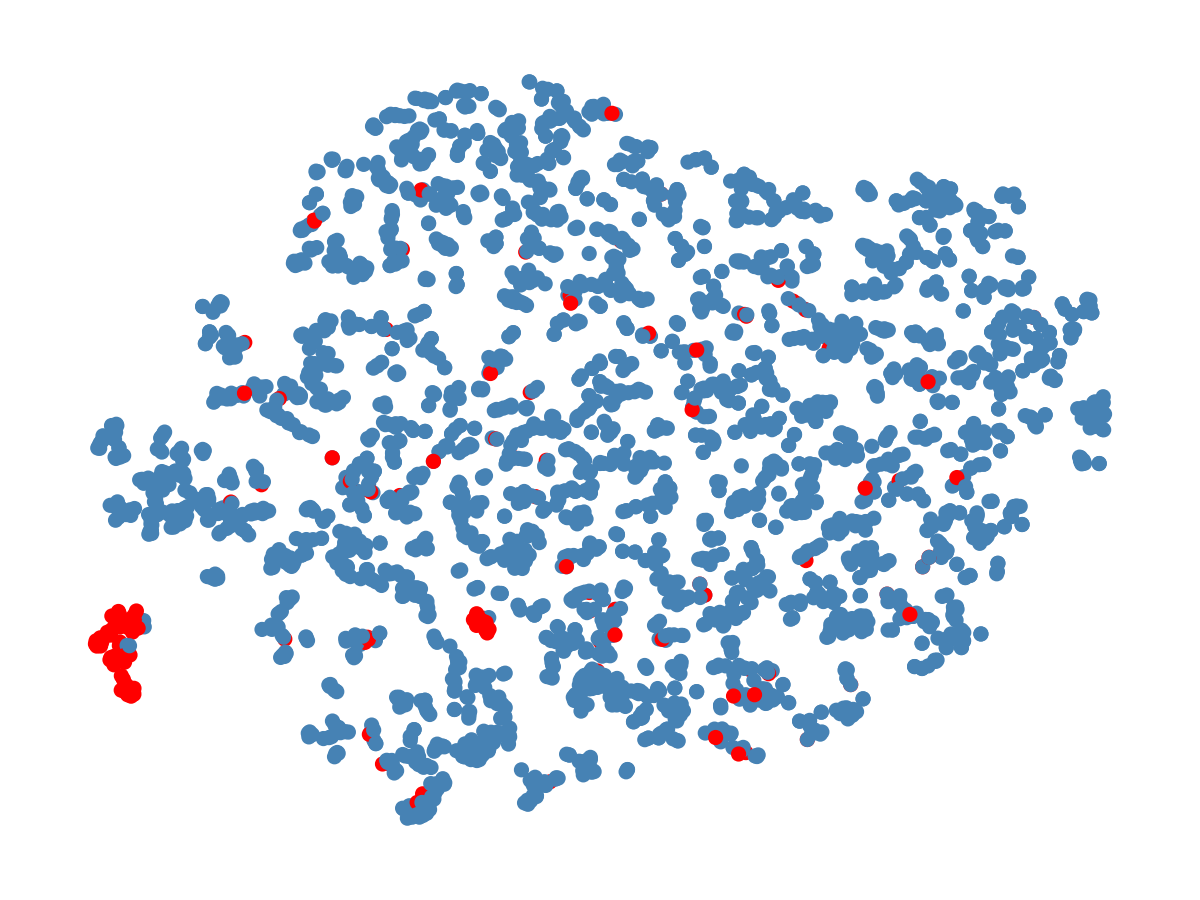
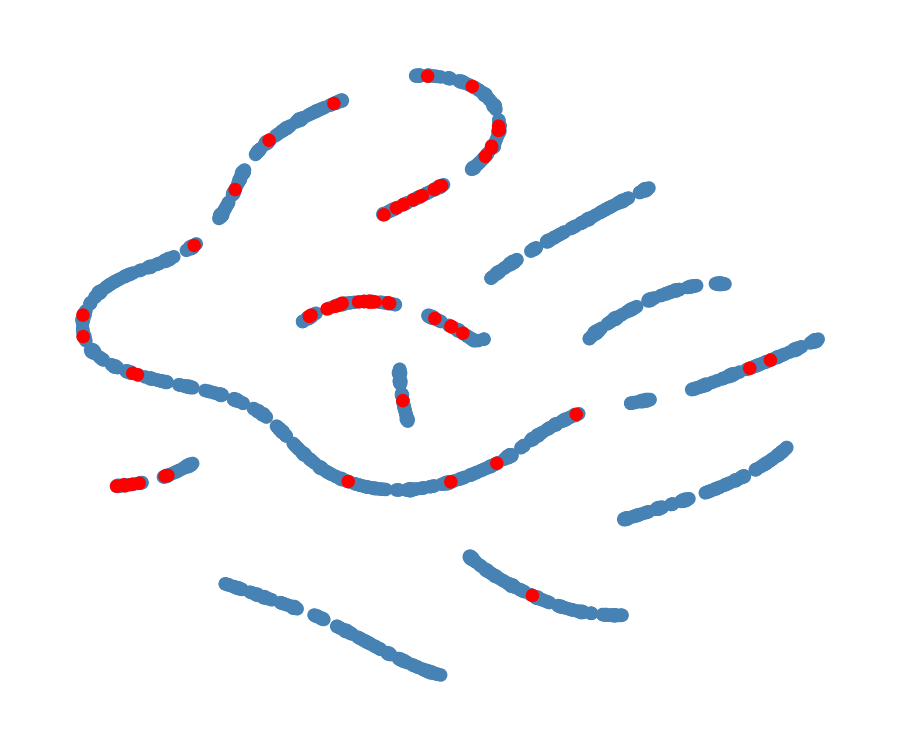
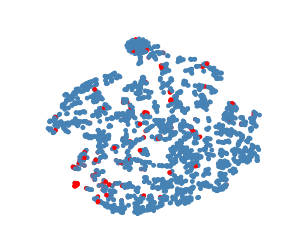
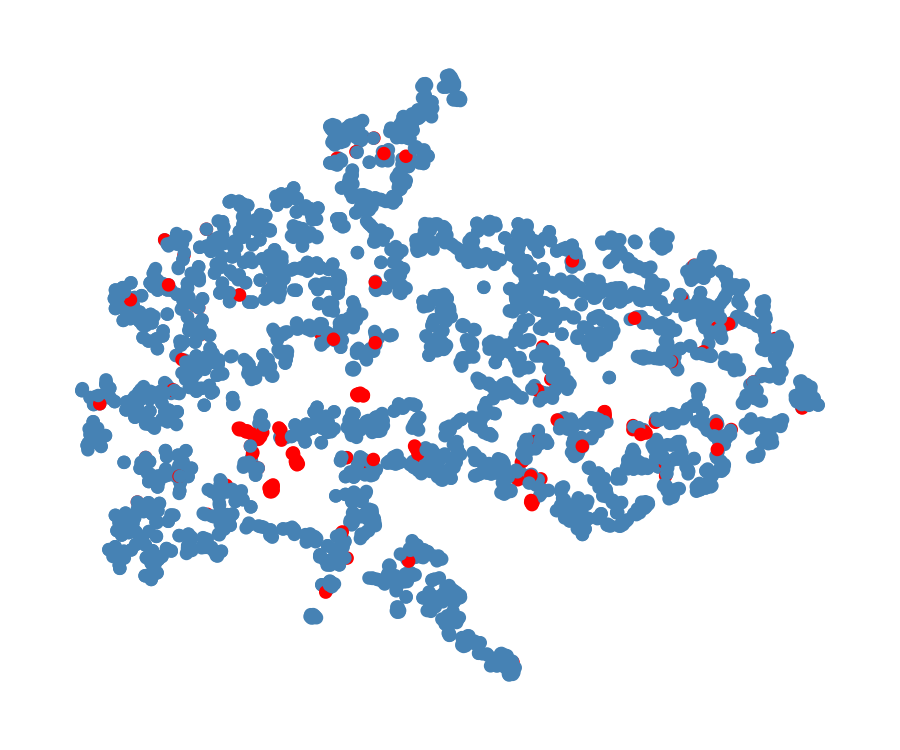
Visualization Analysis. In this section, we present visualization analysis about learned node representations in order to evaluate our method. For visualization, we employ t-distributed stochastic neighbor embeddings [38] (t-SNE) to reduce the dimensions of the node embeddings from 128 to 2. Figure 6 and Figure 7 show the visualization of node embeddings learned by MSAD, GDN, SemiGNN, and ComGA on Cora and Citeseer, respectively. Our method, MSAD, is capable of discriminating the abnormal and normal node representations efficiently. GDN and SemiGNN are not able to effectively separate the abnormal and normal node representations on both Cora and Citeseer since its model is not deep enough to exploit the valuable features from the networks. ComGA separates the normal and abnormal node embeddings better than other methods especially on Citeseer. Consequently, among the four methods, our method, MSAD, shows the most appropriate node representations for graph anomaly detection.
VI CONCLUSION
In this paper, we introduce metapath-based semi-supervised learning to detect node anomalies on attributed networks. We also present a novel metapath-based semi-supervised anomaly detection framework, MSAD, which uses GCN layers in both encoder and decoder. Specifically, we design metapath-based context information to propagate characteristics between abnormal and normal nodes. Moreover, the designed anomaly community augments data via the number of sampling rounds. Our model efficiently captures the context information from anomaly communities and whole graphs and effectively learns distinct differences in structures and attributes both globally and locally. This advancement overcomes the limitations observed in previous semi-supervised methods. Experiments conducted on seven real-world networks prove the novelty of our method over the state-of-the-art techniques. In future work, we aim to further our experiments by analyzing metapath patterns, enhancing the effectiveness of the method.
References
- [1] Charu C Aggarwal and Charu C Aggarwal. An introduction to outlier analysis. Springer, 2017.
- [2] Leman Akoglu, Hanghang Tong, and Danai Koutra. Graph-based anomaly detection and description: A survey. Data Mining and Knowledge Discovery, 29(3):626–688, 2015.
- [3] James Bergstra and Yoshua Bengio. Random search for hyper-parameter optimization. Journal of Machine Learning Research, 13(10):281–305, 2012.
- [4] Markus M Breunig, Hans-Peter Kriegel, Raymond T Ng, and Jörg Sander. LOF: Identifying density-based local outliers. In SIGMOD, pages 93–104, 2000.
- [5] Raghavendra Chalapathy and Sanjay Chawla. Deep learning for anomaly detection: A survey. arXiv preprint arXiv:1901.03407, 2019.
- [6] Varun Chandola, Arindam Banerjee, and Vipin Kumar. Anomaly detection: A survey. ACM computing surveys (CSUR), 41(3):1–58, 2009.
- [7] Kaize Ding, Jundong Li, Nitin Agarwal, and Huan Liu. Inductive anomaly detection on attributed networks. In IJCAI, pages 1288–1294, 2020.
- [8] Kaize Ding, Jundong Li, Rohit Bhanushali, and Huan Liu. Deep anomaly detection on attributed networks. In SDM, pages 594–602, 2019.
- [9] Kaize Ding, Jianling Wang, James Caverlee, and Huan Liu. Meta propagation networks for graph few-shot semi-supervised learning. In AAAI, volume 36, pages 6524–6531, 2022.
- [10] Kaize Ding, Qinghai Zhou, Hanghang Tong, and Huan Liu. Few-shot network anomaly detection via cross-network meta-learning. In WWW, pages 2448–2456, 2021.
- [11] Haoyi Fan, Fengbin Zhang, and Zuoyong Li. AnomalyDAE: Dual autoencoder for anomaly detection on attributed networks. In ICASSP, pages 5685–5689, 2020.
- [12] Jing Gao, Feng Liang, Wei Fan, Chi Wang, Yizhou Sun, and Jiawei Han. On community outliers and their efficient detection in information networks. In KDD, pages 813–822, 2010.
- [13] Will Hamilton, Zhitao Ying, and Jure Leskovec. Inductive representation learning on large graphs. In NIPS, pages 1024–1034, 2017.
- [14] Tianjin Huang, Yulong Pei, Vlado Menkovski, and Mykola Pechenizkiy. Hop-count based self-supervised anomaly detection on attributed networks. In ECML/PKDD, pages 225–241, 2022.
- [15] Hwan Kim, Byung Suk Lee, Won-Yong Shin, and Sungsu Lim. Graph anomaly detection with graph neural networks: Current status and challenges. IEEE Access, 10:111820–111829, 2022.
- [16] Thomas N Kipf and Max Welling. Semi-supervised classification with graph convolutional networks. In ICLR, 2017.
- [17] Atsutoshi Kumagai, Tomoharu Iwata, and Yasuhiro Fujiwara. Semi-supervised anomaly detection on attributed graphs. In IJCNN, pages 1–8, 2021.
- [18] Martin Längkvist, Lars Karlsson, and Amy Loutfi. A review of unsupervised feature learning and deep learning for time-series modeling. Pattern Recognition Letters, 42:11–24, 2014.
- [19] Jundong Li, Harsh Dani, Xia Hu, and Huan Liu. Radar: Residual analysis for anomaly detection in attributed networks. In IJCAI, pages 2152–2158, 2017.
- [20] Liam Li and Ameet Talwalkar. Random search and reproducibility for neural architecture search. In UAI, pages 367–377, 2019.
- [21] Yuening Li, Xiao Huang, Jundong Li, Mengnan Du, and Na Zou. SpecAE: Spectral autoencoder for anomaly detection in attributed networks. In CIKM, pages 2233–2236, 2019.
- [22] Yixin Liu, Zhao Li, Shirui Pan, Chen Gong, Chuan Zhou, and George Karypis. Anomaly detection on attributed networks via contrastive self-supervised learning. IEEE Transactions on Neural Networks and Learning Systems, 33(6):2378–2392, 2022.
- [23] Xuexiong Luo, Jia Wu, Amin Beheshti, Jian Yang, Xiankun Zhang, Yuan Wang, and Shan Xue. ComGA: Community-aware attributed graph anomaly detection. In WSDM, pages 657–665, 2022.
- [24] Xiaoxiao Ma, Jia Wu, Shan Xue, Jian Yang, Chuan Zhou, Quan Z Sheng, Hui Xiong, and Leman Akoglu. A comprehensive survey on graph anomaly detection with deep learning. IEEE Transactions on Knowledge and Data Engineering, Early Access, 2021.
- [25] Emmanuel Müller, Patricia Iglesias Sánchez, Yvonne Mülle, and Klemens Böhm. Ranking outlier nodes in subspaces of attributed graphs. In ICDE Workshop (Graph Data Management), pages 216–222, 2013.
- [26] Guansong Pang, Chunhua Shen, Longbing Cao, and Anton Van Den Hengel. Deep learning for anomaly detection: A review. ACM Computing Surveys, 54(2):38:1–38:38, 2021.
- [27] Guansong Pang, Chunhua Shen, and Anton van den Hengel. Deep anomaly detection with deviation networks. In KDD, pages 353–362, 2019.
- [28] Yulong Pei, Tianjin Huang, Werner van Ipenburg, and Mykola Pechenizkiy. ResGCN: Attention-based deep residual modeling for anomaly detection on attributed networks. Machine Learning, 111(2):519–541, 2022.
- [29] Zhen Peng, Minnan Luo, Jundong Li, Huan Liu, and Qinghua Zheng. ANOMALOUS: A joint modeling approach for anomaly detection on attributed networks. In IJCAI, pages 3513–3519, 2018.
- [30] Bryan Perozzi and Leman Akoglu. Scalable anomaly ranking of attributed neighborhoods. In SDM, pages 207–215, 2016.
- [31] Bryan Perozzi, Leman Akoglu, Patricia Iglesias Sánchez, and Emmanuel Müller. Focused clustering and outlier detection in large attributed graphs. In KDD, pages 1346–1355, 2014.
- [32] Yiyue Qian, Yiming Zhang, Yanfang Ye, Chuxu Zhang, et al. Distilling meta knowledge on heterogeneous graph for illicit drug trafficker detection on social media. Advances in Neural Information Processing Systems, 34:26911–26923, 2021.
- [33] Lukas Ruff, Robert A Vandermeulen, Nico Görnitz, Alexander Binder, Emmanuel Müller, Klaus-Robert Müller, and Marius Kloft. Deep semi-supervised anomaly detection. In ICLR, 2020.
- [34] Patricia Iglesias Sánchez, Emmanuel Müller, Oretta Irmler, and Klemens Böhm. Local context selection for outlier ranking in graphs with multiple numeric node attributes. In SSDBM, pages 16:1–16:12, 2014.
- [35] Patricia Iglesias Sánchez, Emmanuel Müller, Fabian Laforet, Fabian Keller, and Klemens Böhm. Statistical selection of congruent subspaces for mining attributed graphs. In ICDM, pages 647–656, 2013.
- [36] Prithviraj Sen, Galileo Namata, Mustafa Bilgic, Lise Getoor, Brian Galligher, and Tina Eliassi-Rad. Collective classification in network data. AI Magazine, 29(3):93–106, 2008.
- [37] Sheng Tian, Jihai Dong, Jintang Li, Wenlong Zhao, Xiaolong Xu, Bowen Song, Changhua Meng, Tianyi Zhang, Liang Chen, et al. Sad: Semi-supervised anomaly detection on dynamic graphs. In IJCAI, 2023.
- [38] Laurens Van der Maaten and Geoffrey Hinton. Visualizing data using t-sne. Journal of machine learning research, 9(11), 2008.
- [39] Petar Veličković, Guillem Cucurull, Arantxa Casanova, Adriana Romero, Pietro Lio, and Yoshua Bengio. Graph attention networks. In ICLR, 2018.
- [40] Jindong Wang, Yiqiang Chen, Shuji Hao, Xiaohui Peng, and Lisha Hu. Deep learning for sensor-based activity recognition: A survey. Pattern Recognition Letters, 119:3–11, 2019.
- [41] Felix Wu, Amauri Souza, Tianyi Zhang, Christopher Fifty, Tao Yu, and Kilian Weinberger. Simplifying graph convolutional networks. In ICML, pages 6861–6871, 2019.
- [42] Shunxin Xiao, Shiping Wang, Yuanfei Dai, and Wenzhong Guo. Graph neural networks in node classification: survey and evaluation. Machine Vision and Applications, 33:1–19, 2022.
- [43] Xiaowei Xu, Nurcan Yuruk, Zhidan Feng, and Thomas AJ Schweiger. SCAN: a structural clustering algorithm for networks. In KDD, pages 824–833, 2007.
- [44] Zhilin Yang, William Cohen, and Ruslan Salakhudinov. Revisiting semi-supervised learning with graph embeddings. In ICML, pages 40–48, 2016.
- [45] Ge Zhang, Zhao Li, Jiaming Huang, Jia Wu, Chuan Zhou, Jian Yang, and Jianliang Gao. eFraudCom: An e-commerce fraud detection system via competitive graph neural networks. ACM Transactions on Information Systems, 40(3):47:1–47:29, 2022.
- [46] Dengyong Zhou, Olivier Bousquet, Thomas Lal, Jason Weston, and Bernhard Schölkopf. Learning with local and global consistency. In NIPS, pages 321–328, 2003.
- [47] Xiaokang Zhou, Wei Liang, Weimin Li, Ke Yan, Shohei Shimizu, I Kevin, and Kai Wang. Hierarchical adversarial attacks against graph-neural-network-based iot network intrusion detection system. IEEE Internet of Things Journal, 9(12):9310–9319, 2022.
- [48] Xiaojin Zhu, Zoubin Ghahramani, and John D Lafferty. Semi-supervised learning using gaussian fields and harmonic functions. In ICML, pages 912–919, 2003.