Double black hole mergers in nuclear star clusters: eccentricities, spins, masses, and the growth of massive seeds
Abstract
We investigate the formation of intermediate mass black holes (IMBHs) through hierarchical mergers of stellar origin black holes (BHs), as well as BH mergers formed dynamically in nuclear star clusters. Using a semi-analytical approach which incorporates probabilistic mass-function-dependent double BH (DBH) pairing, binary-single encounters, and a mass-ratio-dependent prescription for energy dissipation in hardening binaries, we find that IMBHs with masses of – can be formed solely through hierarchical mergers in timescales of a few Myrs to a few Gyrs. Clusters with escape velocities km s-1 inevitably form high-mass IMBHs. The spin distribution of IMBHs with masses M⊙ is strongly clustered at ; while for lower masses, it peaks at . Eccentric mergers are more frequent for equal-mass binaries containing first- and/or second-generation BHs. Metal-rich, young, dense clusters can produce up to of their DBH mergers with eccentricity at , and – of all in-cluster mergers can form at Hz. Nuclear star clusters are therefore promising environments for the formation of highly-eccentric DBH mergers, detectable with current gravitational-wave detectors. Clusters of extreme mass ( M⊙) and density ( M⊙pc-3) can have about half of all of their DBH mergers with primary masses M⊙. The fraction of in-cluster mergers increases rapidly with increasing cluster escape velocity, being nearly unity for km s-1. Cosmological merger rate of DBHs from nuclear clusters varies Gpc-3yr-1, where the large error bars come from uncertainties in the cluster initial conditions, number density distribution, and redshift evolution of nucleated galaxies.
keywords:
keyword1 – keyword2 – keyword31 Introduction
Since the first direct observation of gravitational waves through the merger of two black holes (BHs) (Abbott et al., 2016), the LIGO-Virgo-KAGRA (LVK) gravitational-wave detector network has recorded about DBH coalescence candidates (Abbott et al., 2021c, a). This ever-growing data-set of double BH (DBH) systems reveals that the observed BH mass spectrum ranges from M⊙ to over M⊙ (Abbott et al., 2021b), with a smooth transition between the stellar-mass BH range (tens of M⊙) to the intermediate-mass BH (IMBH) range (102-105 M⊙). Indeed, the gravitational-wave event GW190521, produced by the merger of a M⊙ BH with a M⊙ BH (Abbott et al., 2020), has been cited as the first observation of the formation of an IMBH.
The LVK observations of DBH mergers are conjectured to be originating via two main formation channels: isolated binary mergers in areas of relatively low stellar density such as fields of galaxies (Belczynski et al., 2007, 2016a; Stevenson et al., 2017a; Giacobbo & Mapelli, 2018) and dynamically-driven DBH mergers in dense stellar systems such as star clusters (Banerjee et al., 2010; Rodriguez et al., 2016a; Askar et al., 2017; Di Carlo et al., 2019; Chattopadhyay et al., 2022a). The observed BH mass, spin, and eccentricity distributions are expected to be affected by the host environment. For instance, due to tidal effects, isolated binaries are thought to have component spins that are aligned or nearly-aligned with the orbital angular momentum of the binary (Stevenson et al., 2017b). Isolated binaries may also be more likely to have low spin amplitudes (e.g., Bavera et al., 2020). On the other hand, dynamical environments are predicted to produce a population of DBHs with an isotropic spin-tilt distribution due to frequent spin-tilt-randomising interactions with other bodies (Rodriguez et al., 2016b). Additionally, merger products that are retained in the dynamical environment and themselves undergo mergers should have higher dimensionless spin amplitudes due to the conservation of angular momentum (Doctor et al., 2021). Dynamical encounters are also expected to lead to higher eccentricities in about – of the mergers (Wen, 2003; Antonini et al., 2014; Samsing et al., 2018; Gondán et al., 2018; Rodriguez et al., 2018a), unlike efficiently-circularized mergers in isolated evolution (Peters, 1964). Finally, it is unexpected that isolated stars formed at sub-solar metallicities evolve into BHs M⊙ due to (pulsational) pair instability supernova ((P)PISN), which results in massive stars M⊙ leaving no remnants (or lower-mass remnants in the case of PPISN, which leads to a peak in the BH mass distribution at M⊙, as studied by Belczynski et al., 2016b; Woosley, 2017; Spera & Mapelli, 2017). All of the LVK observing runs have yielded detections of BHs above M⊙, within the region often referred to as the (P)PISN mass-gap. Recently, evidence has been found for spin-induced precession in merging DBHs (Abbott et al., 2021d, a; Hannam et al., 2022), as well as debatable evidences of eccentric coalescences in the LVK data (e.g. Gayathri et al., 2020; Romero-Shaw et al., 2022b), pointing towards the importance of investigating the dynamical origin of DBH mergers.
Over the past few years, in parallel to the gravitational wave observations, there have also been radio observations by the Event Horizon Telescope (EHT) of the supermassive (106 M⊙) BH (SMBH) at the centre of M87 (Akiyama et al., 2019), as well the SMBH Sagittarius A∗ (Akiyama et al., 2022) at the centre of our own Milky Way. These detections reaffirm the long-standing question of the “missing link”: IMBHs, which can connect the stellar-mass BH observed in X-ray binaries (Tetarenko et al., 2016; Generozov et al., 2018; Chakraborty et al., 2020; Charles et al., 2022) and gravitational-wave events to the SMBHs at the centres of galaxies. Gravitational-wave detections of BHs within the (P)PISN mass gap suggest that the LVK-observed population contains BHs produced via a formation channel that subverts the mass restrictions of isolated evolution. As such, the beginning point of an investigation into the location and formation of IMBHs can start from the study of hierarchical mergers of stellar-origin BHs in star clusters (Rizzuto et al., 2021).
The idea that a DBH merger product can subsequently keep merging with other BHs or other BH merger products require the remnant to be subjected to small (less than the cluster escape velocity) recoil kicks, in order to be retained in the cluster (Mapelli, 2016; Rodriguez et al., 2019). Within the star cluster population, young open clusters of mass M⊙ and ordinary globular clusters (up to M⊙) have low escape velocities of (1-2)km s-1. Very massive globular clusters and nuclear star clusters with a mass range of M⊙ and density range of M⊙ pc-3, however, have a higher likelihood of retaining subsequent generations of DBH merger remnants, leading to significant mass growth (Antonini & Rasio, 2016; Antonini et al., 2019; Fragione & Silk, 2020).
The modelling of such massive clusters with direct body or even Monte-Carlo simulations is extremely computationally expensive. Although there have been some recent trials of developing more efficient codes and utilising GPUs for this purpose (e.g. Wang et al., 2020; Kamlah et al., 2022), most simulations require significant computational time and supercomputing facilities to produce a statistically significant dataset. No simulations are yet sufficiently efficient to handle bodies with detailed stellar evolution. Using a semi-analytical approach to the problem can solve most of these issues, providing a flexible, user-friendly alternative that is much faster and can assist in understanding the internal dynamics of large- systems. Basing on the works of Hénon (1972) and Breen & Heggie (2013) showing the macroscopic cluster properties to be insensitive to the details of their microscopic structure, we use the updated semi-analytical code (Antonini & Gieles, 2020b; Antonini et al., 2023) to model massive clusters and study their DBH mergers.
In this work, we particularly focus on nuclear star clusters. These are found at the centre of most sufficiently well resolved low and intermediate-mass galaxies (Böker et al., 2004; Côté et al., 2006), including the Milky Way (Schödel et al., 2007). They are the densest and most massive star clusters observed in the local universe, and are often found to host a SMBH at their centre (e.g., Georgiev et al., 2016; Neumayer et al., 2020). Those nuclear star clusters might be the precursors of massive BHs in the galactic nuclei and that their might be a link between thew two types of central objects has been suggested before (e.g., Neumayer & Walcher, 2012; Stone et al., 2017; Atallah et al., 2023). Here, we consider whether a massive seed might be produced at the centre of a cluster through hierarchical mergers of BHs. The key questions that we address are:
-
1.
Can we create IMBHs and SMBHs through hierarchical mergers in nuclear and massive globular clusters?
-
2.
How do the host cluster properties affect its hierarchical mergers and hence the IMBH masses?
-
3.
What are the mass, spin, and eccentricity signatures of the mergers in such massive clusters, and are they detectable by present and future gravitational wave detectors?
We discuss our methods and models in Sec. 2. Our results are described in Sec. 3. Sec. 4 describes our rate calculation, and, finally, Sec. 5 sums up.
Throughout this work and refer to the gravitational constant and the speed of light, respectively.
2 Methods
In our study we use the semi-analytical fast code developed by Antonini & Gieles (2020b), with updated prescriptions for BH binary sampling and three-body encounters (Antonini et al., 2023). We have also adapted the mass sampling of binaries and triples, as is discussed further in this section.
Within , we utilise Henon’s principle (Hénon, 1972) of steady state or balanced evolution, after the initial evolution of the star cluster. During this state of equilibrium, the energy per unit relaxation time created at the cluster core (by BH binaries, for a BH-rich cluster) is a constant fraction of the net energy of the cluster. This links the host cluster’s properties to its core binary (in our case, BH) population (Breen & Heggie, 2013).
We sample the initial BH mass distribution by evolving the zero-age-main-sequence (ZAMS) stars following a Kroupa (2001) initial mass function (with the maximum ZAMS mass being M⊙), using the single stellar evolution () prescriptions given by Hurley et al. (2000)111It is to be noted that we do not consider the effect of primordial binaries in the BH mass function, and the initial BH mass function is solely produced through updated . While binary stellar evolution (i.e. , Hurley et al., 2002) may produce a slightly different initial BH mass spectrum, we do not consider its effect since most primordial binaries are expected to be disrupted by the core-collapse timescale. The effect of primordial binaries on these massive clusters remains a future course of study. with metallicity-dependent wind mass loss updates of Vink et al. (2001) and (P)PISN mass gap prescriptions from Spera & Mapelli (2017). The post-stellar evolution BH mass distribution is accounted for by computing the ejection of BHs due to natal kicks (Hobbs et al., 2005).
In , after cluster core collapse (which occurs on the order of the initial half-mass relaxation time of the cluster, scaled by NBODY models; Antonini et al., 2019; Antonini & Gieles, 2020b), balanced evolution is assumed. It is also assumed that there is only one DBH present at any given time in the cluster, producing the required energy at the cluster-core. This assumption is in agreement with theoretical expectations for the massive clusters we consider (Heggie & Hut, 1993). The DBH is evolved through single BH encounters, which might result in the merger of the binary and/or its ejection and/or ejection of the single BH.
BHs are paired following the power-law probability distribution as described in Antonini et al. (2023), with p() and p() , where (with , such that ) and , . Here, is the power law index of the BH initial mass function. In reality, should be a function of time as the BH mass function evolves through ejections and mergers. For simplicity and computational convenience, however, we fix it to its initial value222We have made a few tests where was updated at each timestep and the results were similar to those with a fixed . Each binary is then encountered by a third body of mass , drawn again from a power-law probability distribution p() , with . The exponent factor is obtained through fits from the initial BH mass distribution after natal kicks (described in details in Antonini et al., 2023). Since the initial BH mass spectrum is a strong function of metallicity, we extrapolate a polynomial fit for in metallicity (Z) as
where, c, c, c, c, c, c, c, c and c.
The semi-major axis of the binary is assumed to be initially in the hard-soft limit, where is the reduced mass and the eccentricity for each of the resonant binary-single interaction is sampled from the thermal distribution (Samsing, 2018).333The average number of intermediate states for binary-single encounters is determined to be by Samsing (2018), although individually, it is dependent on the target binary initial separation and initial energy state of the single, which is ignored in our case. If , there is a gravitational-wave capture merger.
For a hard DBH, the amount of energy lost () from the binary due to an encounter with a single BH is usually assumed to be of the initial binding energy () of the binary (Heggie & Hut, 2003; Binney & Tremaine, 2008). This is true for equal mass systems i.e. ==, averaged over all values of impact parameter. While this assumption is valid for most cases, inaccuracies may arise when the perturber is several order of magnitude smaller than the binary. As such, both simulation (Hills & Fullerton, 1980) and analytical calculation (Quinlan, 1996) have shown that . Thus, for some of our models, we propose the functional form
| (1) |
where . Eq. (1) is normalized such that reaches , when so as to match the limiting condition with equal masses (Heggie & Hut, 2003). When = and , , which is smaller than predicted by Hills & Fullerton (1980) since that work only considered encounters with zero impact parameter. The semi-major axis ‘’ of the binary becomes , (where, 0.83, the boundaries obtained for extremum cases of 20% and 0% of binary binding energy loss) after each binary-single interaction, as the single gains (1/-1) of the binding energy of the binary (Antonini & Gieles, 2020b).
Through a binary-single resonant encounter, the DBH can merge (following Peters 1964) and/or get ejected, or the merger remnant can be retained in the cluster, further merging with other BHs. The low-mass single perturber BH may also get ejected (Eqs. 3 and 4 of Antonini et al. 2023). The calculation then progresses to the next BH binary. The computational efficiency of the code is achieved by evolving the bulk properties of the cluster (mass, half-mass density, relaxation time etc.) independently, taking the mass loss through stellar evolution and BH ejections into account (described in details in Antonini & Gieles 2020b and Antonini & Gieles 2020a).
does not account for binary-binary or higher-order chaotic encounters and accounts for only one DBH binary at a given time in the cluster. The presence of many-body encounters and several concurrent DBHs has been demonstrated in detailed N-body codes like (Banerjee, 2018; Chattopadhyay et al., 2022a) and (Kamlah et al., 2022; Hong et al., 2020). However, these simulations refer to clusters with low masses, typically . For the very massive clusters we consider here, higher-order interactions are expected to be strongly suppressed (Pina and Gieles in-prep.) .
2.1 Models
| Sl. | Model | Mass | Density | Metallicity | SN | BH seed | Mass Loss | Natal kick | BH spin | BH pairing | Delta E |
| Z | prescription | ||||||||||
| (M⊙) | (M⊙ pc-3) | (km s-1) | |||||||||
| 1. | Fiducial | 2107 | 107 | 1.5 | rapid | 0 | stellar | 0;0 | alpha | ||
| 2. | M8D8 | 108 | 108 | 1.5 | rapid | 0 | stellar | 0;0 | alpha | ||
| 3. | M8D7 | 108 | 107 | 1.5 | rapid | 0 | stellar | 0;0 | alpha | ||
| 4. | M7D8 | 107 | 108 | 1.5 | rapid | 0 | stellar | 265 | 0;0 | alpha | |
| 5. | M7D7 | 107 | 107 | 1.5 | rapid | 0 | stellar | 265 | 0;0 | alpha | |
| 6. | M7D6 | 107 | 106 | 1.5 | rapid | 0 | stellar | 265 | 0;0 | alpha | |
| 7. | M7D5 | 107 | 105 | 1.5 | rapid | 0 | stellar | 0;0 | alpha | ||
| 8. | M6D8 | 106 | 108 | 1.5 | rapid | 0 | stellar | 0;0 | alpha | ||
| 9. | M6D7 | 106 | 107 | 1.5 | rapid | 0 | stellar | 0;0 | alpha | ||
| 10. | M6D6 | 106 | 106 | 1.5 | rapid | 0 | stellar | 0;0 | alpha | ||
| 11. | M6D5 | 106 | 105 | 1.5 | rapid | 0 | stellar | 0;0 | alpha | ||
| 12. | Z_10 | 2107 | 107 | 1.5 | rapid | 0 | stellar | 0;0 | alpha | ||
| 13. | Z_100 | 2107 | 107 | 1.5 | rapid | 0 | stellar | 0;0 | alpha | ||
| 14. | SN_D | 2107 | 107 | 1.5 | delay | 0 | stellar | 0;0 | alpha | ||
| 15. | Sd_50 | 2107 | 107 | 1.5 | rapid | 50 | stellar | 0;0 | alpha | ||
| 16. | Sd_100 | 2107 | 107 | 1.5 | rapid | 100 | stellar | 0;0 | alpha | ||
| 17. | Sd_150 | 2107 | 107 | 1.5 | rapid | 150 | stellar | 0;0 | alpha | ||
| 18. | Sd_200 | 2107 | 107 | 1.5 | rapid | 200 | stellar | 0;0 | alpha | ||
| 19. | Ml_ev | 2107 | 107 | 1.5 | rapid | 0 | stellar, evaporation | 0;0 | alpha | ||
| 20. | Ml_0 | 2107 | 107 | 1.5 | rapid | 0 | 0 | 0;0 | alpha | ||
| 21. | Ml_0M7D5 | 107 | 105 | 1.5 | rapid | 0 | 0 | 0;0 | alpha | ||
| 22. | Vk_0 | 2107 | 107 | 1.5 | rapid | 0 | stellar | 0 | 0;0 | alpha | |
| 23. | Vk_0M7D7 | 107 | 107 | 1.5 | rapid | 0 | stellar | 0 | 0;0 | alpha | |
| 24. | Vk_0M7D5 | 107 | 105 | 1.5 | rapid | 0 | stellar | 0 | 0;0 | alpha | |
| 25. | Vk_0 | 2107 | 107 | 1.5 | rapid | 0 | stellar | 0 | 0;0 | alpha | |
| 26. | Sp_01 | 2107 | 107 | 1.5 | rapid | 0 | stellar | 0;1 | alpha | ||
| 27. | Sp_33 | 2107 | 107 | 1.5 | rapid | 0 | stellar | 0.3;0.3 | alpha | ||
| 28. | Sp_11 | 2107 | 107 | 1.5 | rapid | 0 | stellar | 1;1 | alpha | ||
| 29. | Sp_LVK | 2107 | 107 | 1.5 | rapid | 0 | stellar | LVK | alpha | ||
| 30. | Ord_BH | 2107 | 107 | 1.5 | rapid | 0 | stellar | 0;0 | ordered | 0.2 | |
| 31. | DE | 2107 | 107 | 1.5 | rapid | 0 | stellar | 0;0 | alpha | 0.2 | |
| 32. | DEM7D7 | 107 | 107 | 1.5 | rapid | 0 | stellar | 0;0 | alpha | 0.2 | |
| 33. | DEM7D5 | 107 | 105 | 1.5 | rapid | 0 | stellar | 0;0 | alpha | 0.2 | |
| 34. | DE | 2107 | 107 | 1.5 | rapid | 0 | stellar | 0;0 | alpha | 0.2 |
The set of models (each run times with different random seeds to account for statistical fluctuations) used for this project is tabulated in Table 1 and is described as follows.
2.1.1 Fiducial
The base model Fiducial has an initial mass and half mass density of 2107 M⊙ and 107 M⊙ pc-3 respectively. The only form of mass loss in this model (apart from BH ejections due to merger or binary-single recoils) is assumed to be due to stellar evolution (Hurley et al., 2000; Antonini & Gieles, 2020b) i.e. mass loss due to stellar winds and supernovae (Lucy & Solomon, 1970), and natal kicks (Lipunov et al., 1997). These parameters of the Fiducial model are chosen, such that after a Hubble Time, the cluster mass and density roughly aligns with that of the Milky-way nuclear cluster (Schödel et al., 2009, 2020). The Fiducial model metallicity is Z, the “rapid” supernova prescription is used for core-mass to BH-mass mapping (Fryer et al., 2012) and the BH natal kick is drawn from a Maxwellian distribution with km s-1(Hobbs et al., 2005) scaled by fallback mass (Janka, 2013). The initial BH spin is assumed to be zero. The BH binaries and binary-singles are paired according to the metallicity-dependant prescription described in Sec. 2. The amount of energy lost per binary-single encounter is assumed to be a function of the masses of the third-body perturber and the binary total mass, such that , as given by equation (1).
2.1.2 Other model variations
All other models have one or two specifications changed from the Fiducial model. Model variations are shown in Table 1. Different cluster initial masses and densities are explored with model serial numbers 211. The naming of each model reflects these changes. For example, model M8D8 has an initial mass and density of M⊙ and M⊙ pc-3 respectively, while M6D5 has an initial mass of M⊙ and an initial density of M⊙ pc-3. Models Z_10 and Z_100 have metallicities 10 and 100 that of Fiducial. Model SN_D uses the “delayed” supernova prescription , instead of Fiducial model’s “rapid" prescription (Fryer et al., 2012).444Z_100 has similar order-of-magnitude metallicity as the Sun (Asplund et al., 2009). In the “Sd” models with serial numbers 1518, we included in the cluster model a BH that is not produced through stellar evolution and with a mass which is traditionally considered above the mass limit imposed by pulsational pair instabilities. We do note that the lower edge of the (P)PISN mass gap is rather uncertain and can be pushed to further higher masses if stellar rotation is included, nevertheless, M⊙ is usually assumed not to be produced directly through stellar evolution from the Kroupa (2001) mass function (Marchant & Moriya, 2020a). It is still possible that evolving massive stars in binaries or triples undergo mergers (pre-compact object formation), and then promptly collapses to very massive BHs (e.g. Stegmann et al., 2022; Arca Sedda et al., 2023). These seeds can also be considered as primordial BHs; however, we note that there is tremendous uncertainty in the existence of primordial BHs, their expected mass range, and the actual process of their seeding star clusters or early galaxies (Dolgov & Postnov, 2017; Yuan et al., 2023). Model Ml_ev has added cluster mass loss due to cluster evaporation in addition to the standard mass loss via stellar evolution and BH ejections (see Fig. 1 and Section II.B in Antonini & Gieles (2020a). Mass loss due to stellar evolution is neglected in models Ml_0 and Ml_0M7D5.
We explore an assumption that all BHs are born with zero natal kicks in the “Vk_0” models (serial numbers 2225). We deviate from the BH binary and triple mass selection assumption in model “Ord_BH”, where the two most massive BHs are selected to be in a binary, followed by the third most massive one making the triple perturber. The assumption of non-spinning initial BHs is varied in the “Sp” models (serial numbers 2629), where the initial BH spin has different values. In one model we sample the initial BH spins from the distribution inferred from the GW data, i.e. Fig.15 of Abbott et al. (2021b). The model group “DE” (serial numbers 3134) changes the assumption of the mass-ratio dependent functional form of , and replaces it by a constant value of (Heggie & Hut, 2003; Binney & Tremaine, 2008). The maximum integration time of the models is taken to be Gyr, approximately a Hubble Time (e.g., Valcin et al., 2021).
3 Results
Specifically keeping the three primary questions of Sec. 1 in mind, we discuss the results obtained from our models some of which are summarised in Table LABEL:tab:IMBHmass. We divide this Section into three parts, depending on the location and mass of the DBH mergers that we discuss: (i) In-situ (in-cluster) mergers, (ii) Mass and spin evolution of IMBHs, and (iii) Ex-situ (ejected) mergers.
3.1 In-situ mergers
In this Section, we discuss DBH mergers that occur inside the cluster. High cluster escape velocity plays a key role in retaining these DBHs, protecting them from ejection due to natal or recoil kicks. In fact, we shall see that almost all the DBH mergers formed in our models are in-cluster mergers. We split the discussion of the properties of the in-situ mergers in our cluster models by their masses, spins and eccentricities.
3.1.1 Mass
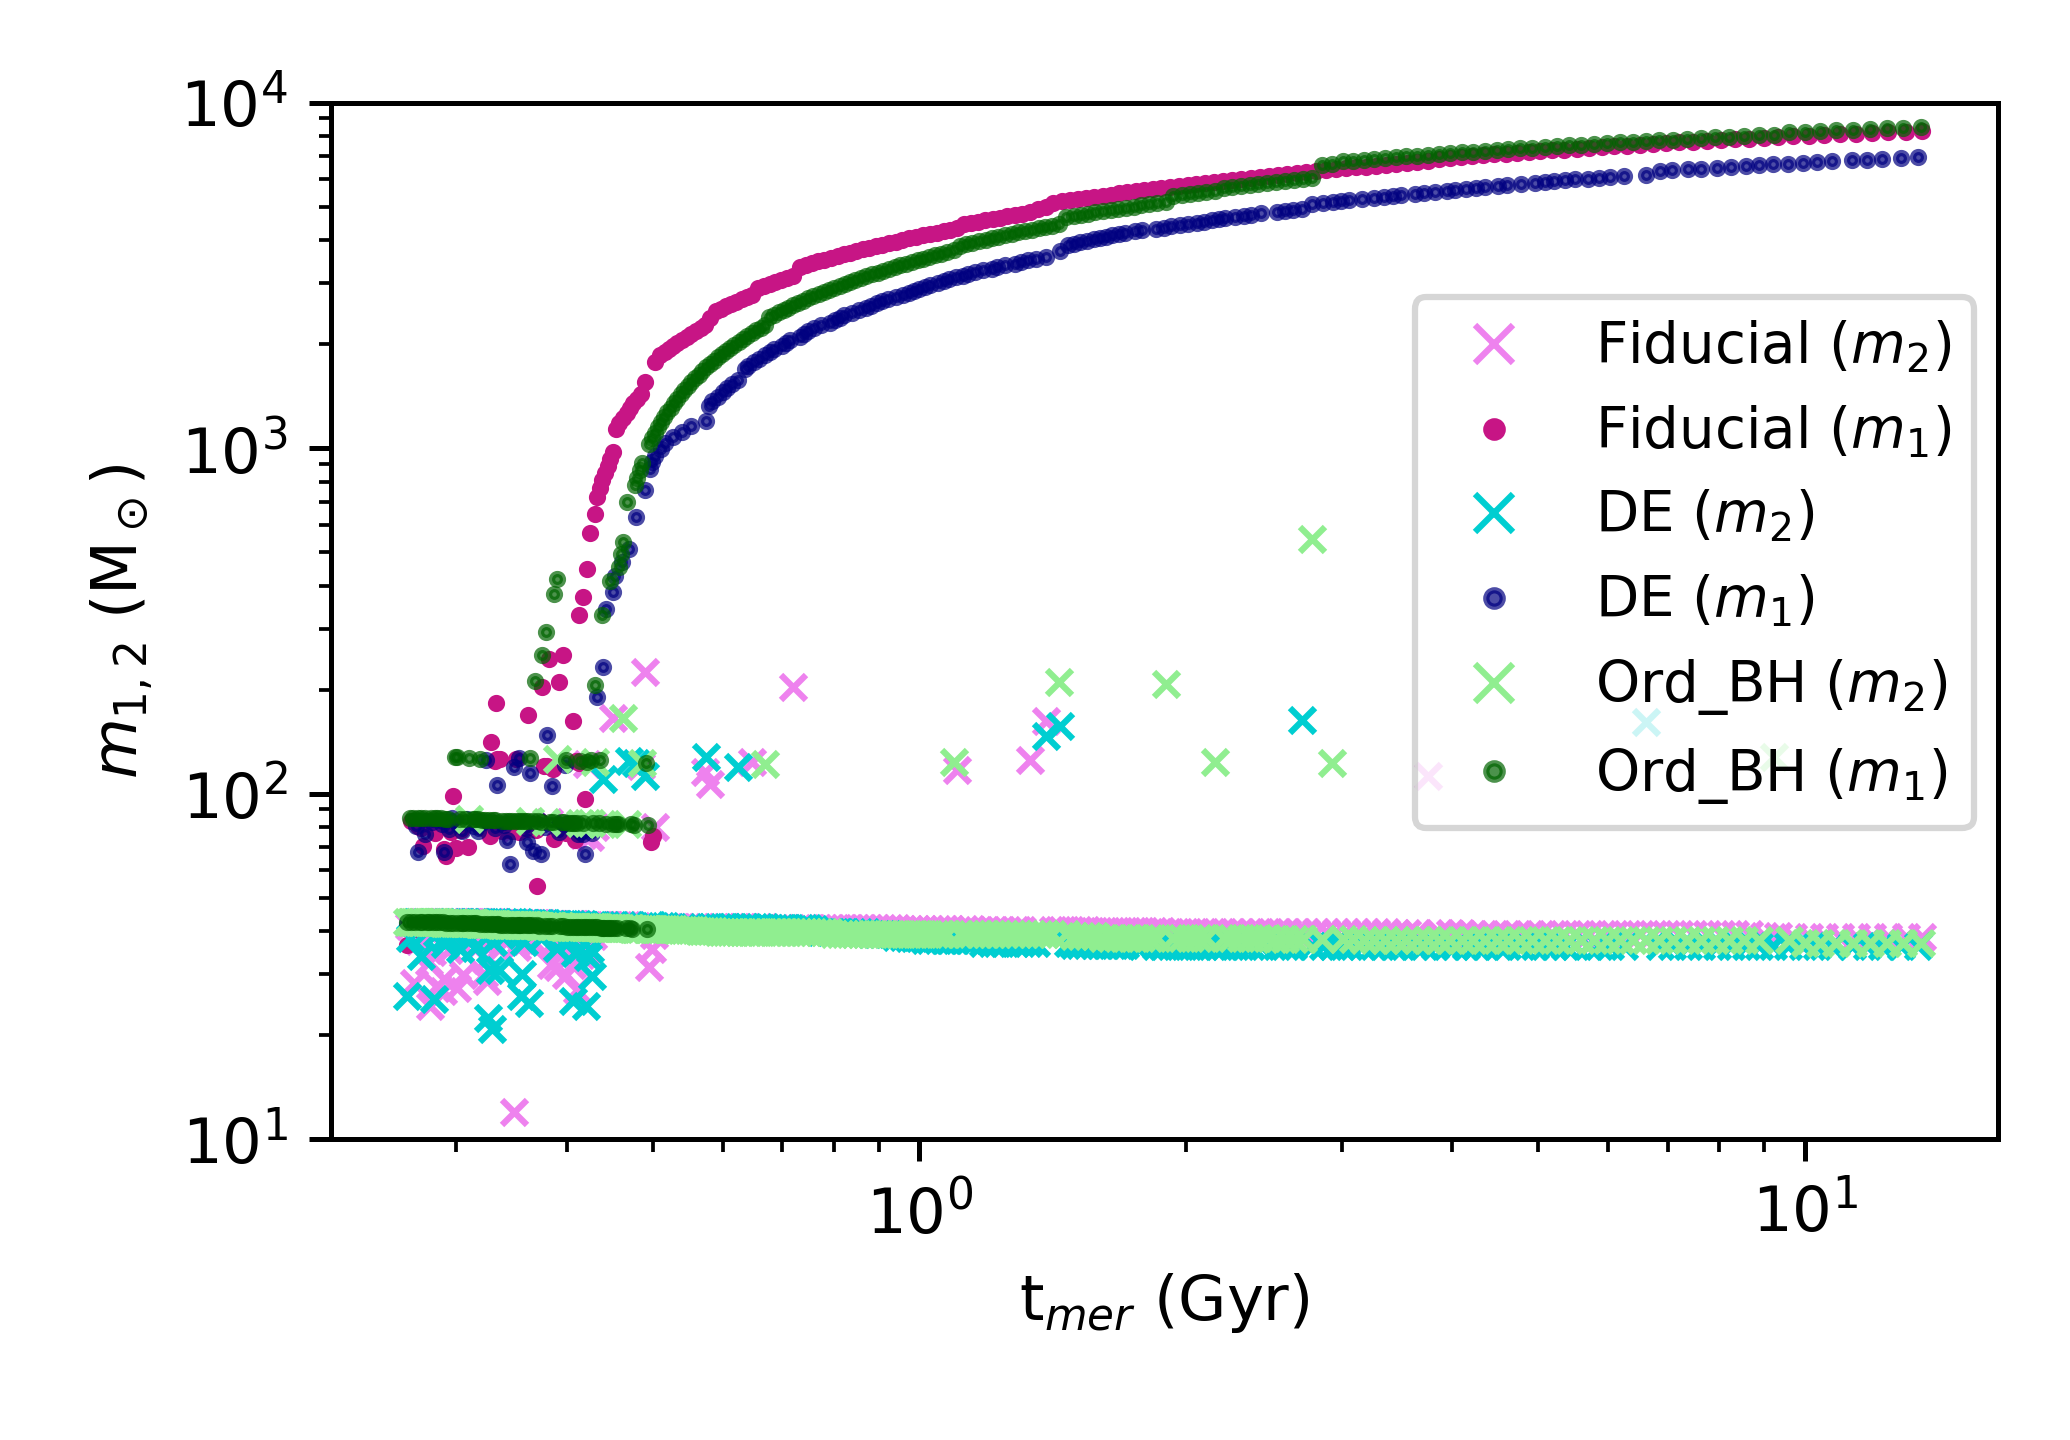
The evolution of the DBHs that merge in our cluster model Fiducial, DE and Ord_BH is represented in Fig. 1. For models Fiducial and DE, in the first few hundred million years, there are a couple of BH primaries of – M⊙ that compete until one emerges as the most massive IMBH and continues to grow in mass, following a near-logarithmic growth curve at later times. This near-logarithmic growth is due to the secular expansion of the cluster, which causes the energy generation rate by the binary to decrease and a significant drop in the DBH merger rate.
Since there is only one binary in the cluster at any one time and the most massive BH tends to pair with the second-most massive BH, as long as the merger remnant is retained in the cluster the formation of higher-generation BHs is suppressed. Hence, in the model Ord_BH, there can only be one M⊙ BH at a time. A new M⊙ BH, which eventually becomes the most massive IMBH of the model, is only produced after a M⊙ BH is ejected at Myrs.
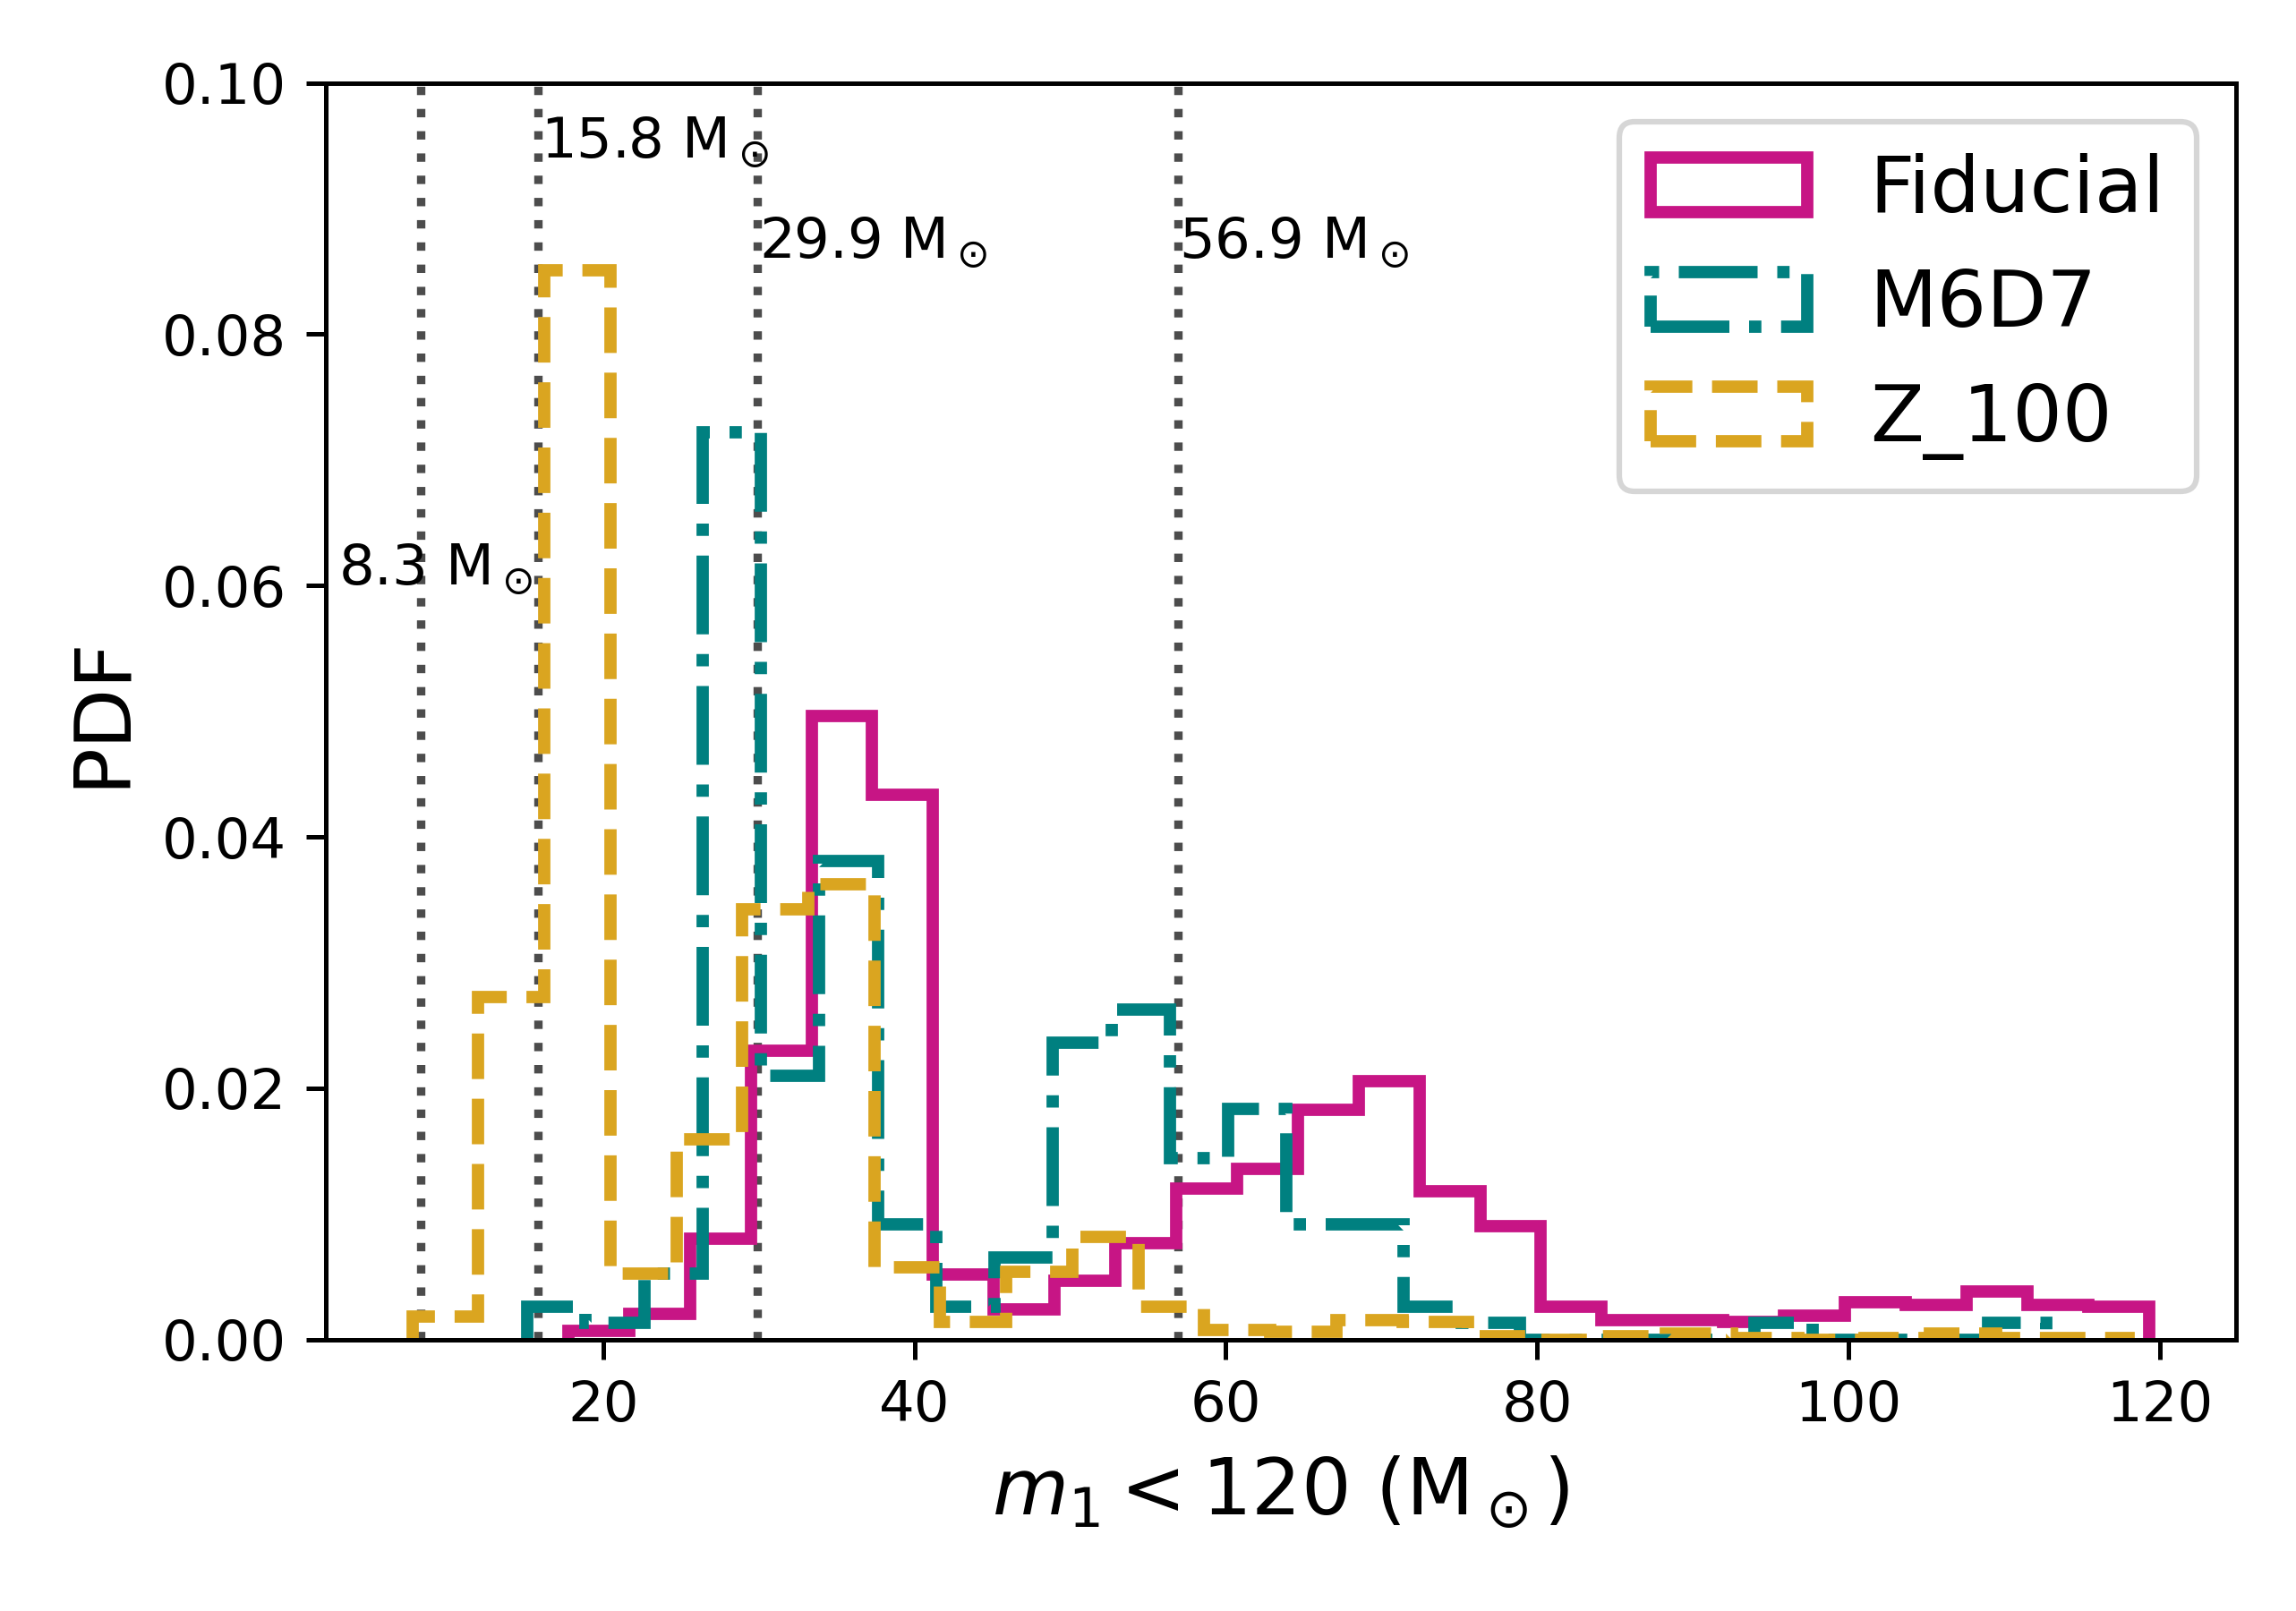
It is possible to identify the primaries in the first, second, third, and fourth DBH merger generations from the strata seen in Fig. 1. At the fourth generation, the most massive IMBH starts to completely dominate in-situ mergers. Recent studies have found multiple structures in the inferred BH mass spectrum (Tiwari & Fairhurst, 2021). There appears to be multiple peaks at 10,20,35,64 M⊙ of the primary BH mass (Tiwari, 2023), and while their cause remains unknown owing to the difficulty in disentangling systematics, selection effects, unknown branching fraction between different types of environments of BH mergers and uncertainties in massive binary evolution as well as cosmological distribution and evolution of initial parameters of star clusters, different BH generations of in-cluster mergers in massive clusters could produce such features. We compare Fig. 5 of Tiwari & Fairhurst (2021) to our Fig. 2, illustrating that a combination of clusters with different escape velocities and metallicities (as well as isolated BH merger pathways, especially for the lower-mass end of the spectrum) can potentially help to explain some of the features in the mass distribution.
The merging DBH mass spectrum from massive clusters in which IMBHs form is remarkably different to that from young, open clusters. In open clusters, lower escape velocities ensure the ejection of the massive remnants formed from a DBH merger, while lower-mass first-generation BHs can still participate in dynamical mergers inside the cluster. This means that massive clusters such as nuclear and (the most massive) globular clusters are a much more probable formation environment for hierarchical mergers, and therefore for IMBH growth, than open clusters.
As Fig. 2 demonstrates, the low-mass cluster M6D7 has more low-mass BH primaries participating in DBH mergers than in the Fiducial model. For low escape velocity clusters (especially in metal-rich environments), less massive DBH mergers take precedence; thus, small and high-metallicity clusters are more probable environments for low-mass ( M⊙) DBH mergers (Abbott et al., 2021b). Due to their high mass and density, clusters with a high escape velocity such as Fiducial form a massive IMBH at ease that hegemonizes the BH merger demographics, suppressing lower-mass mergers.
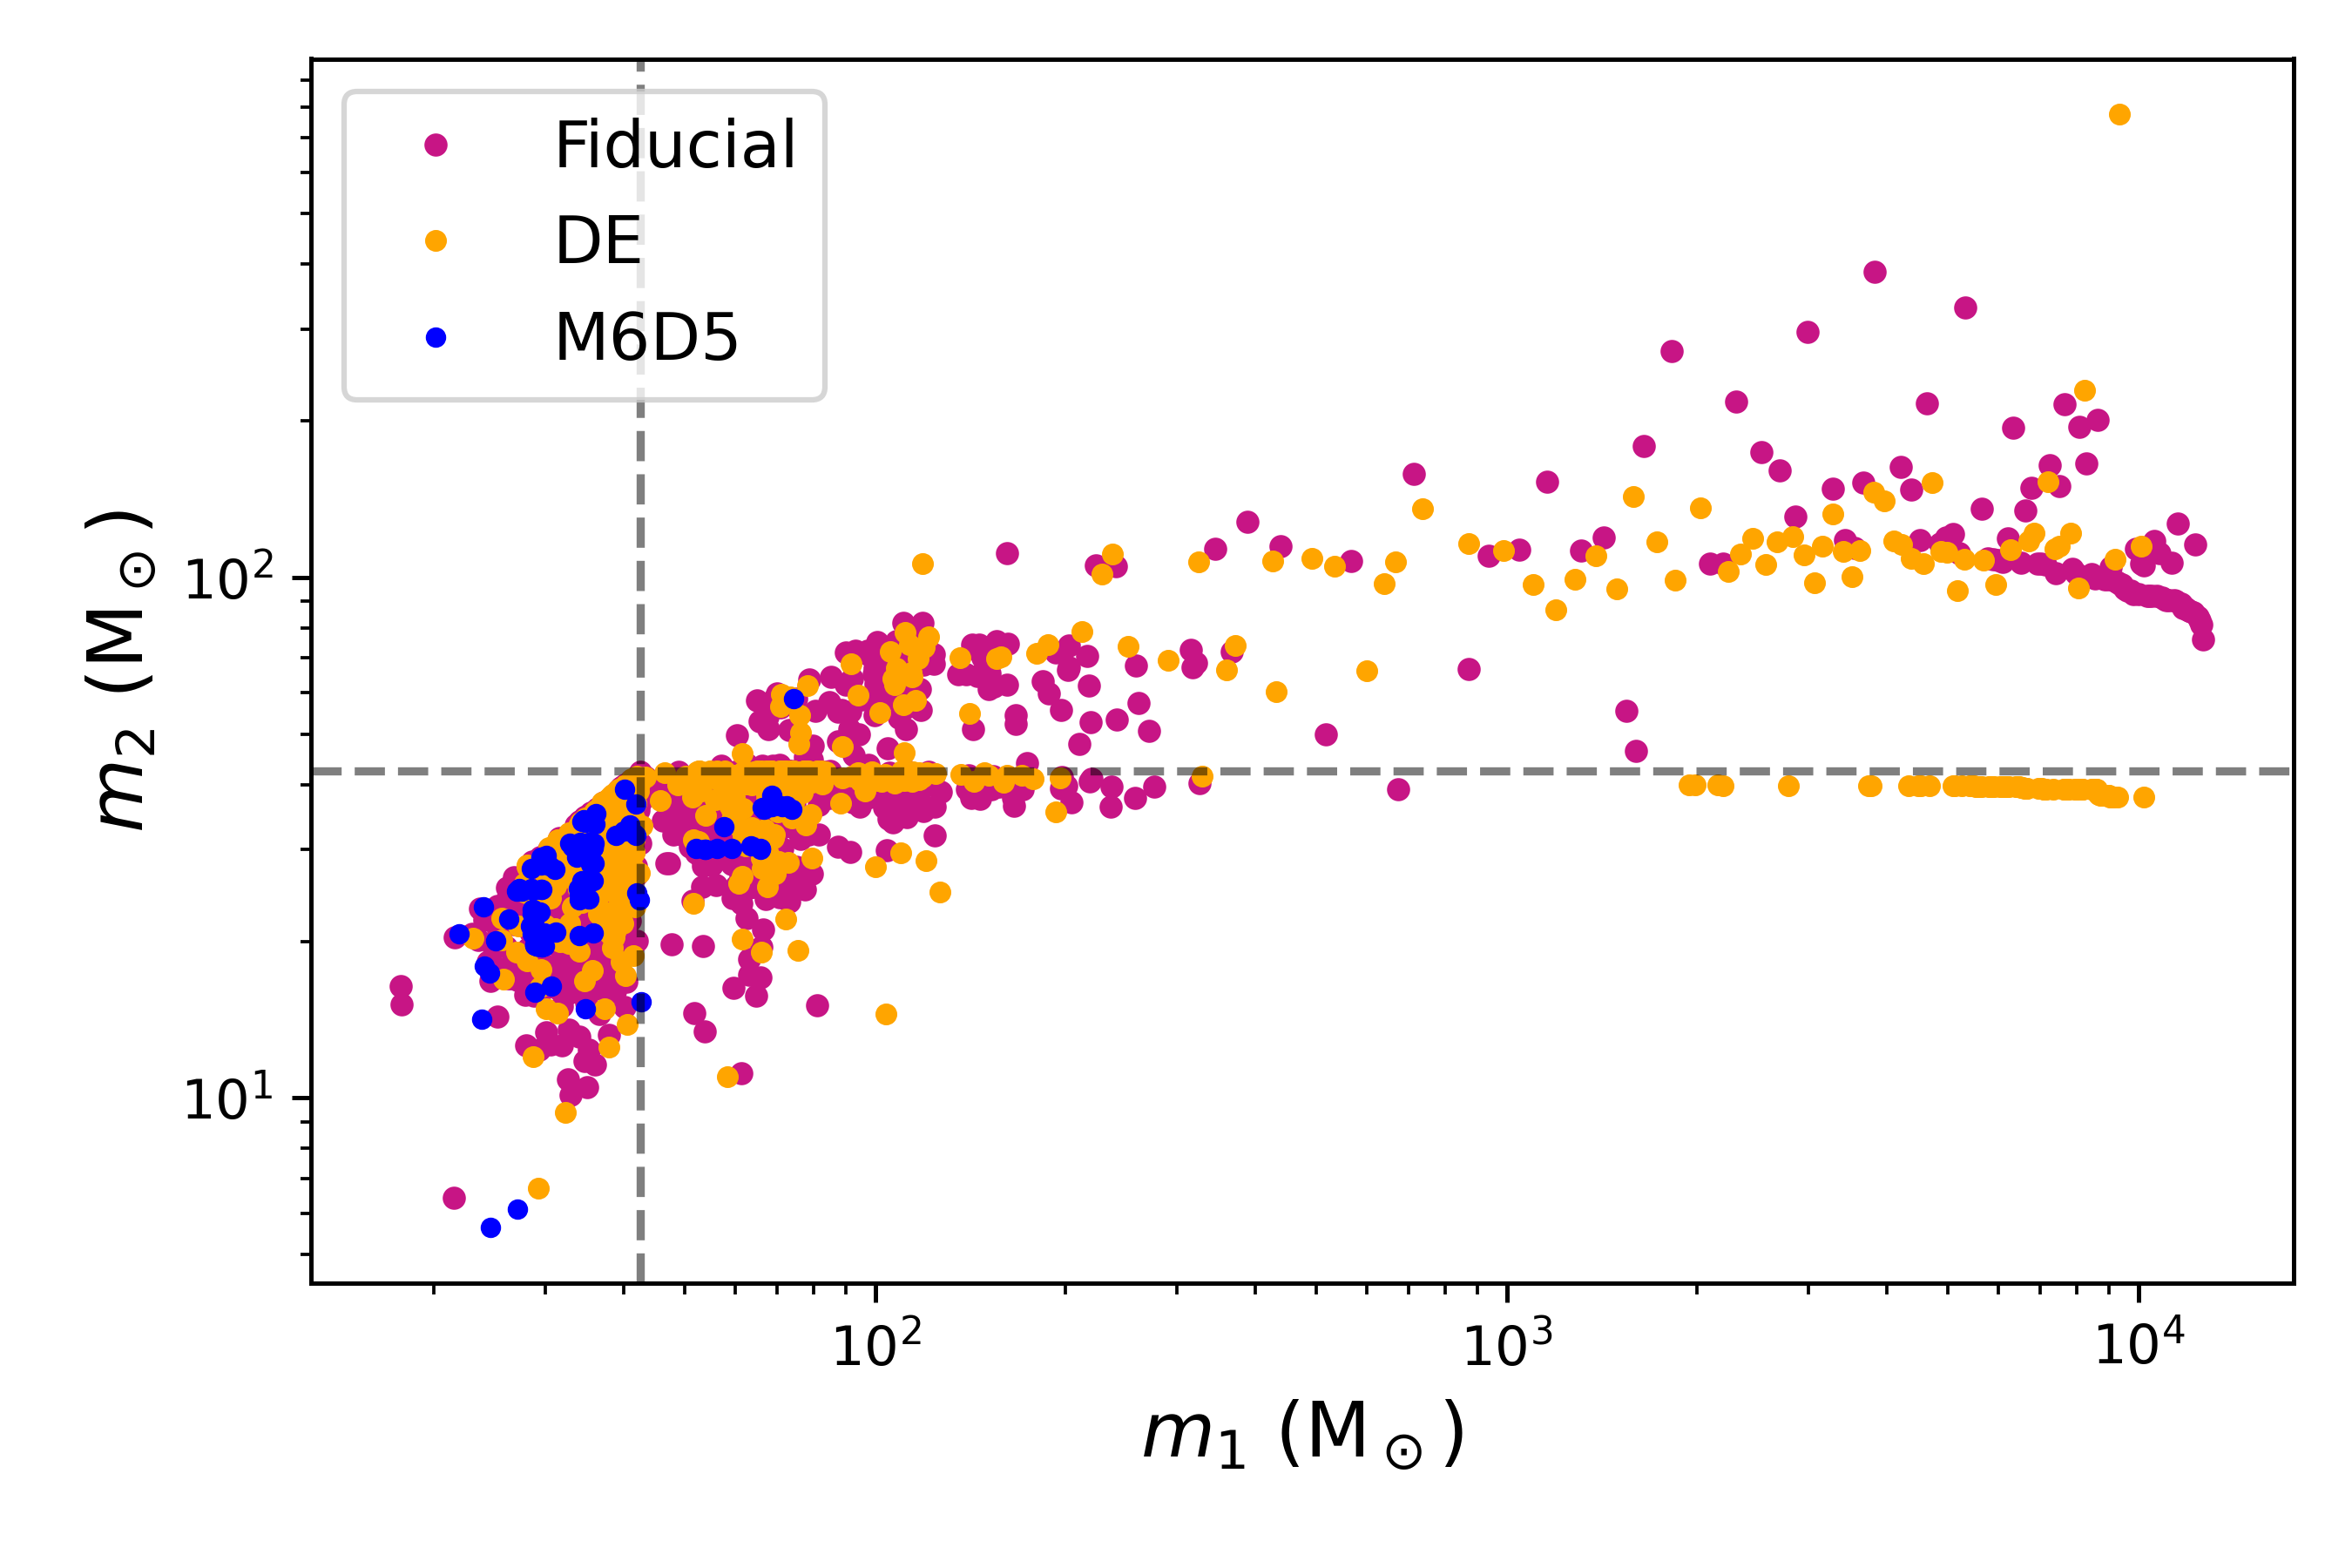
We emphasise that both BH primaries and secondaries can be merger remnants of previous generations that were retained in the cluster. In Fig. 3, we show the primary and secondary masses () of all mergers in the Fiducial, DE and M6D5 models. The presence of high-generation mergers in both and is clear from the build-up of BH masses above the maximum BH mass set within SSE ( M⊙; Hurley et al., 2000); this build-up is more prevalent in the Fiducial and DE models than in the M6D5 model. The dominance of the IMBH in the in-cluster mergers is also illustrated by the plateau in secondary masses as the primary masses continue to rise.
3.1.2 Spin
The initial spin distribution affects the post-merger remnant spins () to a small extent. While depends on the pre-merger component spins , it is also a function of the mass ratio of the merger. If the symmetric mass ratio is , the two component BH vector spins are and the angular momentum vector is , then the vector form of remnant spin (details in Lousto et al. 2010 and Lousto & Zlochower 2009) is given by
| (2) |
where,
| (3) |
and
| (4) |
The parallel component of is and the numerical constants are , , , and .
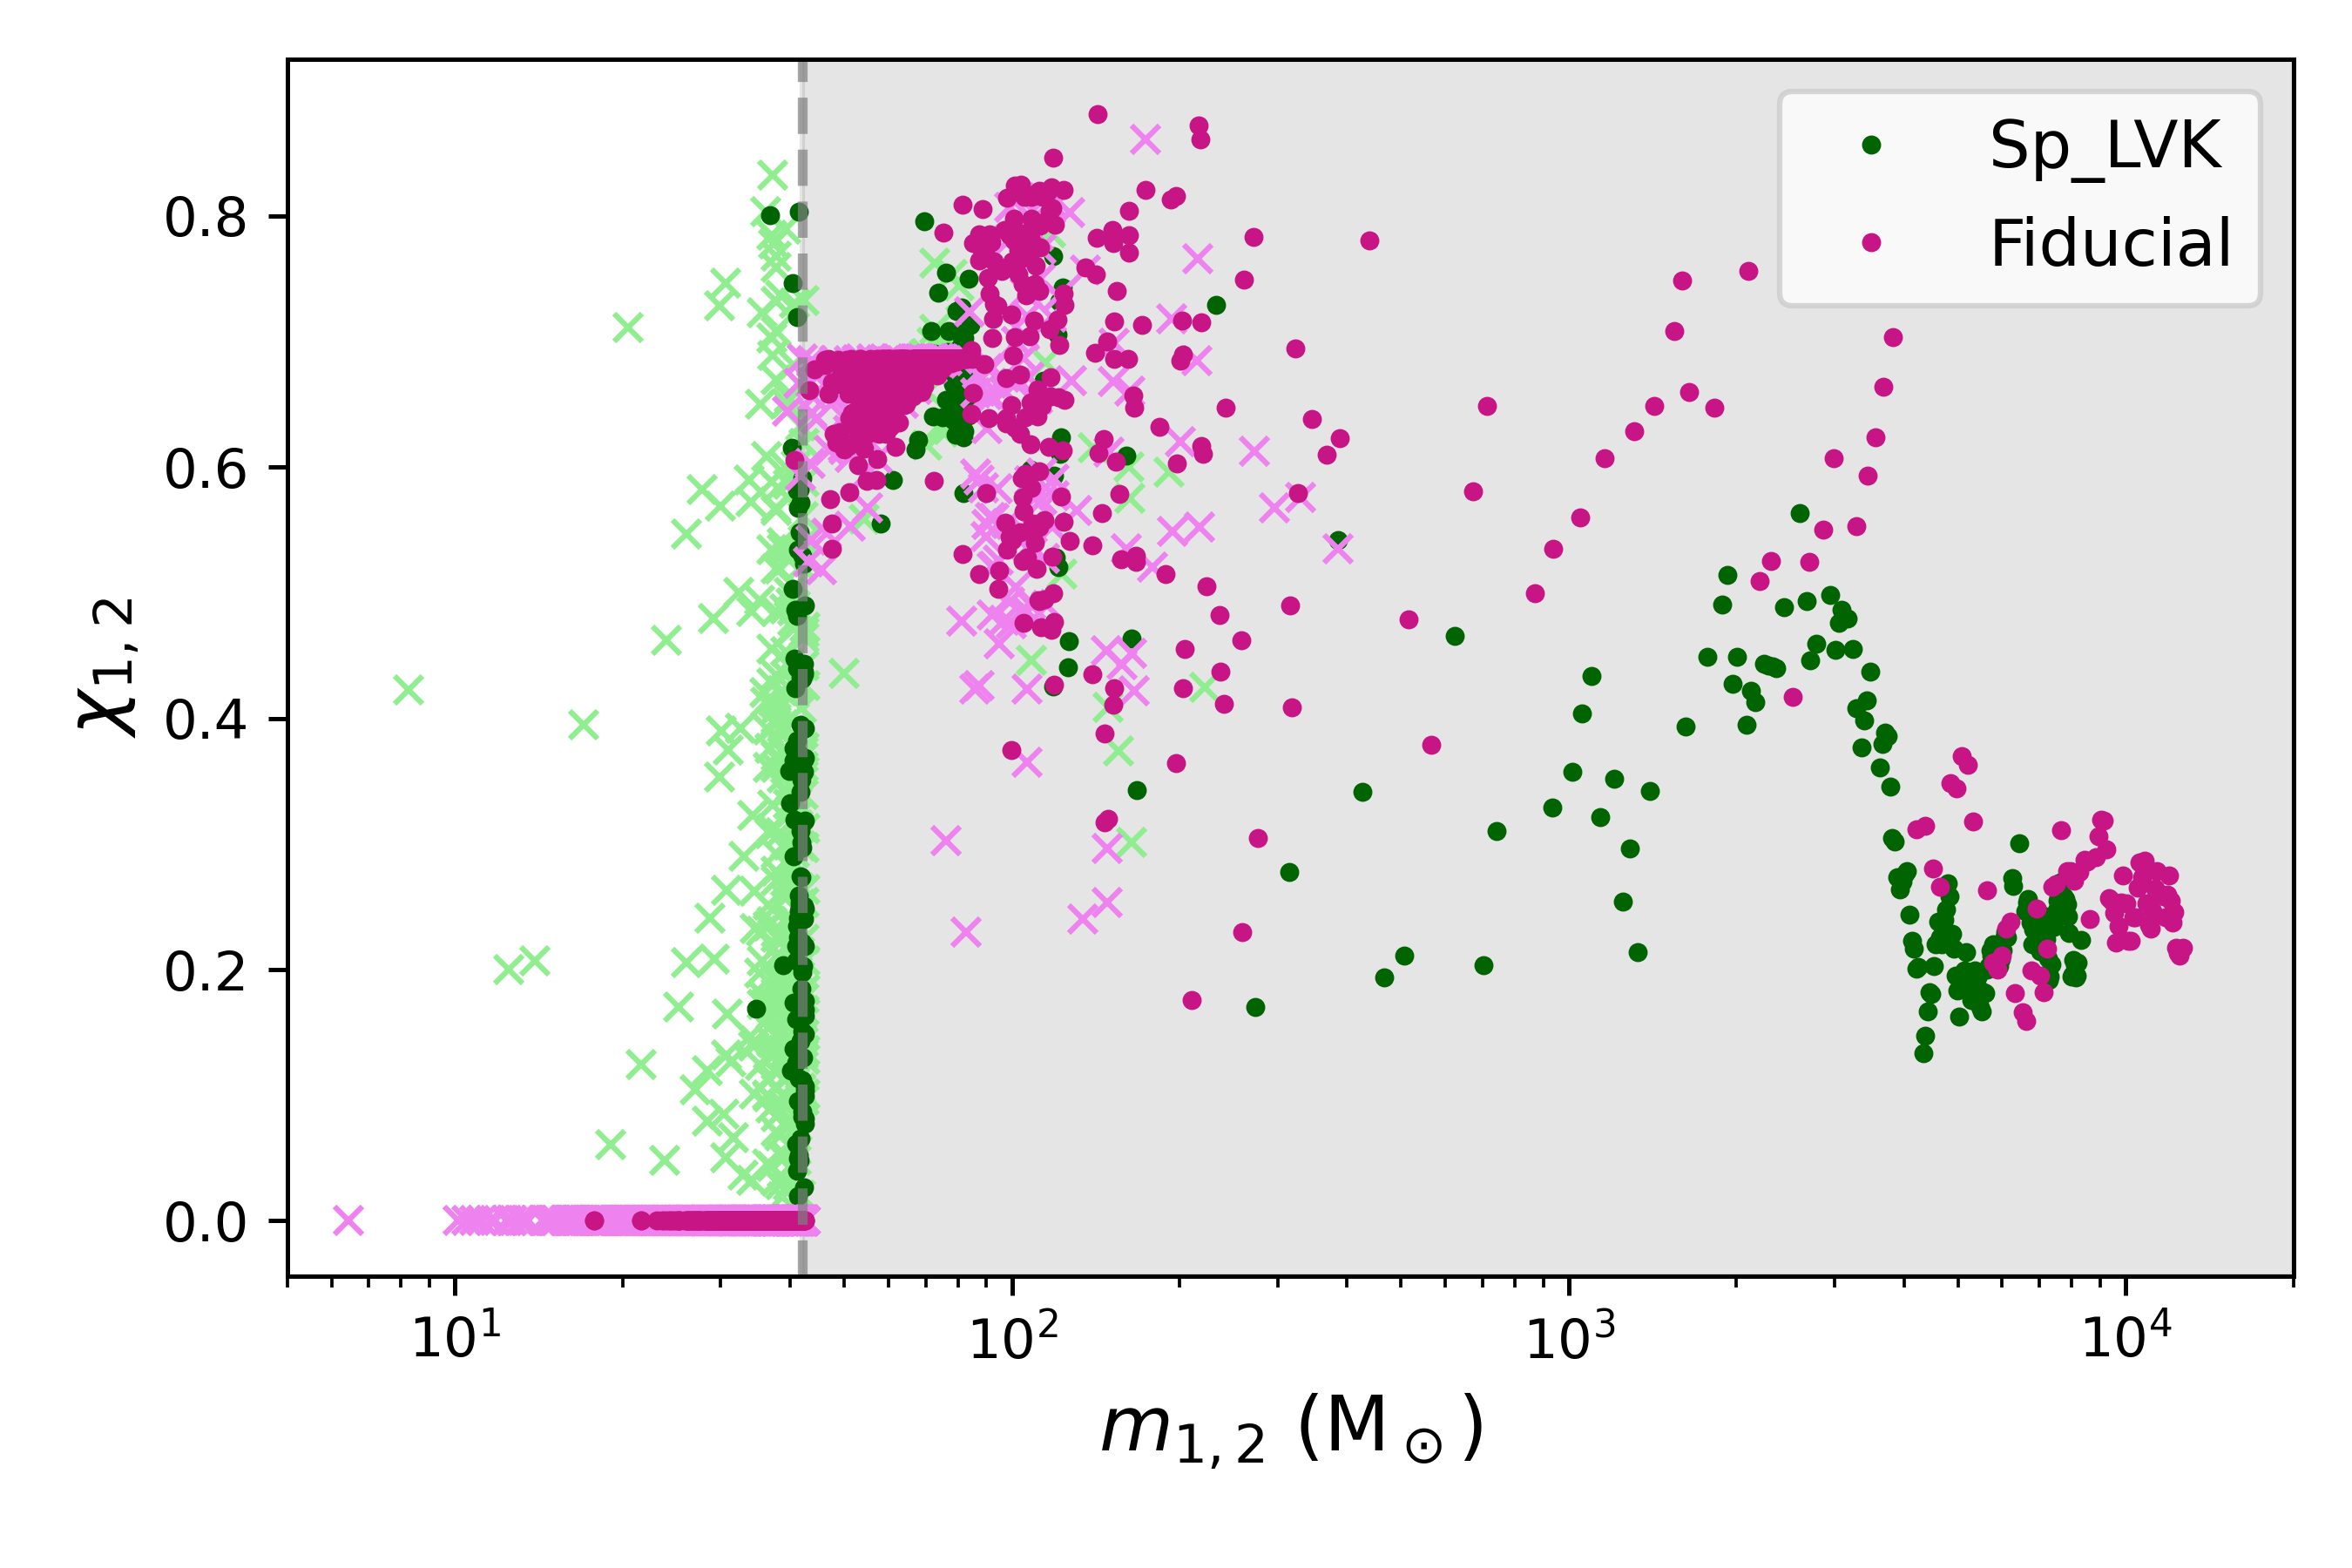
Because of the conservation of angular momentum during a merger, all models produce merger remnants with spins clustered around . For example, we can compare the Fiducial and Sp_LVK models, where the former has initially non-spinning BHs and the latter has an initial BH spin distribution consistent with that observed in gravitational-wave events. After just the first generation of stellar-mass mergers ( M⊙), the remnant spin is already clustered around . Consequently, higher-generational mergers end up with similar in both models (Fig. 4). The Fiducial model only shows a few lower measurements compared to the Sp_LVK model, even though the initial distribution of is very different between the two models.
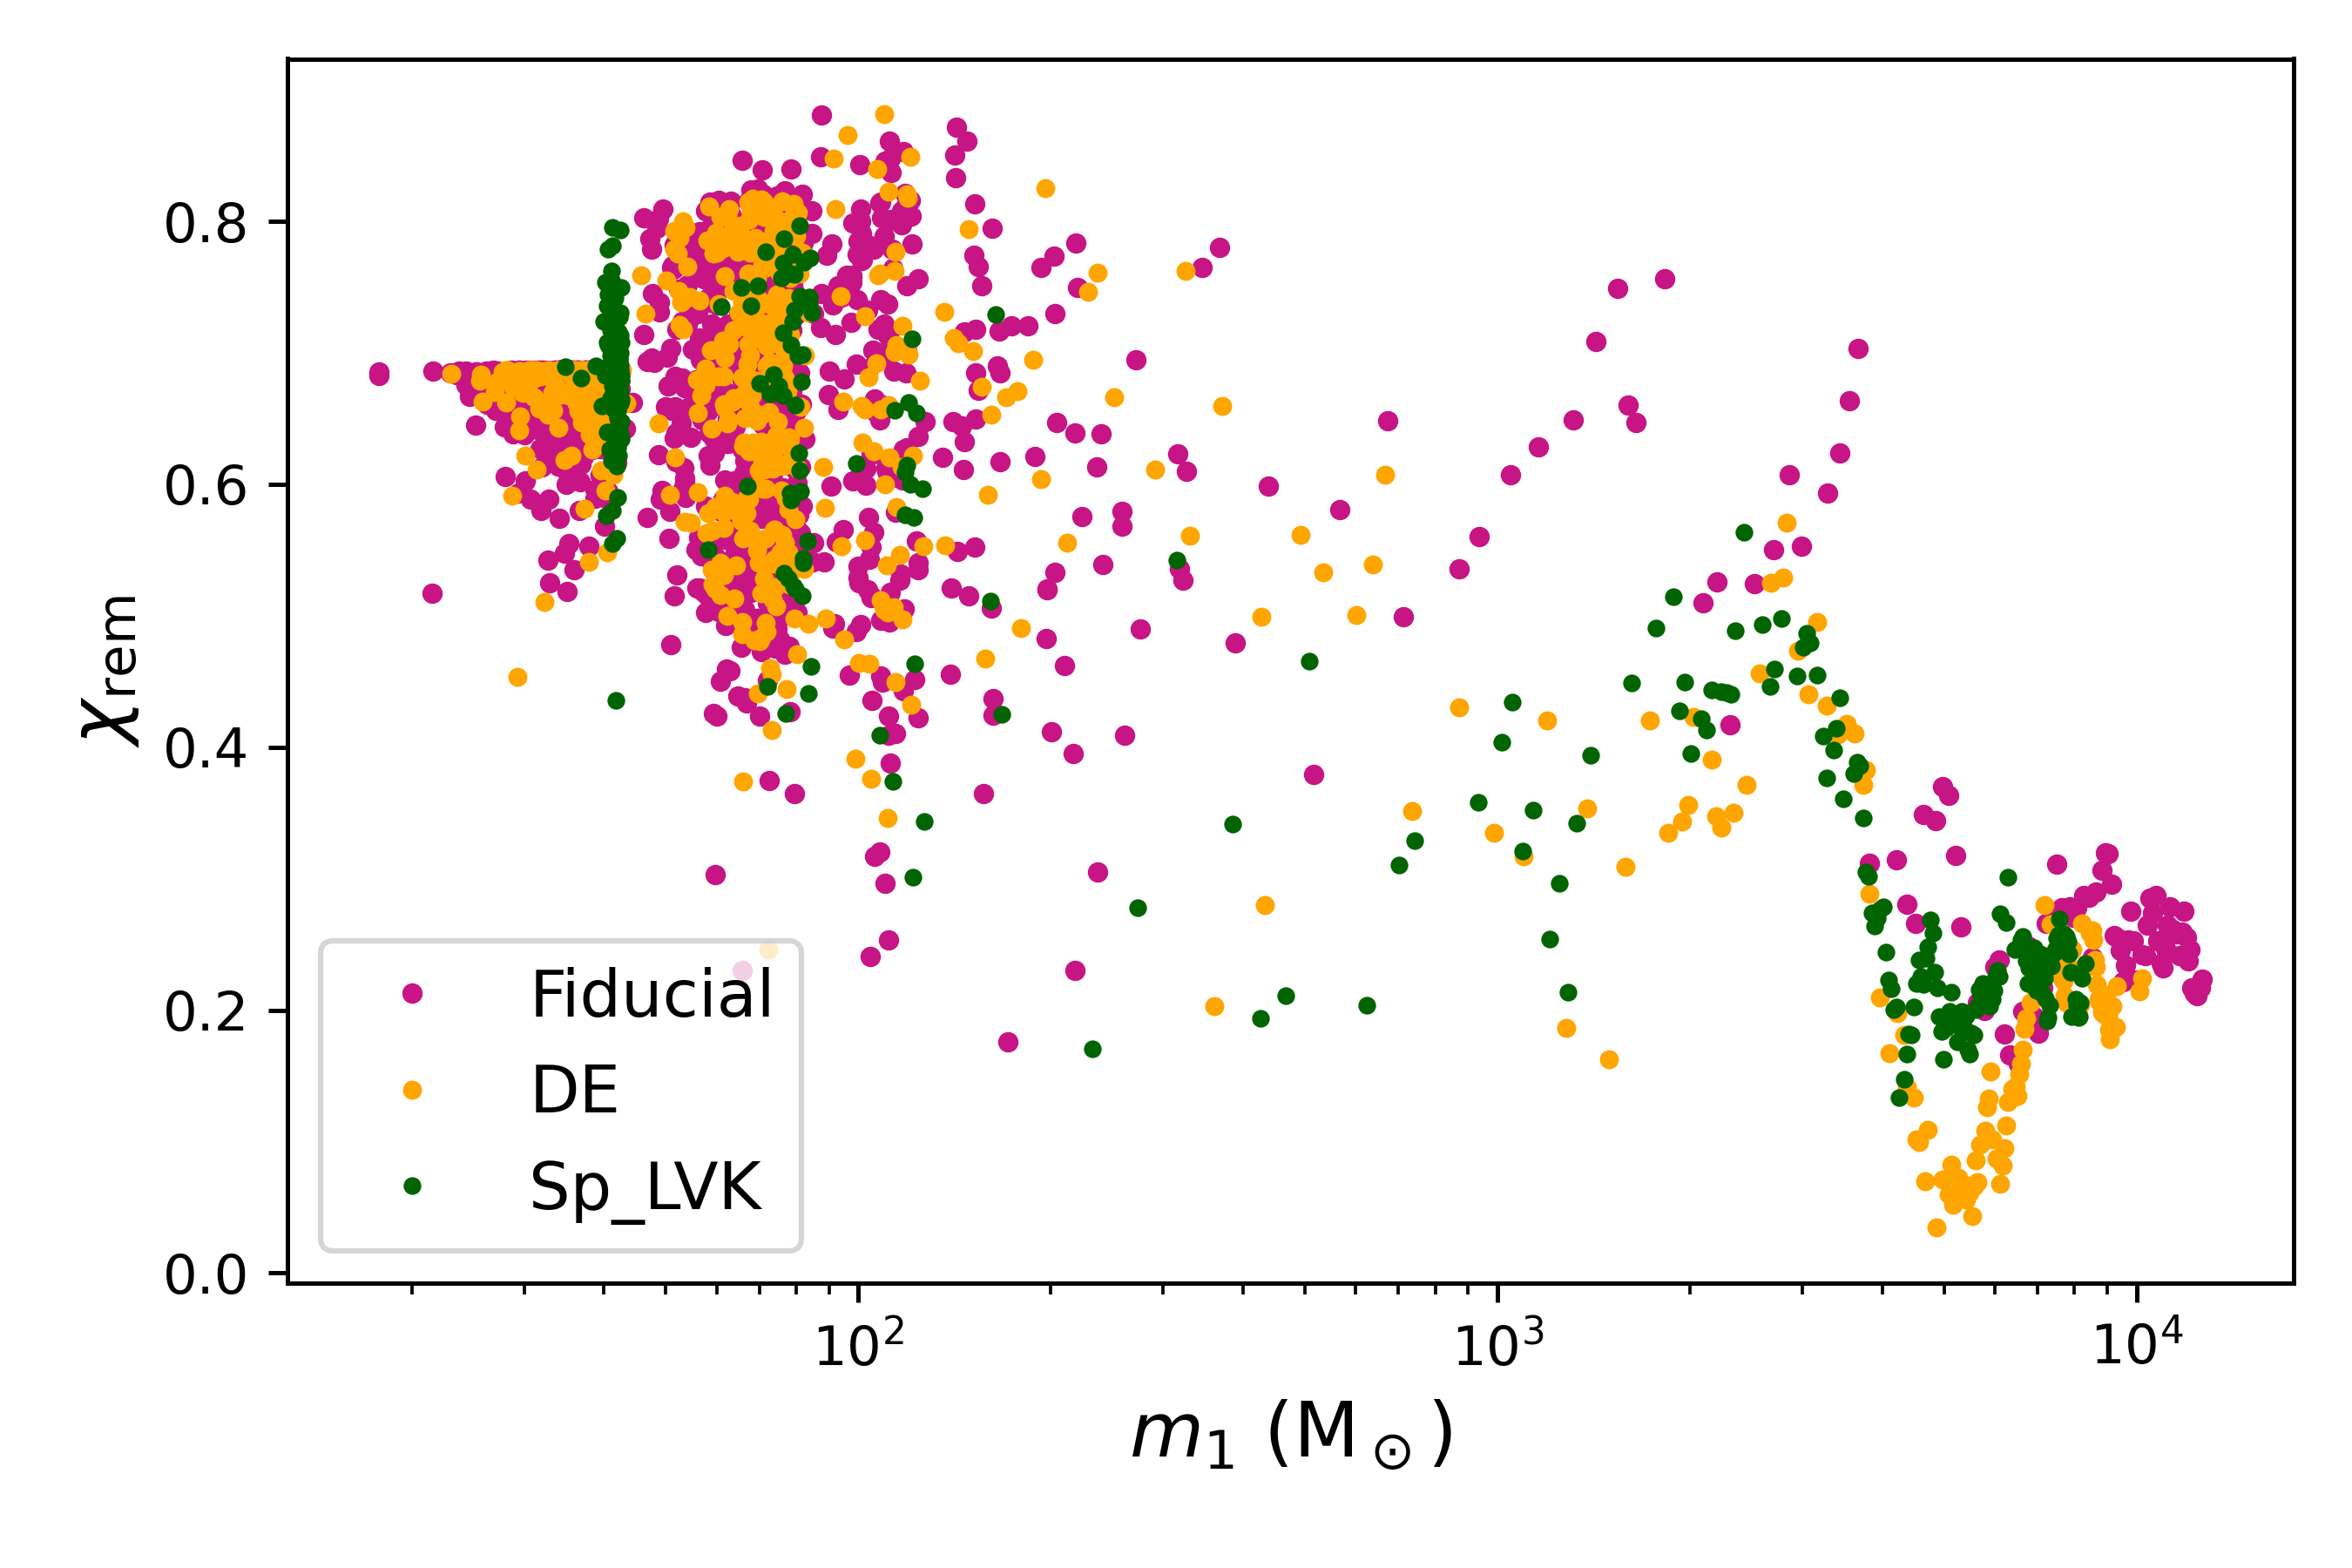
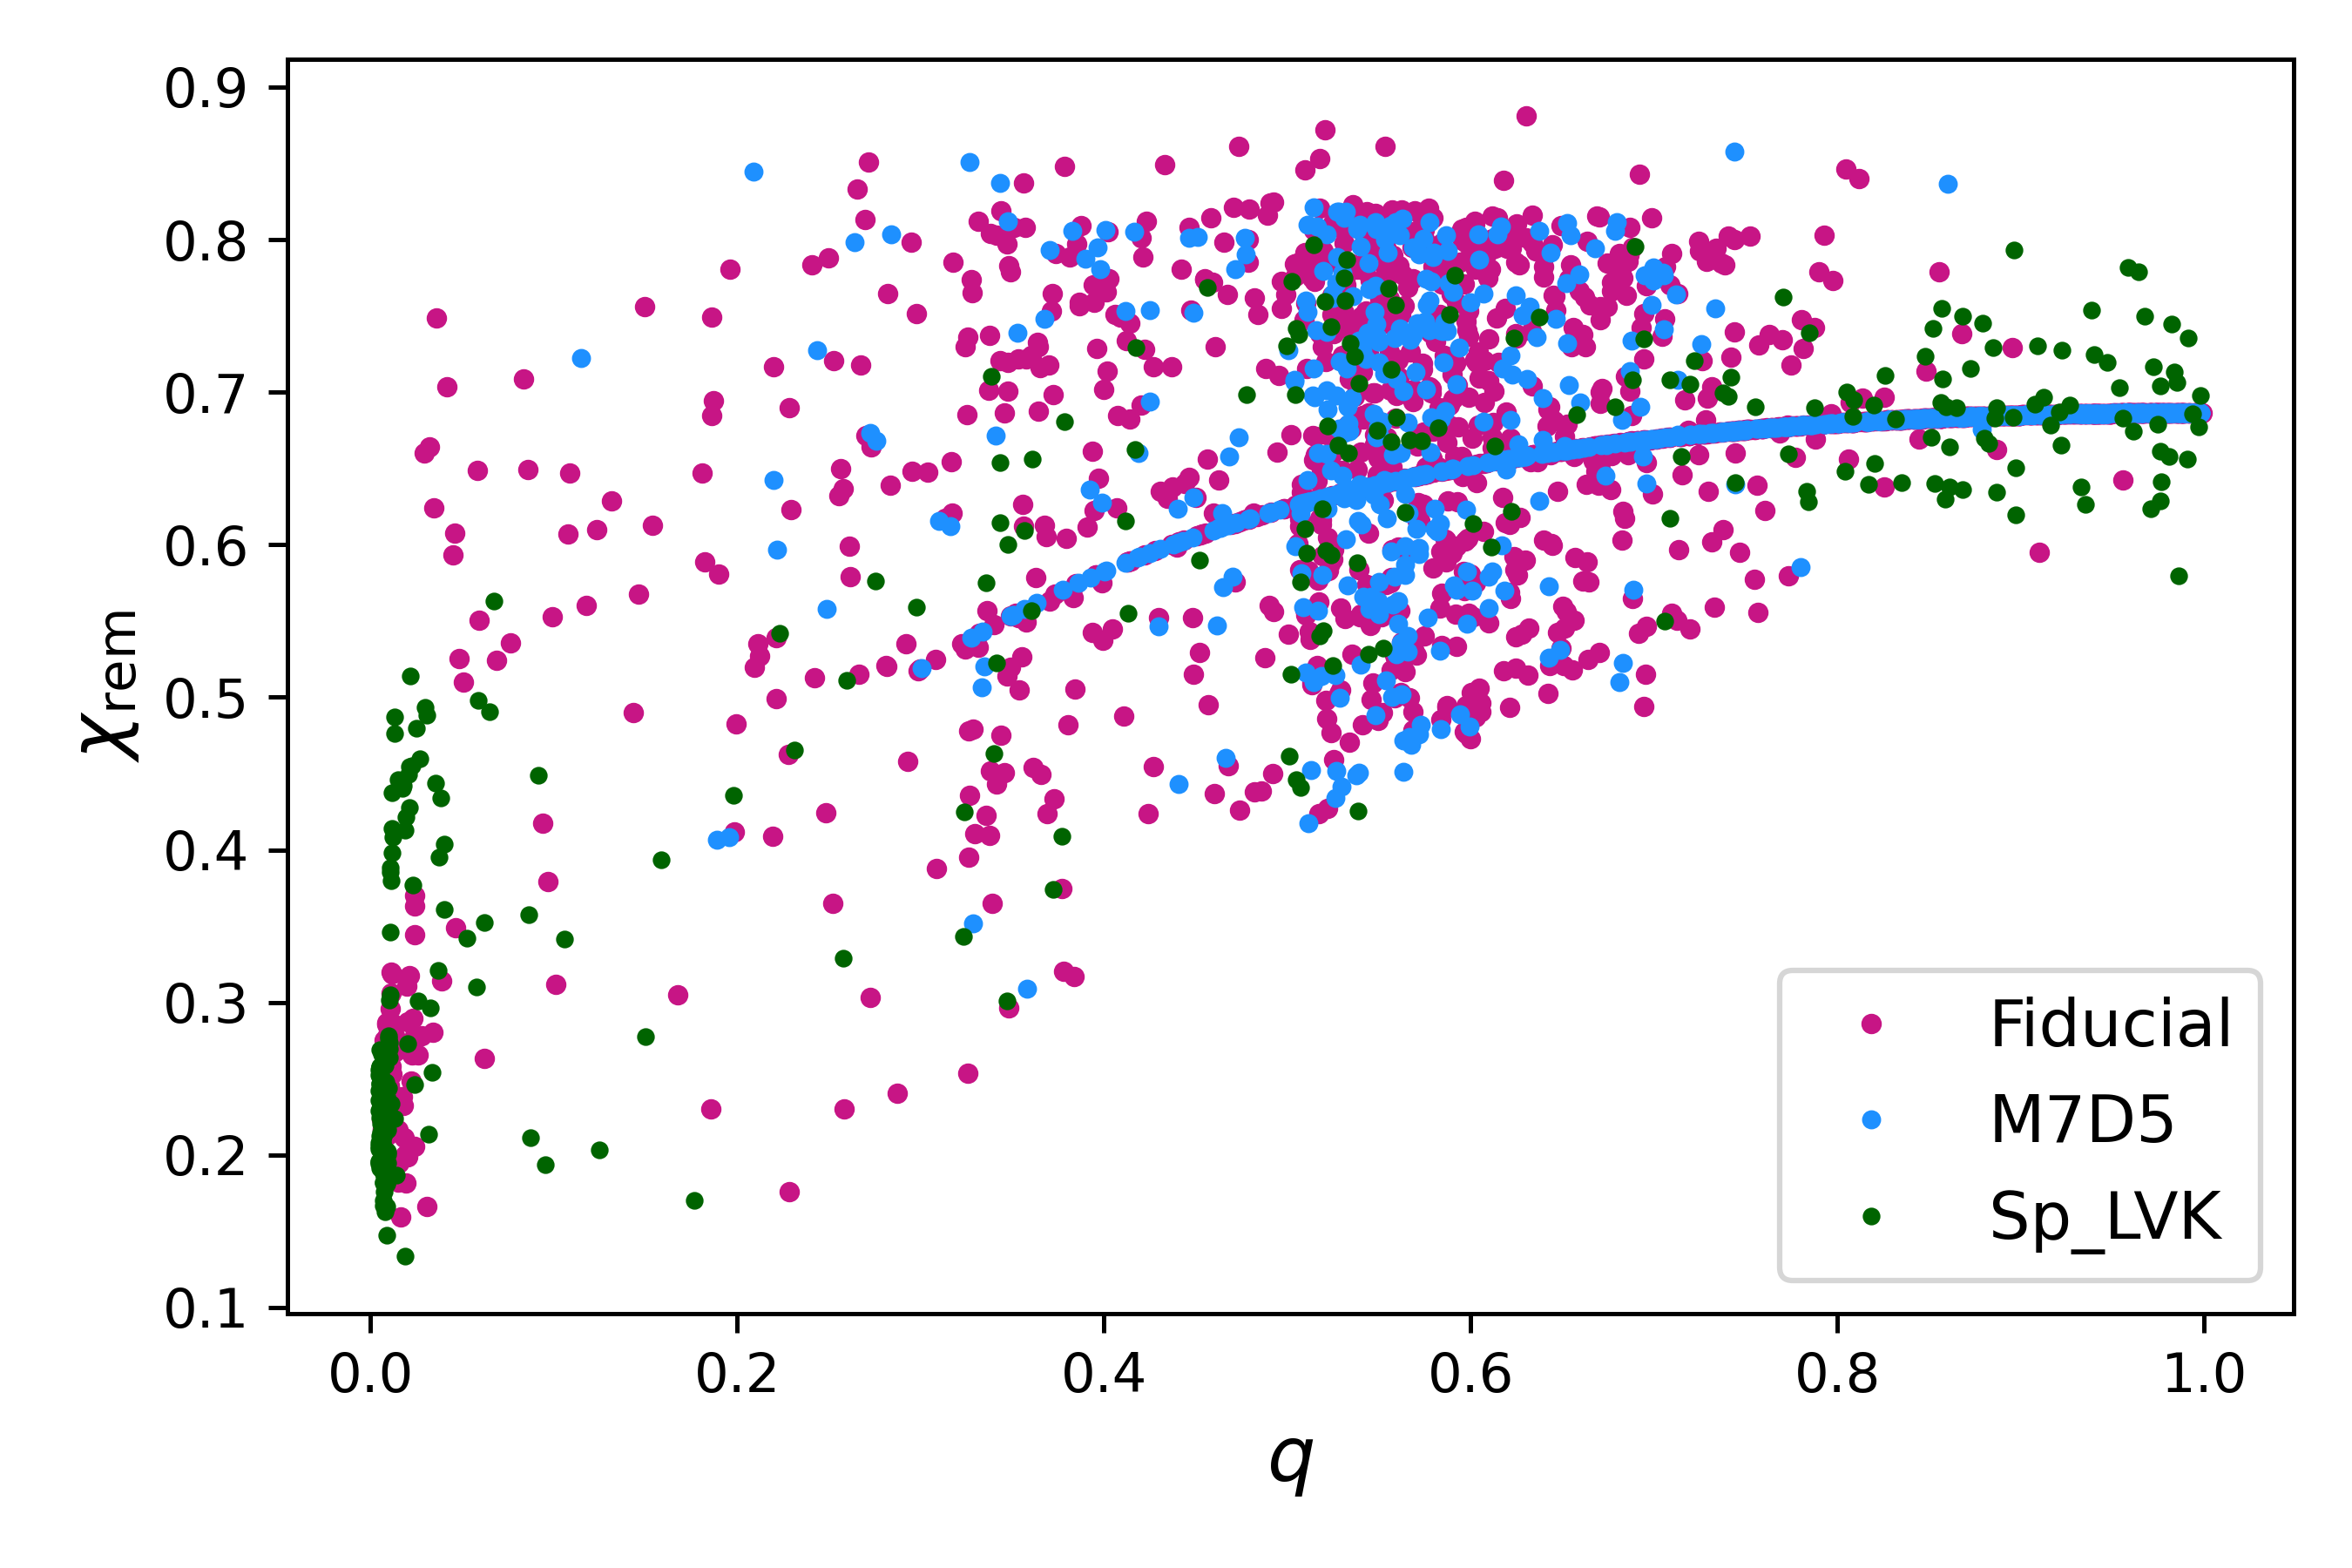
Fig. 5 shows as a function of and . As increases and decreases, the spin of the IMBH goes down. This feature is present in all our models; e.g., the Sp_LVK with its first generational rotating BHs shows hardly any difference in the final IMBH spin compared to Fiducial. The reason why the IMBH spin goes down is because it grows by merging with smaller BHs coming from random directions. After many mergers, the angular momentum of Equation 2, averages out, leading to a net decrease in .
Hence, reduces () with increasing primary mass, as illustrated in the upper panel of Fig. 5. The effect of on is further illustrated in the lower panel of Fig. 5, showing more symmetric masses indeed produce more rapidly-spinning remnants. In model M7D5, where the IMBHs are of low masses M⊙ and never reach M⊙, the distribution extends to higher values, as the mass ratio remains confined to relatively high values, within the range – . In contrast, the massive M⊙ IMBH in the Fiducial model produces mass ratios as low as , resulting in lower . The result is a double-peaked distribution of . IMBH remnants with masses have spins clustered near , while the largest IMBHs formed in our models have (see Table LABEL:tab:IMBHmass).
3.1.3 Eccentricity
While most DBHs formed in clusters are circularized by the time they merge, a small fraction of them will still have a significant eccentricity () when they reach the frequency band of current detectors (e.g., Antonini et al., 2014; Samsing, 2018; Rodriguez et al., 2018a; Rodriguez et al., 2018b). It has been argued that eccentric mergers are the most robust signature of DBH formation via the dynamical channel, and that a sub-population of eccentric binaries could help to resolve the branching fraction between isolated and dynamical DBH formation channels (e.g., Lower et al., 2018; Romero-Shaw et al., 2021; Zevin et al., 2021; Romero-Shaw et al., 2022b; Dall’Amico et al., 2023).
Samsing (2018) (see Fig. 2) shows that while binary-single hardening can potentially harden a binary to ejection before it merges or to merge within the cluster, inclusion of 2.5PN terms in the orbital evolution can also lead to gravitation-wave capture during the binary-single resonant encounter. Eq. 2 of Antonini et al. (2023), which states the condition of a gravitational-wave capture, can be rewritten as
| (5) |
where , , and are the BH binary eccentricity, primary mass, mass ratio, separation respectively, while is a normalisation constant of the order of unity. By this condition, higher , , and smaller ensure gravitational-wave capture.
The peak frequency of a DBH of total mass , orbital separation and eccentricity is calculated by Wen (2003) as
| (6) |
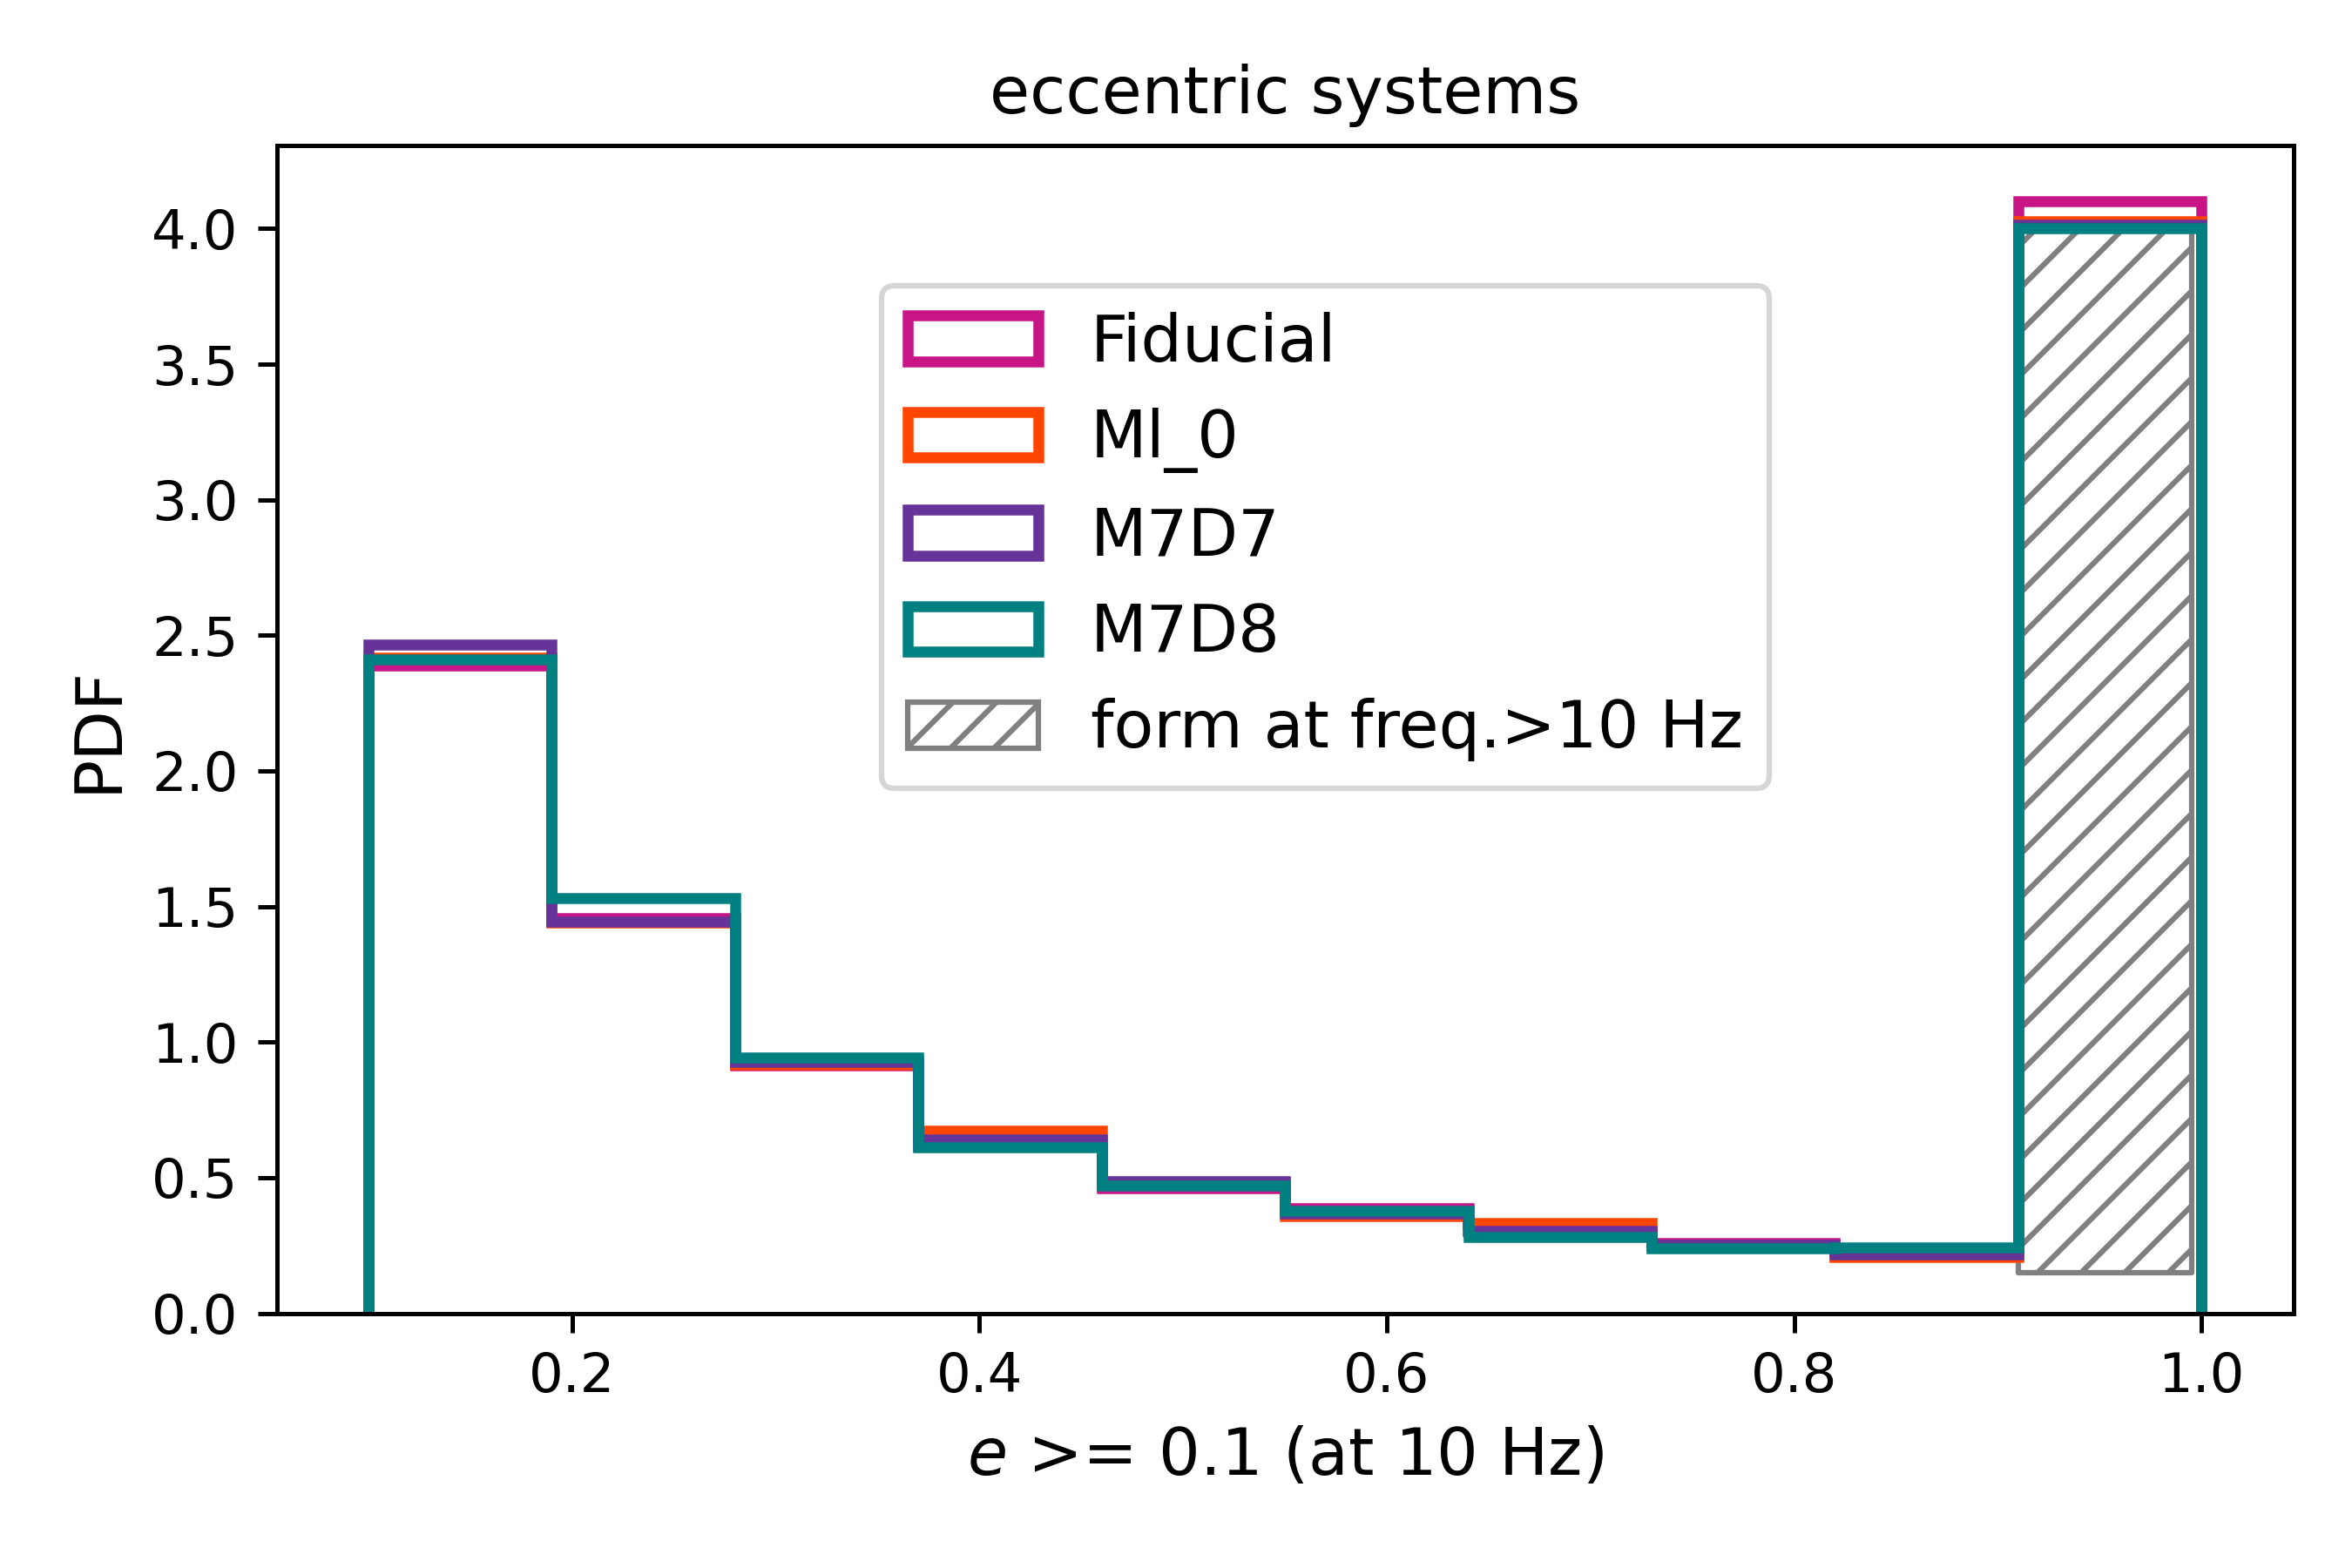
We define a BH binary merger to be eccentric if, at a gravitational-wave frequency of Hz (corresponding roughly to the low-frequency limit of the LVK band), . All eccentric mergers are expected to be in-situ mergers, as ex-situ systems that are ejected from the influence of dynamical activity have larger time delays and circularize by the time they merge (e.g., Chattopadhyay et al., 2022a). We find that about of all mergers in the Fiducial model are eccentric, and about one-third of these mergers become bound within the LVK band. This sub-group of eccentric binaries that form at frequencies Hz at the source frame, will be called “high-frequency mergers” from here onward. All of the high-frequency mergers and about of the eccentric mergers are gravitational-wave captures.
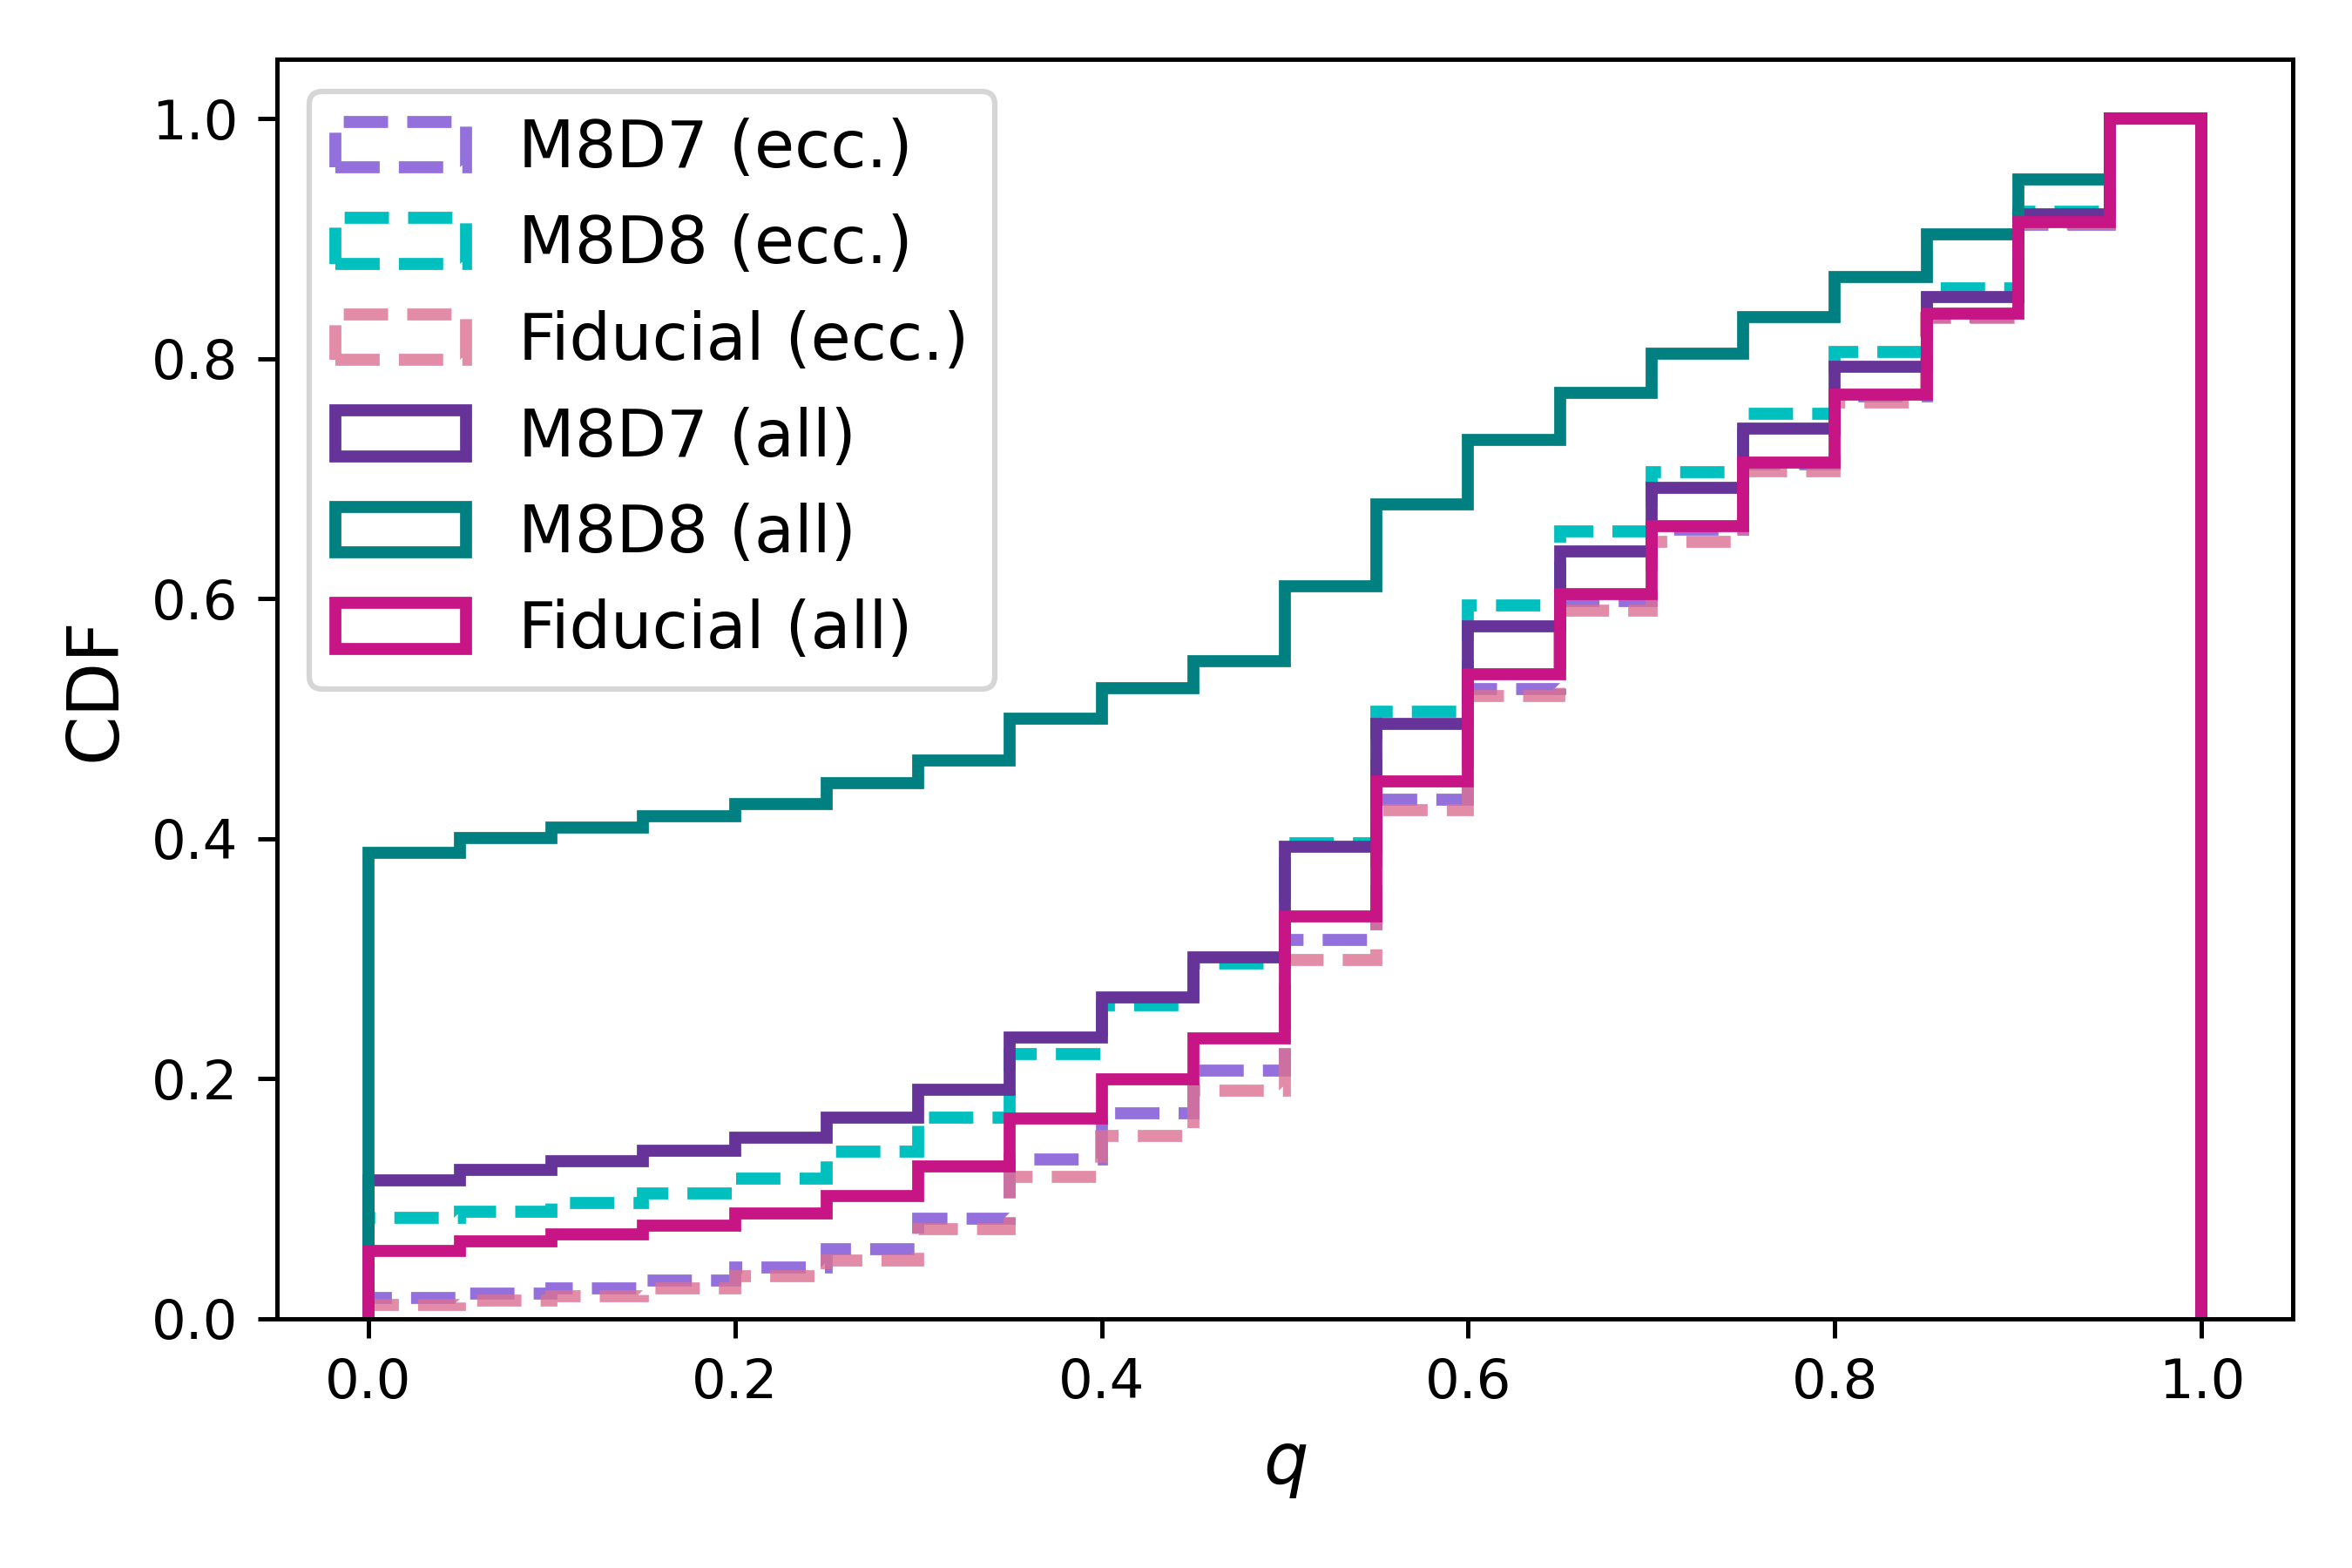
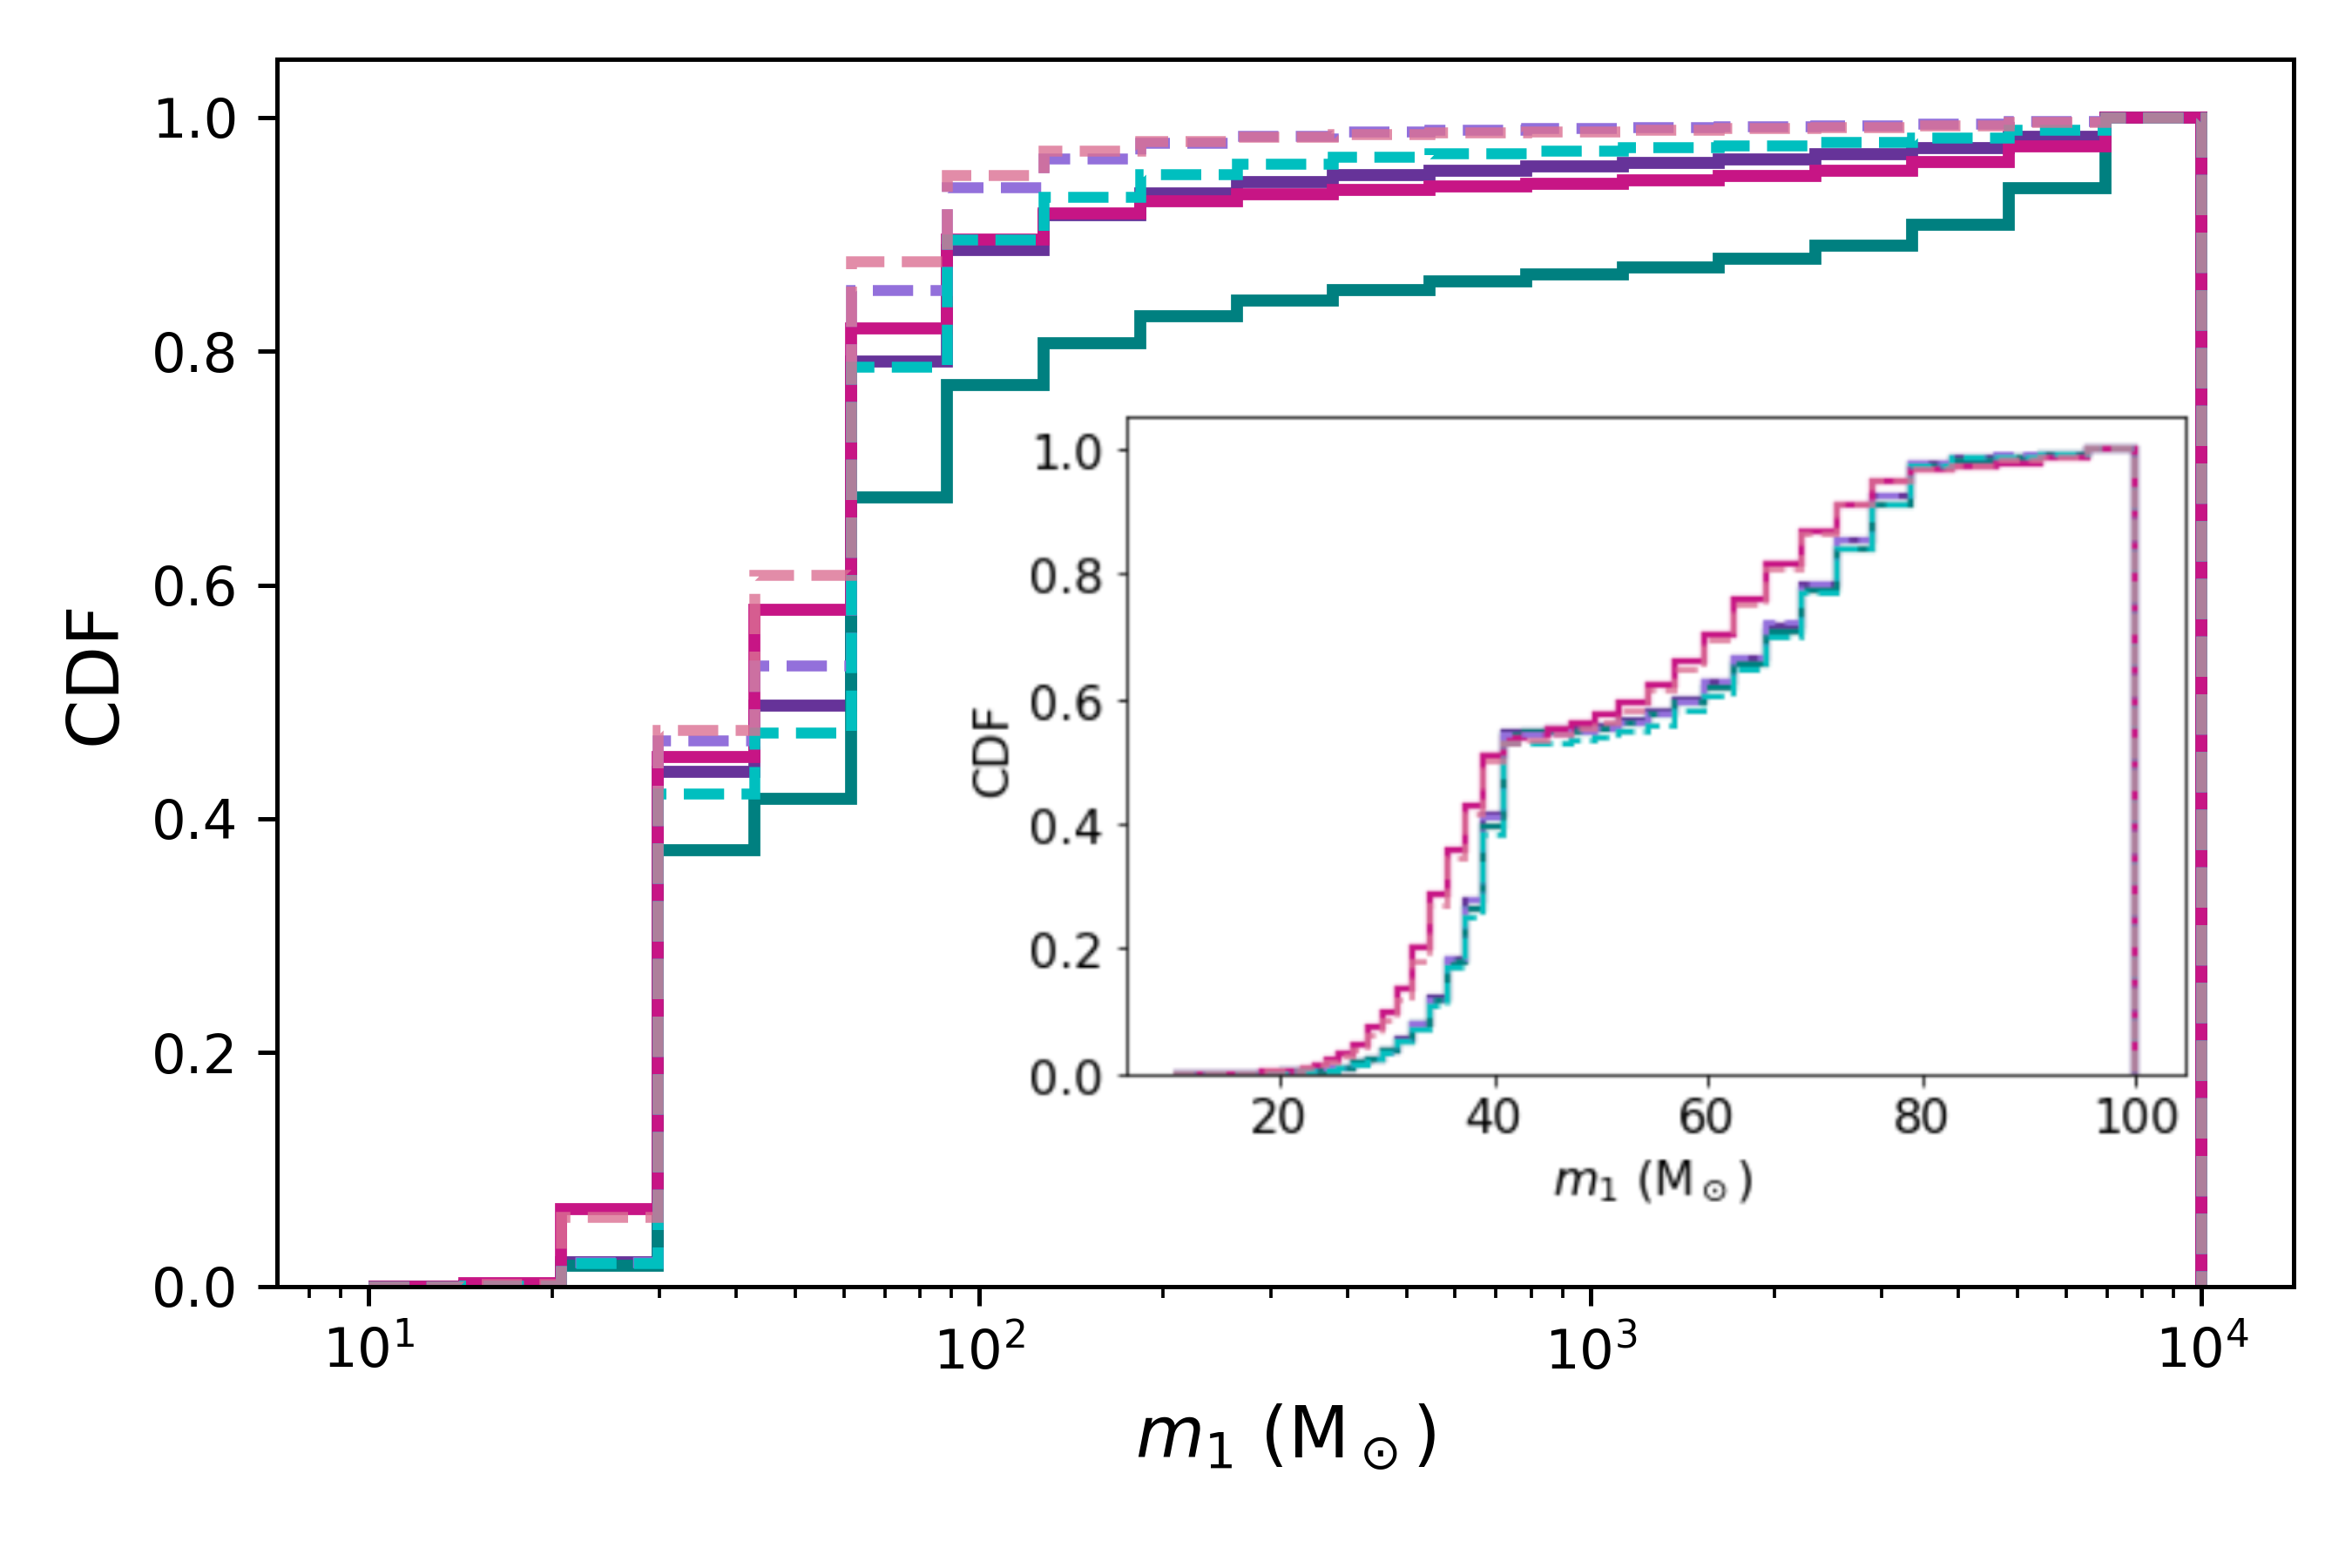
Younger clusters also provide lower-mass BHs and, when no IMBH is present to dominate the cluster dynamics, eccentric mergers become commonplace between nearly-equal-mass BHs. The top panel of Fig. 6 shows the mass ratio distribution of the eccentric versus all mergers (marked “all" in the figure) , illustrating that indeed eccentric mergers occur preferentially in more equal mass systems. Since a lower value for both and is preferred in captures, low mass primaries are more frequent in eccentric mergers than IMBHs. The lower panel of Fig. 6 demonstrates the trend for eccentric mergers to have less massive . In the inset plot, we compare the distribution for masses M⊙; there is barely any difference between the distributions for eccentric DBH mergers and the total population of DBH mergers, demonstrating that the difference arises due to circularised mergers involving the IMBH. The distribution at a gravitational-wave frequency of Hz for eccentric binaries, together with the high-frequency mergers, is shown in Fig. 7, illustrating that the eccentricity distribution itself is nearly indistinguishable from model-to-model.
Eccentric DBHs are also expected to have shorter time delays between formation and merger, as a consequence of (i) gravitational-wave captures occurring early in the cluster’s life when the velocity dispersion is large, causing the hard-soft binary separation limit (and hence the semi-major axes of the merging DBHs) to be small (); and (ii) high , significantly reducing the merger time of DBHs (Peters, 1964). In practice, robustly measuring the eccentricity of systems that form outside the LVK band but still retain at detection is challenging; this is largely due to a lack of waveform models containing the effects of both orbital eccentricity and spin-induced orbital precession, which can lead to confusion between these two parameters (Romero-Shaw et al., 2020), especially when only a few orbital cycles are visible in-band (Romero-Shaw et al., 2023). Very high- systems that form inside the LVK band will produce gravitational-wave bursts, which are more likely to be visible in unmodelled burst searches than with pipelines that search based on templates of circularised compact binary coalescences (Gondán et al., 2018; Loutrel, 2020; Romero-Shaw et al., 2022a).
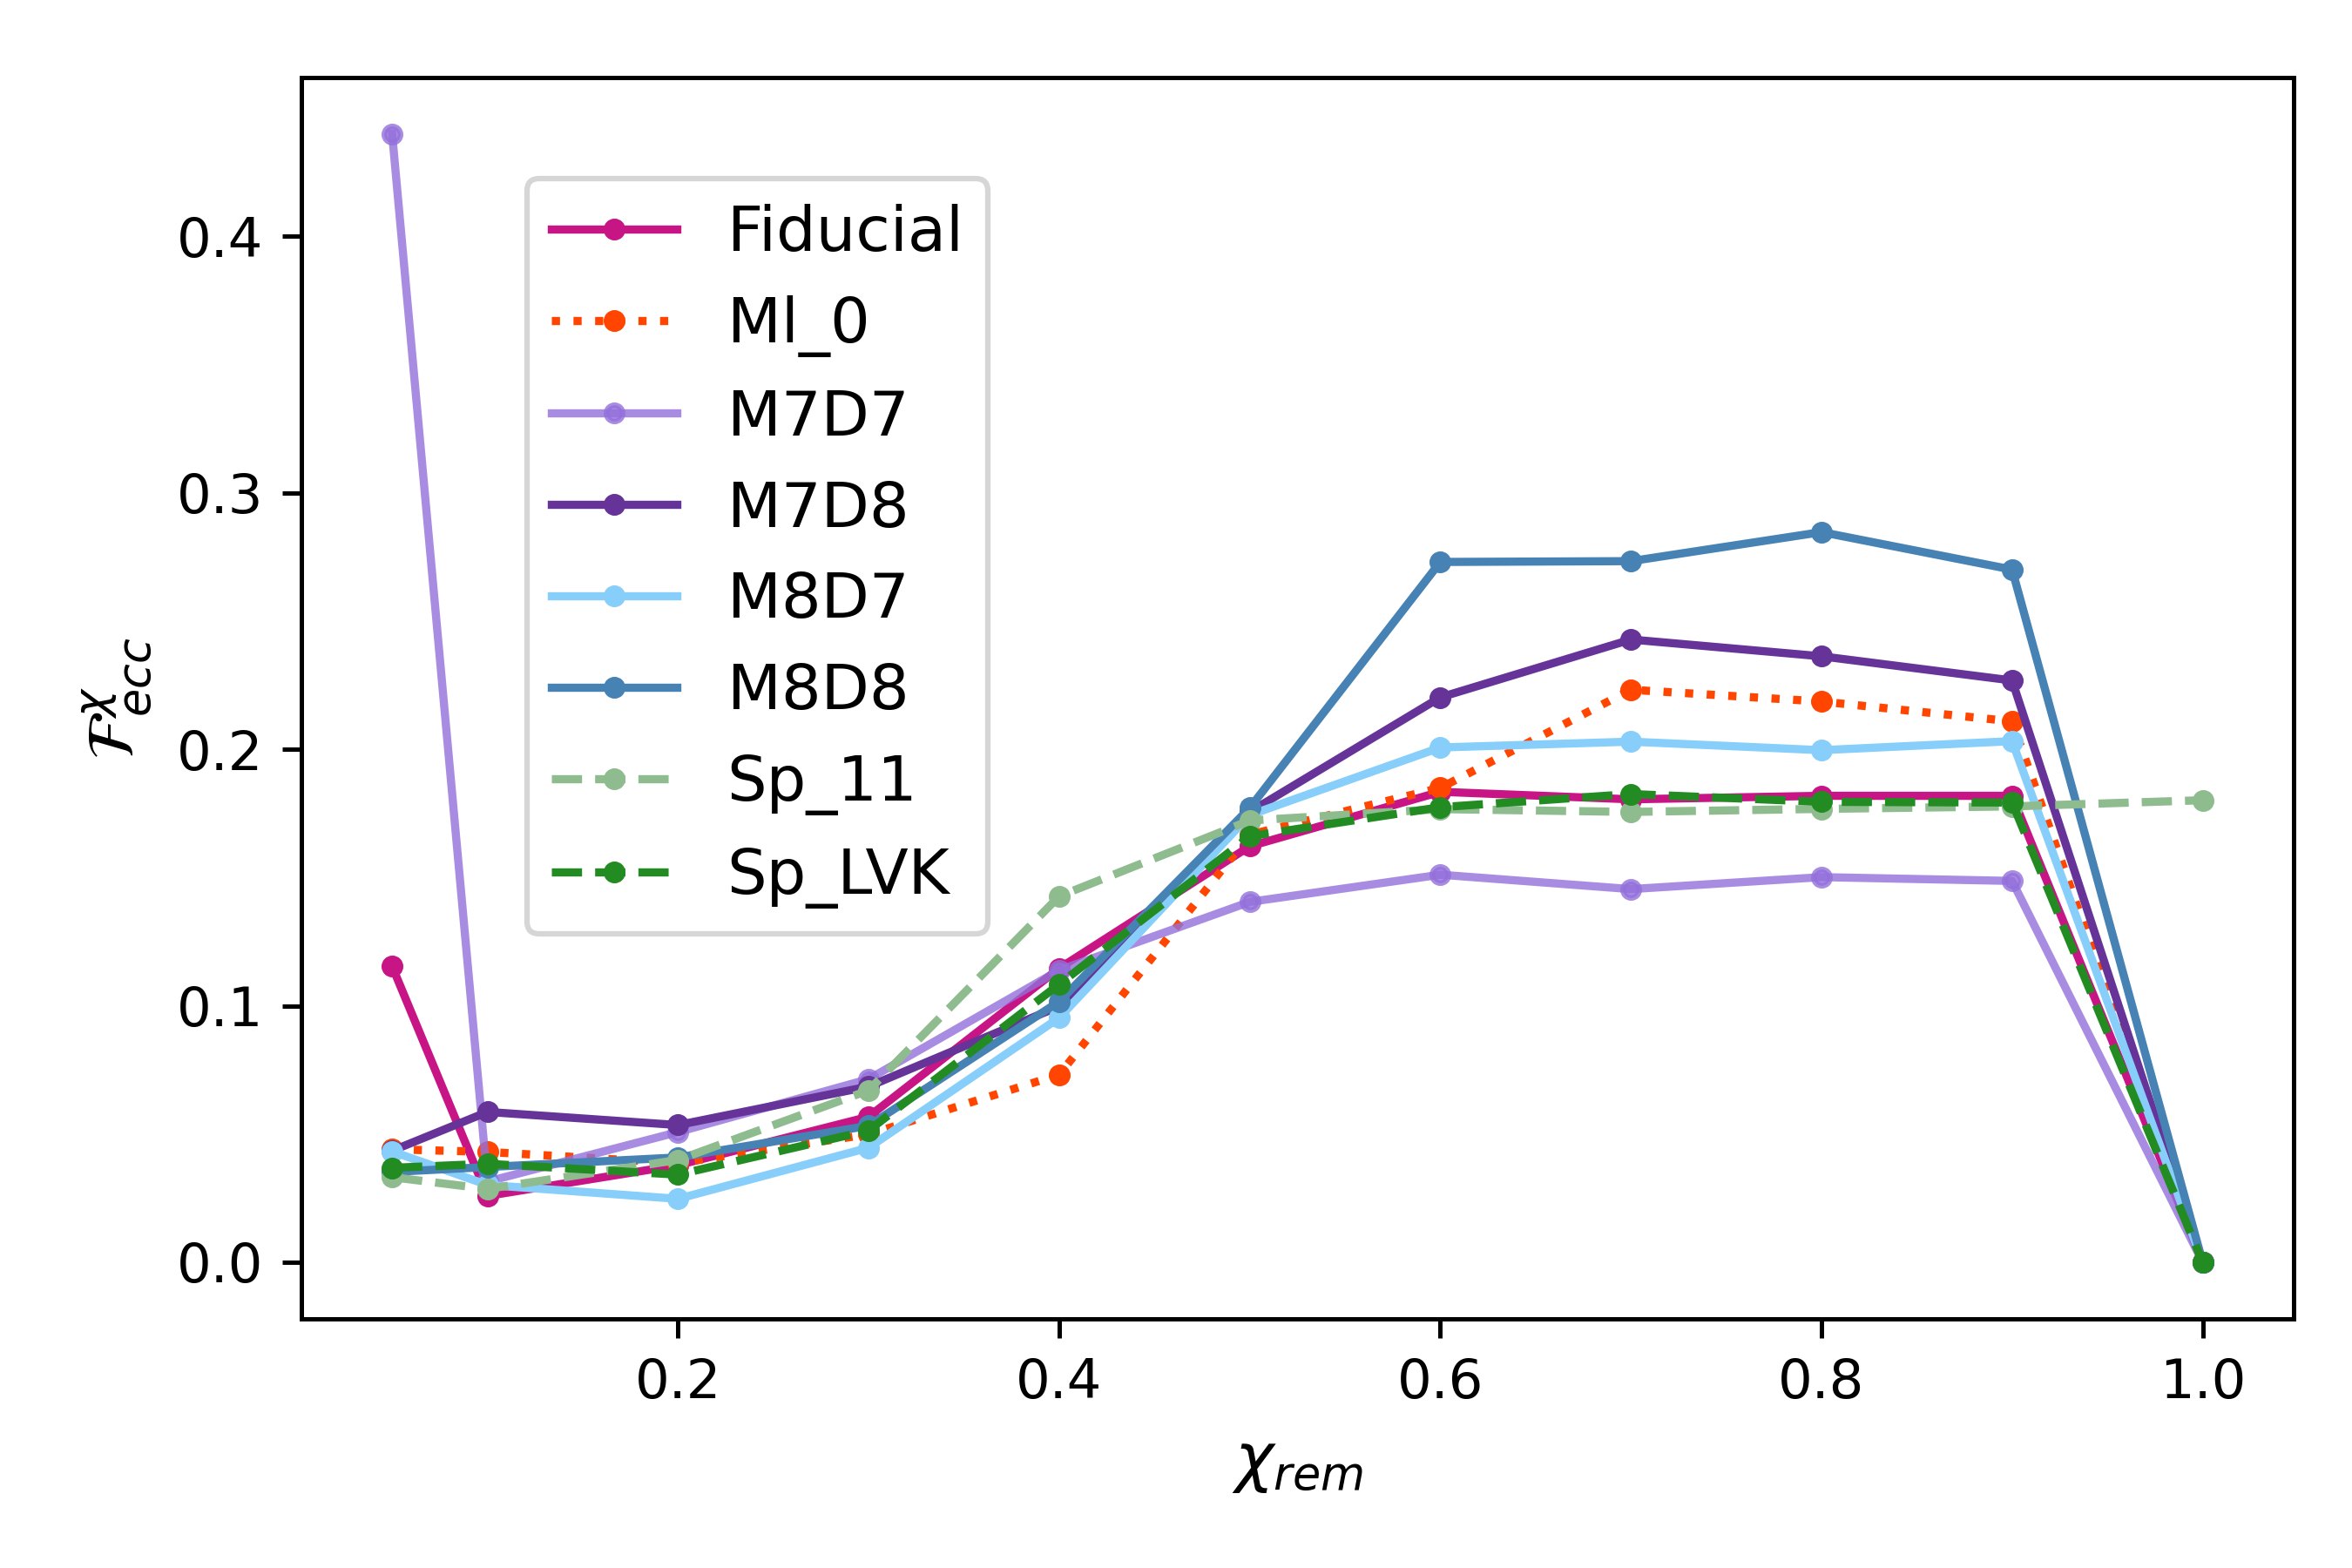
Since gravitational-wave captures are more likely to occur in near-symmetric mass DBHs frequenting young massive clusters, eccentric DBHs are naturally biased towards first and second generation mergers. Thus we would expect to see a correlation between spin and eccentricity. This correlation is illustrated in Fig. 8 where we show for each bin of , the fraction of mergers that have an eccentricity at Hz (top panel). In the figure, with the total number of mergers in a given bin and the corresponding number of eccentric mergers. This distribution shows that eccentric binaries are relatively more common in mergers that result in a remnant with a high spin . In this range of remnant spins, we expect that about of the binaries are still eccentric within the Hz frequency window.
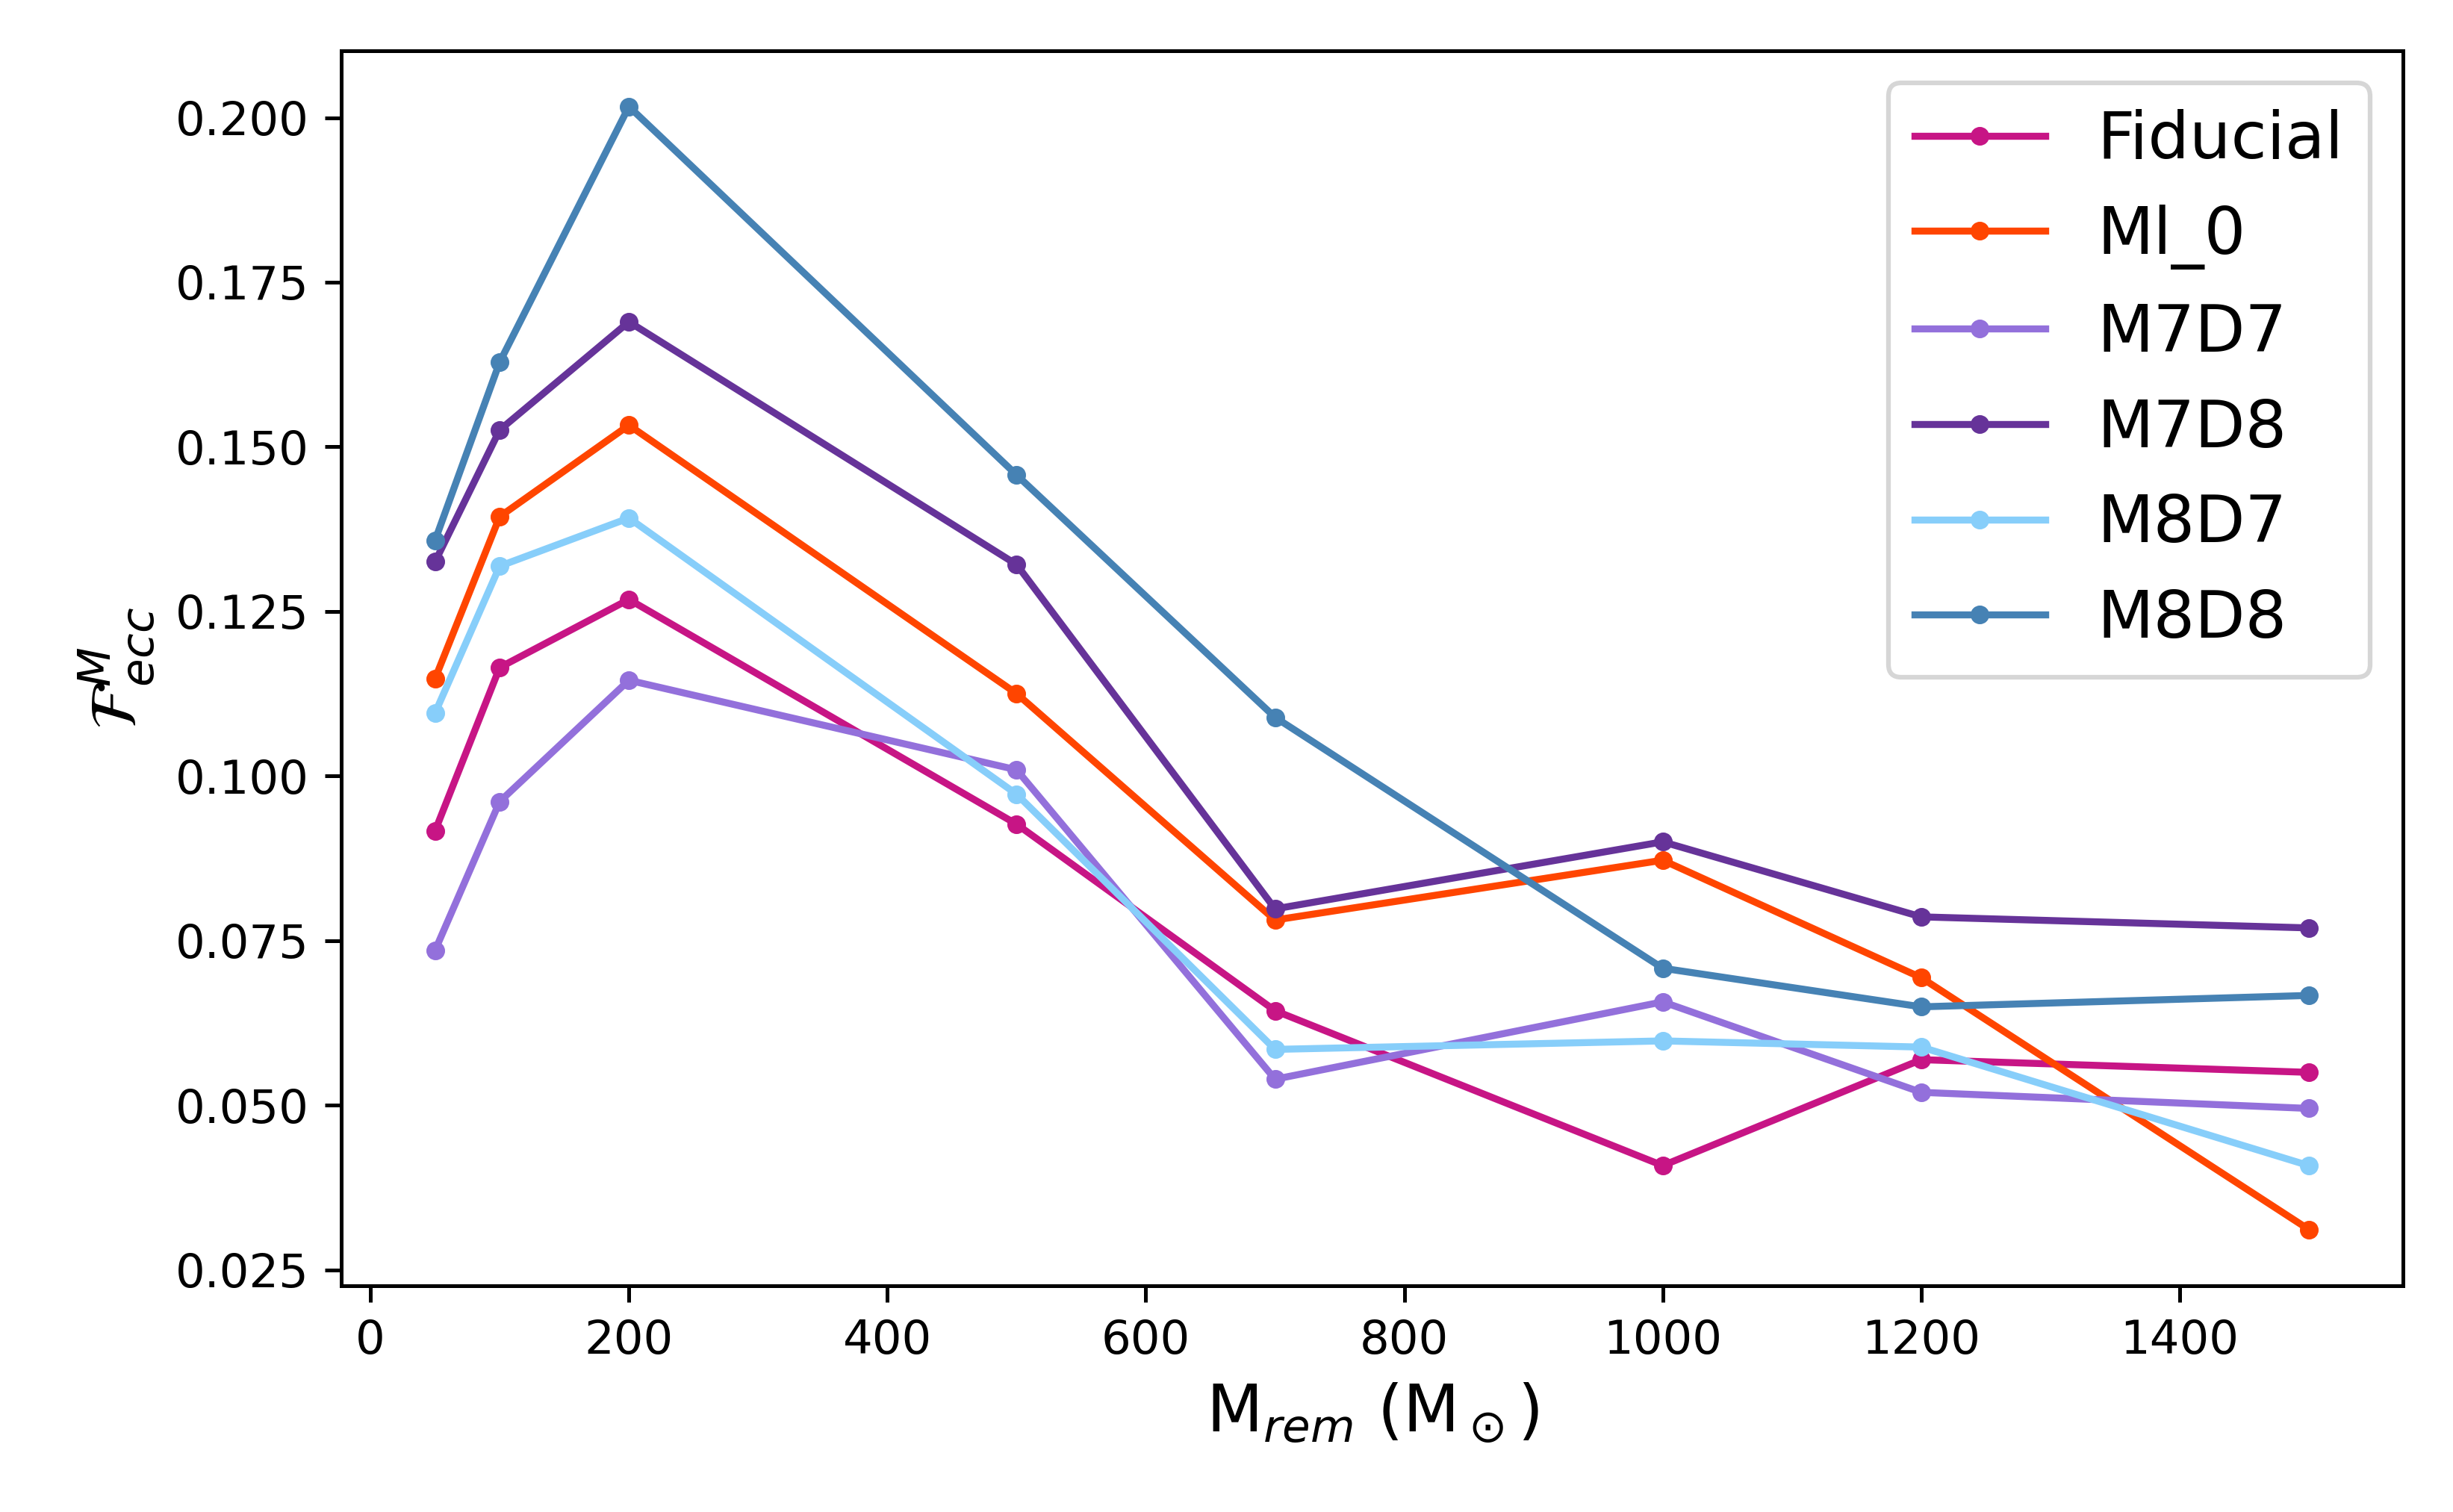
The value of varies from model to model, with densest clusters (M7D8, M8D8) and more massive clusters (M8D8, M8D7) producing more eccentric mergers, since dense and massive clusters have a higher and hence . Model Ml_0, which has no mass-loss apart from BH ejections, remains denser and more massive than Fiducial and hence has a higher . The initial spin distribution appears to have no strong impact on ; the distributions from models Sp_11 and Sp_LVK follow the distribution from the Fiducial model closely in Fig. 8. Indeed, the general nature of the curve does not change, implying that irrespective of models, eccentric mergers are mainly first- or sometimes second-generation mergers.
The general eccentric merger fraction is tabulated in the penultimate column of Tab. LABEL:tab:IMBHmass, demonstrating that denser clusters have more eccentric mergers. Metallicity also appears to play a role in determining . Metal-rich model Z_100, in which nearly of the DBH mergers are eccentric, has a narrower initial BH mass spectrum due to the increased metallicity; this increases the efficiency of eccentric DBH formation, since the condition of lower- and nearly-equal mass BH binaries is satisfied relatively easily and is aided by the delayed formation of IMBHs (this is similar to the upper limit of eccentric mergers that Antonini et al., 2016, finds; albeit for Lidov-Kozai mechanism in globular clusters). This implies that eccentric mergers are more frequent in the metal-rich dynamical environments of the local universe, opening exciting avenues for future runs of current ground-based detectors.
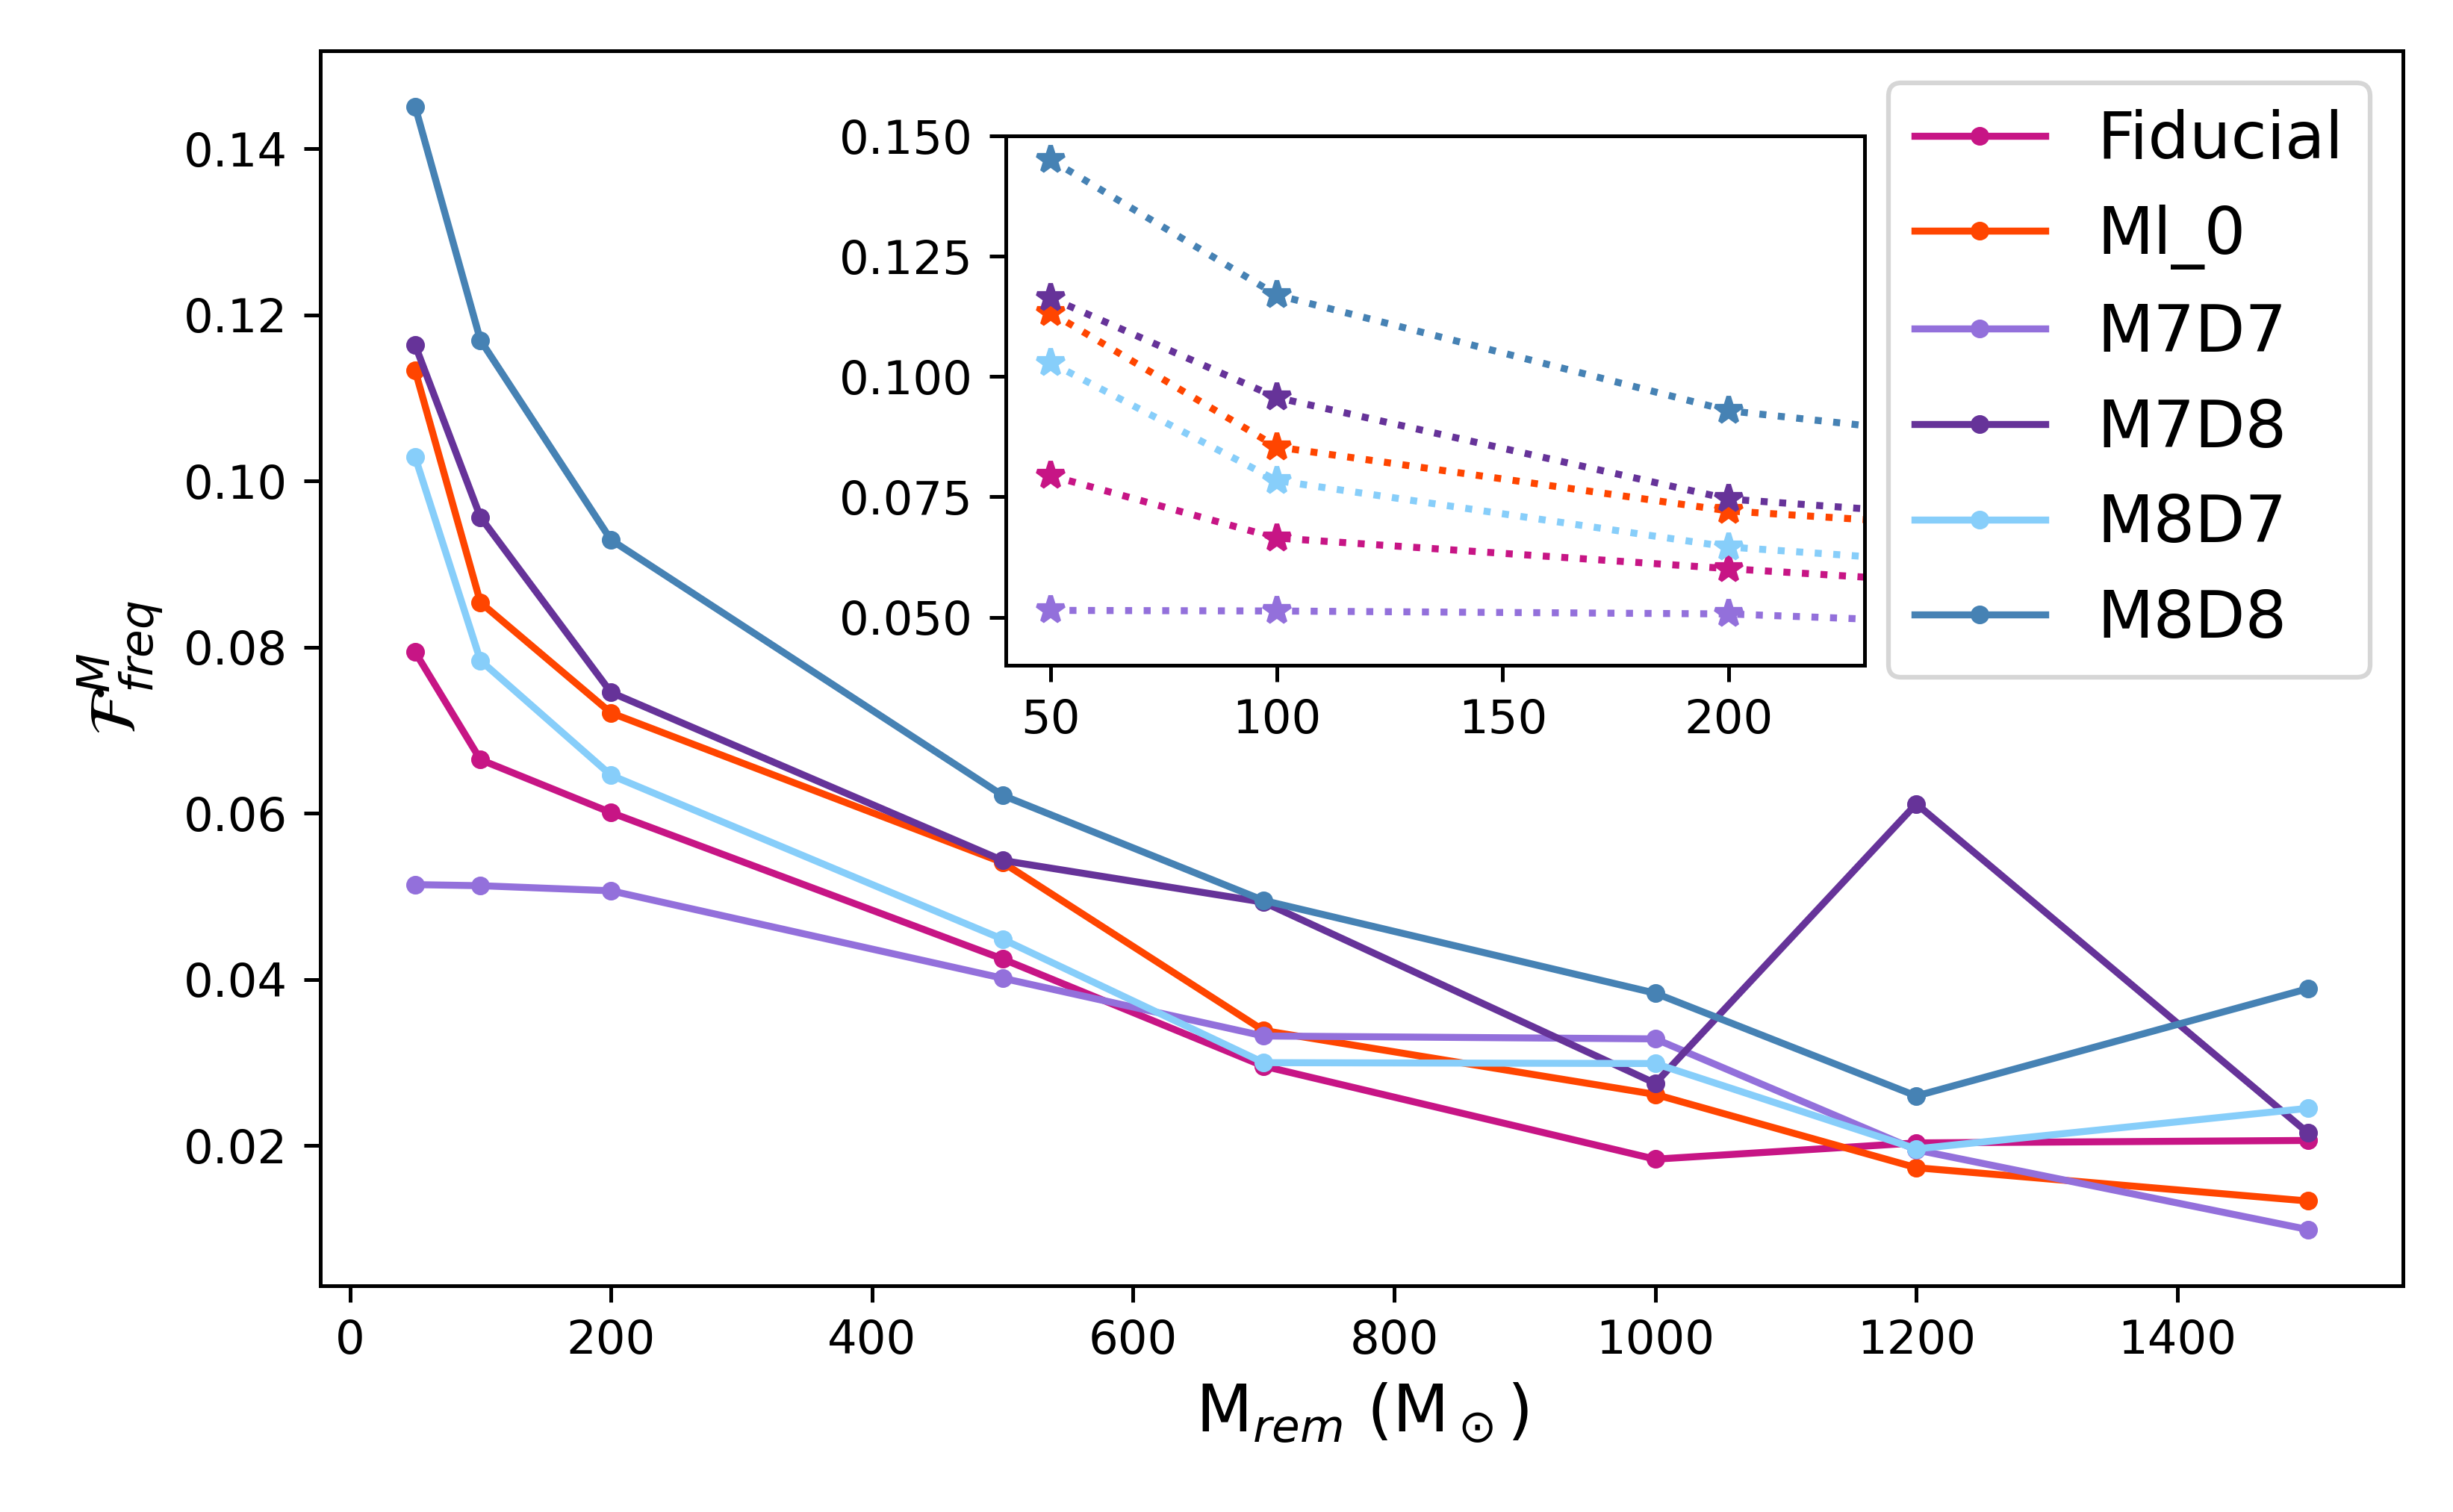
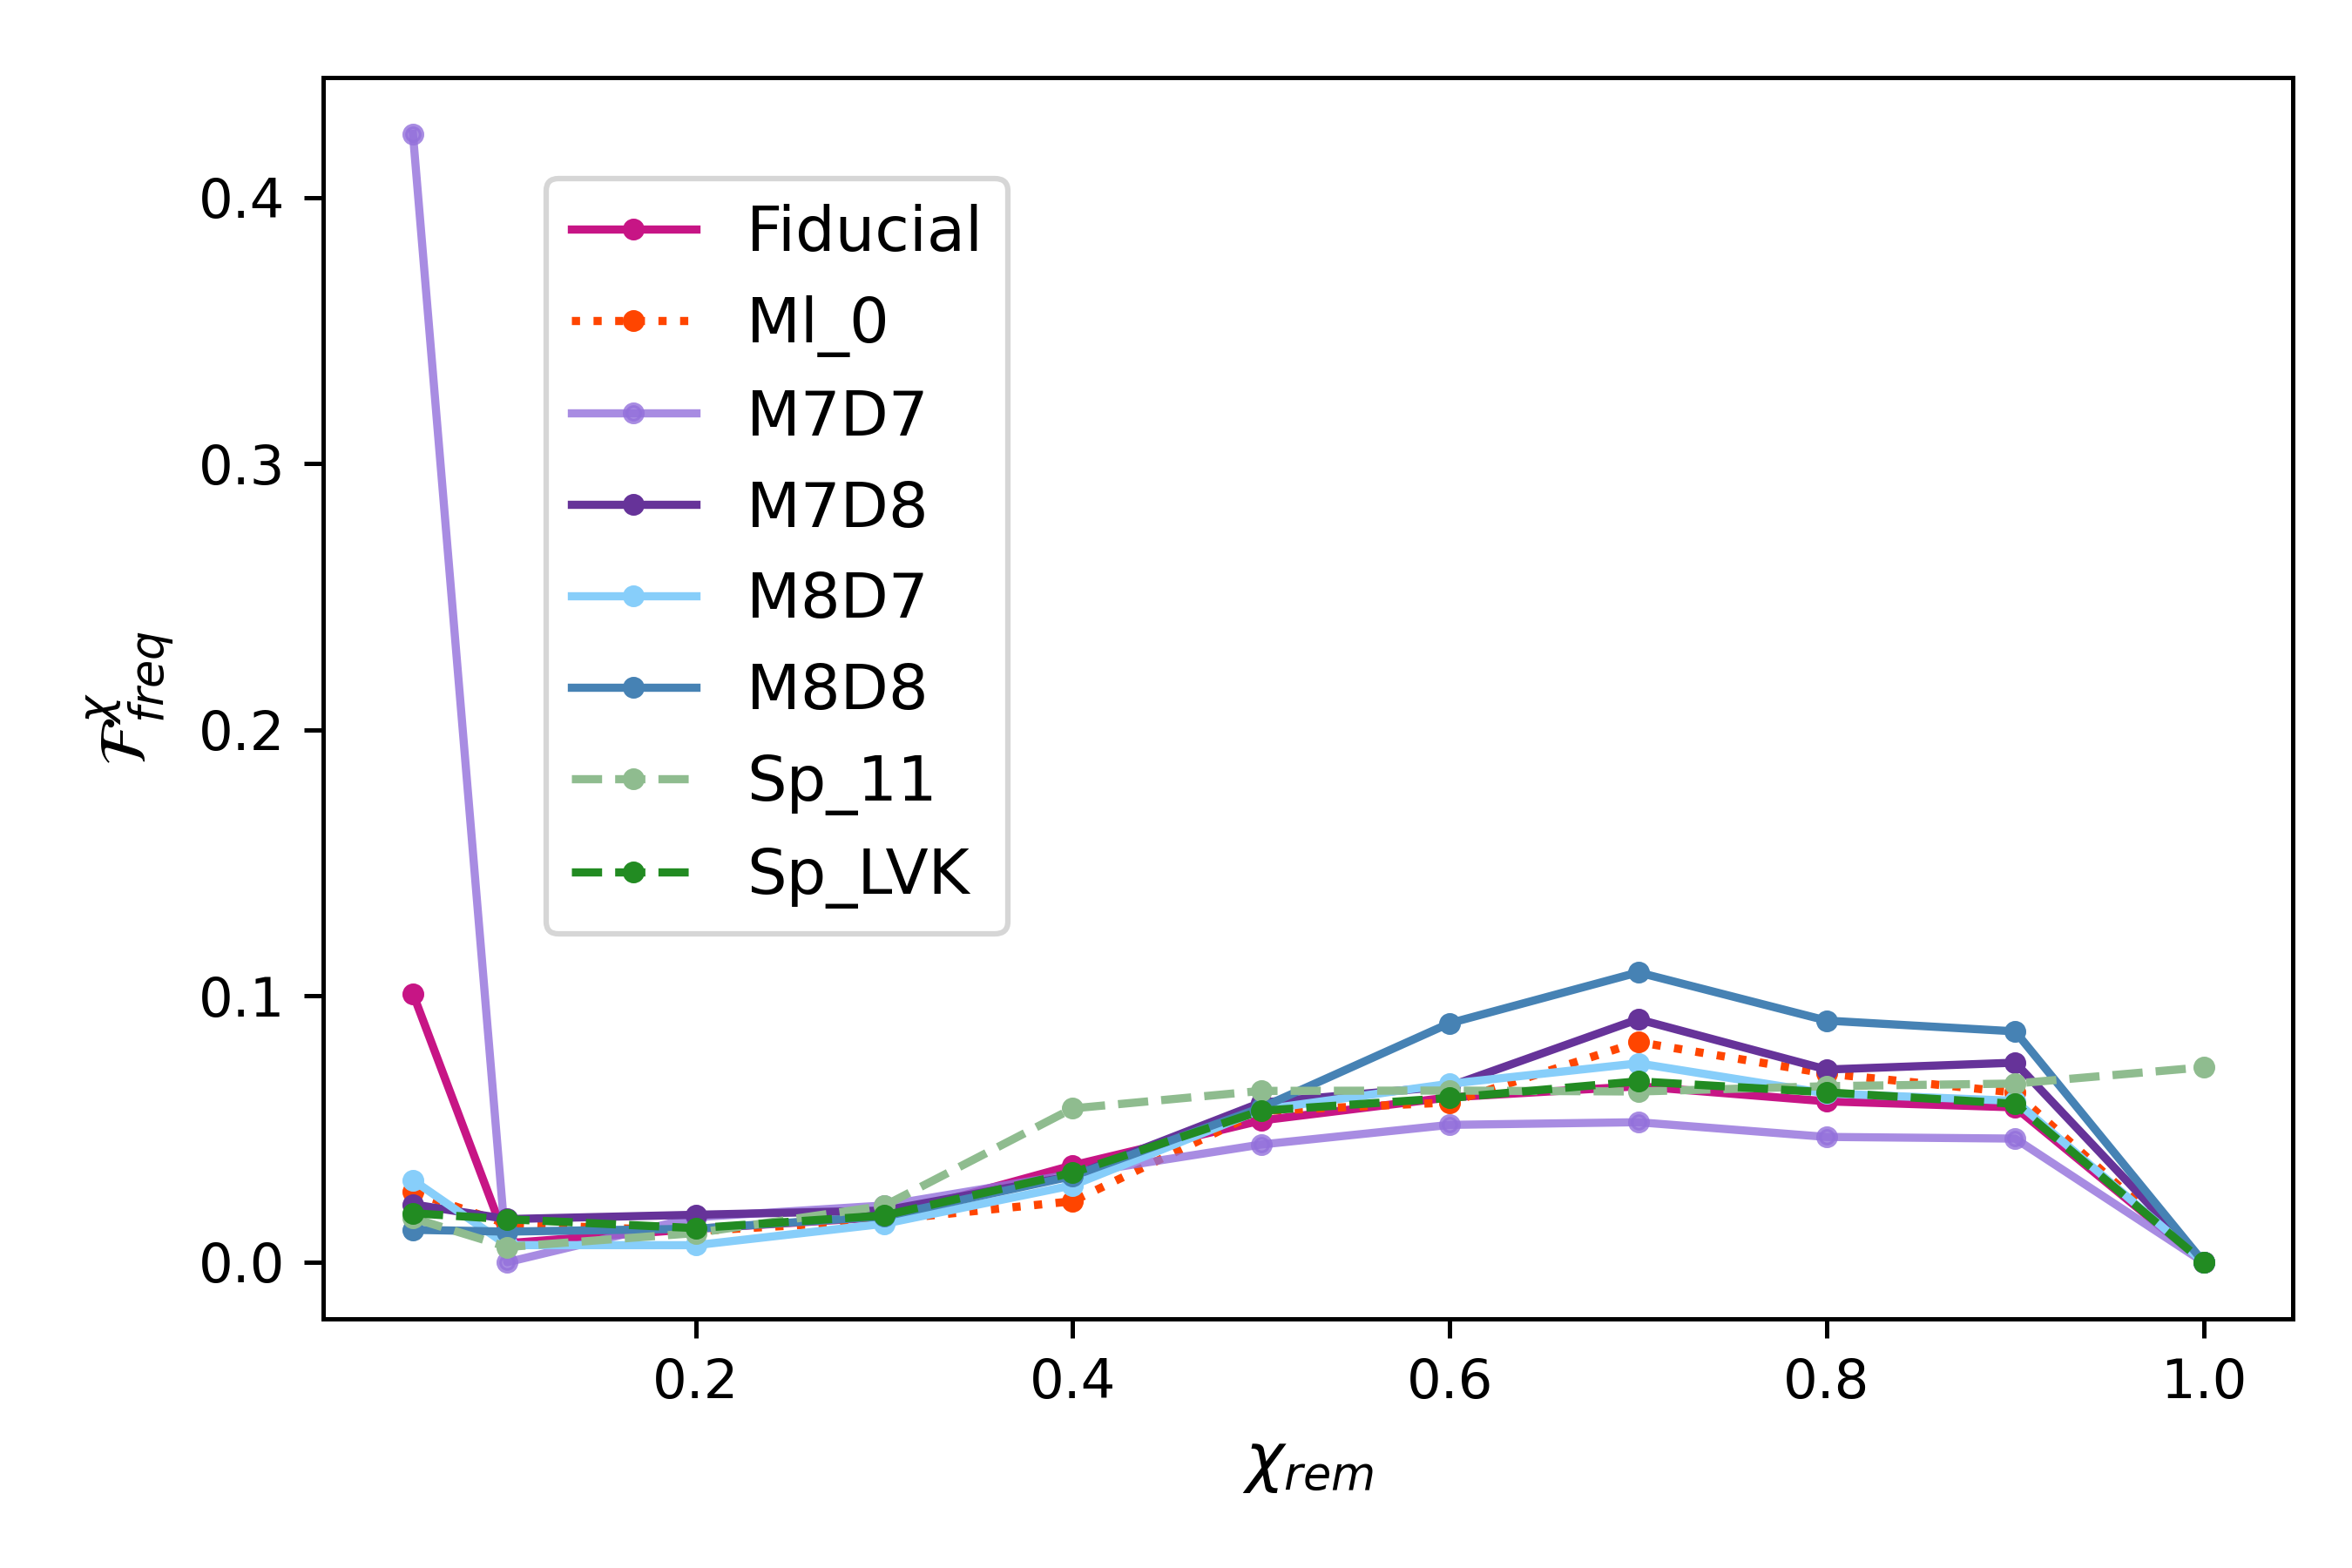
High-frequency mergers— those binaries that form with gravitational-wave frequencies Hz—obey the same Eq. 5. While having very similar at formation, they have even smaller masses. For the Fiducial model, the median for all eccentric mergers is M⊙. However, for high-frequency mergers the median M⊙ is about times lower. The preference for lower masses in these high-frequency, high-eccentricity mergers is also apparent when we compare the mass-binned high-frequency merger fraction () across models in Fig. 9, where we demonstrate the decline of high-frequency mergers as the remnant mass bin value increases. The fraction of high-frequency mergers scales from model to model as , ranging from % of all mergers, with Fiducial having % (final column of Table LABEL:tab:IMBHmass).
We note, finally, that the fraction of eccentric and high-frequency mergers is a decreasing function of time. As the cluster expands and the IMBH grows in mass, the time between individual binary-single encounters increases (see Equation 20 in Antonini & Gieles, 2020b). The increased value of means a higher probability of in-cluster inspirals and a lowered fraction of eccentric GW captures.
3.2 Mass and spin evolution of IMBH
In this Section, we concentrate on the most massive IMBH formed in our cluster models. Primarily focusing on the mass of the IMBH, we discuss the contributing factors, such as global cluster properties, assumptions associated with stellar evolution, and BH binary/triple pairing. We also correlate the IMBH spin to its mass, as well as to the host cluster properties.
3.2.1 Cluster initial mass and density
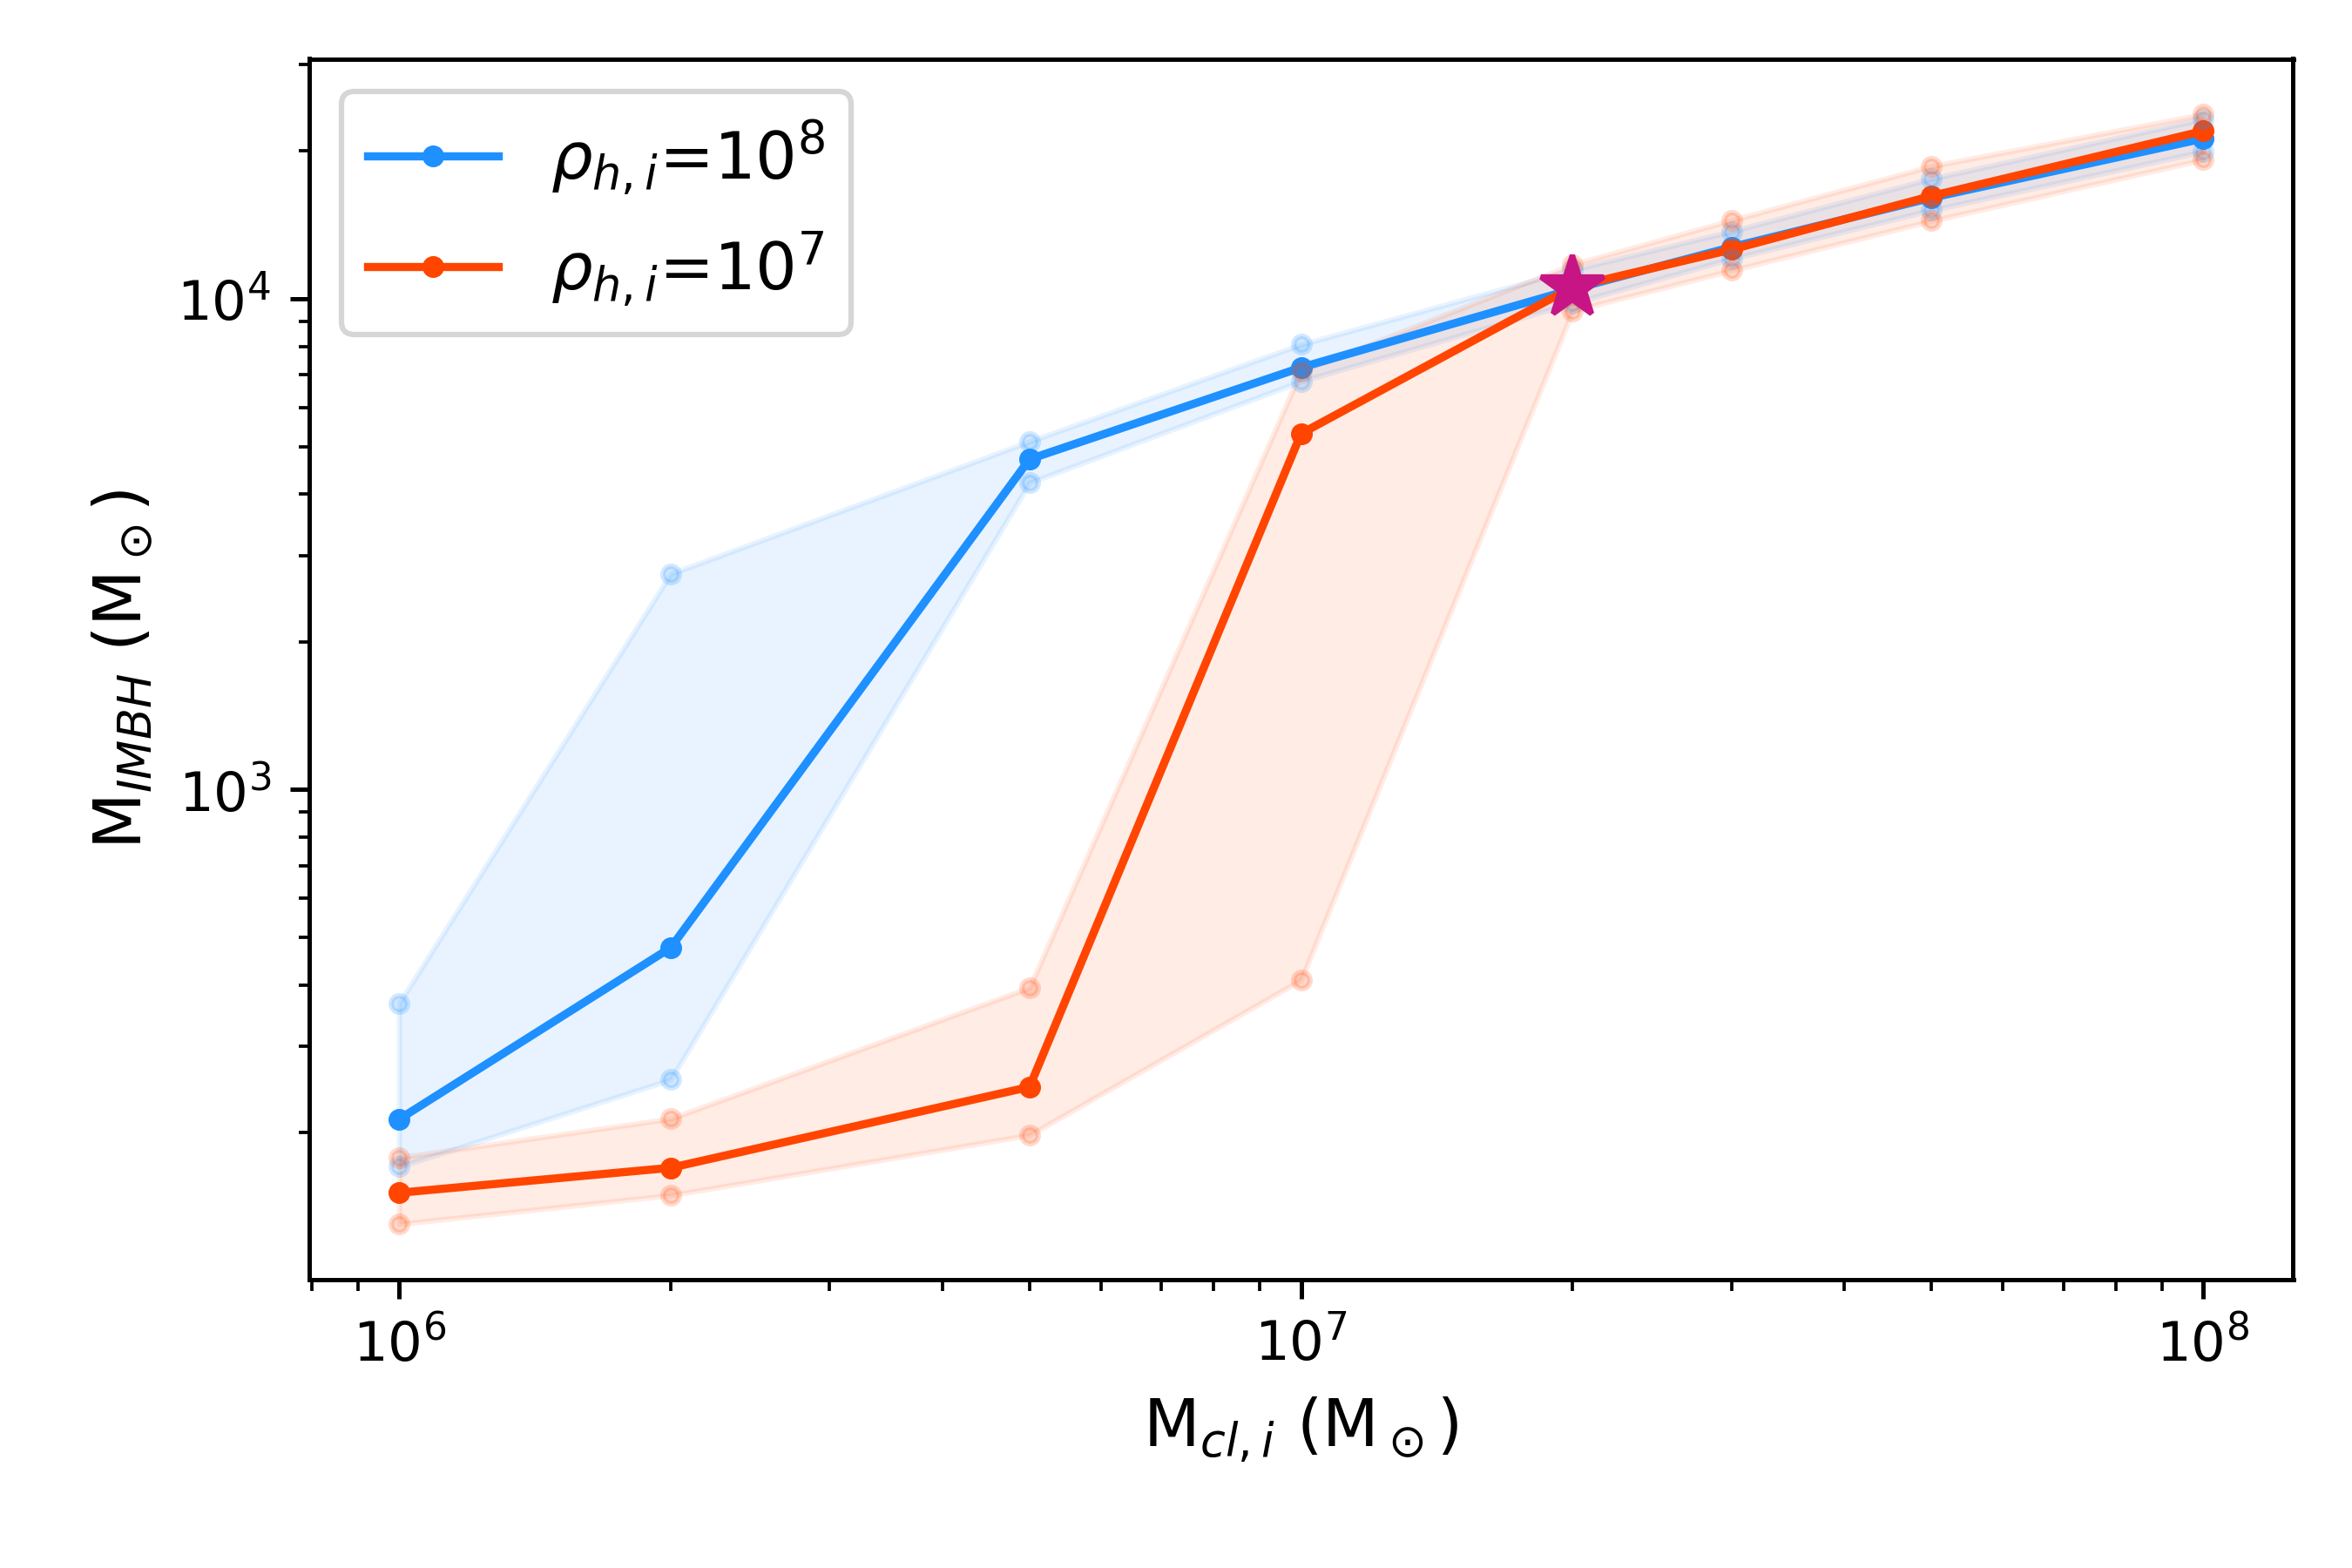
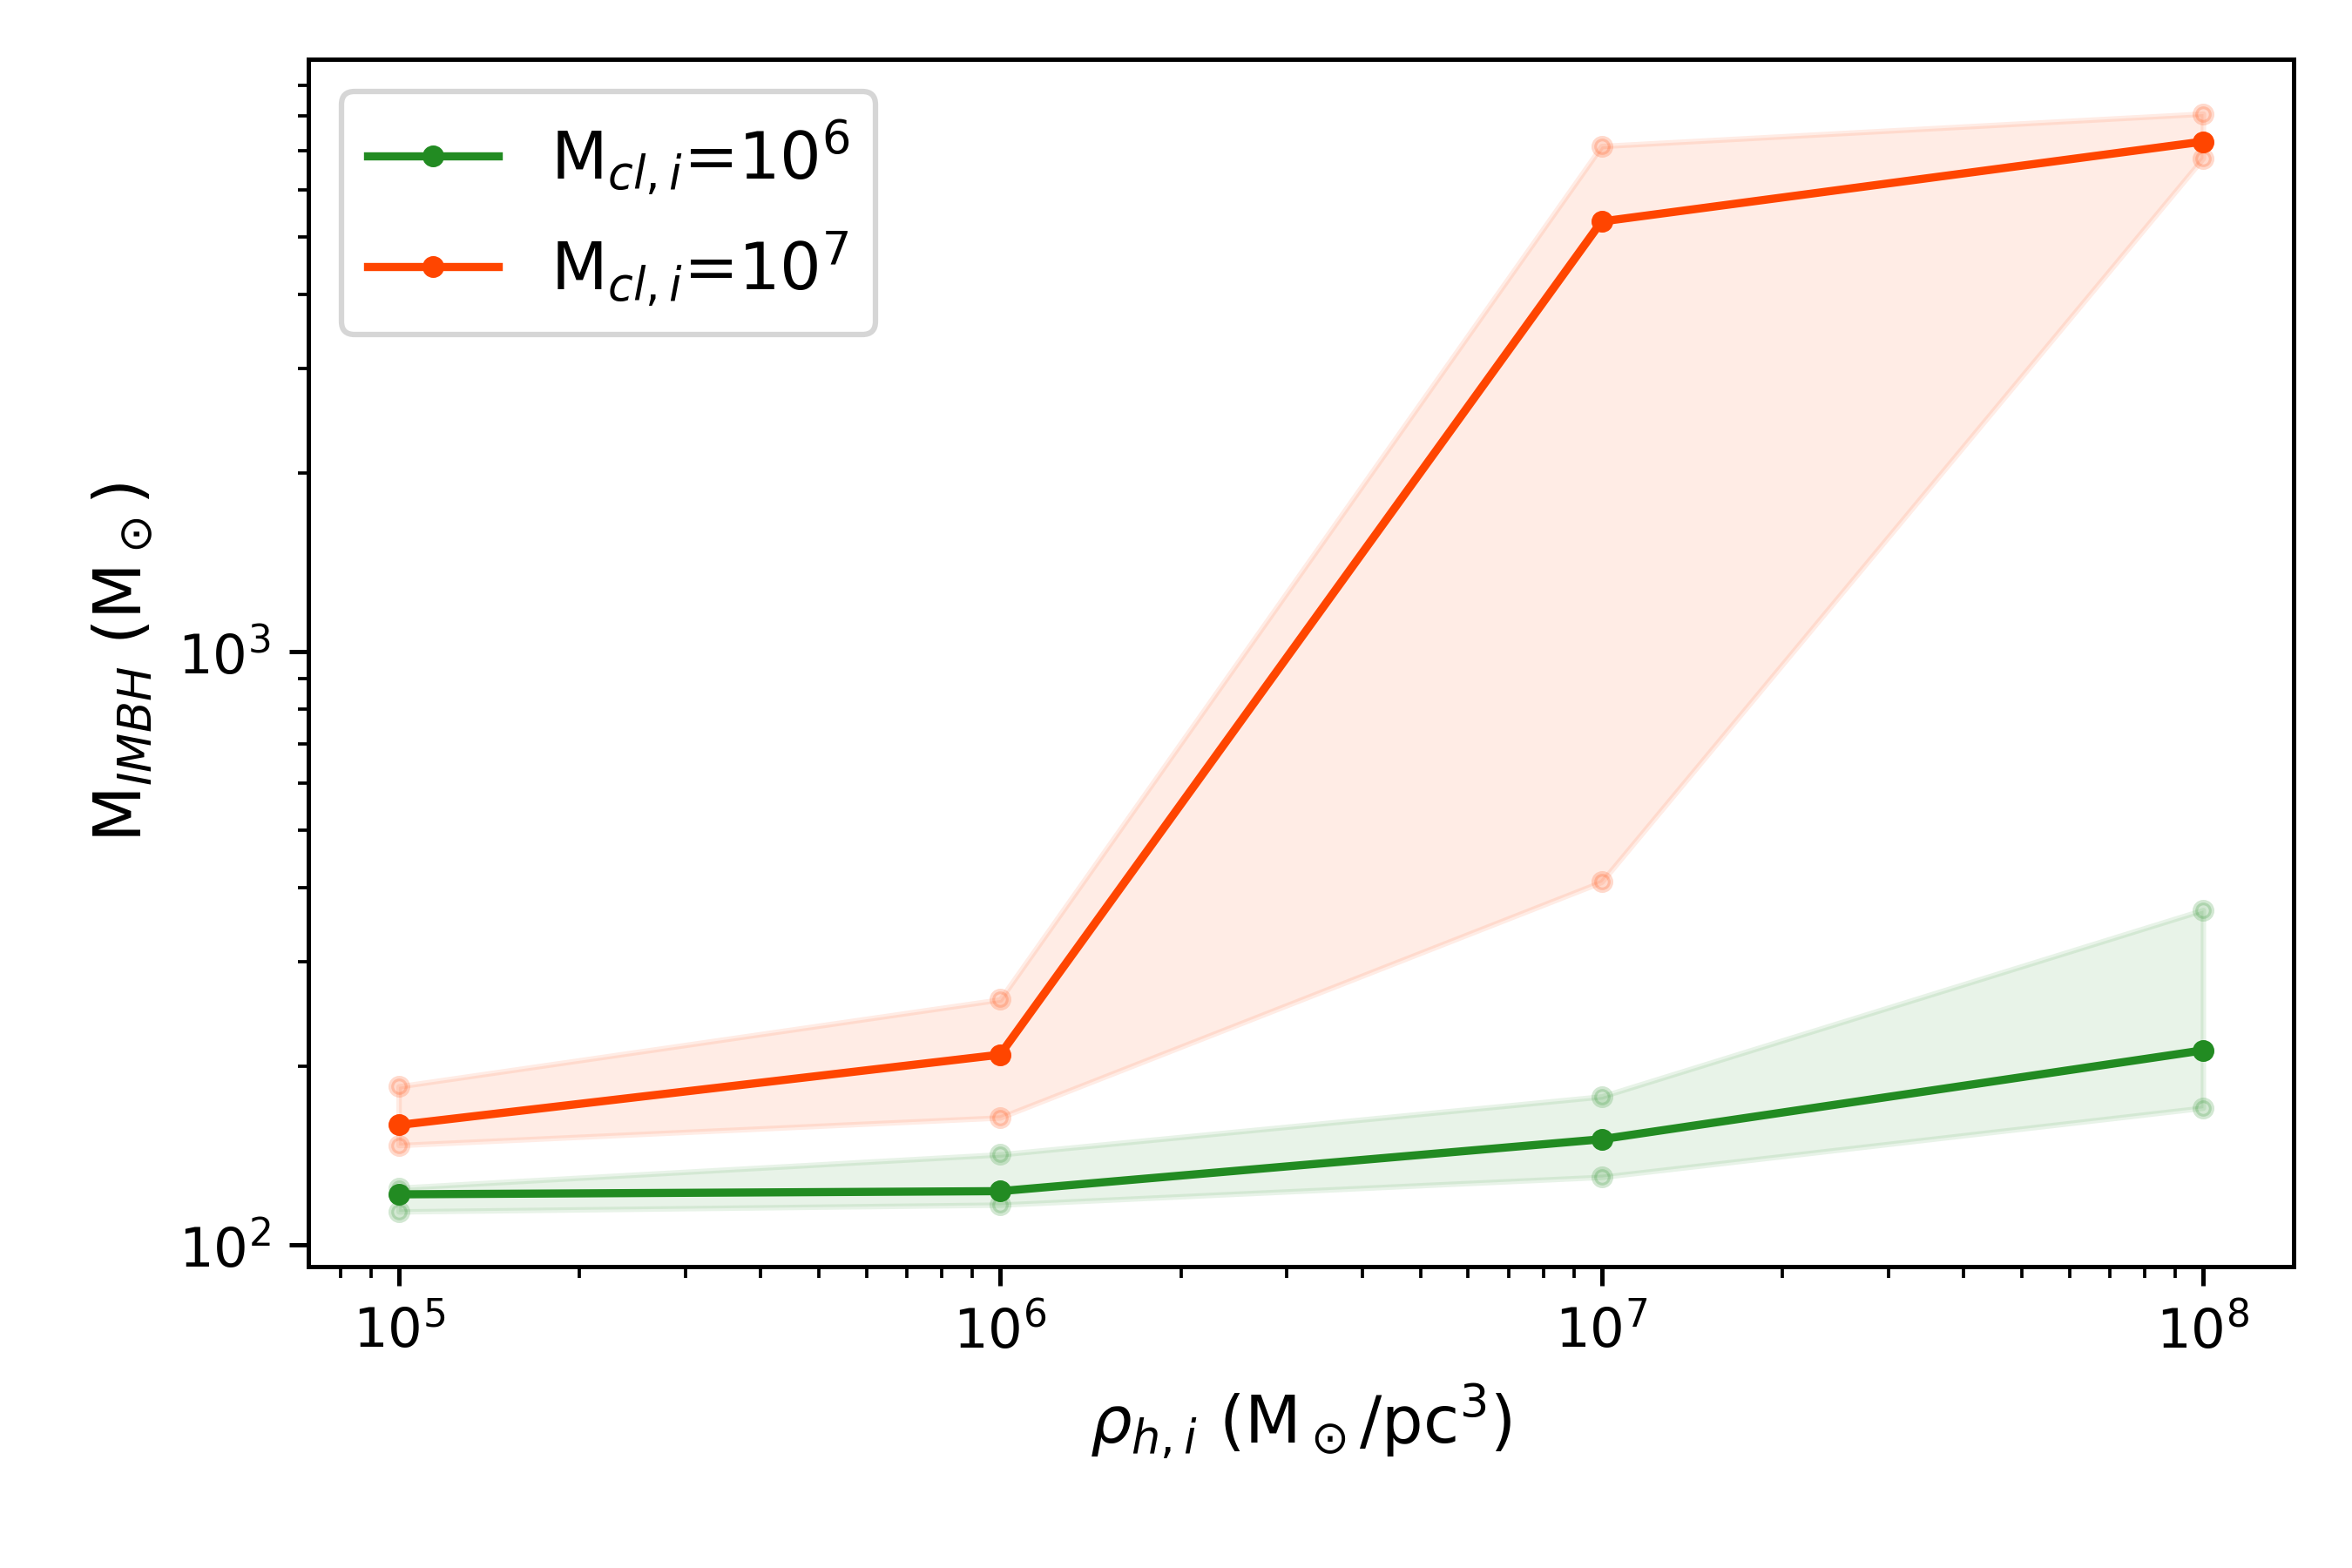
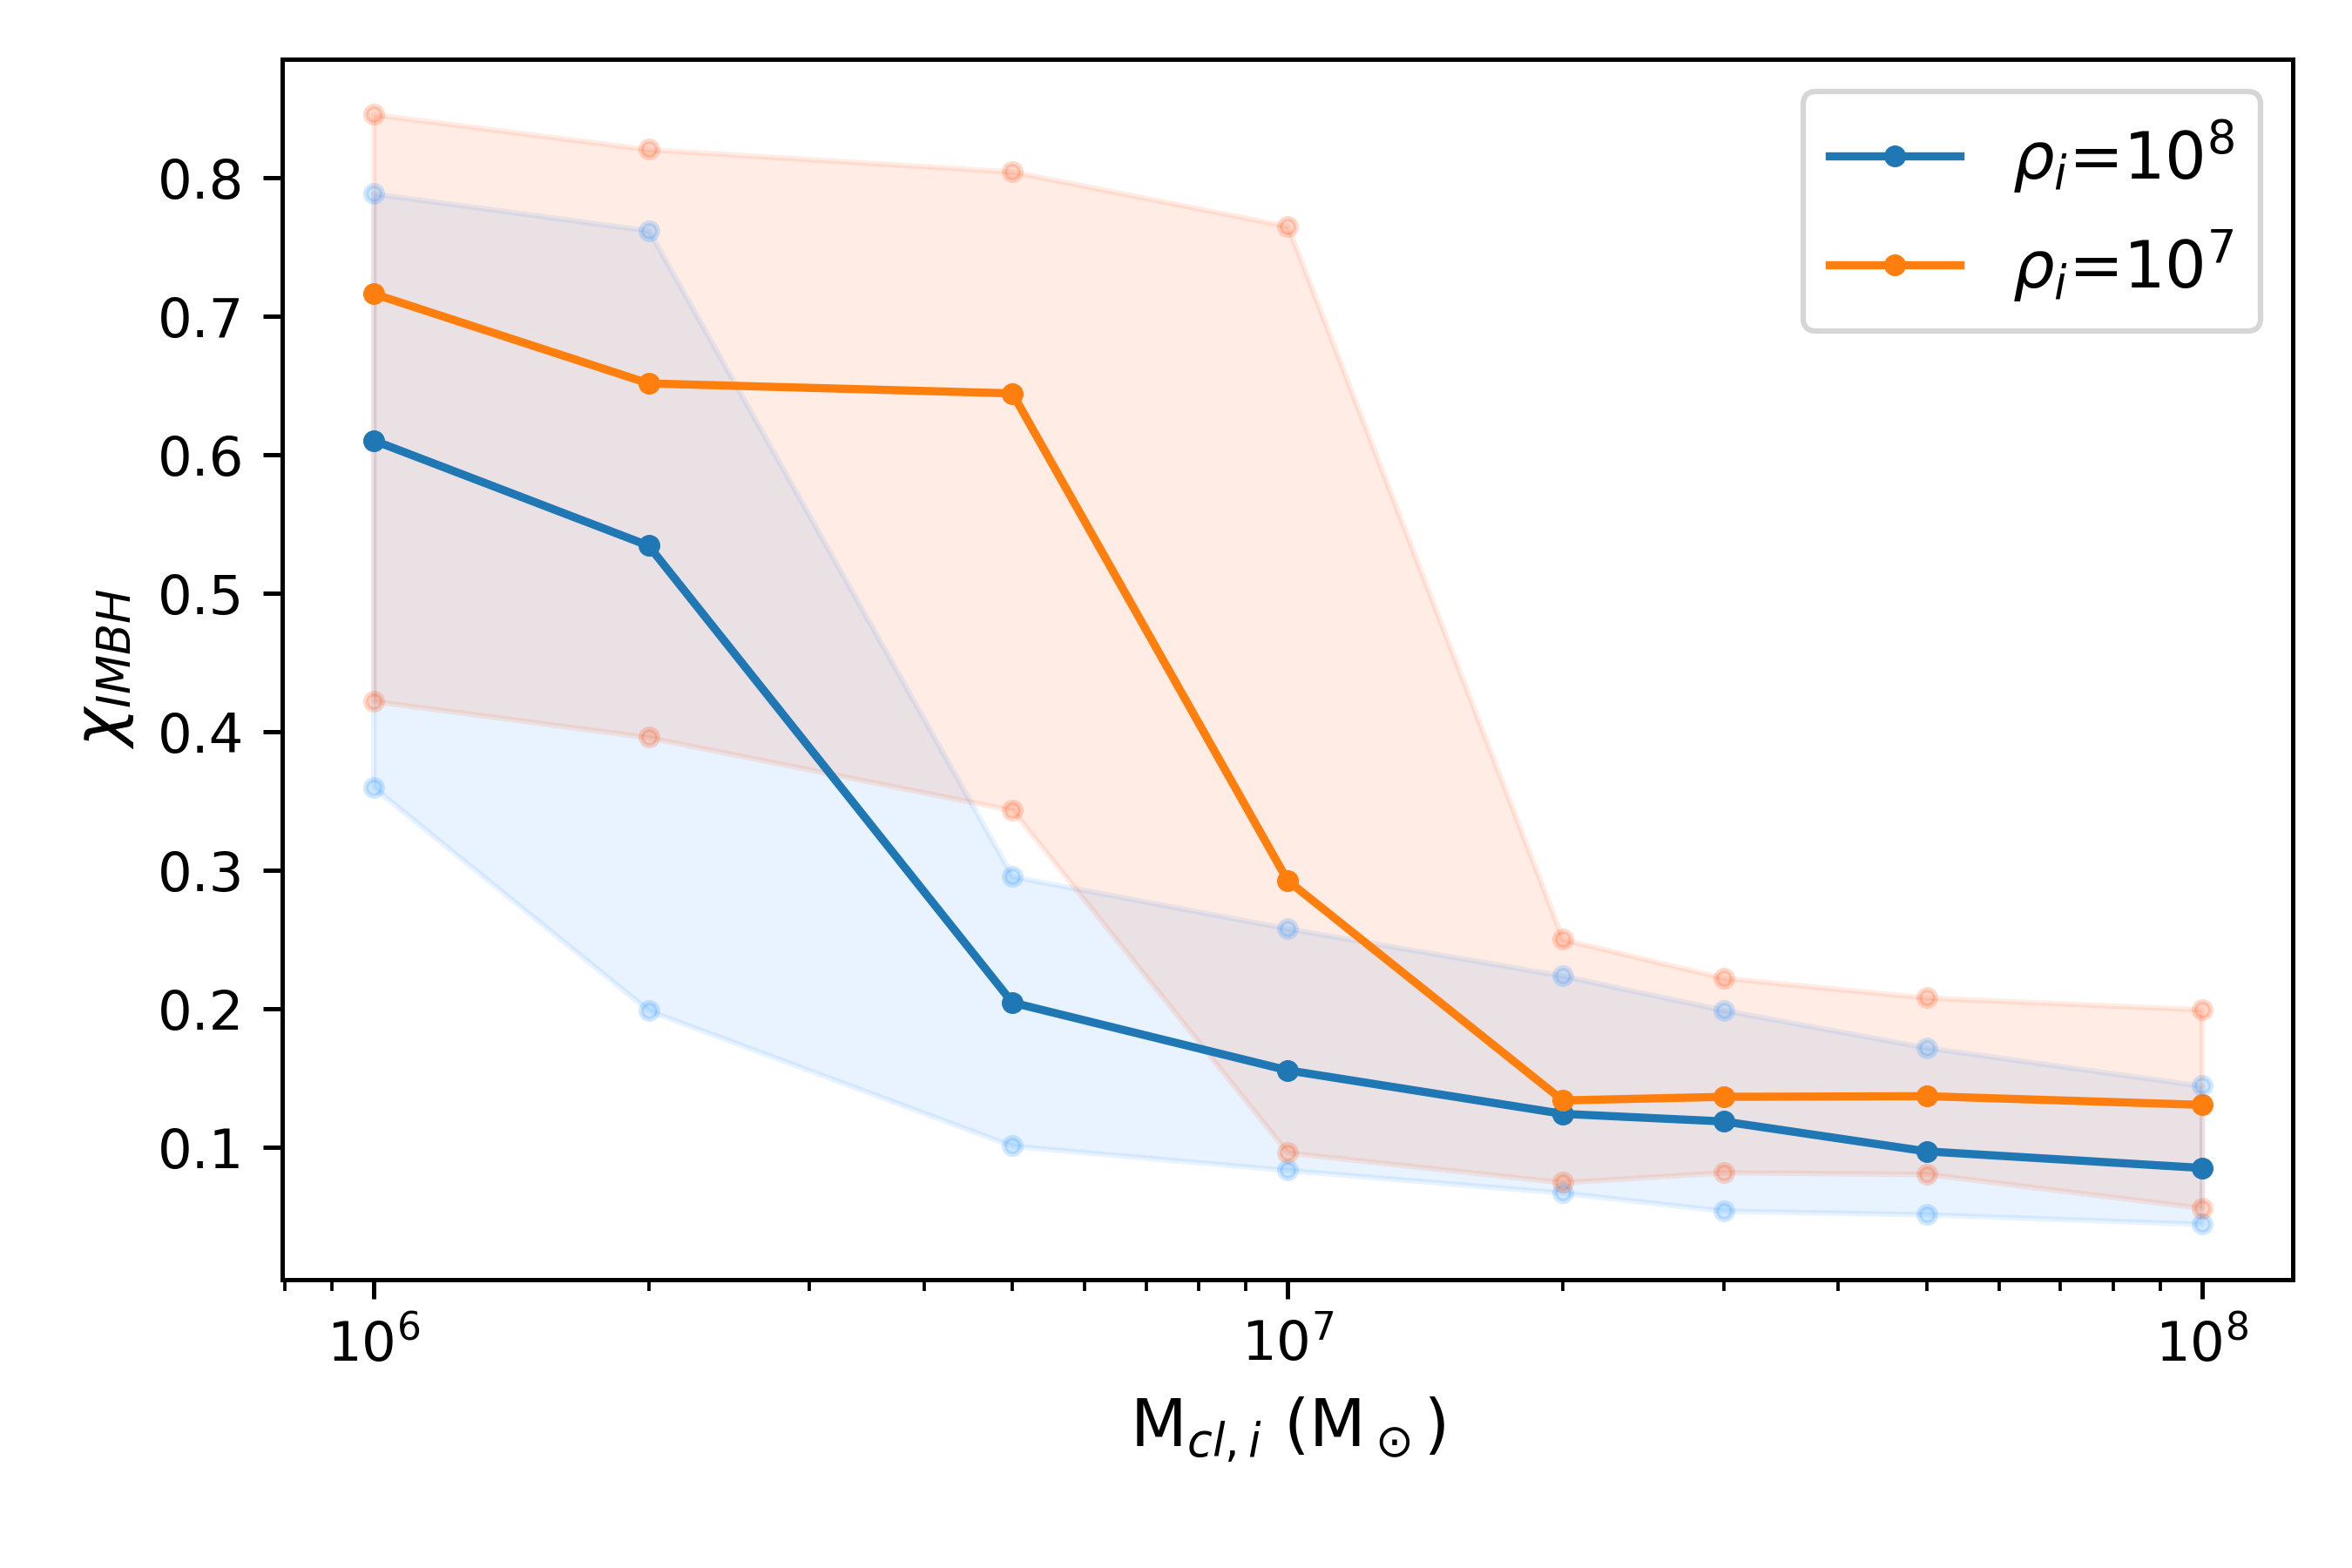
The maximum IMBH mass reachable through only hierarchical mergers is strongly affected by the initial mass and density of the host cluster. Models Sl. no. 211 of Table LABEL:tab:IMBHmass (columns denoted by “”, “”, “” showing the IMBH mass , and percentiles respectively of 100 realizations of each model) clearly demonstrate this relationship. While this can be predicted from Eq. (4) of Antonini et al. (2019), we observe that the maximum BH mass reachable in a cluster of initial mass (in M⊙) and half-mass density (in M⊙ pc-3) is lower by up to an order of magnitude in our models. Although Antonini et al. (2019) estimates the upper limit on the maximum IMBH mass while ignoring recoil kicks, the incorporation of binary-single encounters that can potentially eject BHs (the single and/or the binary) lowers our maximum obtained IMBH mass.
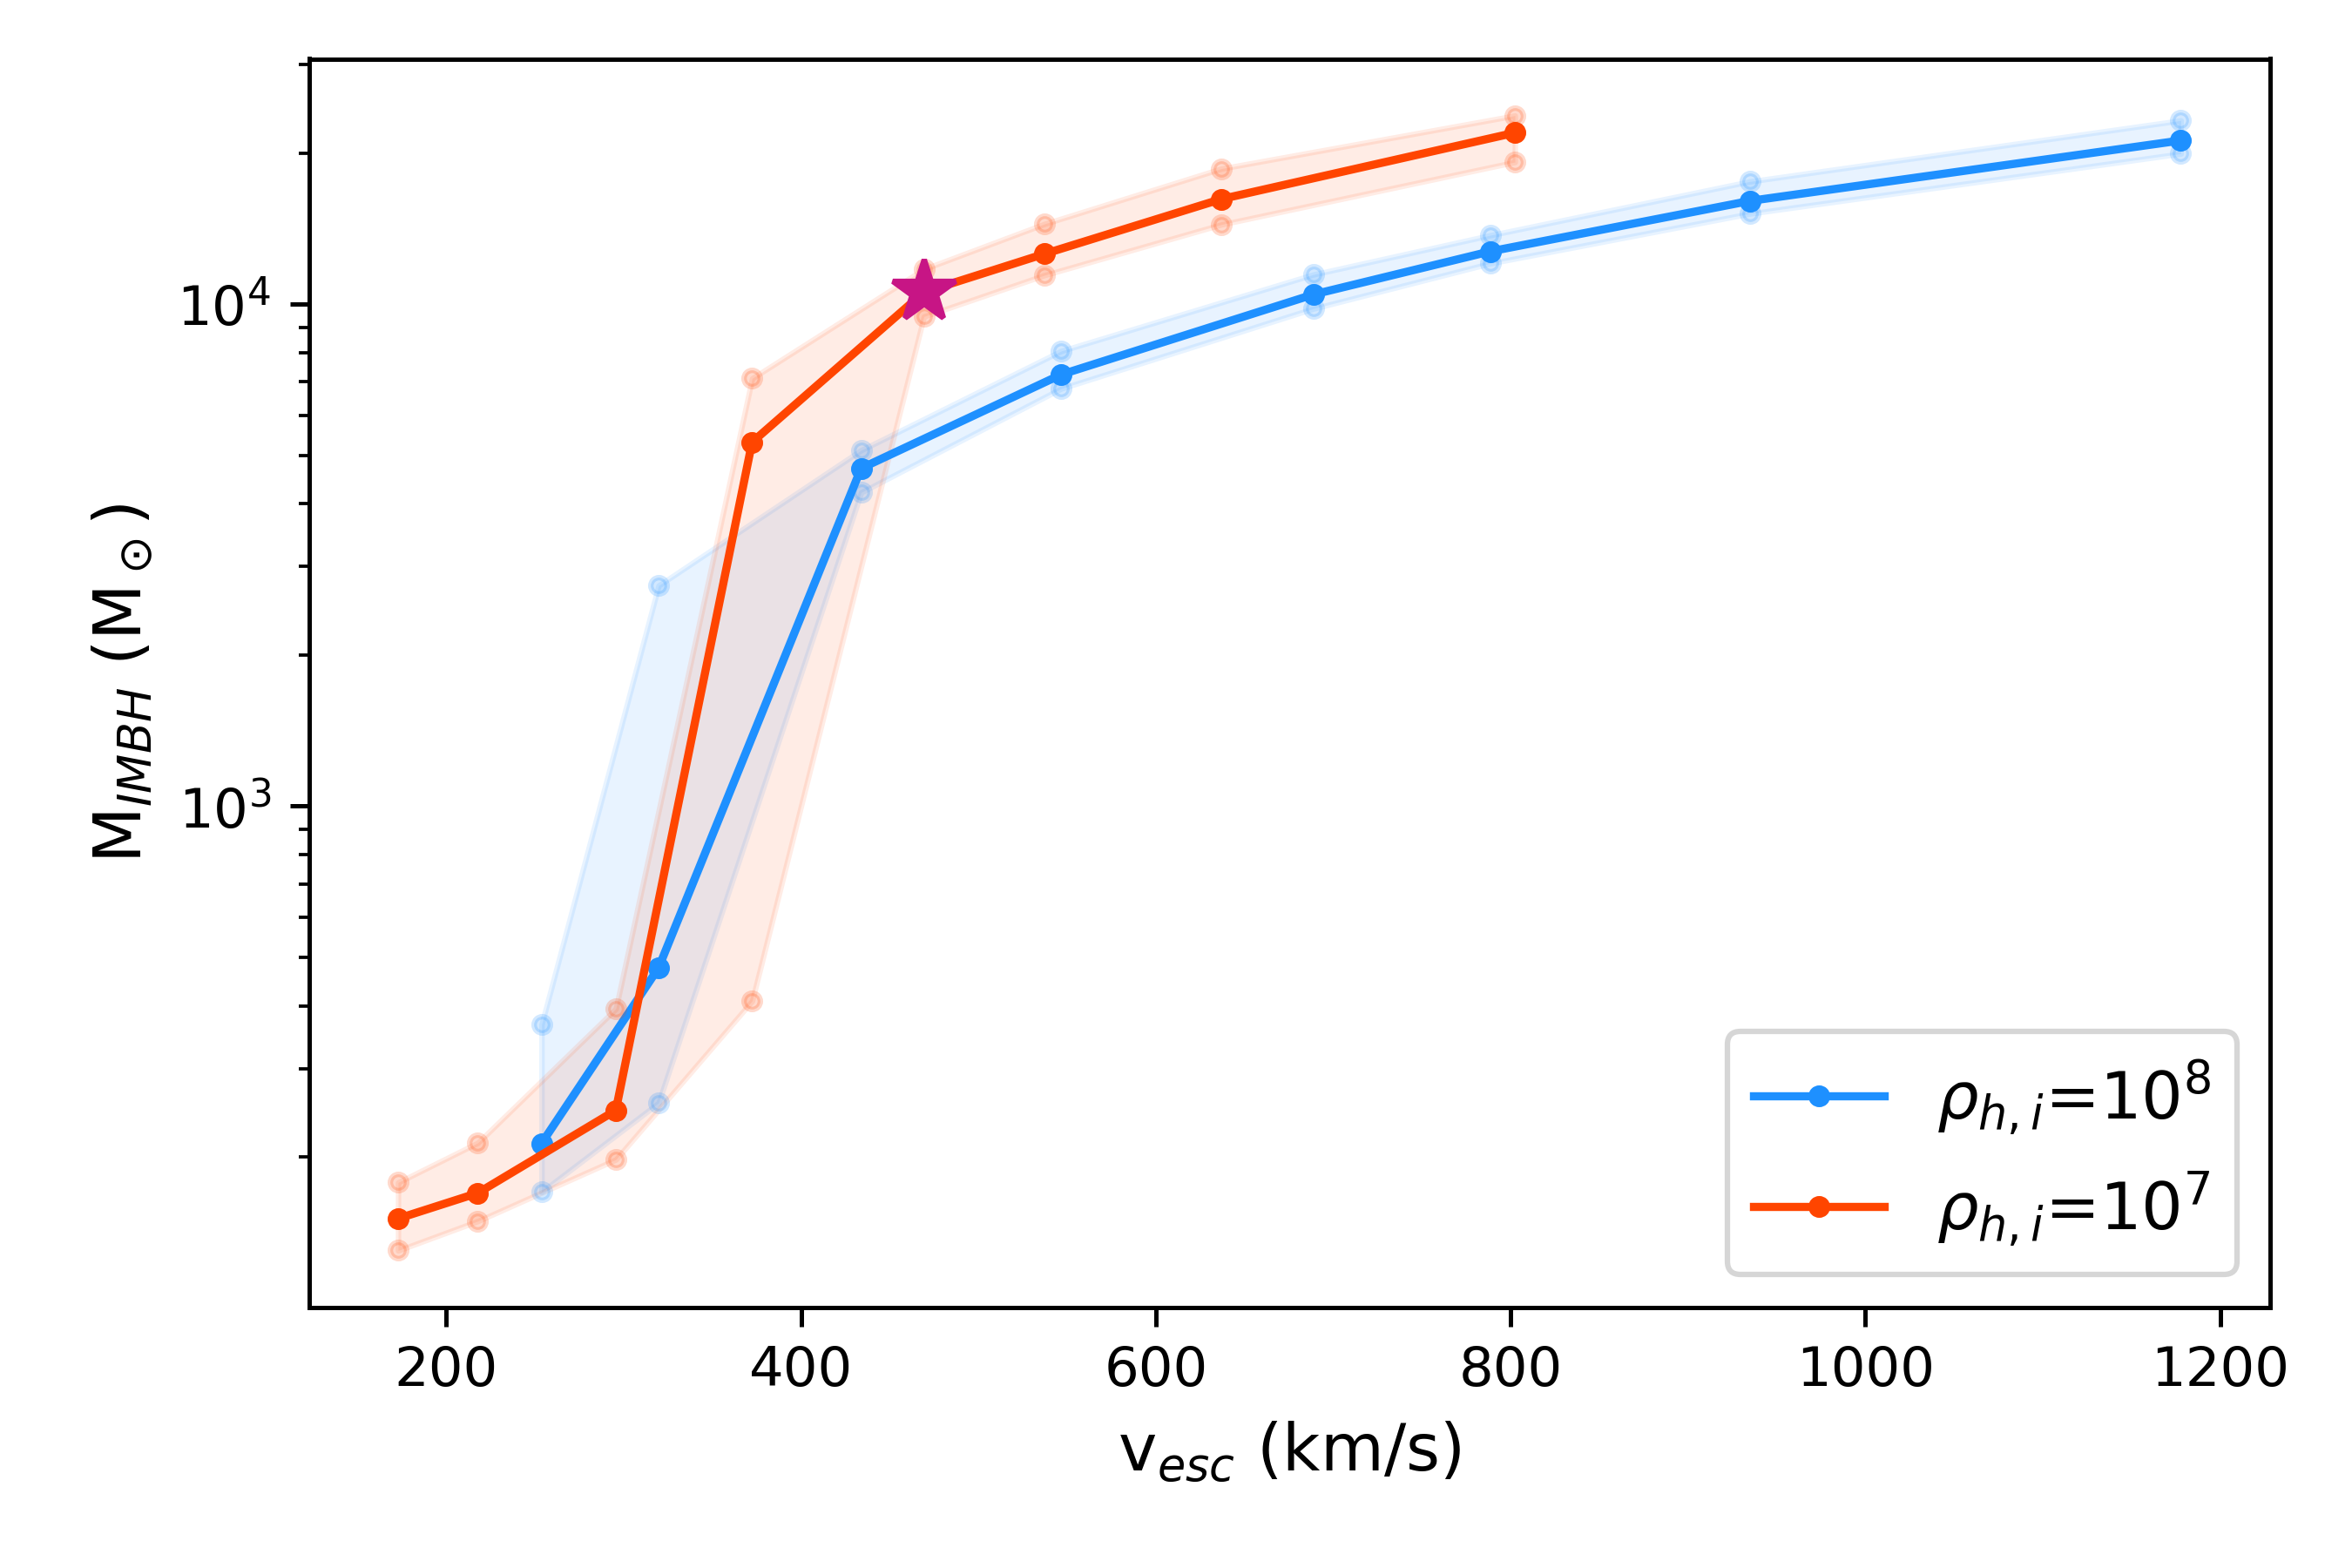
Fig. 10 shows the variation of the maximum IMBH mass () in our models as a function of the host cluster initial mass, half-mass density and escape velocity. We see from the upper panel of Fig. 10 that an increase in initial cluster mass leads to the formation of more massive IMBHs. However, we also note that (i) there appears to be a transition in with respect to cluster initial mass ( M⊙ for M⊙ pc-3 and M⊙ for M⊙ pc-3) where the median makes an order-of-magnitude jump, and (ii) around the same transitory phase, the width in the spectrum, i.e., the difference between the and percentile, calculated from realisations of each model, is rather broad. Comparing the upper to the middle panel of Fig. 10, we observe that this transition occurs at lower for higher : denser clusters. This behaviour is explained by the combination of three velocities—cluster escape velocity (), BH natal kick () and post-merger gravitational wave recoil kick () magnitudes.
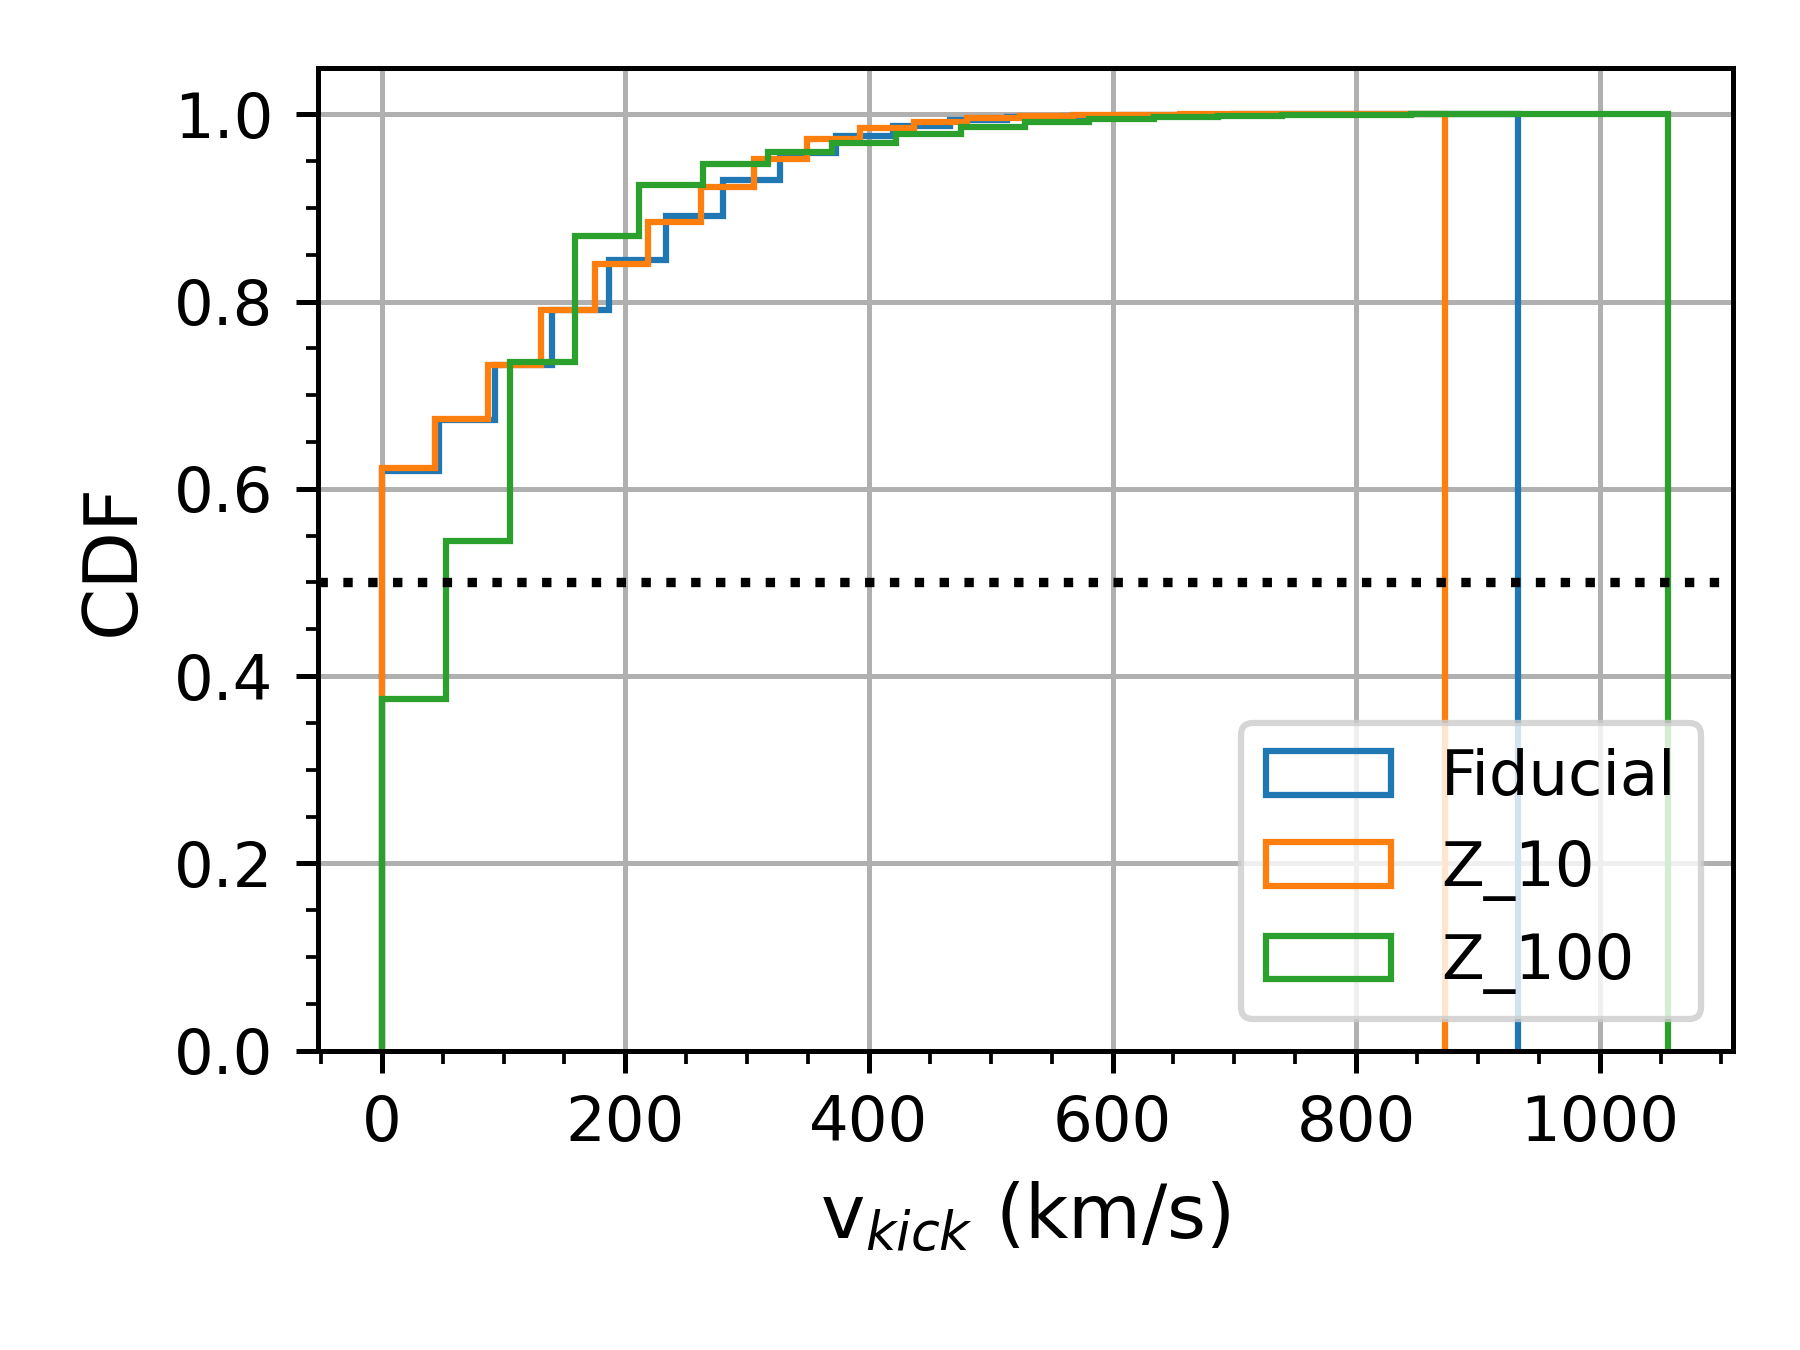
The distribution of BHs from our single stellar evolution prescription (Hurley et al., 2000) is depicted in Fig. 11. For clusters with initial km s-1, nearly all BHs are retained post-stellar evolution (losing only about of the BH mass generated through stellar evolution), compared to host clusters with km s-1 that retains of their BHs (losing about of the BH mass through natal kicks).555For comparison, post-stellar evolution (with stellar evolution parameters as described in Sec. 2) of the initial mass of the cluster is expected to be held in BHs.
For comparison with Antonini & Rasio (2016), we see that of metal-poor cluster BHs receive natal kicks greater than km s-1, and it is only in metal-rich (Z_100) environments that more than of BHs receive a natal kick of km s-1. Since Z_100 is a rather high metallicity even for the local universe, the nuclear cluster DBH merger rate is unlikely to dominate over the merger rate from other dynamical environments, such as globular clusters, or isolated evolution.
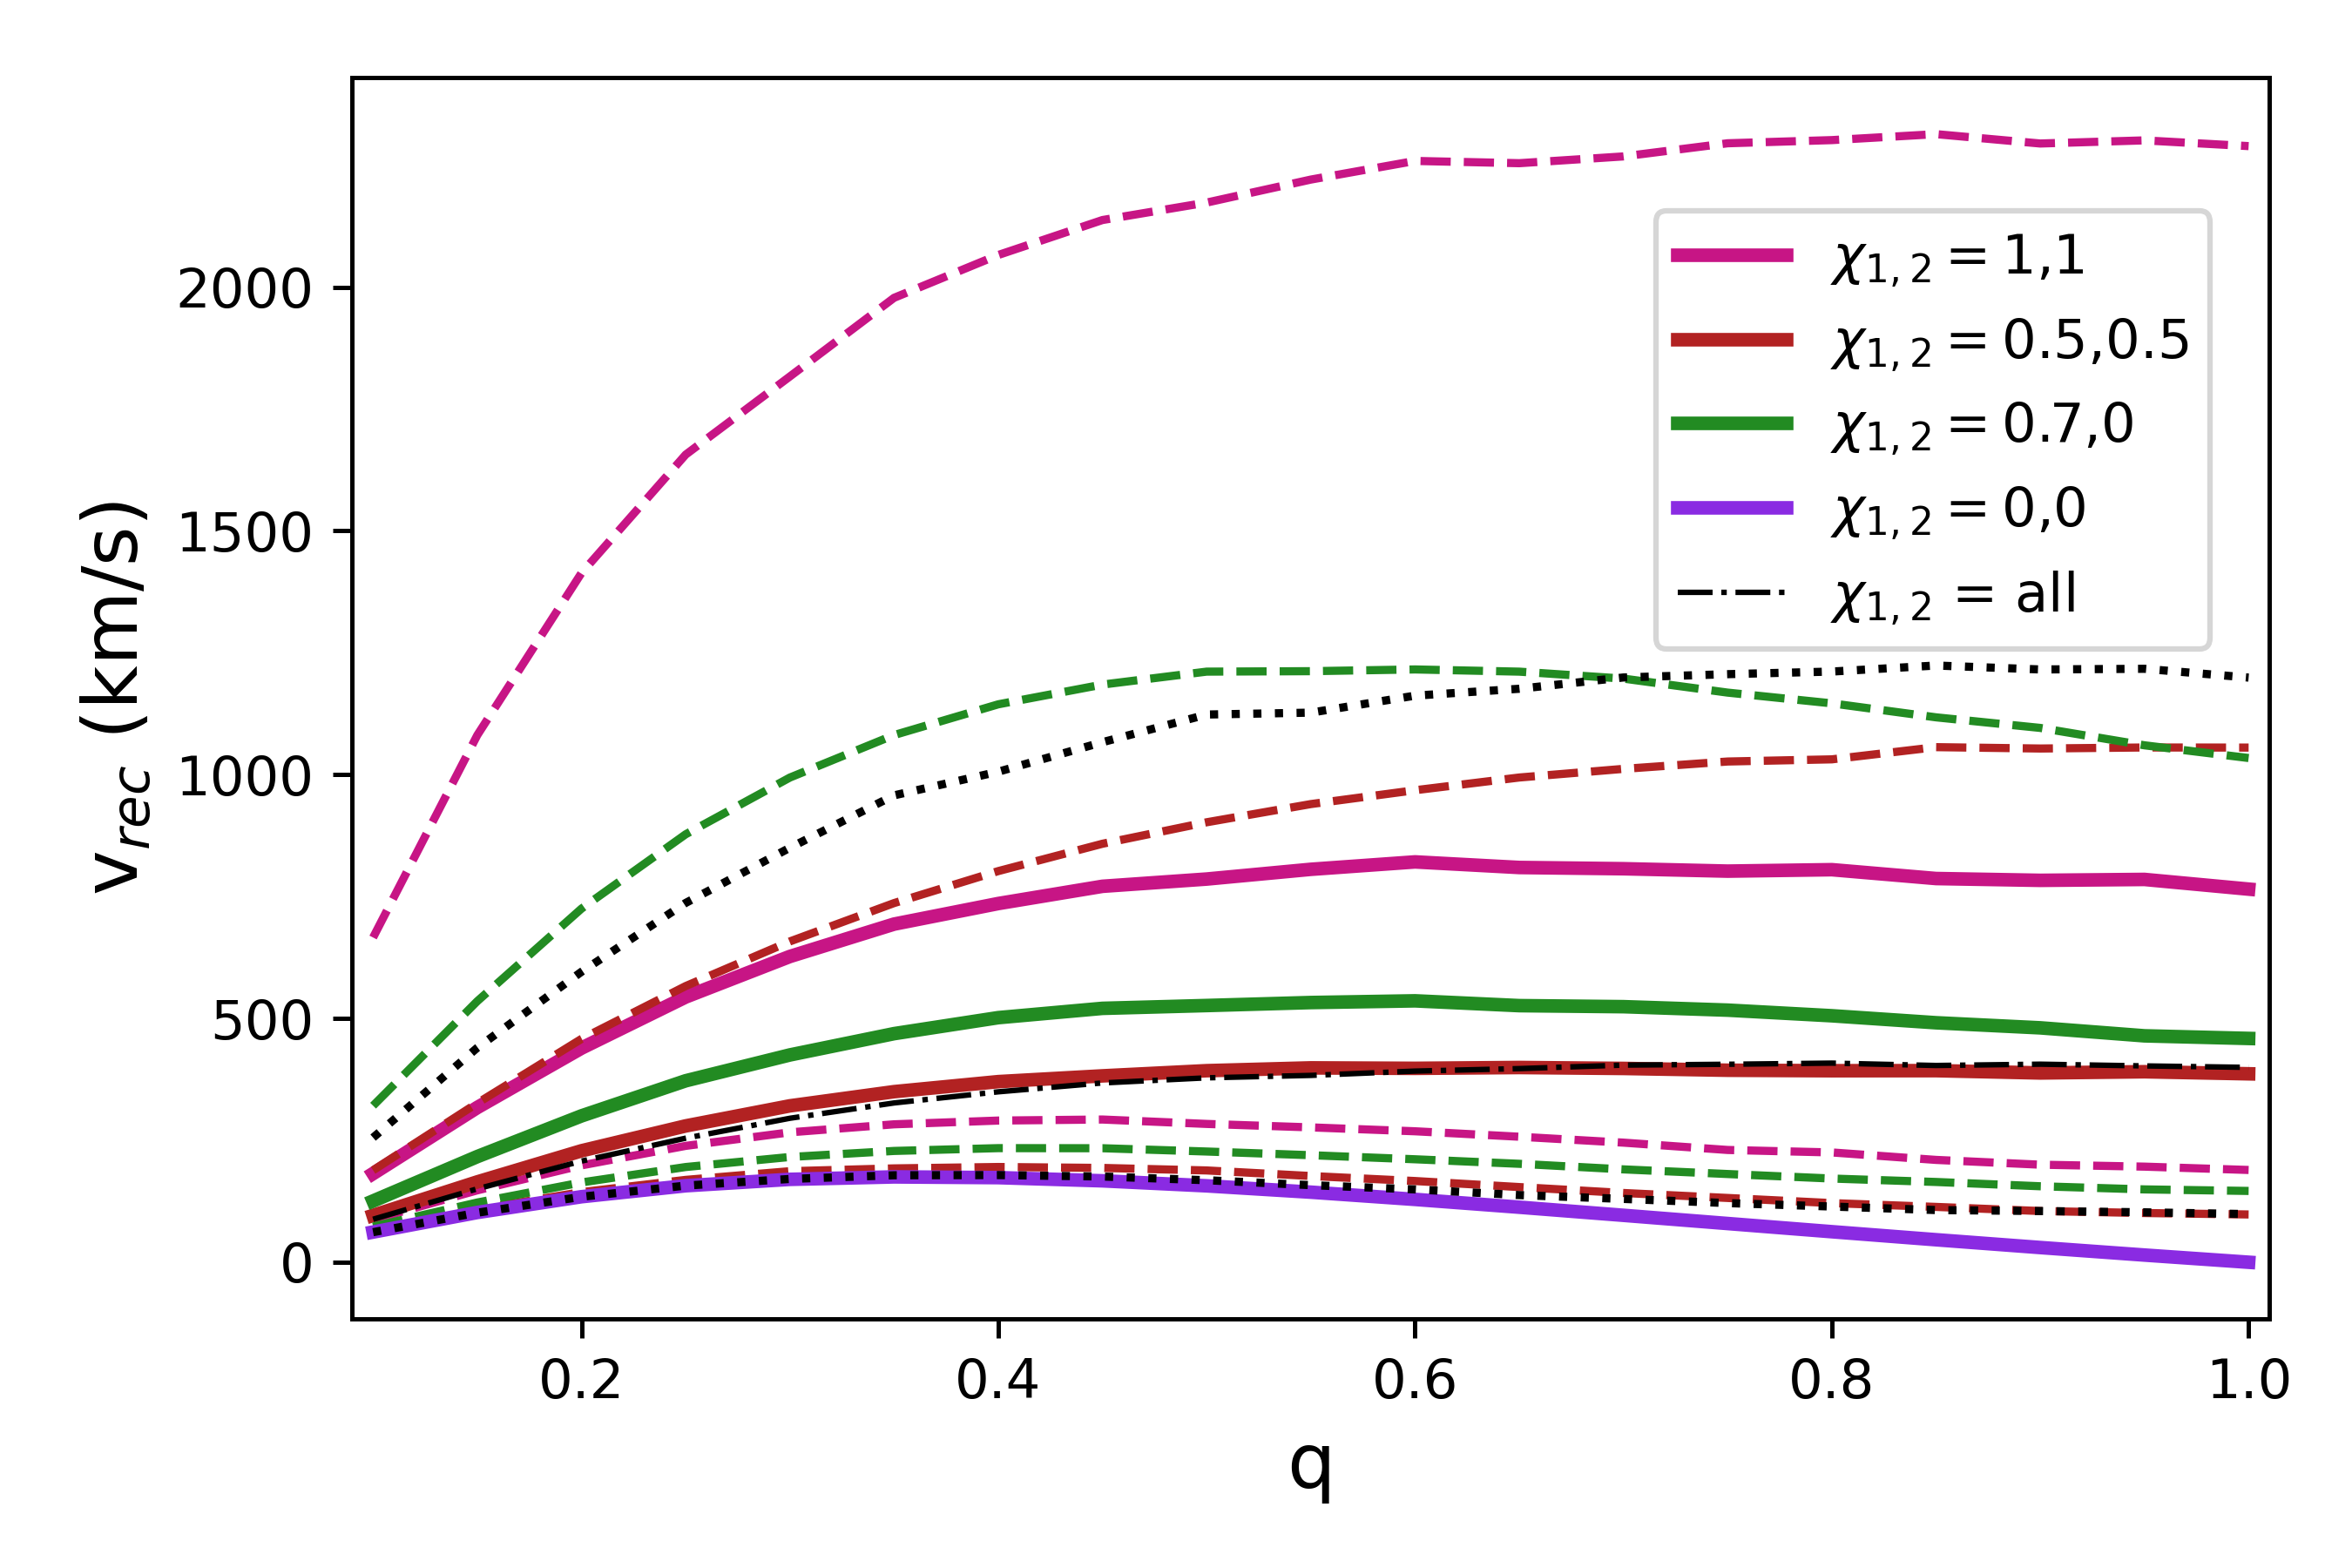
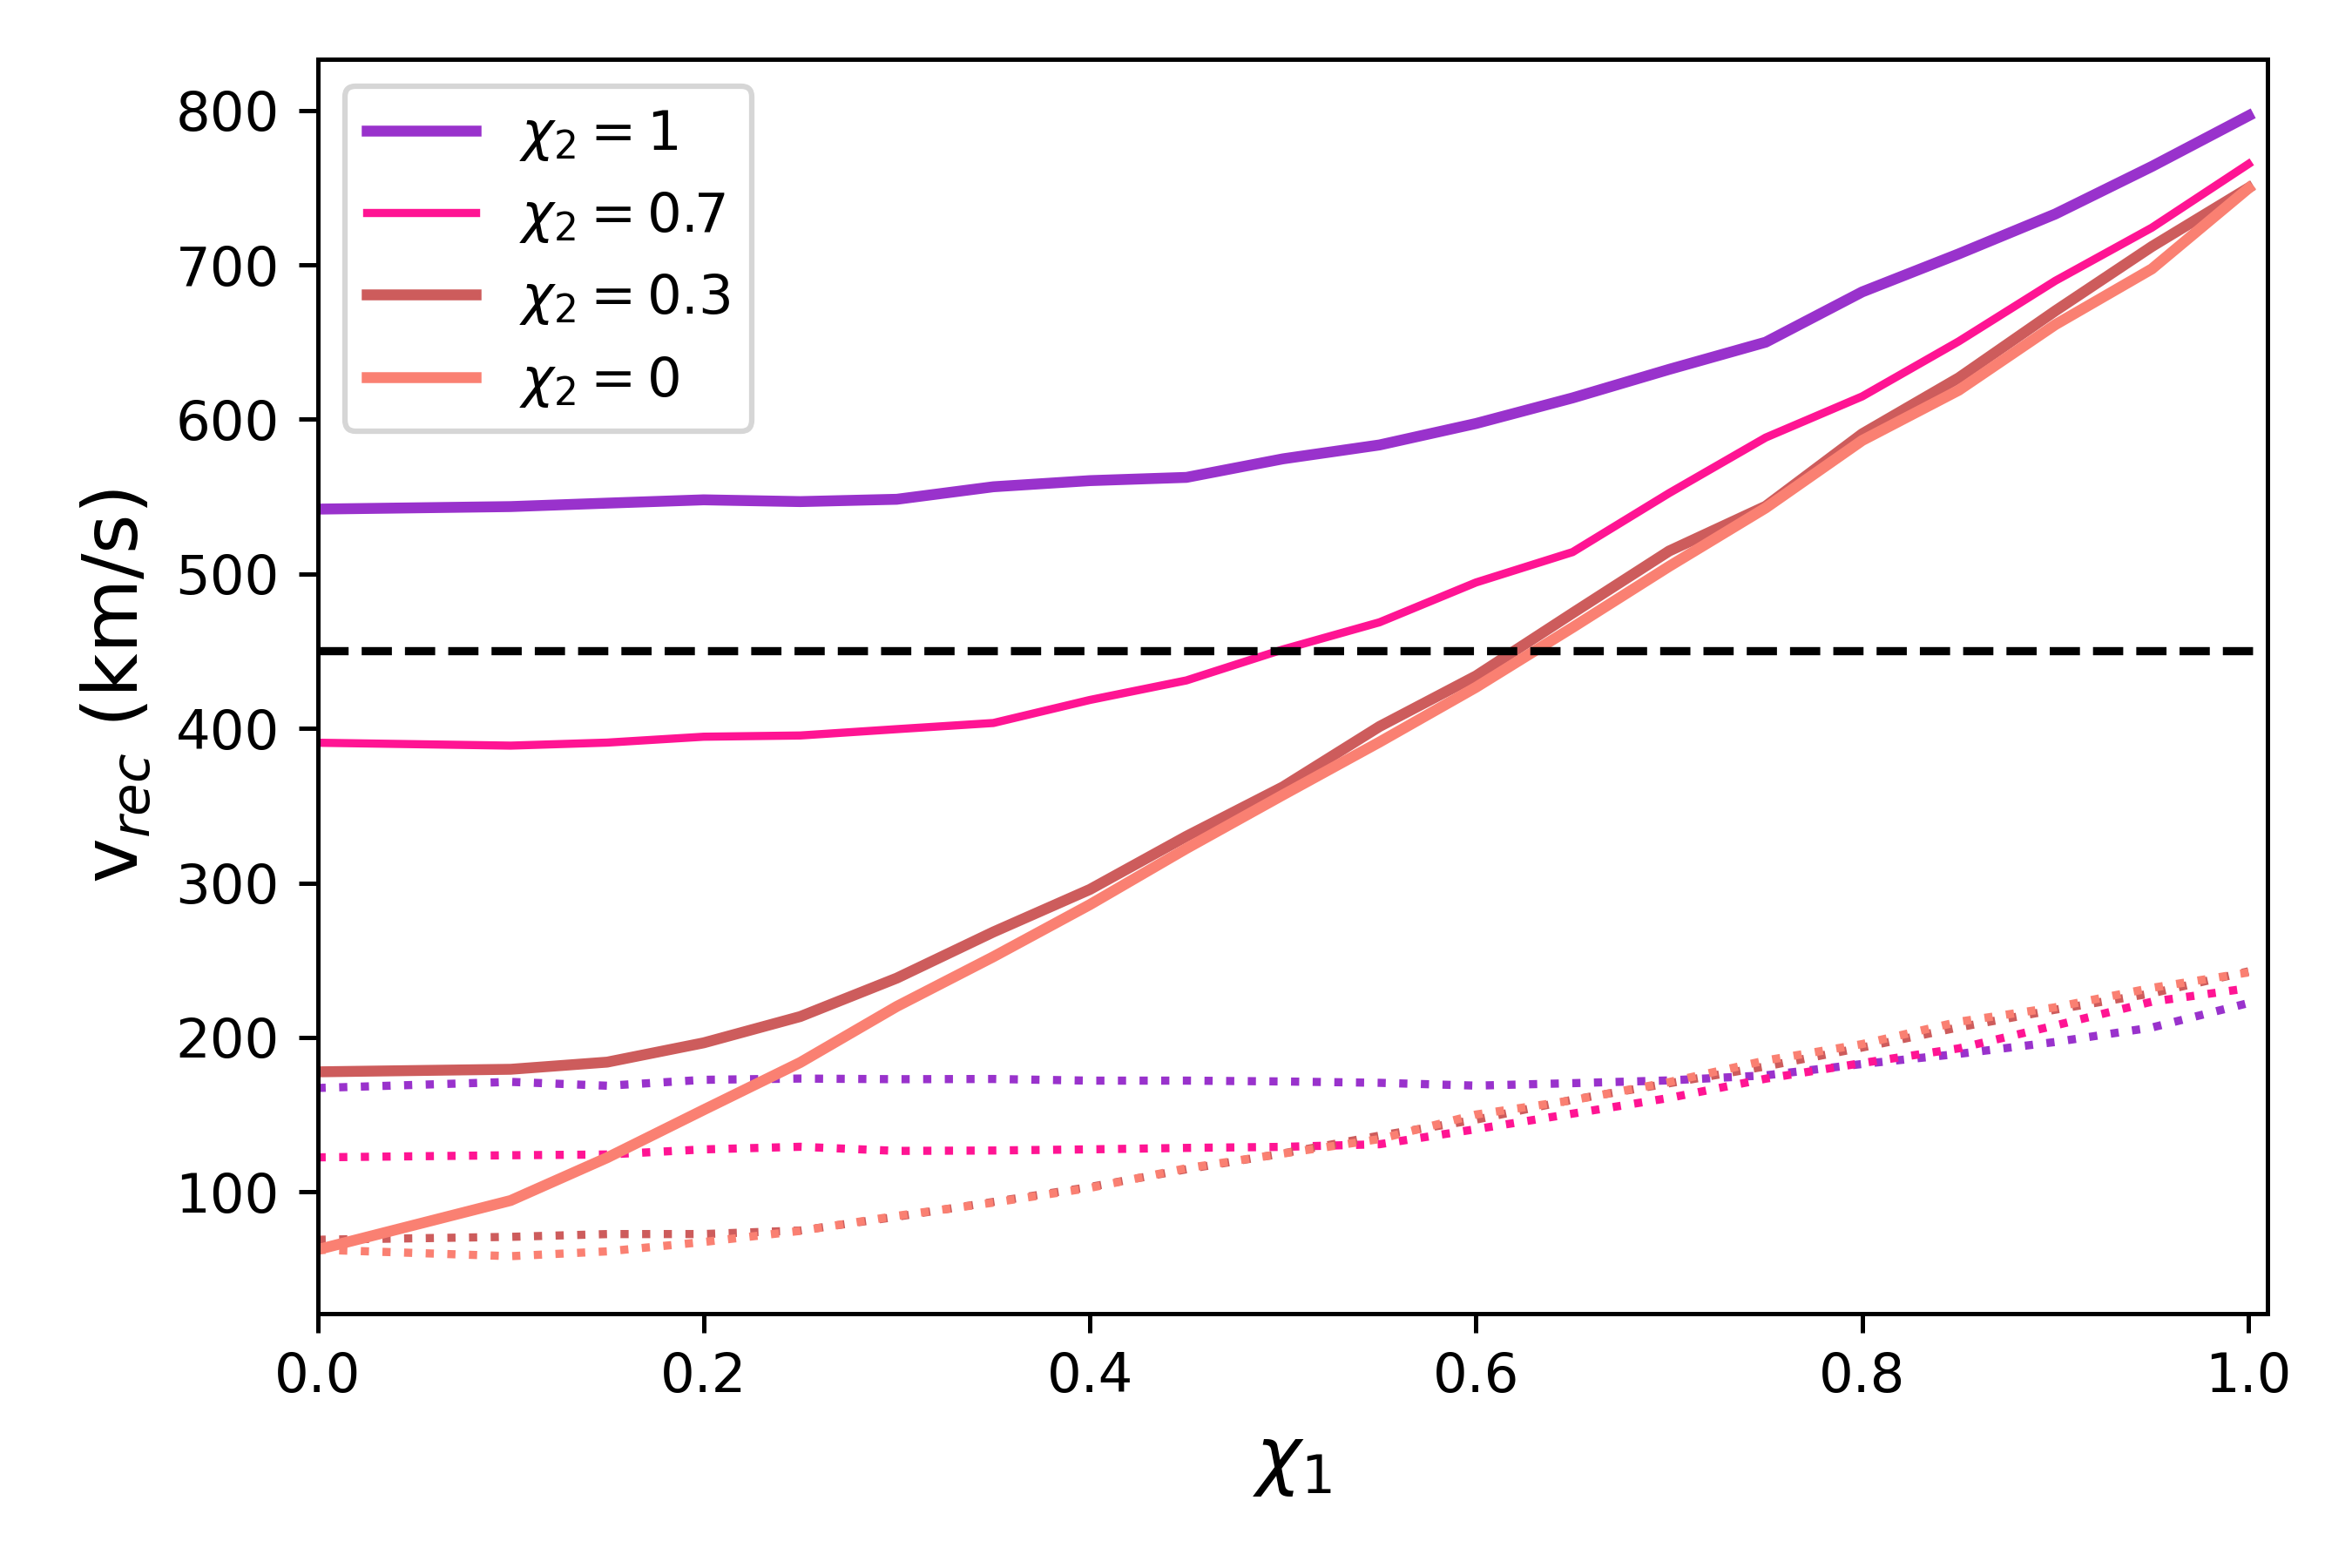
The post-merger recoil kick calculated with different three-dimensional spin magnitudes (Lousto et al., 2010) for all possible spin orientations is shown in Fig. 12. The median curve for all possible spin magnitudes for is about km s-1 and its percentile is at about km s-1. This indicates that, after an in-cluster DBH merger, the remnant is nearly always retained in clusters with km s-1, and is likely to be ejected for clusters with km s-1. For clusters with 200 km s km s-1 range, the retention fraction varies. It must be also noted that the for models shown in the lower panel of Fig. 10 refers to the initial value, while cluster evolution (e.g., expansion, mass loss) tends to reduce both in reality and in our simulations. Hence, it can be concluded that clusters with initial km s-1 with very high BH retention fraction are more likely to form IMBHs with masses M⊙, whereas clusters with km s-1 lose most of their BHs through stellar evolution birth kicks as well as GW recoil kicks post-merger, prohibiting further growth of IMBHs greater than a few M⊙. Our results are lower in final IMBH mass estimate than Miller & Hamilton (2002), whose analytical limit of IMBH mass in a M⊙ cluster is about M⊙, an order of magnitude higher than “M6" models in Table LABEL:tab:IMBHmass. Underestimating binary-single ejections and the overall more simplistic model used in Miller & Hamilton (2002) is a possible cause of the discrepancy. It is also interesting to note that for , i.e. first generation mergers, remnants will always be retained for km s-1.
The Poisson oscillation for can vary from to . Clusters with km s-1 or km s-1 corresponds to the lower values , while in the mid-transitional region have higher . Fiducial model has . 666=/ where, . That plays the key role in determining whether an IMBH will form is shown by Antonini et al. (2019); Fragione & Silk (2020); Mapelli et al. (2021) and by our Fig. 10.
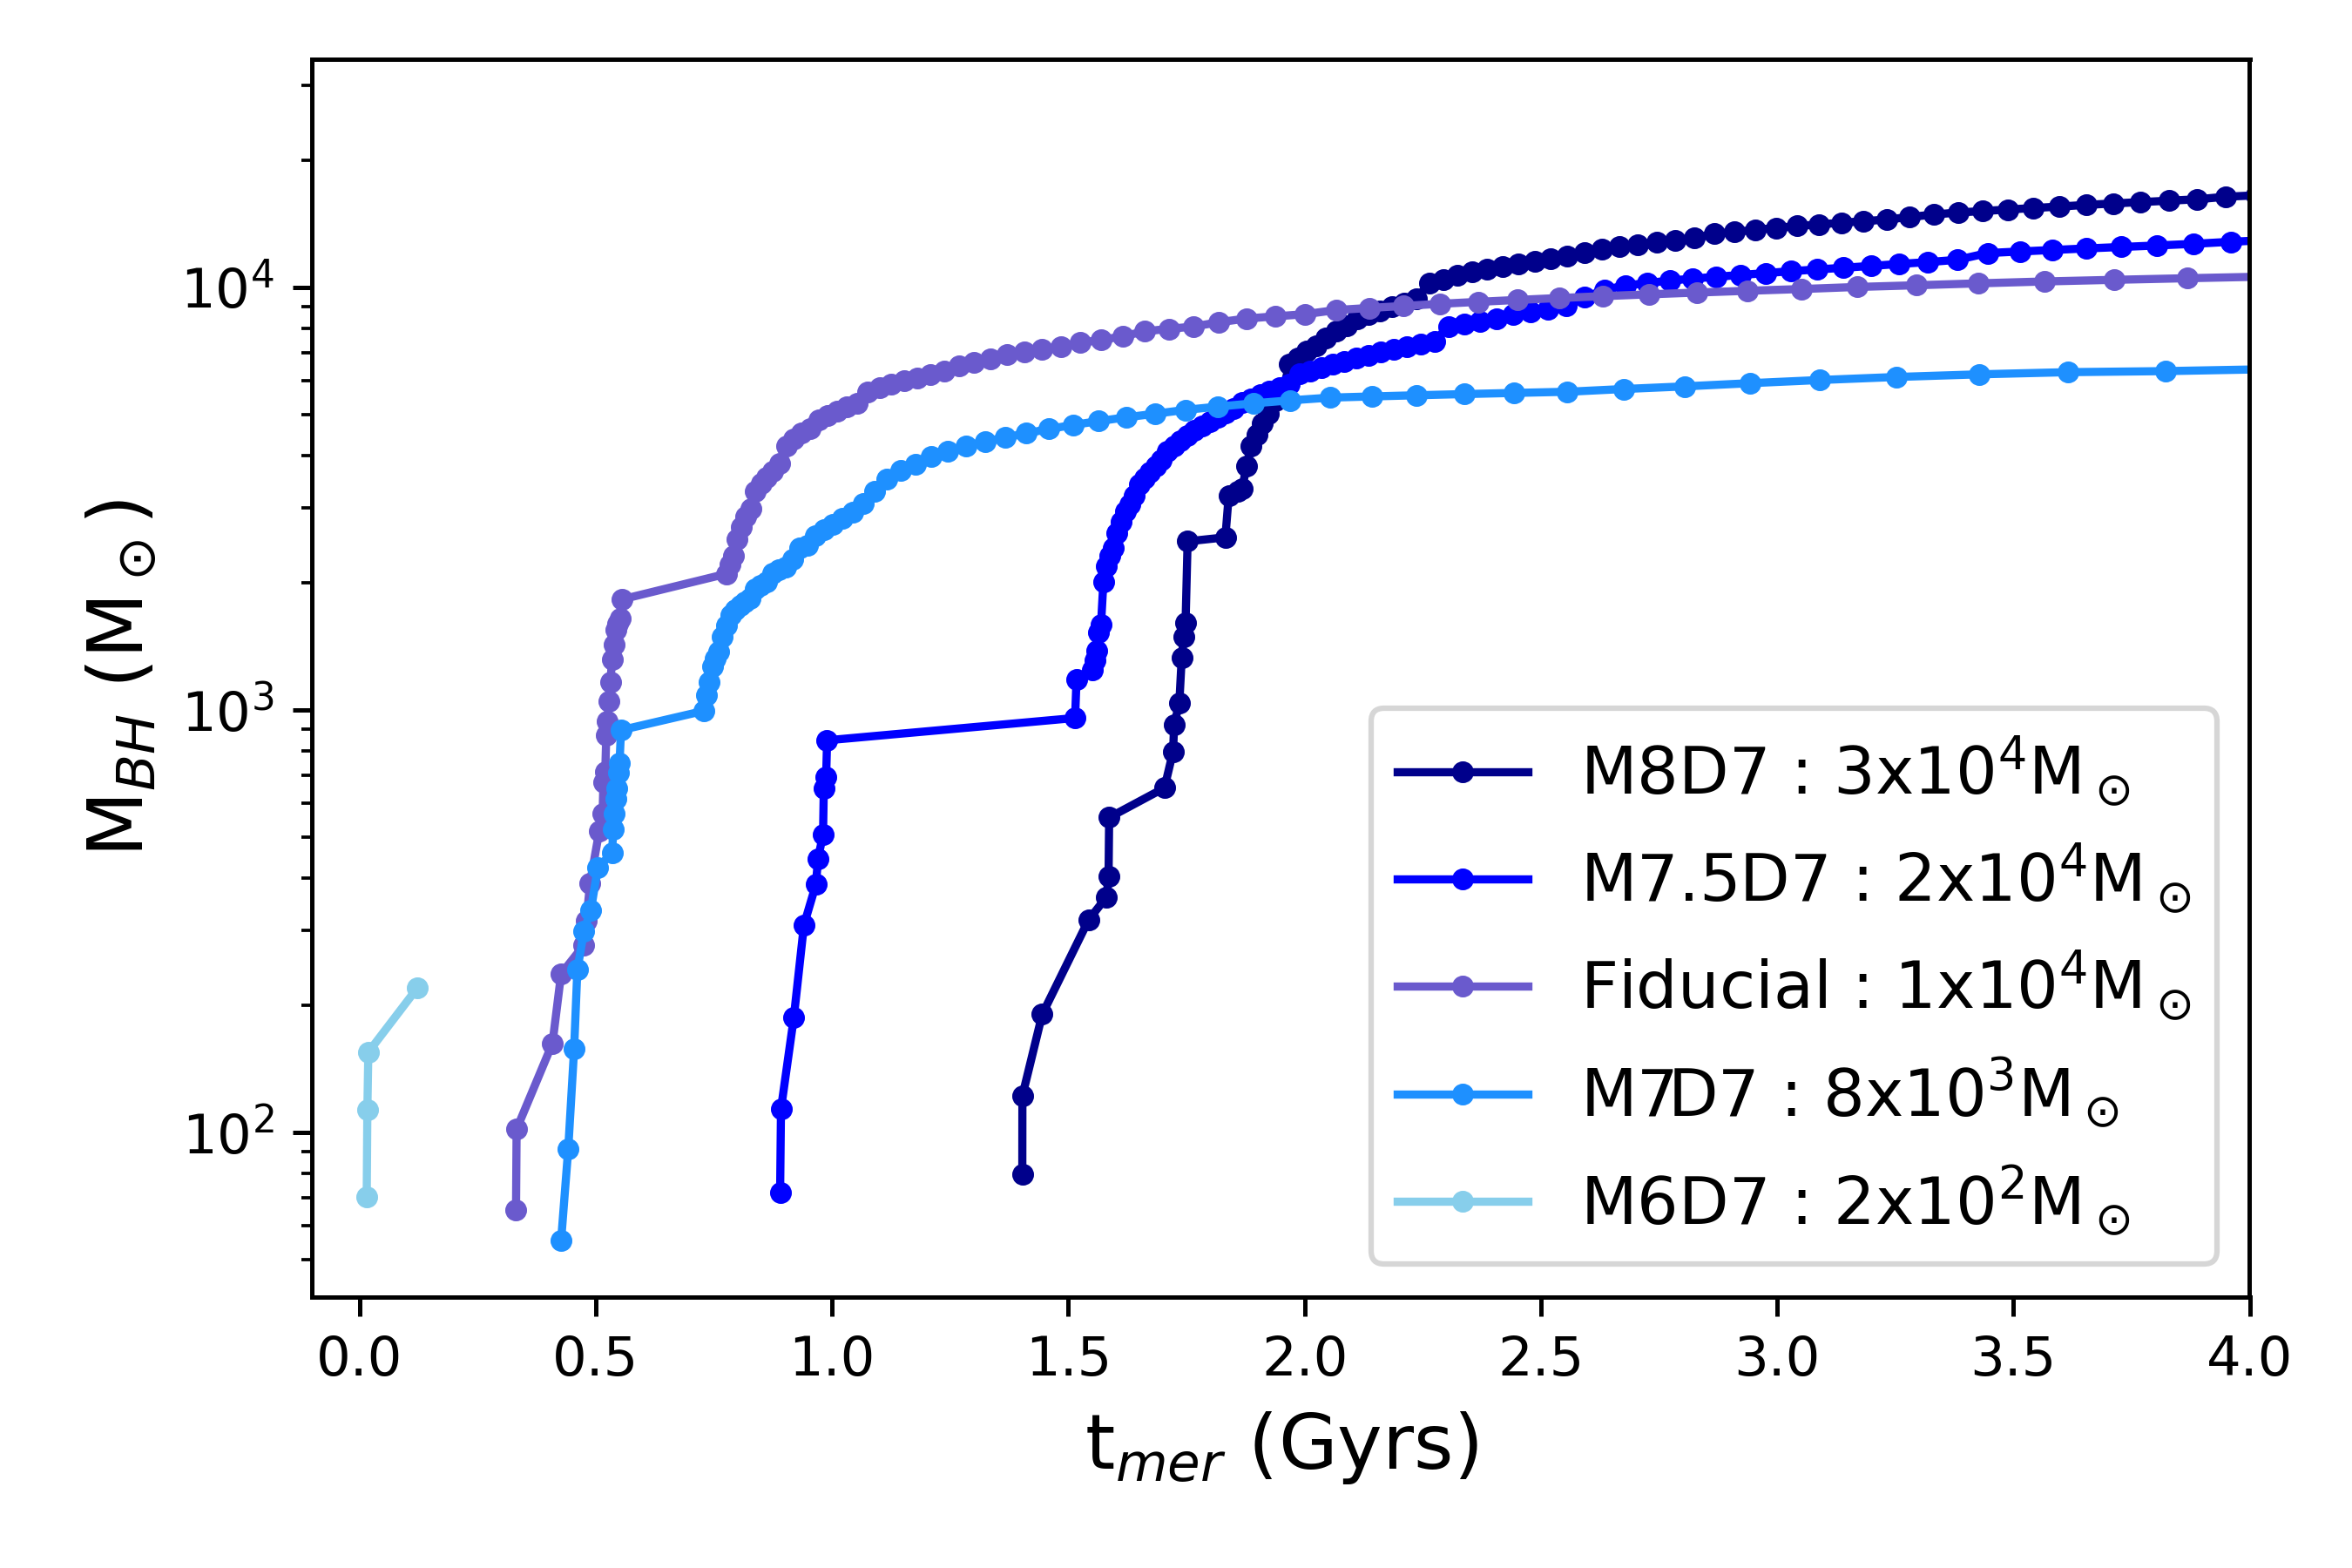
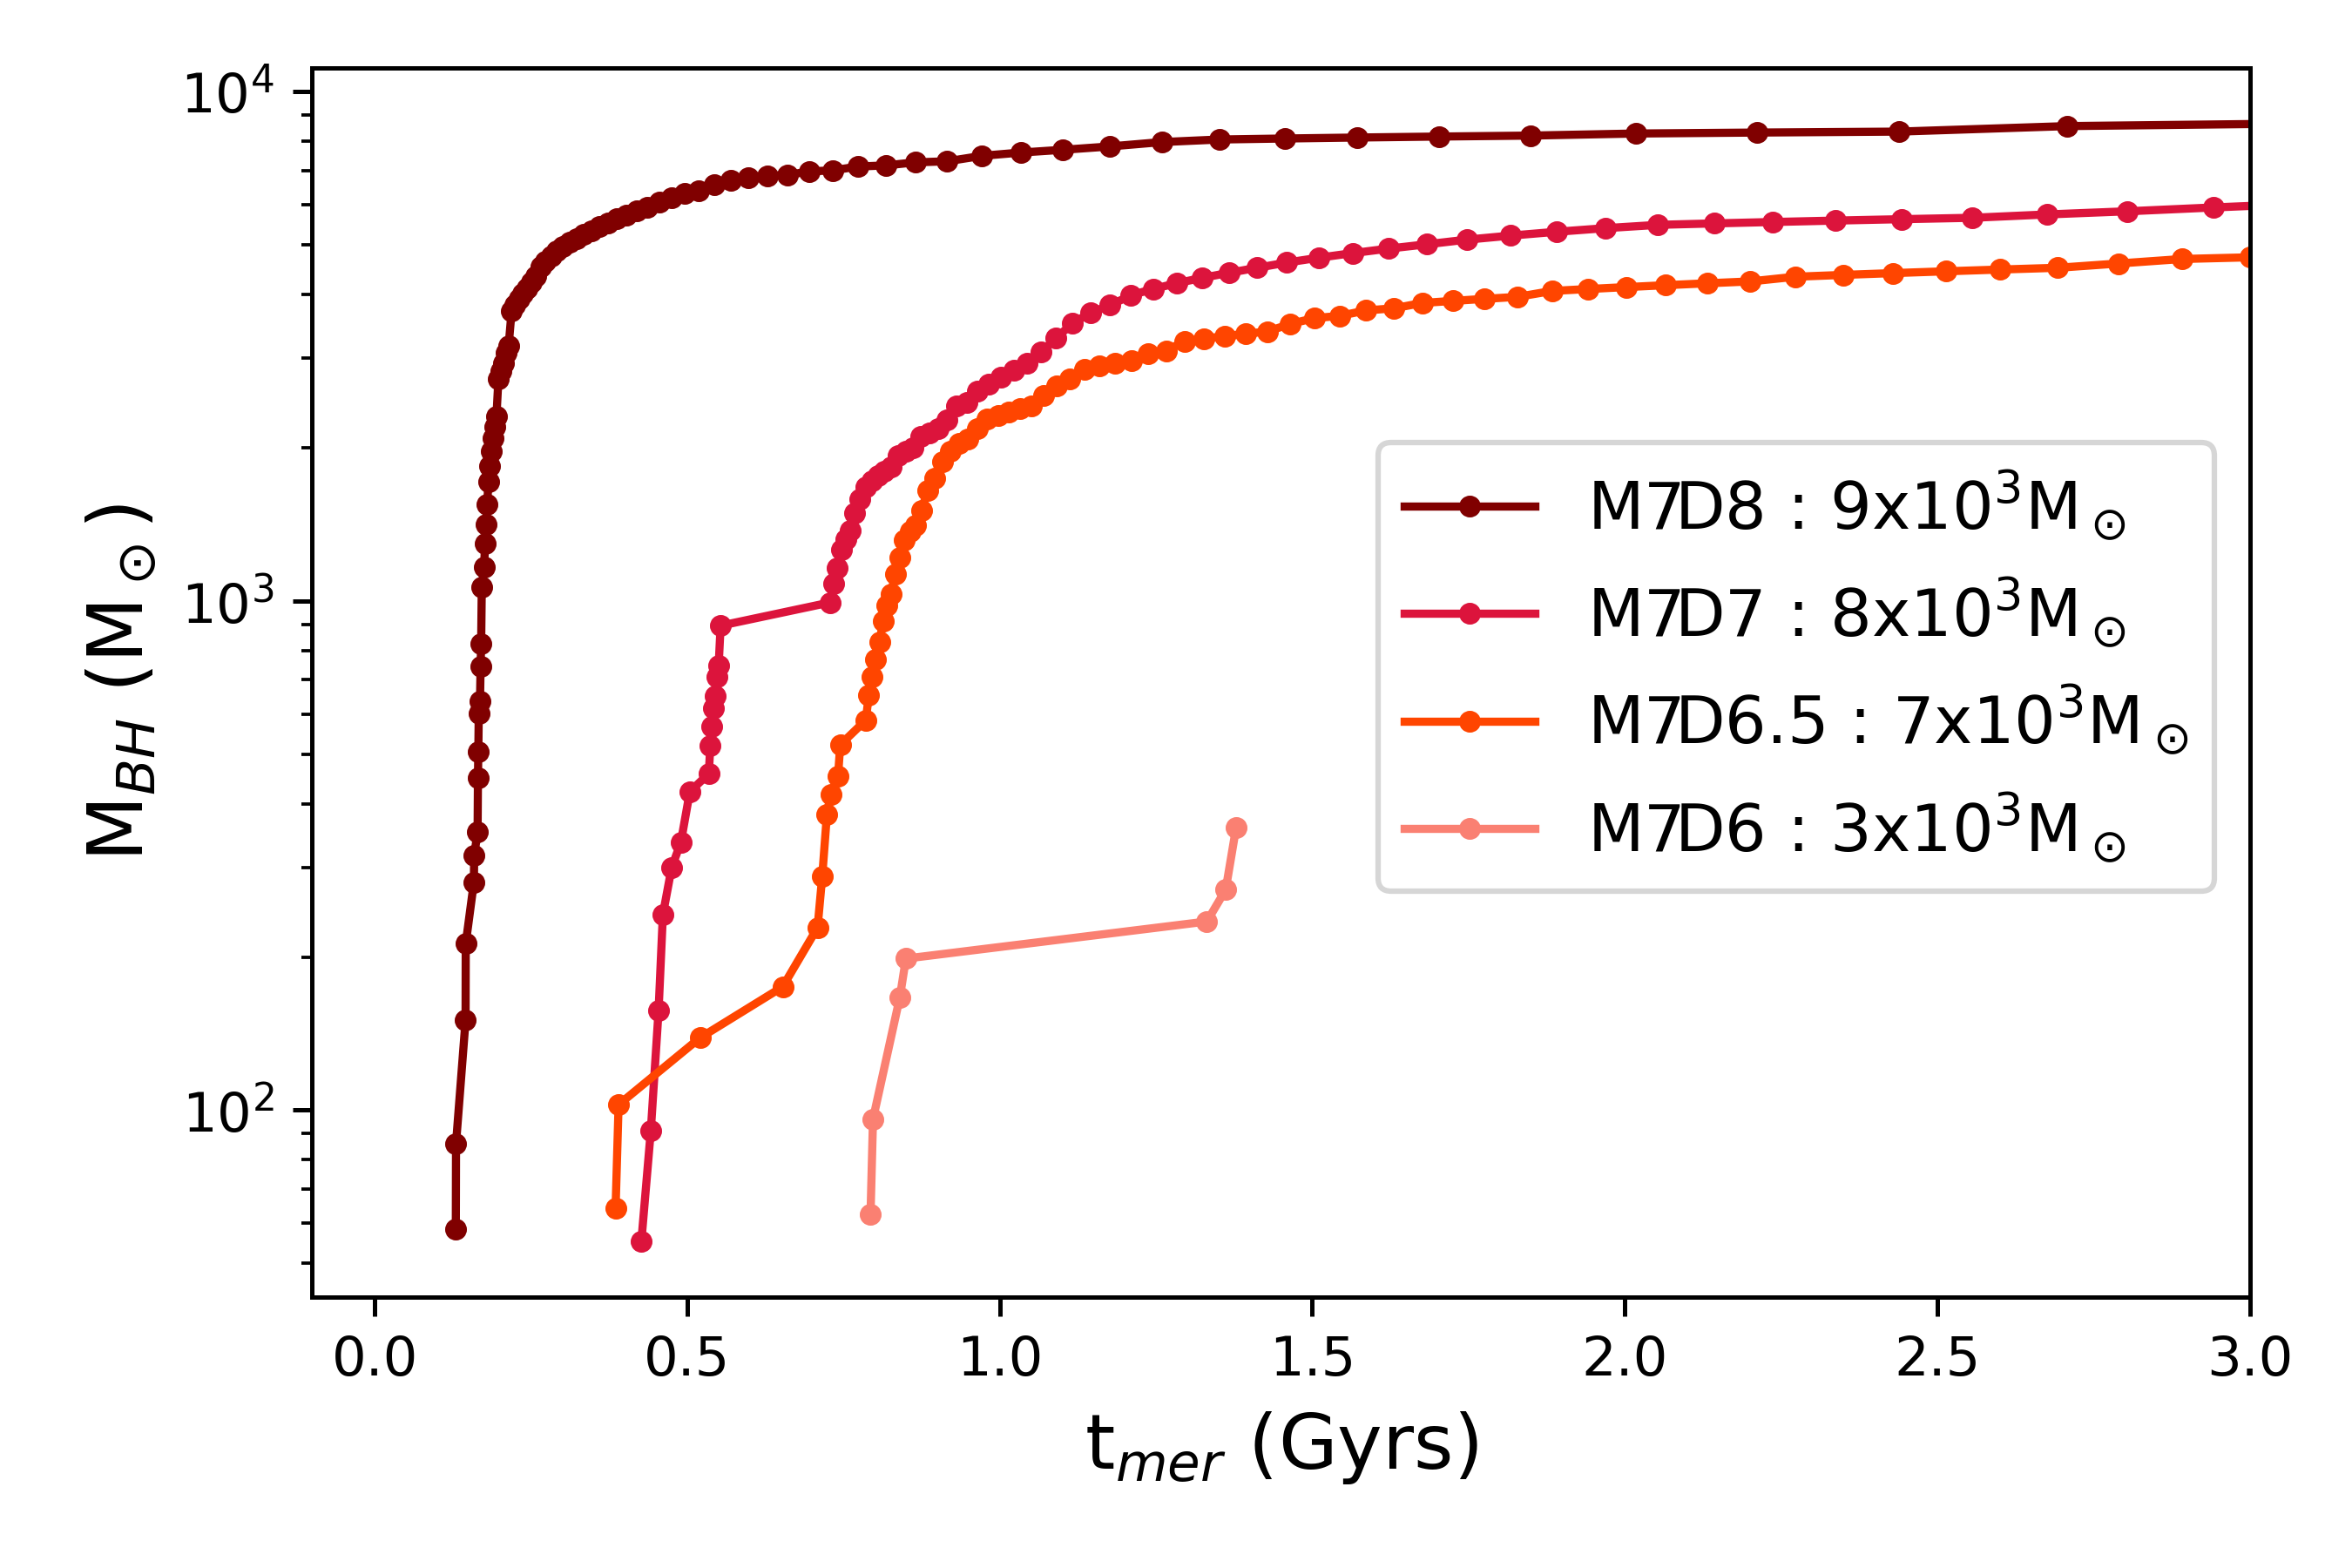
The rapidity with which DBH mergers occur and a massive BH remnant grows through hierarchical mergers depends on the host cluster’s initial mass and density. This can be seen by inspection of the ninth and tenth columns of Table LABEL:tab:IMBHmass; these record the median time required to create a BH of M⊙ () and a BH of M⊙ () respectively, and show that more massive (more dense) clusters require more time (less time) to create an IMBH of M⊙, with all other parameters remaining constant. The first DBH in our models is expected to form after cluster core collapse, when the dense core, formed through mass segregation, harbours interacting BHs. Equation 9 and 10 of Antonini & Gieles (2020b) show the dependence of the core-collapse time () on the cluster initial mass and density, such that . While is the most dominant factor in determining how rapidly the hierarchical mergers commence in a cluster, does play a role too. The upper panel of Fig. 13 shows the growth history of what becomes the most massive IMBH, reflecting this strong dependence on the initial cluster mass. M8D7 has its initial BH mergers occurring around Gyrs, and M6D7—a cluster two orders of magnitude lower in its initial mass—around Gyrs. It is interesting to note that although M8D7 begins its hierarchical mergers later than the lower-mass clusters, it overtakes the others to form the most massive IMBH of all models compared in this plot. A cluster too massive, computed without relativistic treatments for its evolution, can have a greater than a Hubble time and is therefore unsuitable for hierarchical mergers. Several models of Fragione & Silk (2020), under the assumptions of the mass spectrum factor (Eq. (9) and (10) of Antonini & Gieles (2020b) and with N ln, ), yield a greater than a Hubble time. Of course, can be lower than its traditionally-assumed value of , further increasing . The lower panel of Fig. 13 shows the hierarchical history of the cluster IMBH with respect to cluster density, showing denser clusters to have a more rapid IMBH growth. Indeed, in a cluster of too-low initial density, an IMBH never grows over a few hundred solar masses.
It is of no surprise that the spin of the IMBH, at the end of the cluster simulation ( Gyrs; a Hubble Time), shows an inverse correlation to the host cluster’s initial mass, as depicted in Fig. 14. Low-mass host clusters only have a couple of generations of hierarchical mergers, with the remnant spin reaching around , as discussed in Sec. 3.1.2. It is only in massive clusters with over mergers (column “nth G” of Table LABEL:tab:IMBHmass) that the repeated low mass ratio mergers cause the spin of the IMBH to become lower. This also translates as the higher-mass IMBHs have lower spins than their less-massive counterparts (columns “” and “” of Table LABEL:tab:IMBHmass). Although our suite of models never reach the SMBH threshold mass of 105 M⊙, with our maximum IMBH measuring (4) M⊙, it is intriguing that X-ray astronomy has shown SMBH spins to have a slight anti-correlation to their masses (Reynolds, 2013, 2021), although the spins of the SMBHs are mostly very high (Piotrovich et al., 2022) (however, there may be bias towards observing those with high spin Bonson & Gallo, 2016). There are occasional studies showing that SMBHs may have a retrograde spin effect (e.g. Wang et al., 2019)—where there is a possibility of the BH spin being lowered through anti-alignment with the accretion disc —there lacks conclusive observational evidence of retrograde spin (Garofalo, 2013) in SMBHs (Reynolds, 2013).
We acknowledge that the (likely most significant) impact of gas and accretion onto the massive BHs spin is not taken into account in our study. However, if we make the assumption that the observed SMBHs at the centre of the galaxy has formed through — a) in-situ hierarchical mergers in the galaxy’s nuclear cluster (note that the 103 M⊙ IMBH seed is formed within the first or a couple of Gyrs of cluster evolution) and b) gas accretion (we ignore the possibility of IMBH mass growth through infalling of massive globular clusters and/or inter-galactic mergers), it would appear as if the SMBHs still followed the intrinsic mass-spin distribution obtained through hierarchical mergers.
It is also interesting to note that Sagittarius A∗ of the Milky Way ( M⊙) is estimated to have a spin (Fragione & Loeb, 2020), and our Fiducial model, where the cluster mass and density after Gyr evolution is similar to that of the Milky-Way nuclear cluster as the current time, has an IMBH of. M87, with its very high mass ( M⊙), also has a lower spin measurement of (Nokhrina et al., 2019). We reiterate here that we are not drawing any conclusions with regards to SMBH mass-spin correlation here, as our study is constrained to much lower masses. Instead, we draw attention to this phenomenon and highlight the opportunity for future studies focusing on the evolution of SMBH from IMBHs through hierarchical mergers and accretion.
3.2.2 Metallicity
The metallicity (Z) impacts the mass of the cluster IMBH through determining the width of the initial BH mass spectrum. While the highest metallicity model Z_100 with (this metallicity value is approximately similar to solar metallicity, close to solar metallicity; Asplund et al., 2009) shows a narrow BH mass spectrum, with median BH mass of only about 7.3 M⊙ and maxima of M⊙, the Fiducial model of the lowest has a much wider spectrum with median around M⊙ and a maximum of M⊙, owing to diminished stellar winds at lower metallicities (Vink et al., 2001; Belczynski et al., 2010). Mass segregation and hence cluster core-collapse time is shortened at lower metallicities due to the broader mass spectrum, resulting in a more rapid onset of massive DBH mergers that quickly build up a hierarchically-formed IMBH. Table LABEL:tab:IMBHmass shows that the Fiducial model takes Gyr to form an M⊙ IMBH, compared to Z_100, which takes only Gyr—the metal-rich cluster takes about more time to create an IMBH of the same size. The dearth of initial BHs of higher masses to form the first binaries (and yield subsequently more massive systems through hierarchical mergers), combined with the slower pace of hierarchical mergers, causes the Z_100 model to have a median IMBH mass of M⊙, only times that of the Fiducial model.
3.2.3 Delayed supernovae prescription
The “delayed” prescription of Fryer et al. (2012) is used in the SN_D model. Ordinarily, the “rapid” prescription of Fryer et al. (2012) enforces a mass-gap between 2-5 M⊙ between neutron stars and BHs, while the “delayed” model allows for BHs of masses between 2.5-5 M⊙ as well. The effect of metallicity through stellar winds is the most important parameter in determining BH masses, and though the slightly more numerous lower mass BHs in SN_D receive higher natal kicks (due to the dependence on fallback mass), the mass function of SN_D and Fiducial are not significantly different. However, due to the correlation between BH natal kick and fallback mass, about 99.7% of BHs in SN_D have km s-1, compared to 96.8% in Fiducial. Due to having a little more number of massive BHs retained initially, the IMBH mass in the SN_D model is increased very slightly, only by a few M⊙.
3.2.4 BH seed
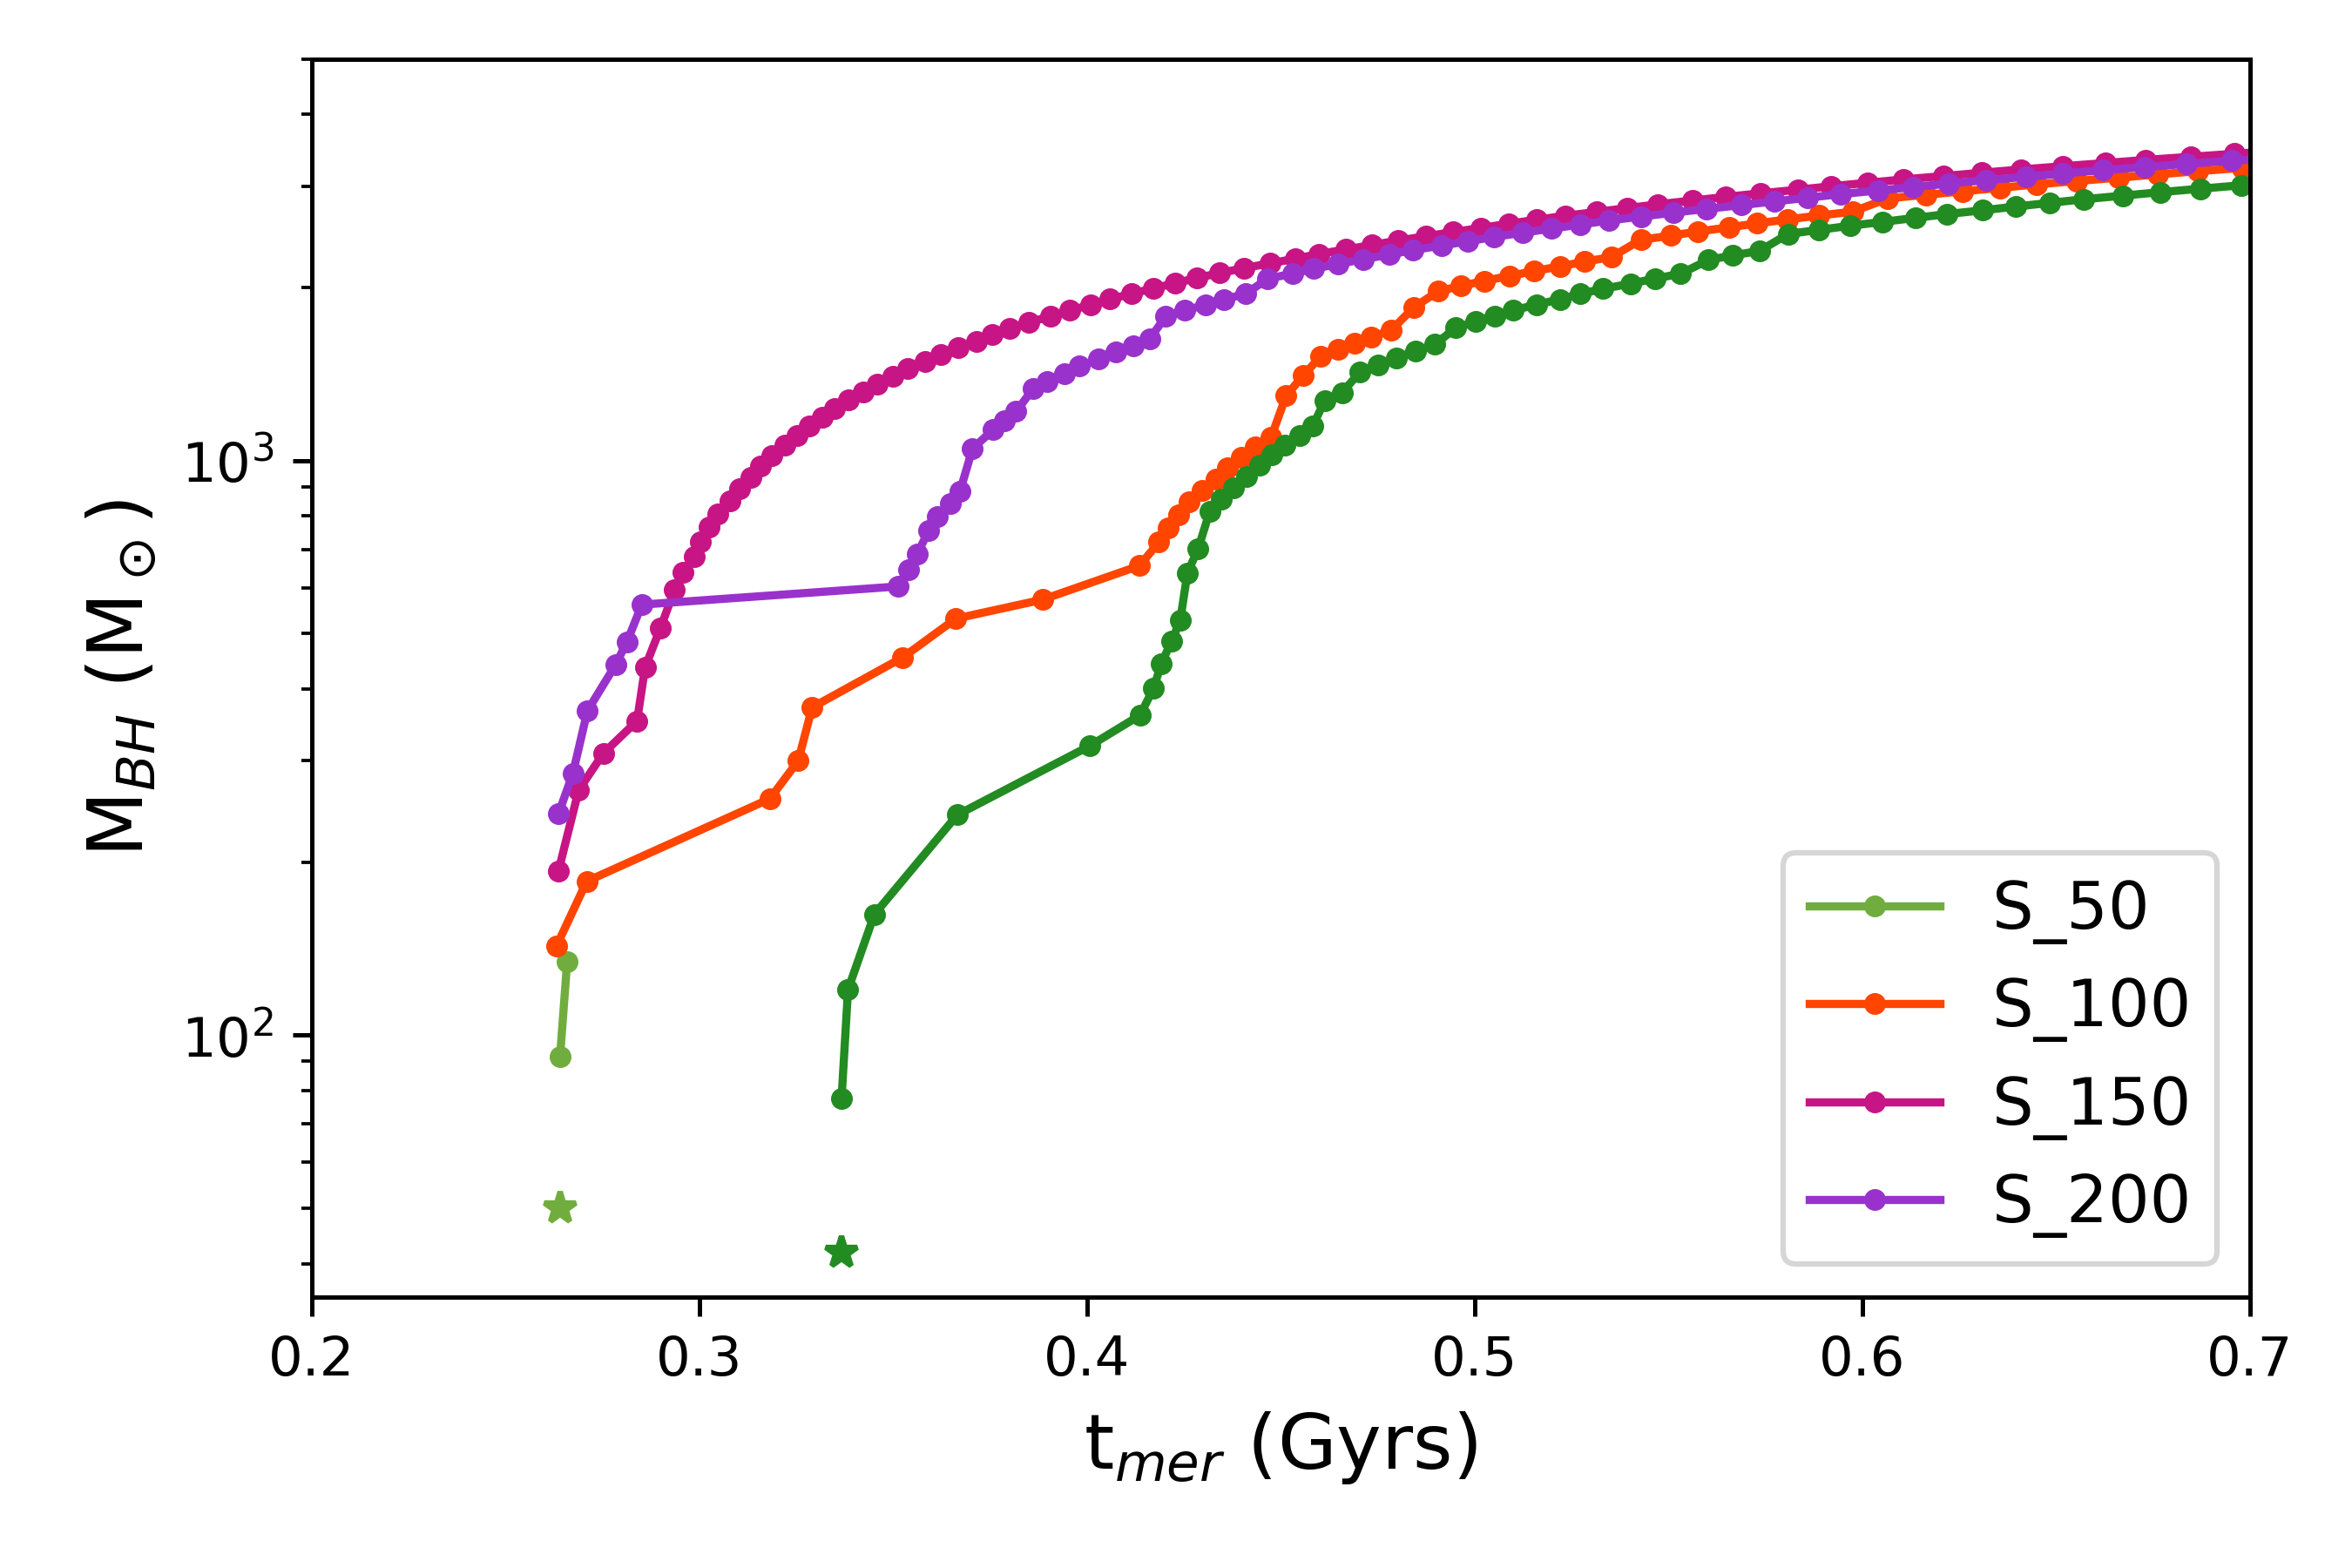
The effect of adding an initial seed BH of masses beyond that of the stellar evolution prescription is explored through models Sd_50, Sd_100, Sd_150, Sd_200, where we include at cluster initialisation BH of M⊙, M⊙, M⊙ and M⊙ respectively. We term these additional BHs as ‘seeds” since they are not directly produced through stellar evolution. Massive stars with Helium cores above M⊙ are expected to produce a remnant M⊙ and those with Helium cores larger than M⊙ are expected to fully disrupt due to thermonuclear eruptions and leave behind no remnant (Woosley, 2017; Belczynski et al., 2016b; Spera & Mapelli, 2017; Farmer et al., 2019b). This apparent gap in the BH mass spectrum (created through stellar evolution) is often termed as the (pulsational) pair instability or (P)PISN mass gap. It should be remembered with caution that the exact location of the (P)PISN gap in the BH mass spectrum is uncertain (e.g., Farmer et al., 2019a; Belczynski, 2020; Sakstein et al., 2020; Woosley & Heger, 2021; Vink et al., 2021; Spera et al., 2022), and hence a M⊙ seed BH may even be a stellar evolution remnant that evolved under special circumstances of, say, high stellar rotation (Marchant & Moriya, 2020b), or the unlikely event of suppressed stellar winds at high metallicity (Belczynski et al., 2020). Moreover, very massive stars (initial mass 200-1000 M⊙), can directly collapse to form IMBHs (Belkus et al., 2007; Yungelson et al., 2008; Sabhahit et al., 2023). Clusters with high primordial binary fractions may also have runaway stellar collisions and very efficient mass accretion from companions, creating stars as massive as M⊙ which easily form IMBHs through direct collapse (Di Carlo et al., 2021; González et al., 2021).
The hierarchical evolution of the initial seeds of models Sd_50, Sd_100, Sd_150, and Sd_200 are compared in the upper panel of Fig. 15. While for the last three models with seed mass M⊙, the BH seeds themselves develop to become the final IMBH of the cluster, this may not be the case for Sd_50. The M⊙ seed grows through merger to enter its second generation merger as a 91 M⊙ BH, which merges with a M⊙ BH and receives a recoil kick of km s-1 (almost double the cluster escape velocity) and is hence ejected. Meanwhile, an originally M⊙ stellar-origin BH grows to become the M⊙ IMBH in this model. However, in other realisations, the M seed survives, and so while and of the Sd_50 and Fiducial models are similar, of the Sd_50 model is a few M⊙ more massive.
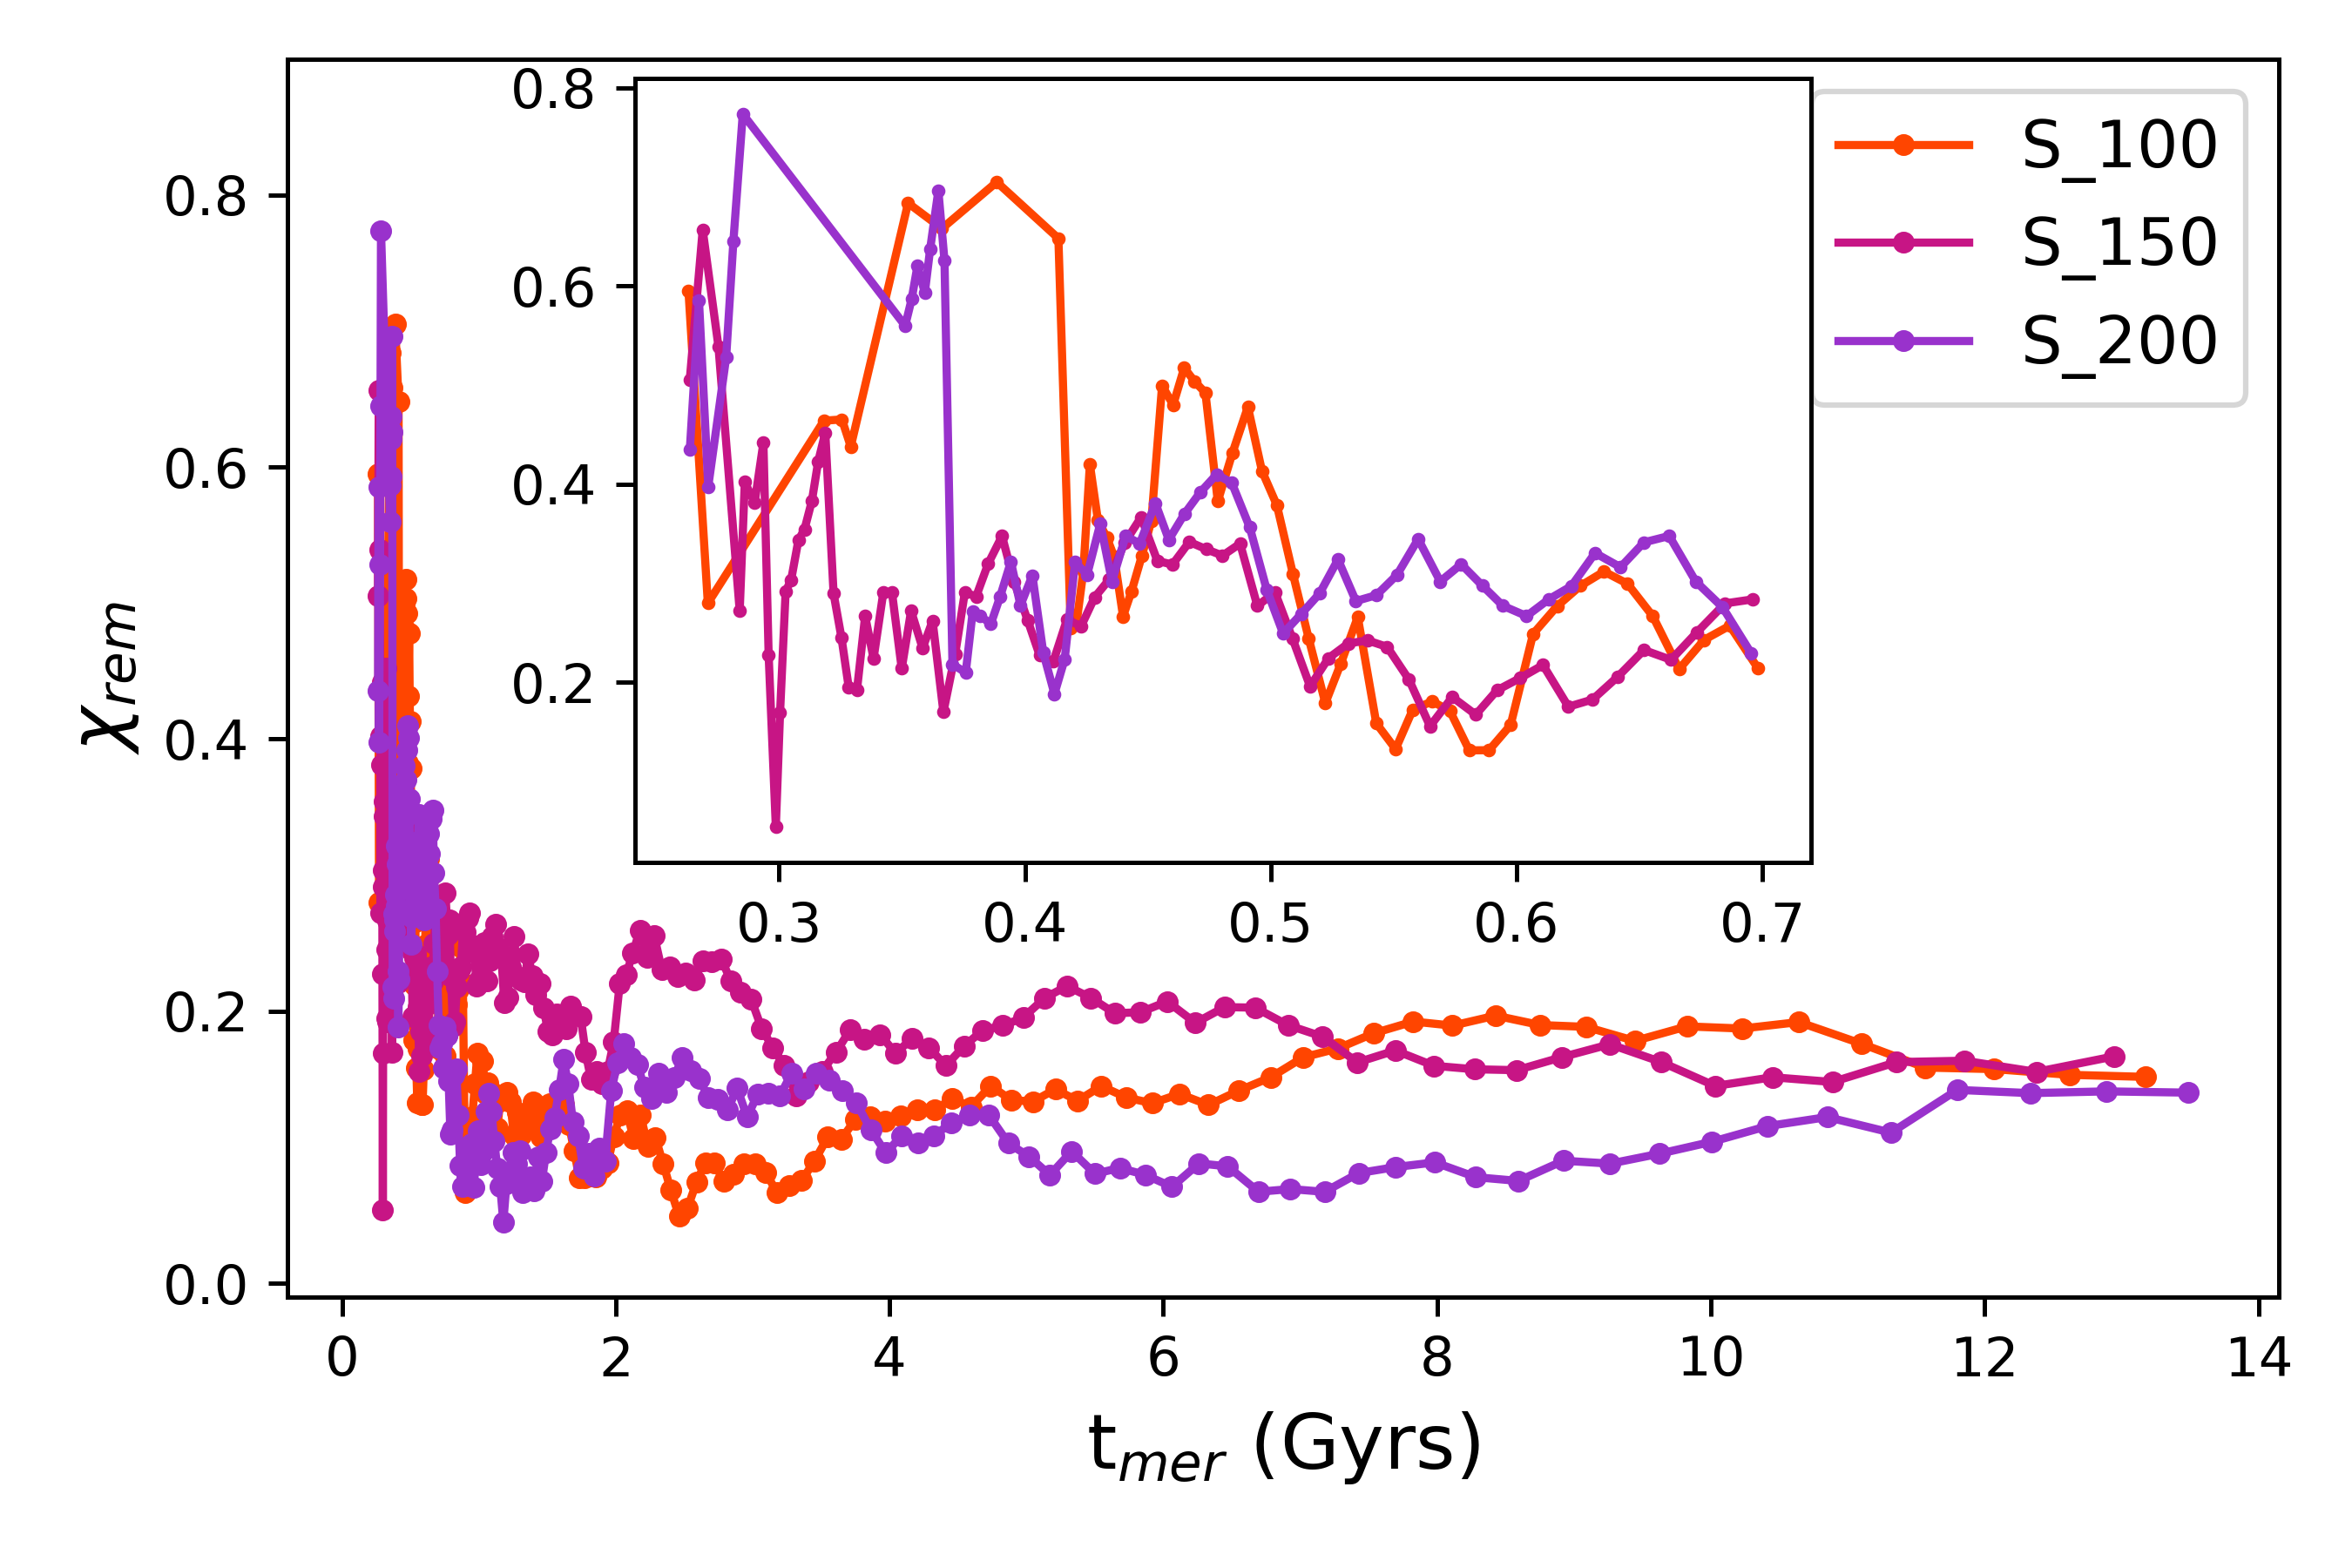
There are also instances of the more massive seeds getting ejected after a few generations. Ordinarily, in a non-seeded model such as the Fiducial model, the mass ratio will be around for the first generation and then gradually become lower through hierarchical mergers. For seeded models, specifically Sd_150 and Sd_200, the starting point of is significantly lower, around and respectively. Fig. 12 shows that actually increases between and , which may cause more second- or third- generation mergers of seeded models to be ejected compared to the Fiducial model where may be sufficiently higher in second- and third-generation mergers. Fig. 12 also illustrates that the median and percentile values for non-zero BH component spin magnitudes peaks around and remains nearly constant. For the seeded models, at the time of the first few hierarchical mergers, km s-1. If the seed has undergone a merger or two, the remnant obtains a spin magnitude (see Fig. 15, lower panel), while its non-merger remnant companion has spin magnitude . Looking at the corresponding curves of Fig. 12 we see that the percentile peak of is at , and the median reaches about a constant value from . Indeed, this also supports the observation that in models Sd_150 and Sd_200, we do obtain the smaller than Sd_50. Indeed, in cluster realizations of the model with the most massive seed, Sd_200, we do obtain the slightly less massive than in the Fiducial and Sd_50 models.
Even a M⊙ seed is not completely protected from ejection post-merger. The best way to ensure that the IMBH growth occurs solely through the seed BH, the cluster (with initial – ) must have the seed BH at least about massive than the upper end of its BH initial mass function (i.e. the seed should be M⊙ in our case) such that since first merger. This choice restricts to its lowest magnitude region in the parameter space.777Gravitational wave merger recoil kicks are also illustrated in Le Tiec et al., 2010 (Fig.1,2) and for eccentric cases in Sopuerta et al., 2007 (Fig.1,2,3), with respect to the symmetric mass ratio . For (corresponding to ), the recoil kick shows a clear peak. This case of retention vs non-retention of seed also illustrates the importance of having multiple realizations of each model, as statistical variations can change the fate of the BH seed.
3.2.5 Host cluster mass evolution
Our Fiducial model has mass loss only through stellar evolution and BH recoil ejection (Eq. (16) of Antonini & Gieles 2020b). The cluster mass for the Fiducial model after a Hubble time is about M⊙, half of its initial mass.
We use model Ml_ev as a variation which allows mass loss due to evaporative expansion (Antonini & Gieles, 2020a), but the difference in final cluster mass is negligibly small ( M⊙). Ml_ev has very similar median IMBH mass but the percentile is a few M⊙ less than that of the Fiducial model.
In the Ml_0 model, stellar mass loss is stopped, with the only BH ejections due to binary-single encounters and gravitational-wave recoils being sources of cluster mass reduction. However, since both Ml_0 and Fiducial have rather high to begin with, IMBH masses are very similar for the two models. A lower mass density modification, represented by the Ml_0M7D5 model, does result in more massive IMBHs compared to M7D5. The consequence of no stellar mass loss is also reflected in higher cluster density at Hubble Time, and in slightly shorter seed formation time.
3.2.6 BH natal kick
In view of Fig. 11, it can be seen that host clusters with escape velocities km s-1 will not be significantly affected by reducing the natal kick magnitude of the BHs; such clusters tend to retain over of the BHs immediately after stellar evolution, making them participate in the cluster dynamics. Consequently, the Vk_0 model with mass and density settings as Fiducial and initial km s-1 shows very similar IMBH masses as Fiducial (Table LABEL:tab:IMBHmass). Due to the broadening of the initial BH mass spectrum by keeping the less massive BHs, reducing the BH natal kick only slightly alters and to lower values.
The effect of no BH natal kick is insignificant even on the cluster model with lower escape velocities, Vk_0M7D5, which has the same mass density settings as model M7D5 with km s-1. In the intermediate cluster model, Vk_0M7D7 with km s-1, is lowered to about that of M7D7. This is due to the retention of more lower mass BHs and the cluster being in the transitional region, as explained in Sec. 3.2.1 and shown in the lower panel of Fig. 10. We also run model Vk_0 with solar metallicity and zero BH birth kick; its change in the IMBH mass is only marginal compared to Z_100.
We hence conclude that the BH natal kick prescription is not an important factor in deciding the hierarchical IMBH growth for clusters, as long as cluster is either sufficiently high ( km s-1) or sufficiently low ( km s-1) because the lower-mass BHs that are retained get eventually ejected by either merger recoils or binary single encounters. It is only in the intermediate region of (Fig. 10, lower panel) that altering may significantly affect .
3.2.7 initial BH spin
Models Sp_01, Sp_33, Sp_11 and Sp_LVK explore the effect of initial BH spin on the cluster IMBH mass. While the Fiducial model has initial BH spins set to , Sp_01, Sp_33 and Sp_11 set the initial spin combinations (for primary:secondary) to , and respectively. Sp_LVK has its initial BH spins drawn from the spin distribution inferred from current observations of DBH coalescences through gravitational waves.
We initiate our stellar evolution with only single stars and BH progenitor Helium stars, the latter of which (with their effective angular momentum transfer from core to envelope) are expected to become non-spinning BHs. In binaries, however, the companion of a compact object (neutron star or BH) can get tidally spun up (Qin et al., 2018; Bavera et al., 2020; Chattopadhyay et al., 2021, 2022b; Broekgaarden et al., 2022; Ma & Fuller, 2023). Sp_01 hence allows the lower-mass secondary component to have higher spin. Although there are conflicting results on the efficacy of tidally spinning up BHs through dynamics (Le Tiec & Casals, 2021; Chia, 2021), models Sp_33 and Sp_11 can be thought of as intermediate and extremal cases of the effect of initial BH spin on hierarchical mergers. Given that we start our cluster models with only single stars and expect close dynamical encounters to onset after the core forms, the Fiducial model is the most realistic. The variation of with respect to the primary spin for different secondary spins with a fixed mass ratio (roughly representing the initial in-cluster mergers) is shown in Fig. 16. We concentrate particularly on the region with km s-1, which approximately corresponds to the for the Fiducial and “Sp” models at the time of the first DBH mergers. At the onset, high-spin BHs easily obtain large kicks, prohibiting the growth of the IMBH and resulting in a suppression of the value of of Table LABEL:tab:IMBHmass (models Sp_11 and Sp_LVK have about and of Fiducial). For the model realizations where the initial mergers chance to remain in the cluster, after a couple of mergers with now, the become very similar to each other for all models, thereby resulting in very similar values of . We conclude that the choice of initial spins has a secondary effect on the hierarchical growth of an IMBH in a star cluster.
3.2.8 BH ordered pairing
In the Ord_BH model, we change the (initial BH mass spectrum dependent) power-law probability distribution in pairing the BHs in binaries and triples (as described in Sec. 2 and Antonini et al., 2023) to complete ordered pairing. In other words, the most massive BH in the Ord_BH model is paired with the second-most massive one, followed by the third-most massive as the single perturber.
For a binary of mass and a single of mass , the recoil kick of the binary from this binary-single encounter is
| (7) |
where /(+), is the semi-major axis, is the gravitational constant, and is a function of which is always for all models but the set labelled “DE”, where it is constant at . Equation 7 reveals that an increase in increases . All other variables remaining constant, With , reaches a local maximum and then decreases (although the variation is obviously lower than that with respect to ). The expression for is symmetric in and .
In the Fiducial model, the power-law probability distribution ensures the binary-single encounter is composed of massive BHs from the mass spectrum. Unlike in the Ord_BH model, there is no guarantee that the three most massive BHs will be the objects engaging in the binary-single encounter. This results in substantially decreasing in the Ord_BH model to only about of that of the Fiducial model: in some of the cluster realisations, the third BH can become massive enough to increase . and are also reduced significantly in the Ord_BH model compared to the Fiducial model.
3.2.9 Tertiary mass dependent energy loss
The set of models labelled with the “DE” moniker contains those with constant tertiary-induced binary energy loss fraction . In all other models this value is the maximum, valid only in equal-mass interactions. One outcome of this is that the IMBH mass is reduced by a few thousand M⊙ in the DE models in comparison to those produced in the Fiducial model. Since there is more energy absorption per interaction in the DE models than the Fiducial model, the IMBH formation timescales ( and ) are slightly shorter. It takes longer for a binary in the Fiducial model to reach the gravitational-wave driven regime from dynamically-driven regime, since in Equation 20 of Antonini & Gieles 2020b is lowered. The energy loss per binary-single interaction, fixed at in the DE models, is lower in the Fiducial model, in the case of << .888A binary of masses ‘’, semi-major axis ‘’ and generating energy ‘’ at the cluster core is expected to enter gravitational-wave driven regime when eccentricity . For DE models, the semi-major axis is larger than that in the Fiducial model due to the perturbing single absorbing more energy (the maximum of , valid in other models only for equal-mass systems) from the binary, causing the binary separation to shrink more per interaction. However, is still set by Henon’s principle, so only depends on the cluster global properties of mass and density. For a bound period of time (a Hubble time, in our case), the Fiducial model cluster hosts fewer mergers than the DE models, by a factor of . If we compare the ratio of mergers with M⊙ to the total number of mergers (, listed in Table LABEL:tab:IMBHmass), the DE models still have about more IMBH-regime (primary mass M⊙) mergers than the Fiducial model.
However, it is clear from Eq. (7) that the DE models will also have a larger , as well as larger tertiary kick (Antonini et al., 2023). Hence, the DE models eject more binaries (and tertiaries) through binary-single encounters, reducing the mass growth of IMBHs in the long run. This lowering of IMBH mass is most strongly affected in the intermediate cluster DEM7D7, where is only that of M7D7. Even lower-density cluster DEM7D5 and metal rich DEZ_100 have less massive IMBHs compared to those that arise in M7D5 and Z_100. It may therefore be argued that the functional form of which takes into account the mass of the tertiary is indeed an important parameter to be taken into account in the fast codes of rapid cluster evolution models.
3.2.10 IMBH relative rates
The fraction of mergers that occur in the IMBH regime, i.e. having a primary mass of M⊙, can be expressed as the ratio of the total number of mergers with M⊙ to the total number of mergers per cluster; this is shown in the column marked of Table LABEL:tab:IMBHmass. Denser and more massive clusters have a much higher , and within our models, it varies largely . In the Fiducial model, of all mergers have a M⊙ primary, while in the M8D8 model % of all mergers are in the IMBH regime.
3.3 Ex-situ mergers
Binaries can get ejected and merge ex-situ, i.e., outside the cluster. A binary is expelled through binary-single interaction when , where is obtained from Equation 7. Under the ejection condition, we can expect in the ex-situ mergers less massive binaries, triples with a more massive third body interloper, smaller binary semi-major axes, and lower . In the DE set of models, always (making ), while in all other models including the Fiducial model, is mass-dependent, and is lowered as the mass ratio between the interloper and the binary becomes more asymmetric with the formation of an IMBH.
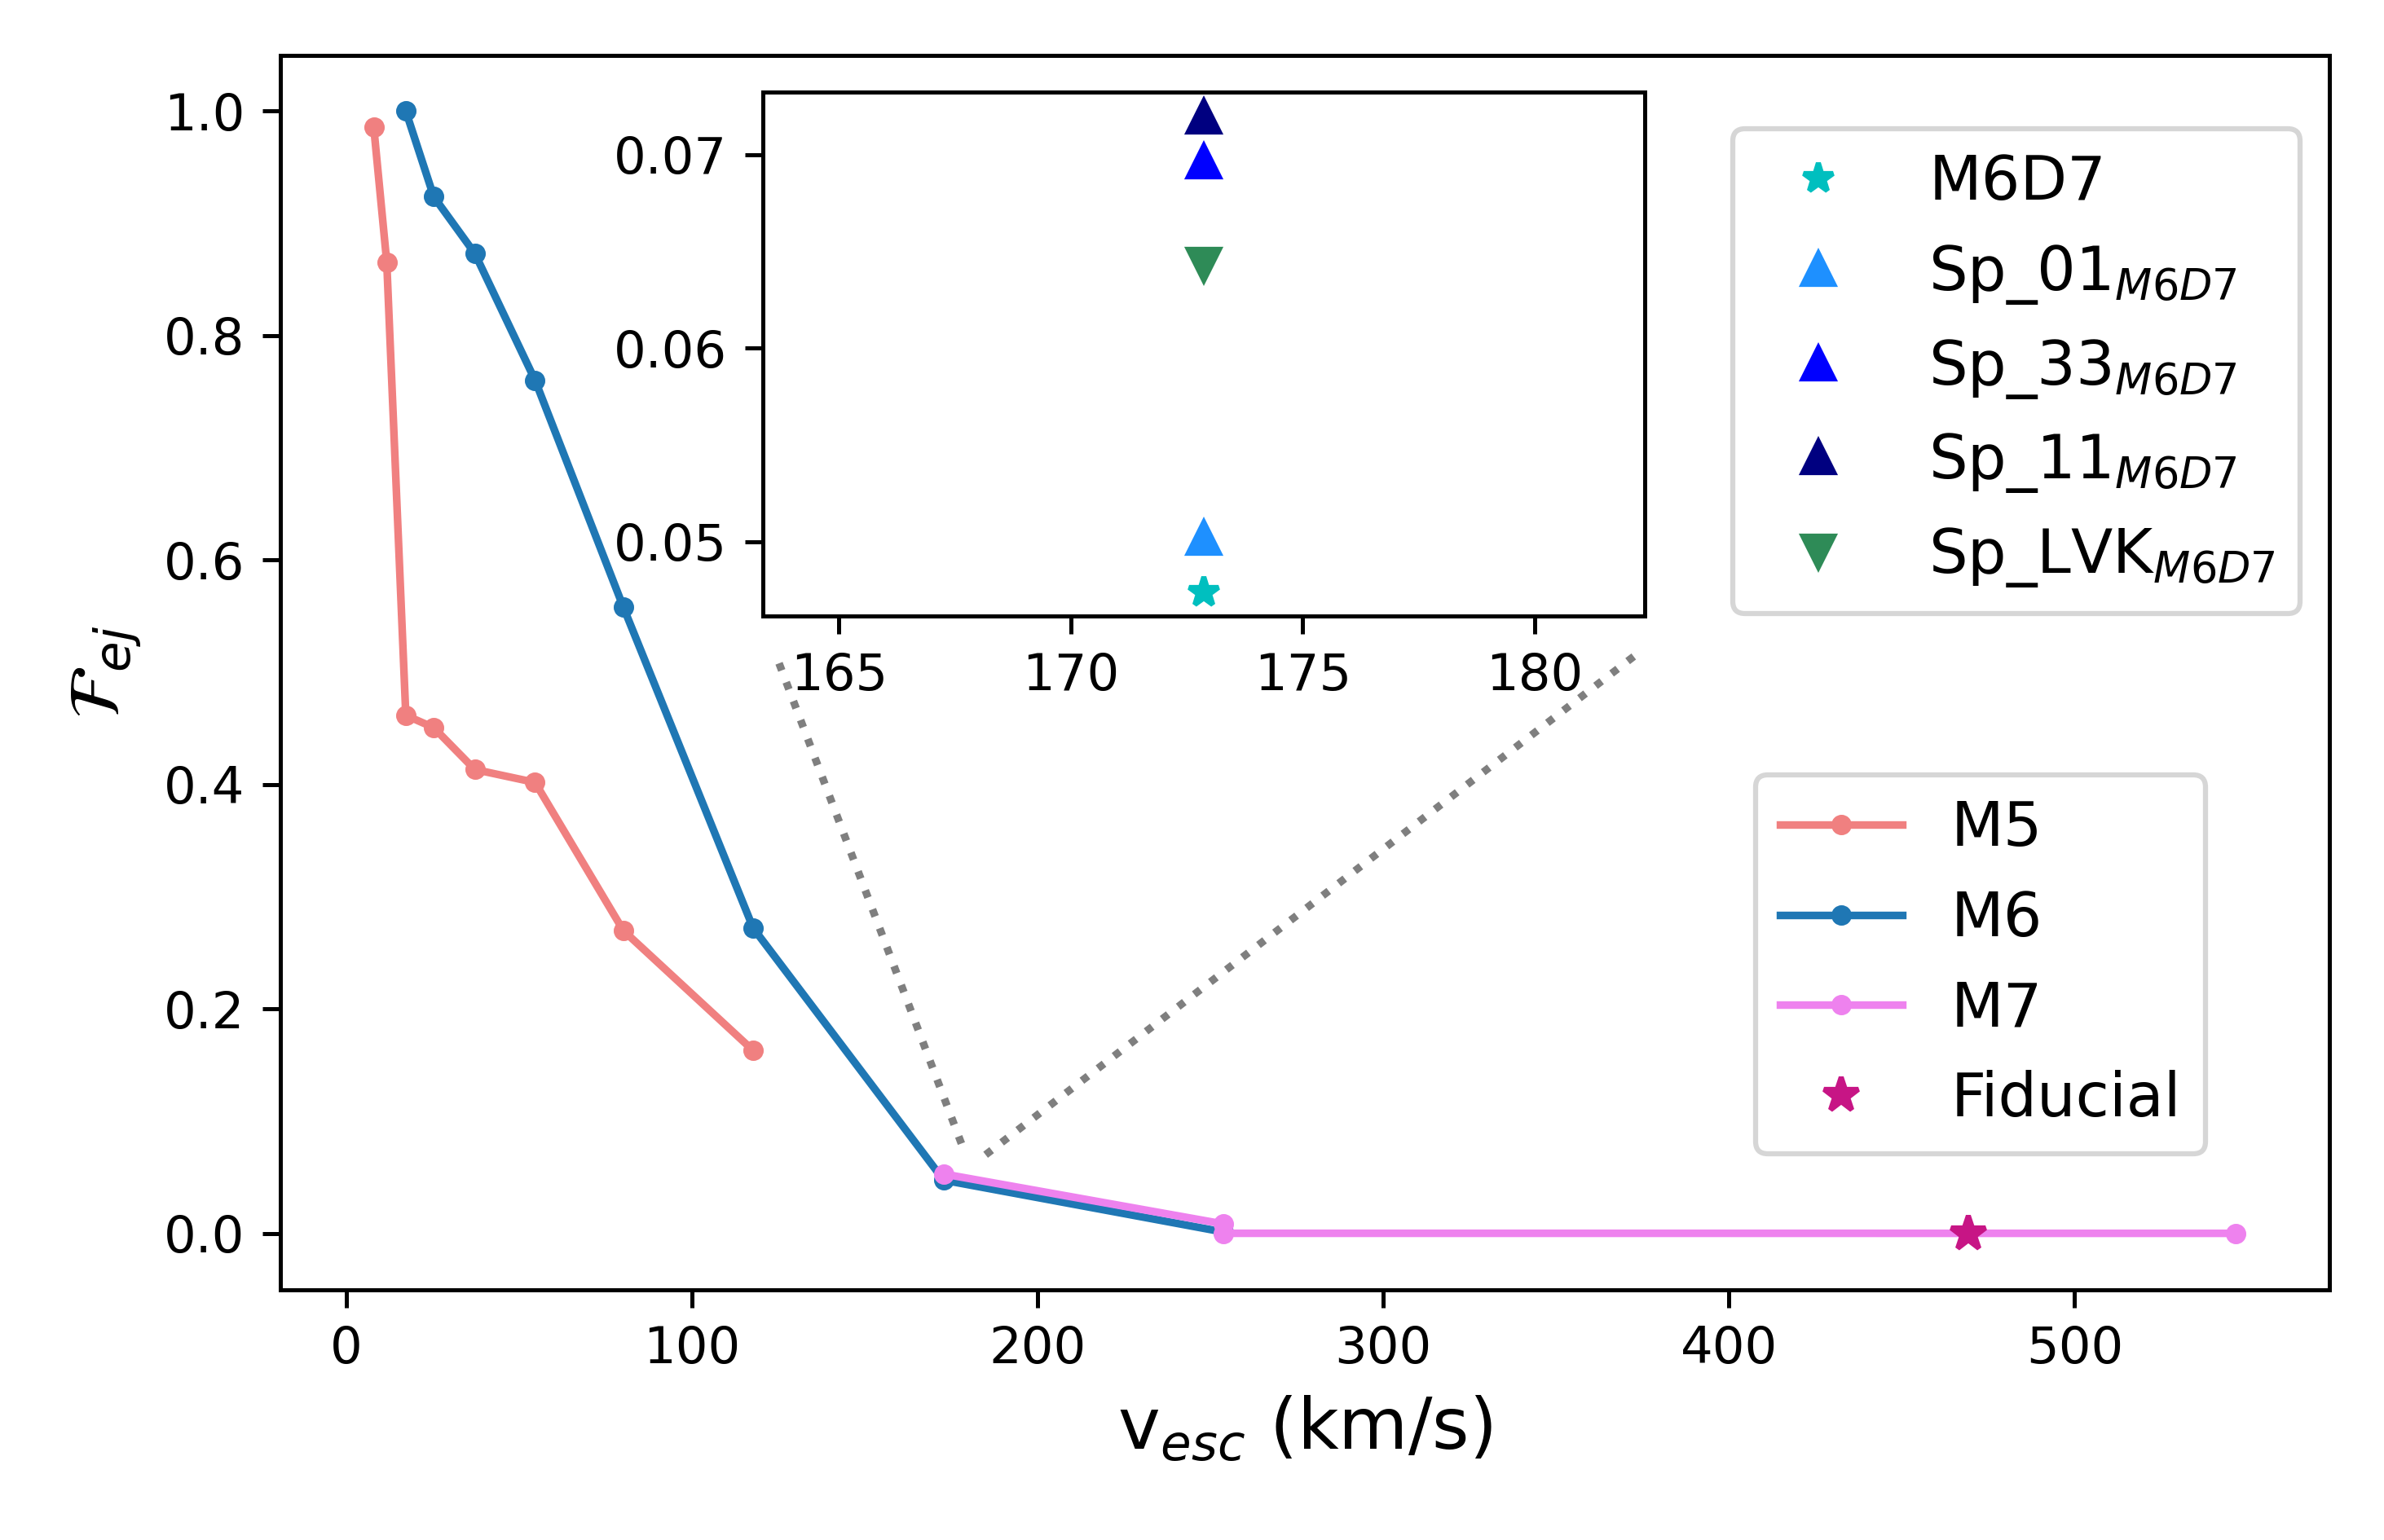
The fraction of ejected DBH mergers to in-cluster mergers () for varying initial cluster escape velocity is shown in Fig. 17. Cluster plays the key role in deciding , with nearly all of the mergers being ex-situ for sufficiently low km s-1. Such clusters, if evolved with direct NBODY models, may still show in-situ mergers due to a high primordial binary fraction and higher multiplicity interactions (Banerjee, 2018, 2021; Chattopadhyay et al., 2022a).
The initial mass and density of the cluster, independently from , also govern . For the same value of initial , a smaller-mass cluster (hence, higher-density) results in fewer ex-situ mergers, as shown in the M5 and M6 models in Fig. 17.
The initial spin distribution of the BHs also determine , with high initial spin models having more ejected mergers (see the inset plot of Fig. 17). This is because high-spins translate into high recoil kicks, as explained in Sec. 3.2.7). This means that increases, even though the number of ex-situ mergers does not vary much between models with different initial spin distributions.
For the ‘DE’ set of models, , unlike in all other models where it is , causing more binaries to be ejected out of the cluster in the DE models. The effect, however, is small; for models M7D5 and DEM7D5 (both with initial cluster mass of M⊙ and density M⊙ pc-3) are and , respectively. For M6D5, with initial mass and density M⊙ and M⊙ pc-3, the ejected mergers make up a fraction of of all mergers, compared to a constant DE model of same initial mass and density where . The difference disappears for clusters of high because there are fewer ejections.
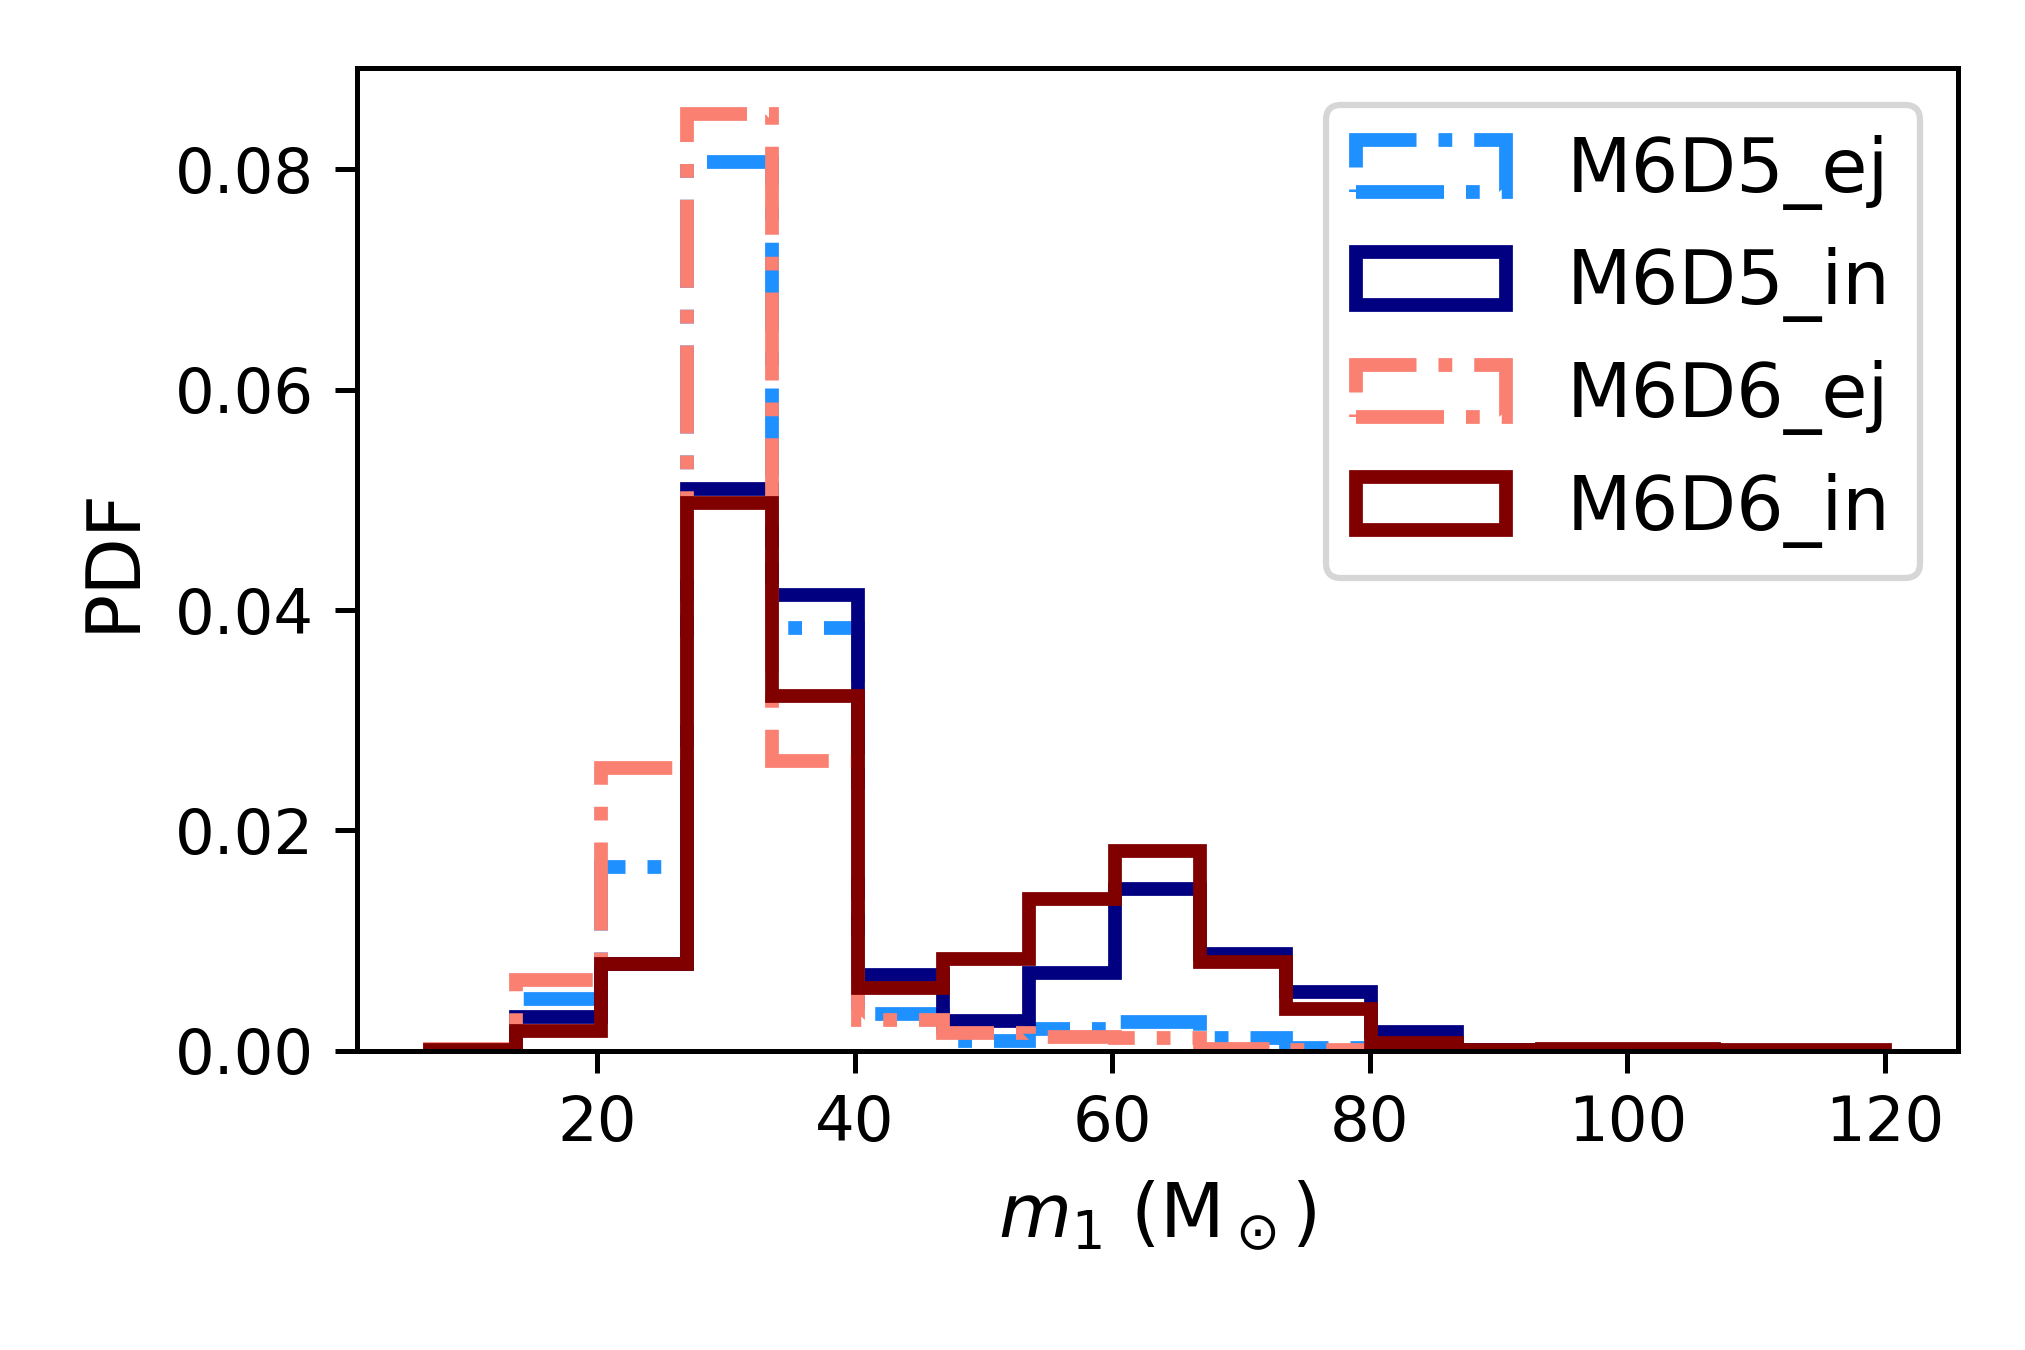
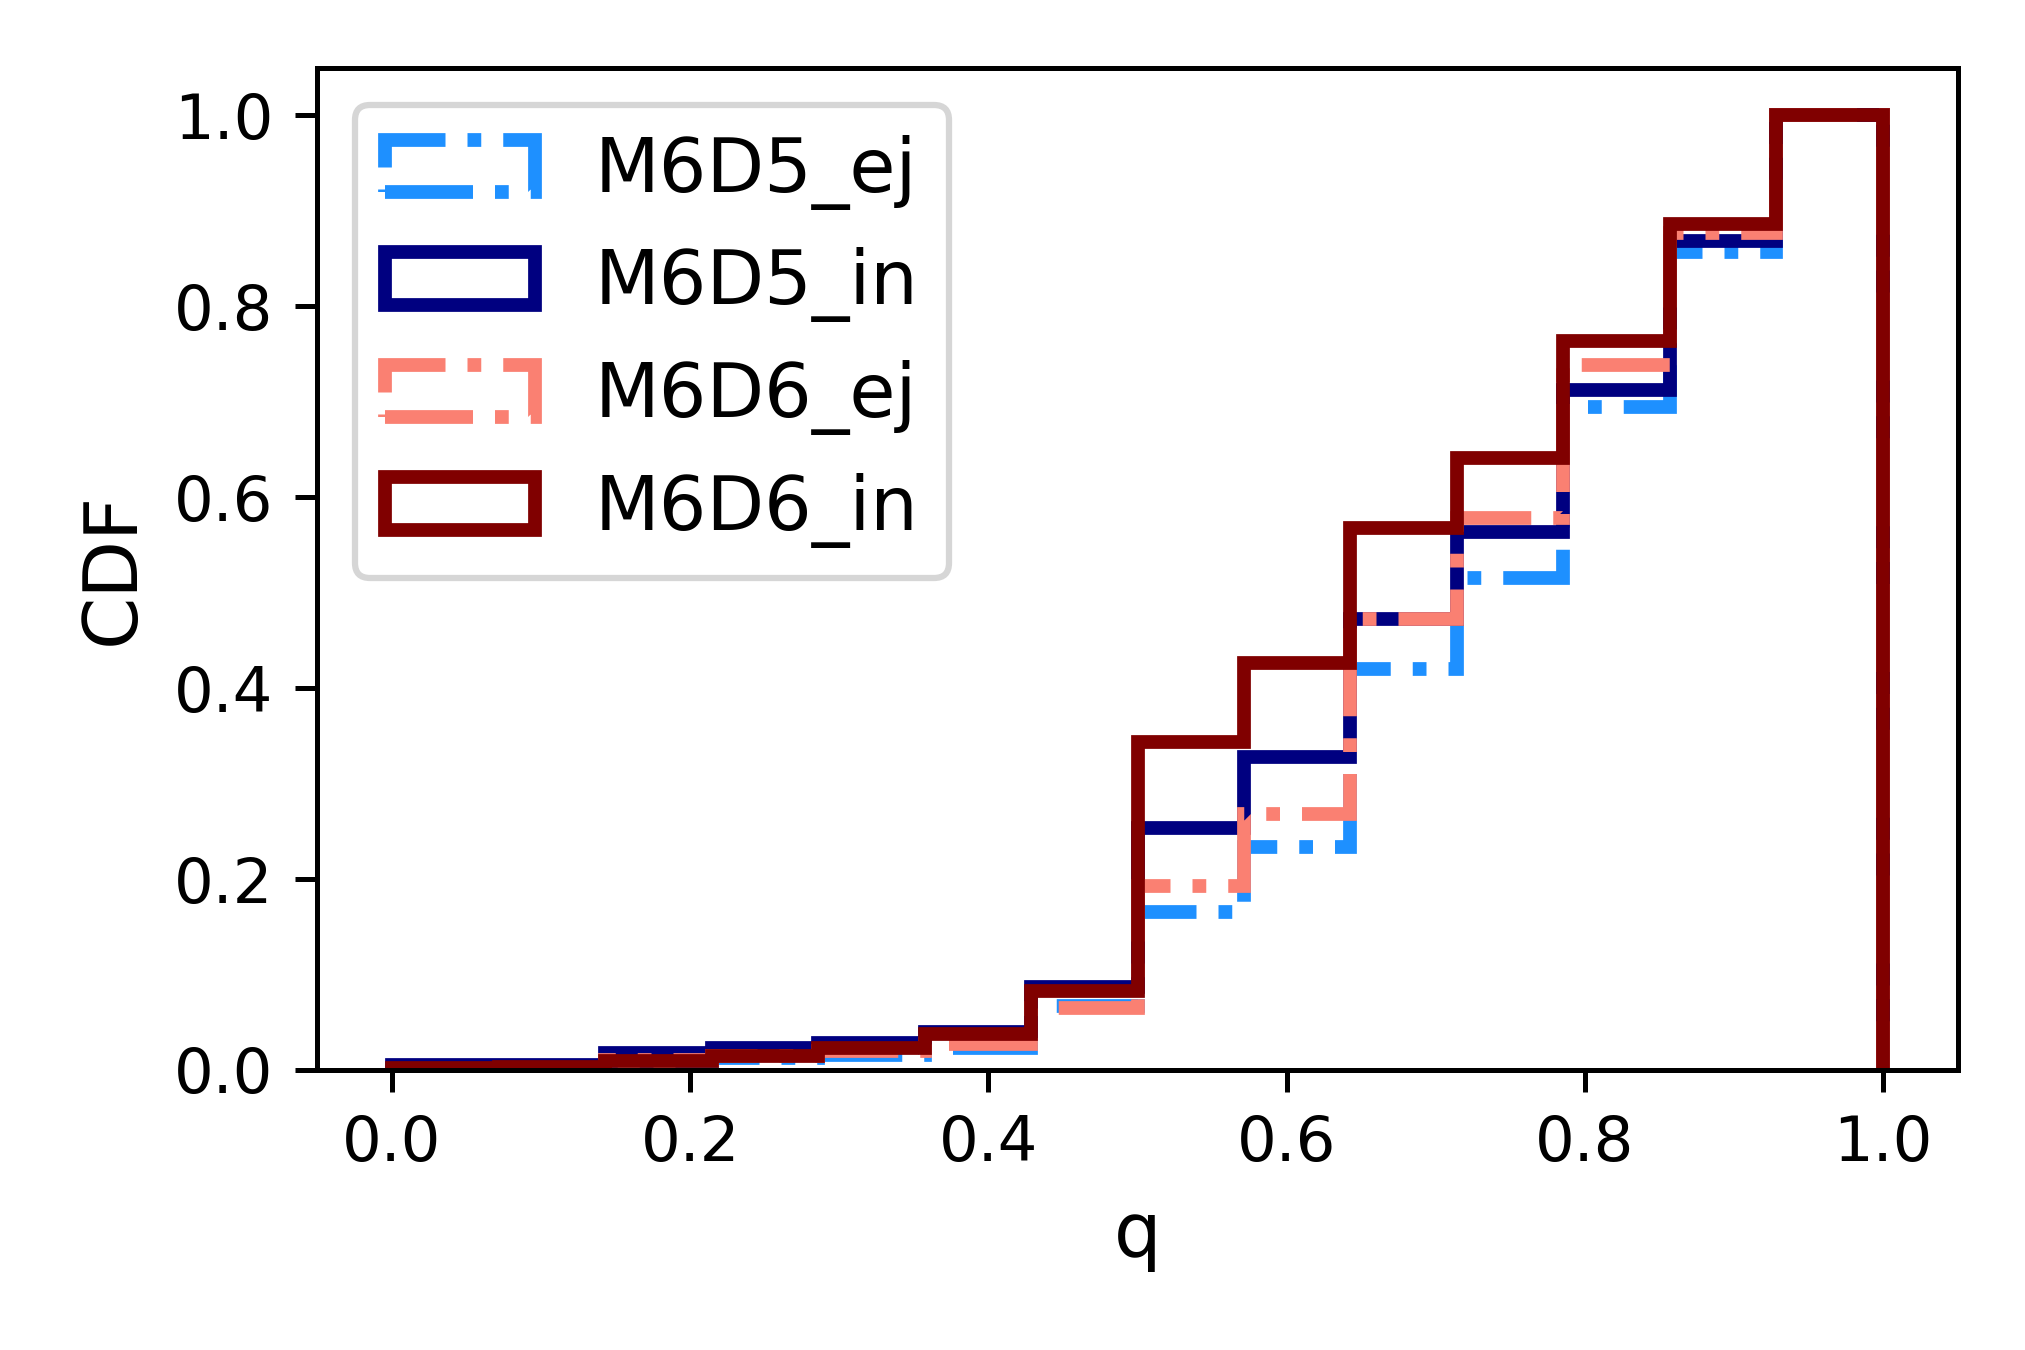
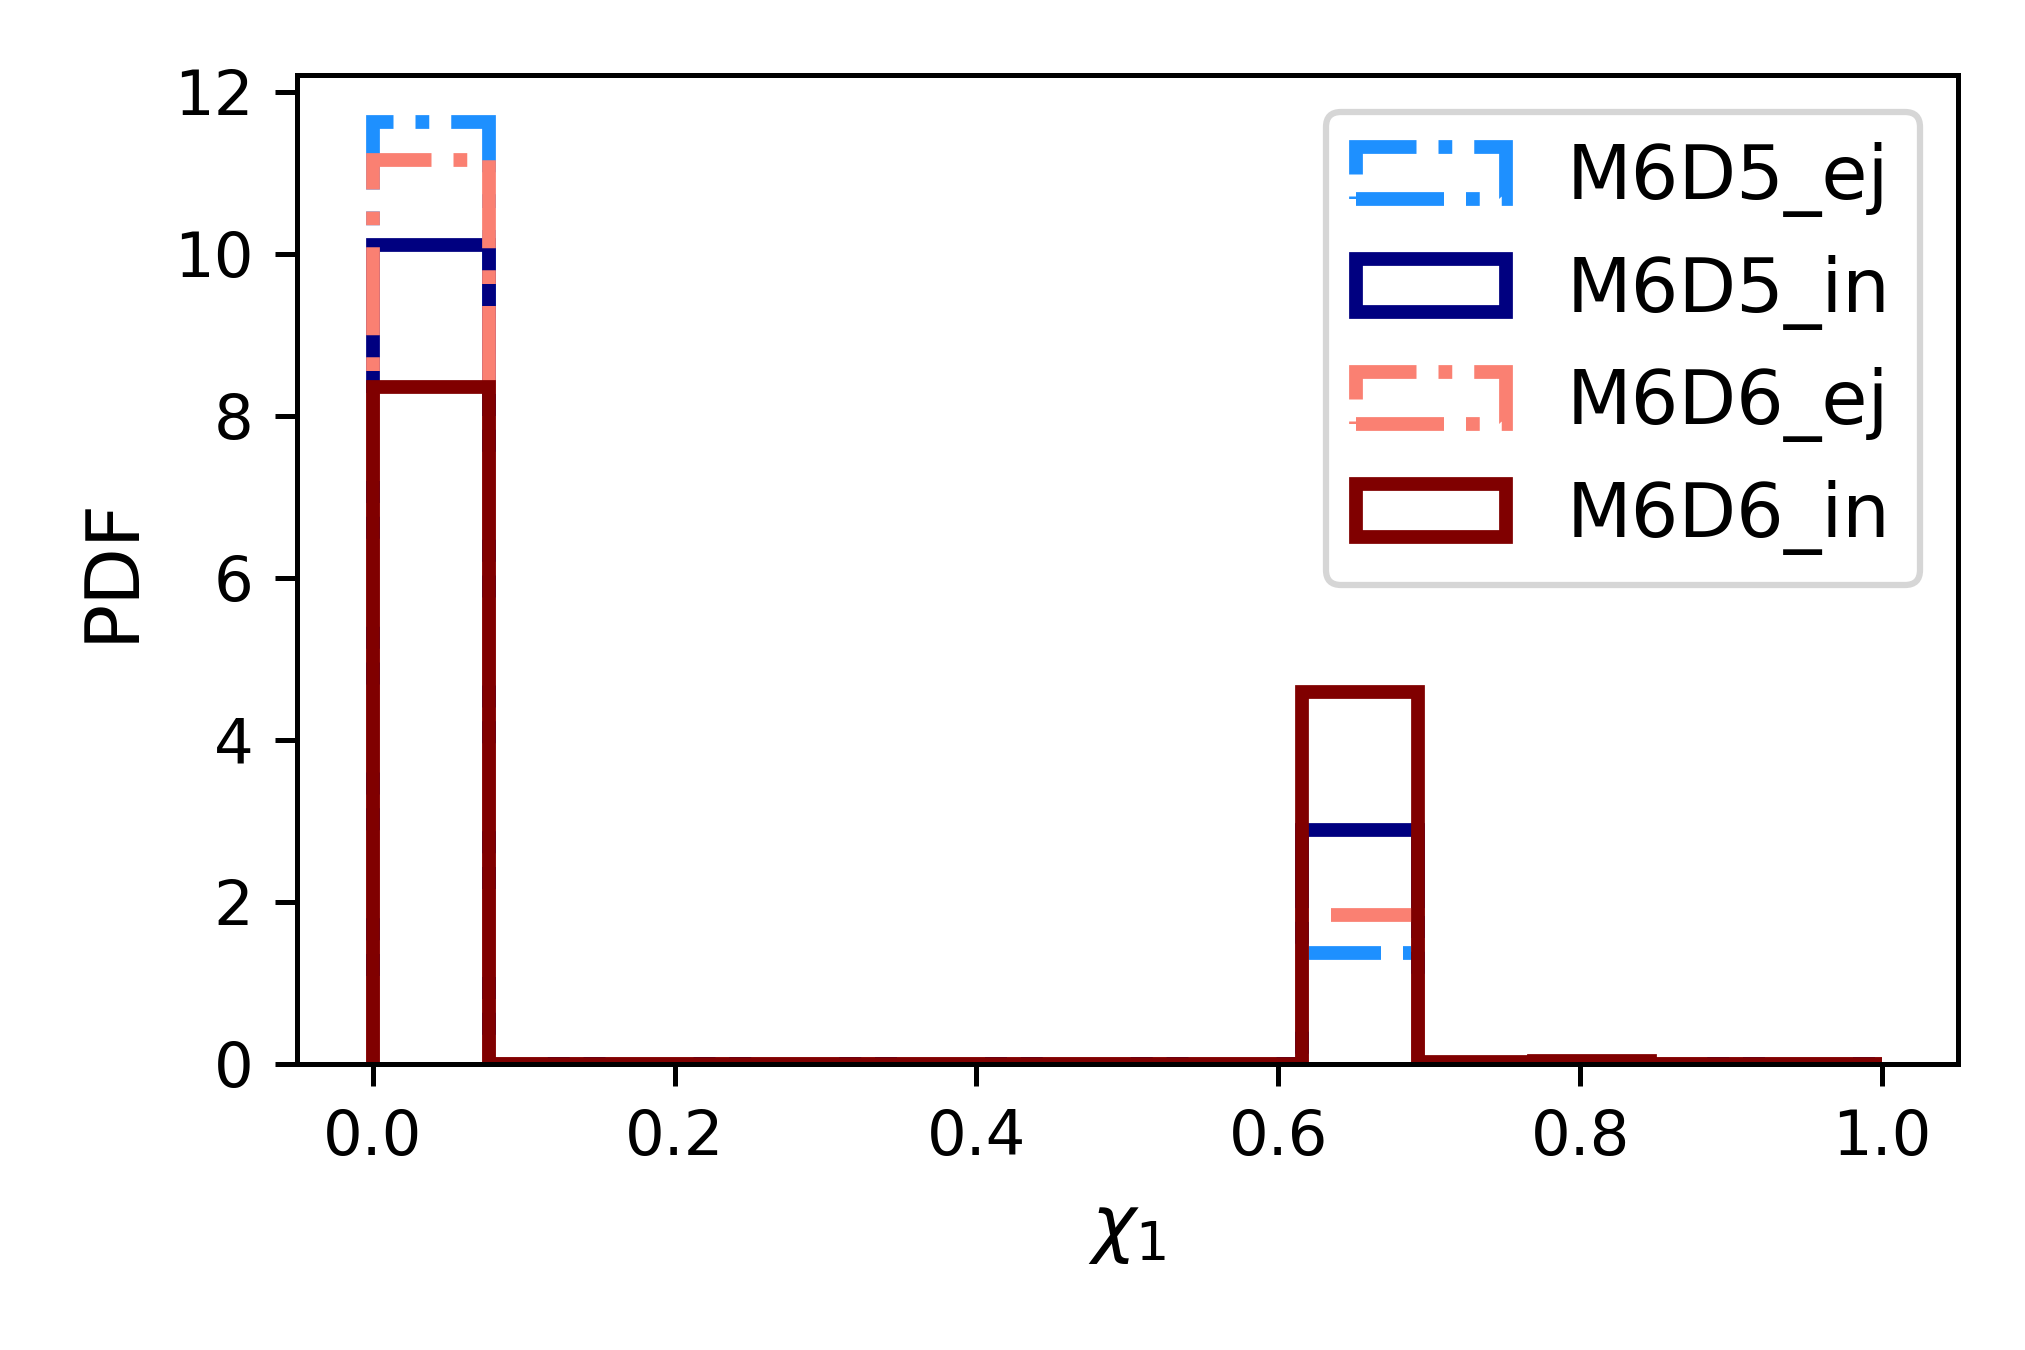
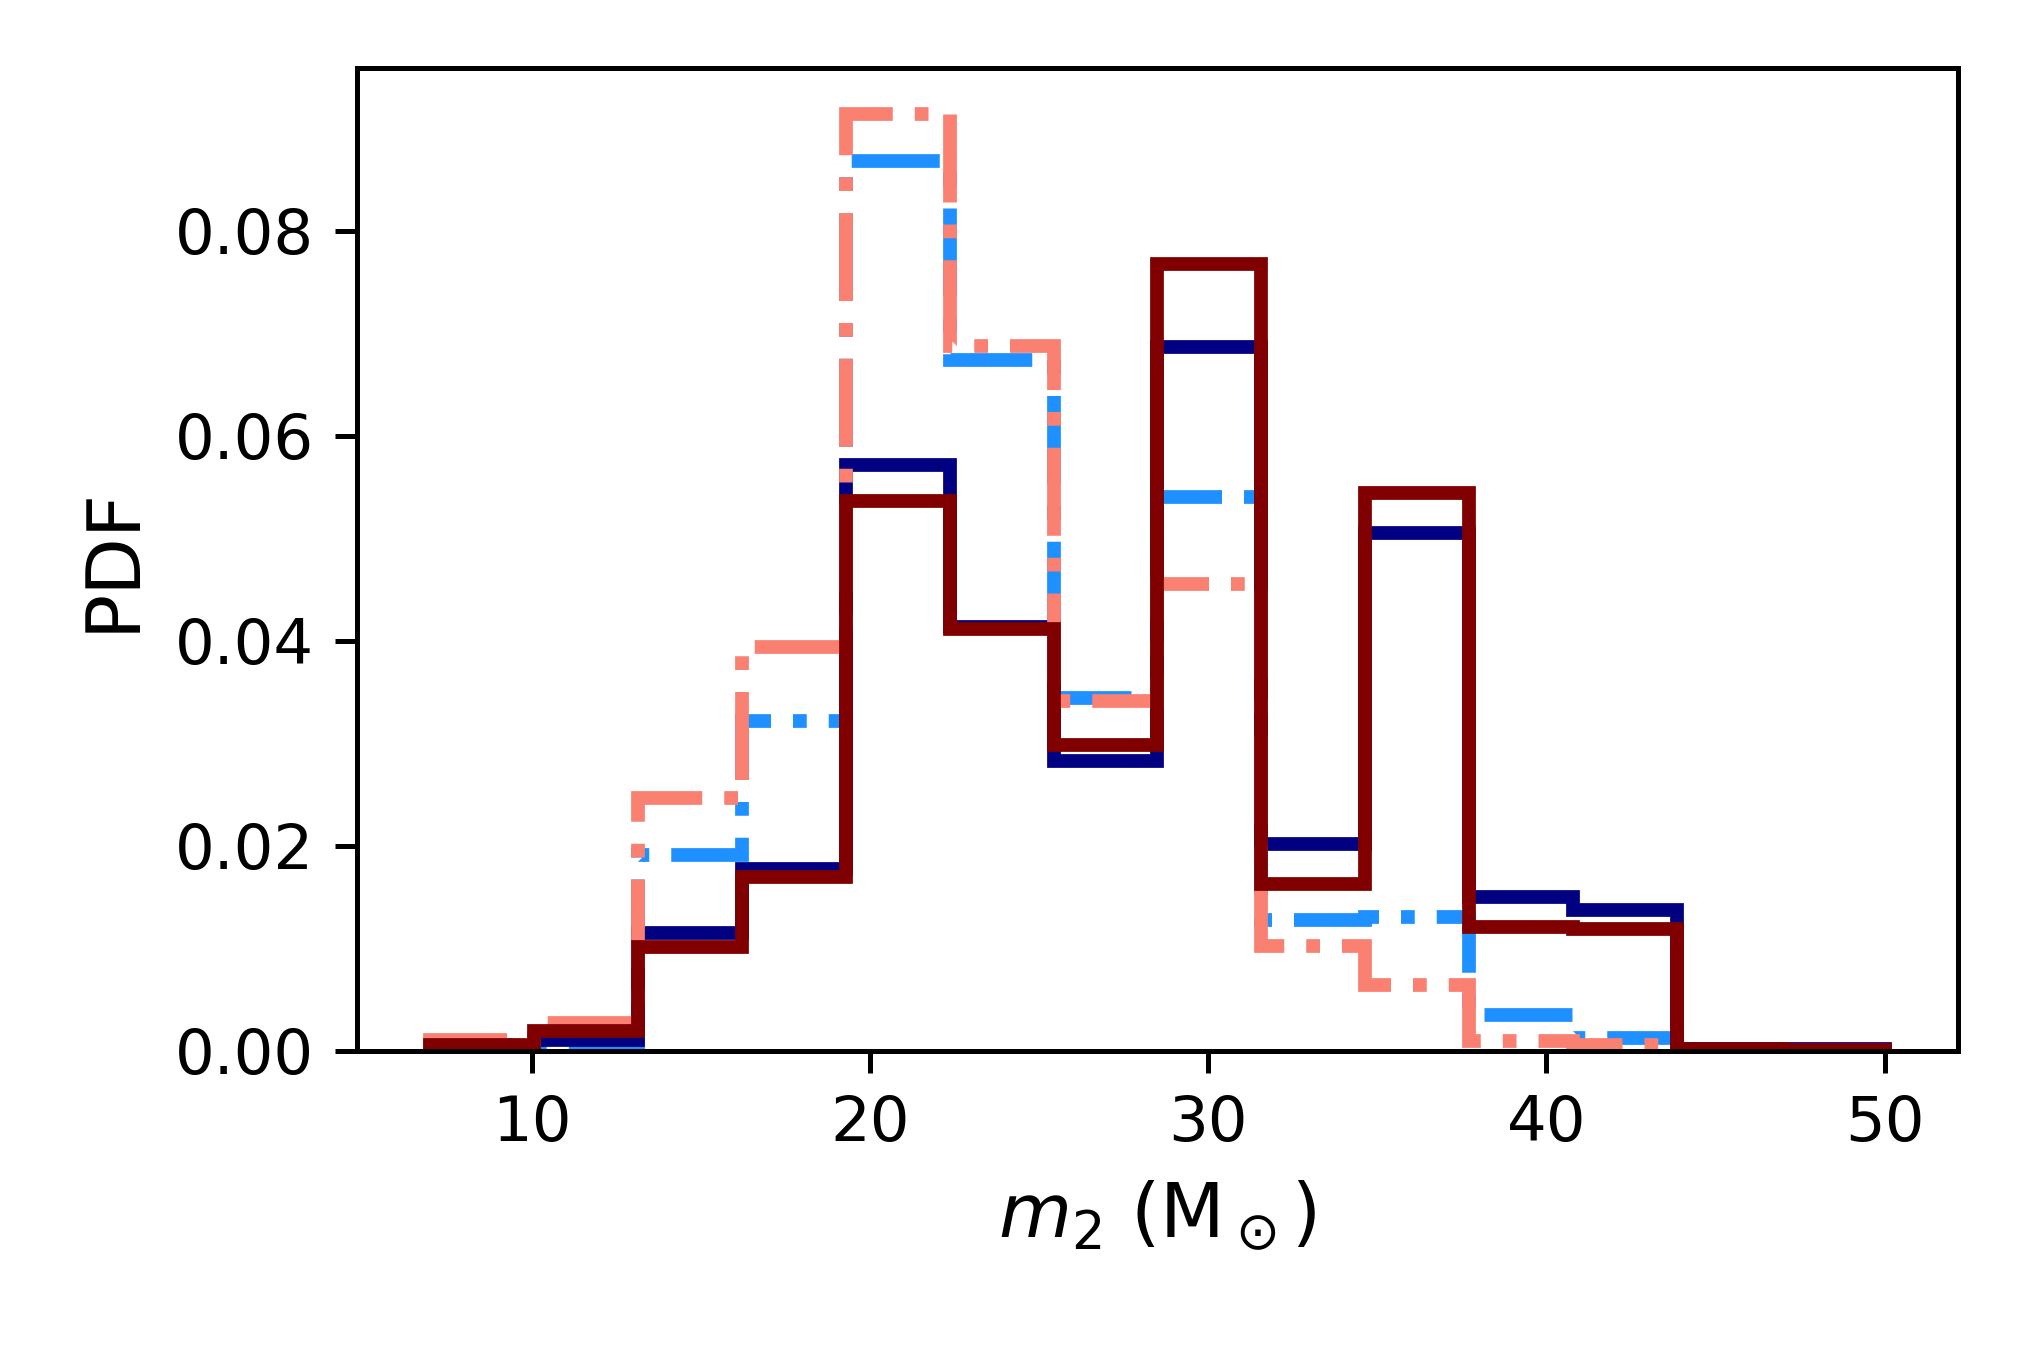
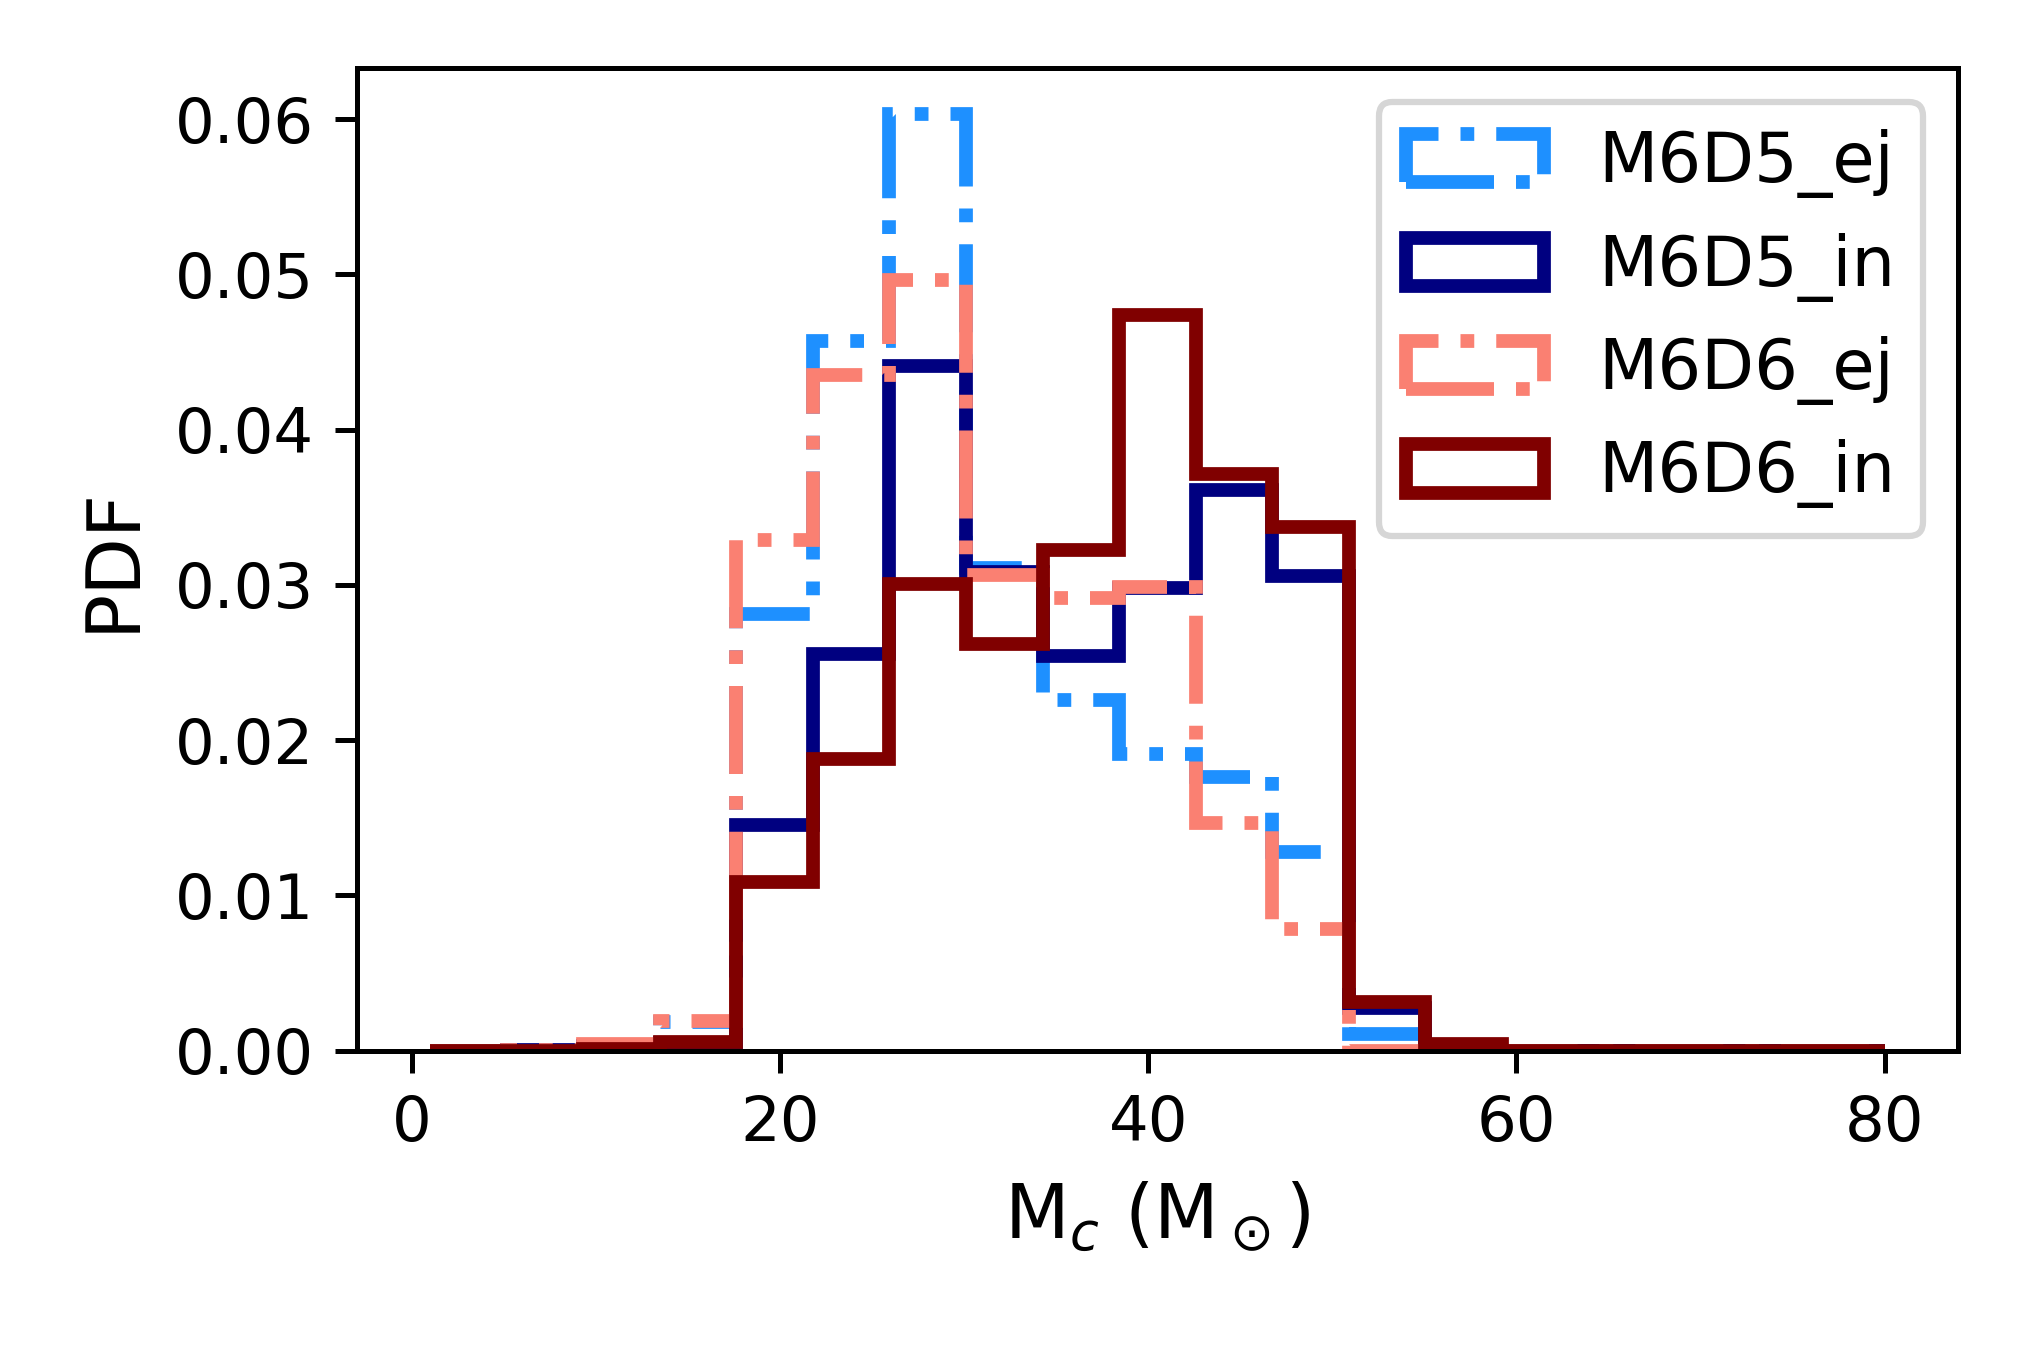
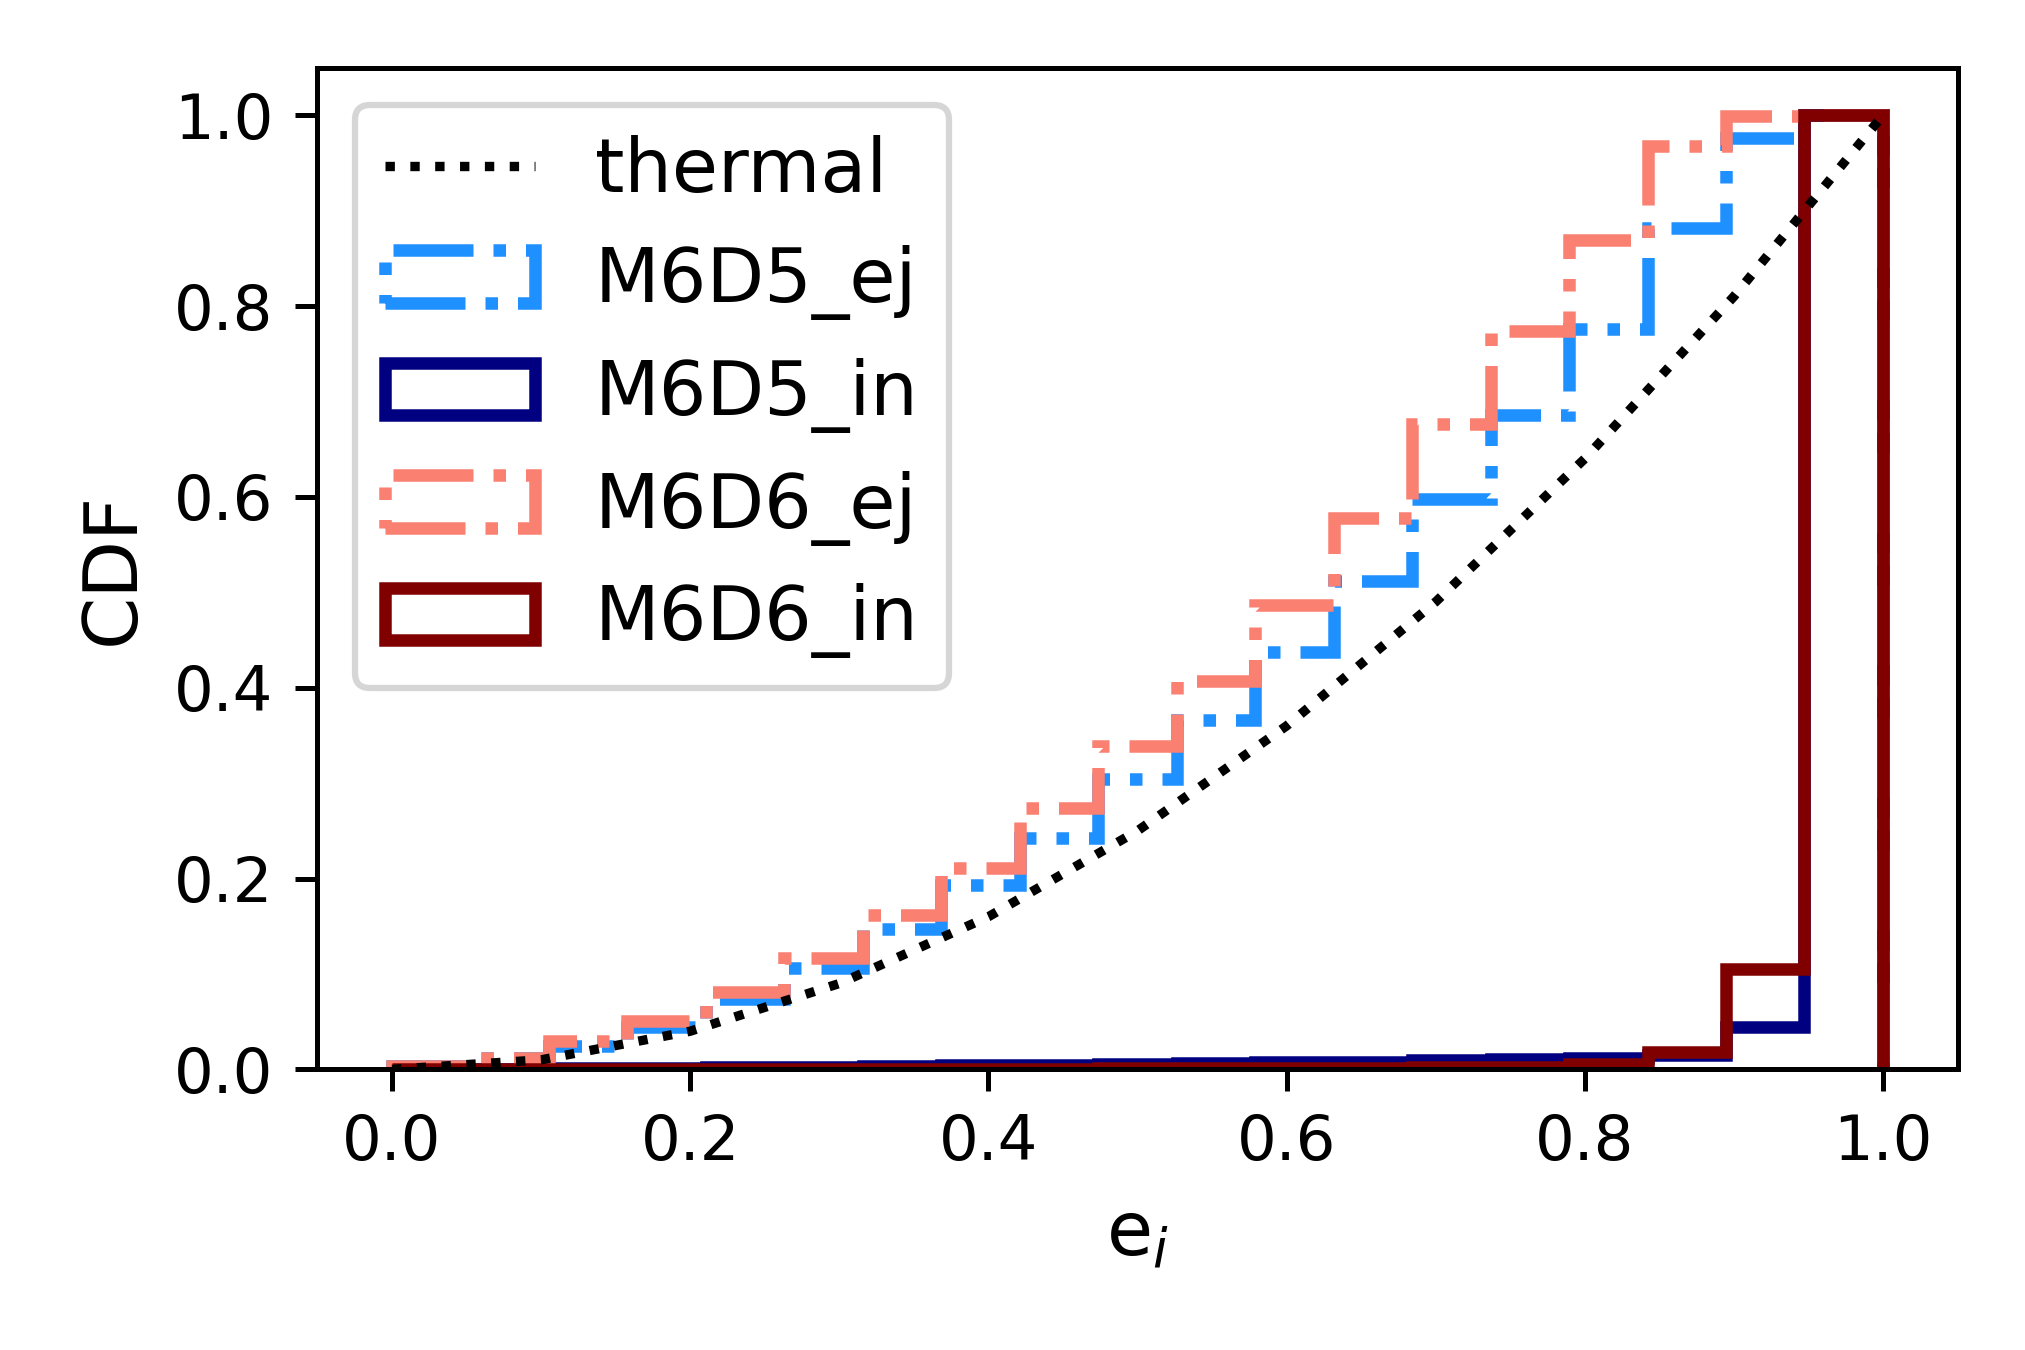
We compare the ejected mergers to in-cluster ones in Fig. 18, with models M6D5 and M6D6 (which have ejected merger fractions of about and respectively, with each having the ability to form an IMBH just above M⊙). The left panel and top middle panel show that lower-mass binaries and equal mass-ratios are preferred within ejected mergers. This results in a smaller chirp mass for these ex-situ mergers (lower middle panel of Fig. 18). Though most ex-situ mergers are first generation, a fraction of them can also belong to a higher generation, typically a second-generation merger remnant BH merging with a primordial first generation BH, as reflected in the second peak of in the distribution of primary spin (upper right panel of Fig. 18). The eccentricity at the time of ejection/formation () for ex-situ/in-situ mergers is shown in the lower right panel of Fig. 18. The ex-situ binaries roughly follow a thermal distribution, albeit slightly shifted to lower values, since highly eccentric binaries tend to merge very rapidly.
4 Observational implications: detectability and merger rates
We face a couple of challenges in calculating the merger rates from nuclear clusters: the lack of comprehensive data on the number density evolution of nuclear clusters with redshift (also, cluster birth redshift), and the uncertainty in birth parameters (mass, half-mass density and metallicity). We therefore make a few simplifying assumptions (and then vary some of these as different models), as explained step-by-step below:
-
1.
Create clusters with different values of initial cluster mass () and half-mass radius (). To find unique and for each individual cluster, there are two models groupings obtained:
-
(a)
ModelA group: Host galaxy masses () are drawn uniformly from a flat-in-the-log distribution between – M⊙. Each host galaxy, depending on its mass, has a normalized relative weight (such that the area under the curve of number density of galaxies per unit volume per unit dex is scaled to unity). is calculated using the normalized weight associated with each host galaxy of the cluster, and is given by the Schechter best-fit parameters (Schechter, 1976) given by Mortlock et al. (2015) and Song et al. (2016). ModelA1 and ModelA2 are selected from Mortlock et al. (2015) for redshifts and , while ModelA3 is from Song et al. (2016) for .999Schechter function: . We have a turn-over mass index in units of dex M , normalization of Schechter function in logarithm log, slope for ModelA1,2 (Mortlock et al., 2015) and ModelA3 (Song et al., 2016) respectively. These selections are made to represent three regions of the redshift parameter space. Each host galaxy is then associated with a nuclear cluster, whose is obtained from fitting the fitting formulae for late-type galaxies through and then a through , from the third and first row of Table 1 of Georgiev et al. (2016) (with the most likely values of the function). The nuclear clusters are all assumed to have the same metallicity of Z, and born uniformly between the redshifts of to .
-
(b)
ModelB group: Since each fit for late-type galaxies in Georgiev et al. (2016) (Table 1) has error margins, we devise two further sub-models. ModelB1 (with the upper error margin in obtaining and lower error margin in obtaining , such that the most massive and most dense possible cluster, which is likely to produce more mergers, is built) and ModelB2 (with the lower error margin in obtaining and upper error margin in obtaining , such that the least massive and most sparse possible cluster is built). Everything else in ModelB1,2 is identical to ModelA1.
-
(c)
ModelC group: ModelC1 and ModelC2 are identical to ModelB1 and ModelB2 respectively, apart from the Georgiev et al. (2016) best-fit, which for the C group of models is obtained from the sub-sample of nucleated early-type galaxies (see their Table 1).
-
(d)
ModelD: The James Webb Space Telescope is now confidently detecting galaxies at redshifts at high as (Castellano et al., 2022). We therefore make another variation to ModelA3, incorporating up to a volume of redshift (and making the uniform birth of nuclear clusters between redshifts to ).
-
(e)
ModelE group: The models in the ModelE1,2 group are the same as ModelA1,3 respectively, but with metallicities Z.
-
(f)
ModelF group: The masses and half-mass radii of the nuclear clusters of corresponding galaxies are obtained from observations of their present-day properties (Georgiev et al., 2016). While for all of our previous models we stick to an assumption of steady-state, such that these present-day properties are the initial cluster properties of some other galaxies and the mass-radius relations of the nuclear clusters are identical at each time evolution snap-shot, this assumption is likely incorrect. We therefore create two sets of nuclear clusters with all properties identical to ModelA1 but with initial radii of pc for one set of clusters (ModelF1) and initial radii reduced from the median Georgiev et al. (2016) fit by for the other set (ModelF2).
-
(g)
ModelG group: In model ModelG1 the cluster initial properties are identical to the clusters selected from Georgiev et al. (2016), also utilized in the study by Antonini & Rasio (2016). The clusters are equi-weighted, meaning each is given a weight of . In this scenario, we only select the mergers at a merger time cut-off of 1 Gyr (ModelG1) and 1 Gyr post-core collapse (ModelG2). No cosmological evolution is accounted for in this case. The metallicity remains the same as in ModelA1.
-
(h)
ModelH group: We explore the effects of a non-uniform Madau & Dickinson (2014) cluster birth redshift distribution through ModelH1. ModelH2 uses a fixed birth redshift of 2, approximately close to the peak of the Madau & Dickinson (2014). All other parameters remain exactly identical to ModelA1.
Once the batch of clusters is created for different models, we evolve them using as explained below.
-
(a)
-
2.
Each cluster is assigned a birth redshift, depending on model type — either uniform (between 0-8 or 0-12) or Madau & Dickinson (2014) distribution or fixed at a redshift of 2, irrespective of their initial cluster properties.
-
3.
Volumetric shells are created, such that they join to enclose a volume with radius with endpoints corresponding to redshift and . The width of each shell is taken to be as step-size (although our calculation becomes independent of the step-size, as long as is large enough).
-
4.
A flat CDM cosmology with a Hubble constant of km s and is assumed. For each merger in each cluster (at the given birth redshift), the true merger redshift and look-back times are computed. Only the mergers that occur within the lower limit of the grid redshift is taken (i.e., mergers that happen in the future of the cluster are rejected). Here, we also calculate the signal-to-noise ratio (SNR) of the gravitational-wave emission of the coalescing binaries for a range of different detectors. The SNR is a standard quantification of the detectability of a gravitational-wave signal for a given instrument, and can be calculated for a compact binary as (Cutler & Flanagan, 1994)
(8) where is the luminosity distance to the binary and its chirp mass. The function describes the antenna response of the detector to the cross and plus polarization of the gravitational wave; it depends on the polar angles and of the binary position on the sky and the inclination of its orbital axis with respect to the line-of-sight. In this work, we marginalise over all angles, which yields for an interferometric detector design (Maggiore, 2008). The function is the noise power spectral density of a given instrument. Here, we use the noise power spectral densities for the currently operating Advanced LIGO (aLIGO) detectors and the planned Cosmic Explorer (CE) and Einstein Telescope (ET) detectors. 101010For aLIGO we adopt from released data of the collaboration: https://dcc.ligo.org/LIGO-T1800044/public, last accessed 16 May 2023. For CE we adopt from released data of the collaboration: https://cosmicexplorer.org/sensitivity.html, last accessed 16 May 2023. For ET we adopt from released data of the collaboration: https://www.et-gw.eu/index.php/etsensitivities, last accessed 16 May 2023.(see main text).
The frequency minimum and maximum of the integration in Eq. (8) depend on the detector. Ground-based detectors like aLIGO, CE, and ET are sensitive to relatively high gravitational-wave frequencies, – , which are emitted by binaries during their final orbits before merger. Hence, for ground-based detectors we set the , corresponding to the frequency of the binary’s Innermost Stable Circular Orbit (ISCO). For practical purposes, we can set the lower limit of the integration to , because for the noise power spectral densities of ground-based detectors only frequencies significantly contribute to the integral in Eq. (8).
If there are “” selected mergers within the interval of , in a particular “” cluster associated normalized weight “”, the weighted contribution of that cluster in merger rate becomes
(9) in units of yr-1 (since is dimensionless). Averaging the contribution for cluster for each model set, we get
(10) since is factorized such that .
-
5.
If the number density of galaxies is Gpc-3 for the volume grid , we need to sum over “” volume grids that gives the total volume , such that the total merger rates becomes
(11) where is the fraction of galaxies in the mass range of – M⊙ that have a nuclear cluster. Observationally, this fraction varies with galaxy mass, with for galaxies with mass around M⊙, to as high as for galaxy mass of – M⊙. However, we simplify the matter by taking for all galaxies, which is a rough estimate for Late-type galaxies in our mass range (Neumayer et al., 2020, Fig 3). If a more generalized condition is desired, such that becomes a function of the host galaxy mass (), this term can be added inside the summation over . If is independent of galaxy properties and redshift (and hence constant), the expression can be simplified to
(12) The choice of is a tricky one. Fletcher (1946) estimated the high value of Mpc-3. More recent works have lowered this number significantly (Poggianti et al., 2013; Leja et al., 2013; Ownsworth et al., 2016), but with different studies resulting in different estimates for , we have taken the upper limit of Mpc-3 (Conselice et al., 2005, through the Hubble Space telescope), as used by Antonini et al. (2019). Conselice et al. (2016) predicts galaxies within the redshift of (making Mpc-3), while Lauer et al. (2021) with New Horizons shows the sky to be less bright. JWST data may further alter in the near future.
-
6.
Detectable rates for aLVK, CE, ET are also calculated in a similar way, but only by counting the mergers with SNR correspondingly.
Finally, We note that our nuclear cluster models do not have a central SMBH, while observations show that at least in some galaxies they coexist (e.g., Seth et al., 2008; Neumayer & Walcher, 2012). Thus, our merger rates should be most likely intended as upper limits.
The calculated rates for different models are tabulated in Table 3. We find intrinsic rates between Gpc-3yr-1, while , and . Lower-redshift, late-type host galaxies appear to have higher merger rates. Comparing ModelA1 to ModelD1, we observe that extending the redshift to from does not change significantly, since peak of our detectable mergers emerge from 1-2, a trend similar to Fragione et al. (2022). The lack of contribution from clusters born at higher redshifts is also apparent in models ModelH1,2, where remain identical, and negligibly lower than ModelA1. As the initial cluster densities are made higher in ModelF1,2, the rates increases by to times. The spread in cluster mass-radius is only partially encapsulated in ModelB1,2 and ModelC1,2, resulting in ModelG1,2 with simplistic equi-weight assumptions produce slightly higher . The upper limit of our merger rate is about an order-of-magnitude lower than the upper limit obtained by Fragione et al. (2022) (Fig. 1 showing random initial seed model roughly matches ours), possibly due to their assumption of a pre-existent seed BH.
Qualitatively, while the LVK and ET appear to be able to observe (SNR) for primary masses up to a few hundred M⊙s and (), CE pushes this threshold to about M⊙ and ().
Evolving the Georgiev et al. (2016) models under two assumptions of initial conditions—(a) mass and radius are the same as in current observations, and (b) mass is the same as in current observations and radius is pc—we find that after a Hubble Time, in model (a) of the clusters host IMBHs M⊙ and of them host an IMBH of mass to M⊙; in model (b), of the clusters host IMBHs M⊙ and of them host an IMBH of mass to M⊙.
5 Conclusions
In this study we have studied massive clusters within the initial mass range of M⊙ and initial density range of M⊙ pc-3, which can be considered in the parameter space of nuclear clusters and the most massive globular clusters with the updated fast code that incorporates initial mass function (hence metallicity) dependent probabilistic DBH pairing, binary-single encounters (including mass-dependent energy loss ). In reference to the main questions we asked in Sec. 1, we find that —
-
1.
IMBHs ranging from M⊙ can be created solely through in-cluster hierarchical mergers (Fig. 19). This mass range is roughly one or two magnitudes lower than the least massive SMBHs. To reach to the mass range of SMBHs from the hierarchically-created IMBHs, there must therefore be subsequent mass accretion through other processes.
-
2.
The initial cluster escape velocity is the most important parameter in determining IMBH formation. The corresponding values of cluster’s mass and density determine the final mass of the IMBH. For km s-1, an IMBH with mass up to M⊙ can form for sufficiently high cluster masses and densities (see the lower panel of Fig. 10) . This cut-off escape velocity results from a combination of increased BH retention post-natal kick (Fig. 11) and gravitational wave recoils, which average to around km s-1 for all spin magnitudes and orientations (see Fig. 12). Other secondary factors that play a role in determining the mass of the IMBH are cluster metallicity (which alters the width of the initial mass function), DBH pairing prescription ( parameter, see Sec. 2) and the mass-dependent functional form of (see Sec. 2). On the other hand, the initial BH spin distribution, unless extremely high (i.e. ), does not significantly affect the final IMBH mass nor its spin.
-
3.
An in initial BH seed of at least the most massive (stellar-evolution originated) in-cluster initial BH is required to maximise the probability of the seed BH’s retention after a few hierarchical mergers (Sec. 3.2.4), which can be M⊙ for metal-rich clusters to M⊙ for metal-poor clusters.
- 4.
-
5.
– of all in-cluster mergers in our set of models are expected to have an eccentricity at Hz. We find that eccentric mergers are particularly favoured in equal-mass binaries. This means that metal-rich and younger (age – Gyrs) clusters, which do not form IMBHs of M⊙, are ideal formation grounds for eccentric mergers that may be detected by the current generation of gravitational-wave detectors.
About – of all in-cluster mergers are also expected to be formed at a frequency greater than Hz (this is a subset of the eccentric merger fraction). Such extreme cases may appear in the LVK burst searches (see Fig. 7).
-
6.
The number of mergers involving an IMBH (i.e. M⊙) as a fraction of the total number of mergers is expressed by . Very dense clusters ( M⊙ pc-3) that rapidly form a BH of M⊙ can have . For the Fiducial model, (Table LABEL:tab:IMBHmass).
-
7.
The fraction of ejected mergers, , is a function of the cluster mass and escape velocity, with – of the DBH mergers being ejected mergers in clusters with km s-1. However, becomes negligible when km s-1 (see Sec. 3.3 and Fig. 17). Ex-situ mergers are typically less massive, more symmetric in mass, and have a longer delay time than their in-situ counterparts.
-
8.
The rates of DBH mergers from nuclear clusters can be rounded to – Gpc-3yr-1 remembering it to be the upper limit due to not including an SMBH in our calculations. The orders-of-magnitude uncertainty on the rates arises predominantly due to the uncertain number density distribution of nucleated galaxies (we assume Mpc-3 and ). Uncertainties in the initial nuclear cluster mass-density distribution, the nuclear cluster mass scaling relation with respect to host galaxy mass, and the metallicity distribution of nuclear clusters have lower impact on .
-
9.
At SNR, we expect ET and CE to detect about and at least respectively of the intrinsic DBH mergers from nuclear clusters. Out of the nuclear clusters with well-measured masses and radii (Georgiev et al., 2016), we predict that up to of the clusters host hierarchically-formed IMBHs with masses M⊙, and that up to host IMBHs with masses M⊙. We also highlight that, while the current generation of gravitational-wave detectors can only observe IMBHs of up to a few hundred M⊙, future detectors such as CE will have improved lower-frequency sensitivity, enabling detection of more massive ( – M⊙) IMBHs.
Future improvements to the study presented here will include binary-binary interactions, BH mergers with other objects (e.g., neutron stars, white dwarfs, non-compact objects), both globular and nuclear clusters, mass gain through infalling globular clusters, and the wet component of gas accretion for nuclear clusters (Guillard et al., 2016; Bourne & Power, 2016).
| Sl. | Model | nth G | /105 | |||||||||
|---|---|---|---|---|---|---|---|---|---|---|---|---|
| no. | (M⊙) | (M⊙) | (M⊙) | (IMBH) | (M⊙ pc-3) | (Gyr) | (Gyr) | |||||
| 1. | Fiducial | 10562 | 9451 | 11742 | 0.134 | 121 | 0.31 | 0.46 | 0.61 | 17.19 | 06.05 | 0.164 |
| 2. | M8D8 | 21187 | 19946 | 23228 | 0.085 | 283 | 4.27 | 0.42 | 0.46 | 18.08 | 06.53 | 0.531 |
| 3. | M8D7 | 21952 | 19192 | 23754 | 0.131 | 172 | 1.43 | 1.46 | 1.69 | 18.02 | 06.26 | 0.273 |
| 4. | M7D8 | 7240 | 6790 | 8068 | 0.155 | 118 | 6.27 | 0.05 | 0.06 | 19.27 | 06.67 | 0.410 |
| 5. | M7D7 | 5310 | 409 | 7716 | 0.293 | 83 | 0.27 | 0.51 | 0.41 | 14.52 | 05.03 | 0.062 |
| 6. | M7D6 | 209 | 164 | 259 | 0.657 | 4 | 0.93 | 1.84 | - | 10.53 | 03.54 | 0.011 |
| 7. | M7D5 | 159 | 147 | 185 | 0.679 | 3 | 0.08 | 6.21 | - | 07.88 | 02.53 | 0.004 |
| 8. | M6D8 | 212 | 170 | 367 | 0.610 | 4 | 314.05 | 0.01 | - | 18.92 | 06.93 | 0.091 |
| 9. | M6D7 | 150 | 130 | 178 | 0.716 | 3 | 25.92 | 0.05 | - | 12.69 | 04.43 | 0.004 |
| 10. | M6D6 | 123 | 116 | 142 | 0.690 | 2 | 3.31 | 0.21 | - | 08.49 | 03.06 | 0.001 |
| 11. | M6D5 | 121 | 113 | 124 | 0.695 | 2 | 0.22 | 0.91 | - | 04.66 | 02.05 | 9e-5 |
| 12. | Z_10 | 10168 | 9128 | 11071 | 0.154 | 115 | 0.46 | 0.47 | 0.63 | 17.56 | 06.30 | 0.163 |
| 13. | Z_100 | 6472 | 5140 | 6811 | 0.166 | 113 | 2.47 | 0.86 | 1.12 | 20.16 | 08.86 | 0.052 |
| 14. | SN_D | 10862 | 9671 | 12223 | 0.163 | 125 | 0.26 | 0.41 | 0.66 | 16.81 | 06.01 | 0.173 |
| 15. | Sd_50 | 10574 | 9560 | 11572 | 0.152 | 128 | 0.31 | 0.41 | 0.81 | 16.64 | 05.81 | 0.182 |
| 16. | Sd_100 | 10556 | 9590 | 11719 | 0.141 | 125 | 0.31 | 0.44 | 0.59 | 16.93 | 05.91 | 0.184 |
| 17. | Sd_150 | 10462 | 9485 | 11660 | 0.157 | 130 | 0.30 | 0.41 | 0.57 | 16.61 | 05.74 | 0.195 |
| 18. | Sd_200 | 10211 | 8796 | 11232 | 0.150 | 133 | 0.30 | 0.38 | 0.59 | 16.22 | 05.64 | 0.204 |
| 19. | Ml_ev | 10456 | 9058 | 11733 | 0.184 | 125 | 0.32 | 0.44 | 0.66 | 16.62 | 05.83 | 0.152 |
| 20. | Ml_0 | 10296 | 9677 | 11466 | 0.128 | 151 | 1.53 | 0.29 | 0.33 | 16.91 | 05.90 | 0.417 |
| 21. | Ml_0M7D5 | 219 | 185 | 276 | 0.700 | 4 | 0.39 | 4.73 | - | 16.61 | 03.34 | 0.014 |
| 22. | Vk_0 | 10537 | 9346 | 11512 | 0.154 | 121 | 0.31 | 0.48 | 0.64 | 16.73 | 05.78 | 0.154 |
| 23. | Vk_0M7D7 | 1091 | 402 | 7041 | 0.521 | 17 | 3.21 | 0.52 | 0.56 | 14.39 | 05.05 | 0.053 |
| 24. | Vk_0M7D5 | 164 | 145 | 187 | 0.704 | 3 | 0.09 | 5.97 | - | 07.90 | 02.61 | 0.004 |
| 25. | Vk_0 | 6488 | 5340 | 6795 | 0.162 | 112 | 2.47 | 1.19 | 1.17 | 20.08 | 08.86 | 0.046 |
| 26. | Sp_01 | 10640 | 9595 | 11868 | 0.147 | 126 | 0.31 | 0.43 | 0.65 | 16.71 | 05.85 | 0.171 |
| 27. | Sp_33 | 11196 | 10283 | 11826 | 0.139 | 123 | 0.31 | 0.46 | 0.68 | 17.11 | 06.15 | 0.143 |
| 28. | Sp_11 | 7148 | 423 | 7679 | 0.147 | 162 | 0.30 | 0.57 | 0.92 | 17.06 | 06.38 | 0.079 |
| 29. | Sp_LVK | 7654 | 5517 | 8186 | 0.155 | 164 | 0.30 | 0.50 | 0.79 | 17.15 | 06.18 | 0.142 |
| 30. | Ord_BH | 7217 | 657 | 8155 | 0.161 | 162 | 0.31 | 0.57 | 0.75 | 15.99 | 05.34 | 0.168 |
| 31. | DE | 8902 | 8173 | 9459 | 0.157 | 141 | 0.31 | 0.43 | 0.59 | 12.18 | 04.43 | 0.199 |
| 32. | DEM7D7 | 667 | 346 | 6140 | 0.581 | 12 | 7.08 | 0.66 | - | 10.88 | 03.97 | 0.604 |
| 33. | DEM7D5 | 158 | 143 | 189 | 0.685 | 3 | 0.08 | 6.54 | - | 06.06 | 01.96 | 0.004 |
| 34. | DE | 5071 | 4582 | 5344 | 0.179 | 120 | 2.46 | 0.93 | 1.38 | 14.71 | 06.84 | 0.065 |
| Name | galaxy-type | mass-radius fit | metallicity | redshift range fit | birth distribution | (Gpc-3yr-1) |
|---|---|---|---|---|---|---|
| ModelA1 | late | median | 1.5 | uniform, 0-8 | 0.12 | |
| ModelA2 | late | median | 1.5 | uniform, 0-8 | 0.09 | |
| ModelA3 | late | median | 1.5 | uniform, 0-8 | 0.06 | |
| ModelB1 | late | high | 1.5 | uniform, 0-8 | 0.15 | |
| ModelB2 | late | low | 1.5 | uniform, 0-8 | 0.08 | |
| ModelC1 | early | high | 1.5 | uniform, 0-8 | 0.04 | |
| ModelC2 | early | low | 1.5 | uniform, 0-8 | 0.03 | |
| ModelC3 | early | median | 1.5 | uniform, 0-8 | 0.01 | |
| ModelD1 | late | median | 1.5 | uniform, 0-12 | 0.12 | |
| ModelD2 | late | median | 1.5 | uniform, 0-12 | 0.10 | |
| ModelE1 | late | median | 1.5 | uniform, 0-8 | 0.13 | |
| ModelE2 | late | median | 1.5 | uniform, 0-8 | 0.09 | |
| ModelF1 | late | median,1 pc | 1.5 | uniform, 0-8 | 0.47 | |
| ModelF2 | late | median,median | 1.5 | uniform, 0-8 | 0.75 | |
| ModelG | - | - | 1.5 | - | - | 0.61 |
| ModelG2 | - | - | 1.5 | - | - | 0.80 |
| ModelH1 | late | median | 1.5 | MDΨ, 0-8 | 0.11 | |
| ModelH2 | late | median | 1.5 | MD peak, 2 | 0.11 |
: Mortlock et al. (2015); : Song et al. (2016); : Georgiev et al. (2016); : Madau & Dickinson (2014).
Acknowledgements
We thank Christopher Berry, Mark Gieles, Daniel Marín Pina, Simon Stevenson and Tom Wagg for useful discussions and comments. DC and JB are supported by the STFC grant ST/V005618/1, and FA is supported by an STFC Rutherford fellowship (ST/P00492X/2). IMR-S acknowledges support received from the Herchel Smith Postdoctoral Fellowship Fund. This work made use of the OzSTAR high performance computer at Swinburne University of Technology. OzSTAR is funded by Swinburne University of Technology and the National Collaborative Research Infrastructure Strategy (NCRIS).
Data Availability
The data utilized for this work will be freely available upon reasonable request to the corresponding author.
References
- Abbott et al. (2016) Abbott B. P., et al., 2016, Phys. Rev. Lett., 116, 061102
- Abbott et al. (2020) Abbott R., et al., 2020, Phys. Rev. Lett., 125, 101102
- Abbott et al. (2021a) Abbott R., et al., 2021a, arXiv e-prints, p. arXiv:2111.03606
- Abbott et al. (2021b) Abbott R., et al., 2021b, arXiv e-prints, p. arXiv:2111.03634
- Abbott et al. (2021c) Abbott R., et al., 2021c, Phys. Rev. X, 11, 021053
- Abbott et al. (2021d) Abbott R., et al., 2021d, Astrophys. J. Lett., 913, L7
- Akiyama et al. (2019) Akiyama K., et al., 2019, ApJ, 875, L1
- Akiyama et al. (2022) Akiyama K., et al., 2022, ApJ, 930, L12
- Antonini & Gieles (2020a) Antonini F., Gieles M., 2020a, Phys. Rev. D, 102, 123016
- Antonini & Gieles (2020b) Antonini F., Gieles M., 2020b, Mon. Not. Roy. Astron. Soc., 492, 2936
- Antonini & Rasio (2016) Antonini F., Rasio F. A., 2016, ApJ, 831, 187
- Antonini et al. (2014) Antonini F., Murray N., Mikkola S., 2014, ApJ, 781, 45
- Antonini et al. (2016) Antonini F., Chatterjee S., Rodriguez C. L., Morscher M., Pattabiraman B., Kalogera V., Rasio F. A., 2016, ApJ, 816, 65
- Antonini et al. (2019) Antonini F., Gieles M., Gualandris A., 2019, Mon. Not. Roy. Astron. Soc., 486, 5008
- Antonini et al. (2023) Antonini F., Gieles M., Dosopoulou F., Chattopadhyay D., 2023, MNRAS, 522, 466
- Arca Sedda et al. (2023) Arca Sedda M., Kamlah A. W. H., Spurzem R., Rizzuto F. P., Giersz M., Naab T., Berczik P., 2023, arXiv e-prints, p. arXiv:2307.04806
- Askar et al. (2017) Askar A., Szkudlarek M., Gondek-Rosińska D., Giersz M., Bulik T., 2017, MNRAS, 464, L36
- Asplund et al. (2009) Asplund M., Grevesse N., Sauval A. J., Scott P., 2009, ARA&A, 47, 481
- Atallah et al. (2023) Atallah D., Trani A. A., Kremer K., Weatherford N. C., Fragione G., Spera M., Rasio F. A., 2023, MNRAS, 523, 4227
- Banerjee (2018) Banerjee S., 2018, Mon. Not. Roy. Astron. Soc., 481, 5123
- Banerjee (2021) Banerjee S., 2021, MNRAS, 500, 3002
- Banerjee et al. (2010) Banerjee S., Baumgardt H., Kroupa P., 2010, MNRAS, 402, 371
- Bavera et al. (2020) Bavera S. S., et al., 2020, A&A, 635, A97
- Belczynski (2020) Belczynski K., 2020, ApJ, 905, L15
- Belczynski et al. (2007) Belczynski K., Taam R. E., Kalogera V., Rasio F. A., Bulik T., 2007, ApJ, 662, 504
- Belczynski et al. (2010) Belczynski K., Bulik T., Fryer C. L., Ruiter A., Valsecchi F., Vink J. S., Hurley J. R., 2010, ApJ, 714, 1217
- Belczynski et al. (2016a) Belczynski K., Holz D. E., Bulik T., O’Shaughnessy R., 2016a, Nature, 534, 512
- Belczynski et al. (2016b) Belczynski K., et al., 2016b, A&A, 594, A97
- Belczynski et al. (2020) Belczynski K., et al., 2020, ApJ, 890, 113
- Belkus et al. (2007) Belkus H., Van Bever J., Vanbeveren D., 2007, ApJ, 659, 1576
- Binney & Tremaine (2008) Binney J., Tremaine S., 2008, Galactic Dynamics: Second Edition, rev - revised, 2 edn. Princeton University Press, http://www.jstor.org/stable/j.ctvc778ff
- Böker et al. (2004) Böker T., Sarzi M., McLaughlin D. E., van der Marel R. P., Rix H.-W., Ho L. C., Shields J. C., 2004, AJ, 127, 105
- Bonson & Gallo (2016) Bonson K., Gallo L. C., 2016, MNRAS, 458, 1927
- Bourne & Power (2016) Bourne M. A., Power C., 2016, MNRAS, 456, L20
- Breen & Heggie (2013) Breen P. G., Heggie D. C., 2013, MNRAS, 432, 2779
- Broekgaarden et al. (2022) Broekgaarden F. S., Stevenson S., Thrane E., 2022, ApJ, 938, 45
- Castellano et al. (2022) Castellano M., et al., 2022, ApJ, 938, L15
- Chakraborty et al. (2020) Chakraborty S., Navale N., Ratheesh A., Bhattacharyya S., 2020, MNRAS, 498, 5873
- Charles et al. (2022) Charles P., et al., 2022, in High Energy Astrophysics in Southern Africa 2021. p. 24 (arXiv:2201.11442), doi:10.22323/1.401.0024
- Chattopadhyay et al. (2021) Chattopadhyay D., Stevenson S., Hurley J. R., Bailes M., Broekgaarden F., 2021, MNRAS, 504, 3682
- Chattopadhyay et al. (2022a) Chattopadhyay D., Hurley J., Stevenson S., Raidani A., 2022a, Mon. Not. Roy. Astron. Soc., 513, 4527
- Chattopadhyay et al. (2022b) Chattopadhyay D., Stevenson S., Broekgaarden F., Antonini F., Belczynski K., 2022b, MNRAS, 513, 5780
- Chia (2021) Chia H. S., 2021, Phys. Rev. D, 104, 024013
- Conselice et al. (2005) Conselice C. J., Blackburne J. A., Papovich C., 2005, ApJ, 620, 564
- Conselice et al. (2016) Conselice C. J., Wilkinson A., Duncan K., Mortlock A., 2016, ApJ, 830, 83
- Côté et al. (2006) Côté P., et al., 2006, ApJS, 165, 57
- Cutler & Flanagan (1994) Cutler C., Flanagan É. E., 1994, Phys. Rev. D, 49, 2658
- Dall’Amico et al. (2023) Dall’Amico M., Mapelli M., Torniamenti S., Arca Sedda M., 2023, arXiv e-prints, p. arXiv:2303.07421
- Di Carlo et al. (2019) Di Carlo U. N., Giacobbo N., Mapelli M., Pasquato M., Spera M., Wang L., Haardt F., 2019, MNRAS, 487, 2947
- Di Carlo et al. (2021) Di Carlo U. N., et al., 2021, MNRAS, 507, 5132
- Doctor et al. (2021) Doctor Z., Farr B., Holz D. E., 2021, ApJ, 914, L18
- Dolgov & Postnov (2017) Dolgov A., Postnov K., 2017, J. Cosmology Astropart. Phys., 2017, 036
- Farmer et al. (2019a) Farmer R., Renzo M., de Mink S. E., Marchant P., Justham S., 2019a, ApJ, 887, 53
- Farmer et al. (2019b) Farmer R., Renzo M., de Mink S. E., Marchant P., Justham S., 2019b, ApJ, 887, 53
- Fletcher (1946) Fletcher A., 1946, MNRAS, 106, 121
- Fragione & Loeb (2020) Fragione G., Loeb A., 2020, Astrophys. J. Lett., 901, L32
- Fragione & Silk (2020) Fragione G., Silk J., 2020, Mon. Not. Roy. Astron. Soc., 498, 4591
- Fragione et al. (2022) Fragione G., Loeb A., Kocsis B., Rasio F. A., 2022, ApJ, 933, 170
- Fryer et al. (2012) Fryer C. L., Belczynski K., Wiktorowicz G., Dominik M., Kalogera V., Holz D. E., 2012, ApJ, 749, 91
- Garofalo (2013) Garofalo D., 2013, Advances in Astronomy, 2013, 213105
- Gayathri et al. (2020) Gayathri V., et al., 2020, arXiv e-prints, p. arXiv:2009.05461
- Generozov et al. (2018) Generozov A., Stone N. C., Metzger B. D., Ostriker J. P., 2018, MNRAS, 478, 4030
- Georgiev et al. (2016) Georgiev I. Y., Böker T., Leigh N., Lützgendorf N., Neumayer N., 2016, MNRAS, 457, 2122
- Giacobbo & Mapelli (2018) Giacobbo N., Mapelli M., 2018, MNRAS, 480, 2011
- Gondán et al. (2018) Gondán L., Kocsis B., Raffai P., Frei Z., 2018, ApJ, 855, 34
- González et al. (2021) González E., Kremer K., Chatterjee S., Fragione G., Rodriguez C. L., Weatherford N. C., Ye C. S., Rasio F. A., 2021, ApJ, 908, L29
- Guillard et al. (2016) Guillard N., Emsellem E., Renaud F., 2016, MNRAS, 461, 3620
- Hannam et al. (2022) Hannam M., et al., 2022, Nature, 610, 652
- Heggie & Hut (1993) Heggie D. C., Hut P., 1993, ApJS, 85, 347
- Heggie & Hut (2003) Heggie D., Hut P., 2003, The Gravitational Million–Body Problem: A Multidisciplinary Approach to Star Cluster Dynamics. Cambridge University Press, doi:10.1017/CBO9781139164535
- Hénon (1972) Hénon M., 1972, in Lecar M., ed., Gravitational N-Body Problem. Springer Netherlands, Dordrecht, pp 44–59
- Hills & Fullerton (1980) Hills J. G., Fullerton L. W., 1980, AJ, 85, 1281
- Hobbs et al. (2005) Hobbs G., Lorimer D. R., Lyne A. G., Kramer M., 2005, MNRAS, 360, 974
- Hong et al. (2020) Hong J., Askar A., Giersz M., Hypki A., Yoon S.-J., 2020, Mon. Not. Roy. Astron. Soc., 498, 4287
- Hurley et al. (2000) Hurley J. R., Pols O. R., Tout C. A., 2000, MNRAS, 315, 543
- Hurley et al. (2002) Hurley J. R., Tout C. A., Pols O. R., 2002, MNRAS, 329, 897
- Janka (2013) Janka H. T., 2013, Mon. Not. Roy. Astron. Soc., 434, 1355
- Kamlah et al. (2022) Kamlah A. W. H., et al., 2022, MNRAS, 511, 4060
- Kroupa (2001) Kroupa P., 2001, MNRAS, 322, 231
- Lauer et al. (2021) Lauer T. R., et al., 2021, ApJ, 906, 77
- Le Tiec & Casals (2021) Le Tiec A., Casals M., 2021, Phys. Rev. Lett., 126, 131102
- Le Tiec et al. (2010) Le Tiec A., Blanchet L., Will C. M., 2010, Class. Quant. Grav., 27, 012001
- Leja et al. (2013) Leja J., van Dokkum P., Franx M., 2013, ApJ, 766, 33
- Lipunov et al. (1997) Lipunov V. M., Postnov K. A., Prokhorov M. E., 1997, MNRAS, 288, 245
- Lousto & Zlochower (2009) Lousto C. O., Zlochower Y., 2009, Phys. Rev. D, 79, 064018
- Lousto et al. (2010) Lousto C. O., Campanelli M., Zlochower Y., Nakano H., 2010, Classical and Quantum Gravity, 27, 114006
- Loutrel (2020) Loutrel N., 2020, arXiv e-prints, p. arXiv:2009.11332
- Lower et al. (2018) Lower M., et al., 2018, Phys. Rev. D, 98
- Lucy & Solomon (1970) Lucy L. B., Solomon P. M., 1970, ApJ, 159, 879
- Ma & Fuller (2023) Ma L., Fuller J., 2023, arXiv e-prints, p. arXiv:2305.08356
- Madau & Dickinson (2014) Madau P., Dickinson M., 2014, ARA&A, 52, 415
- Maggiore (2008) Maggiore M., 2008, Gravitational Waves: Volume 1: Theory and Experiments. Gravitational Waves, OUP Oxford, https://books.google.de/books?id=AqVpQgAACAAJ
- Mapelli (2016) Mapelli M., 2016, MNRAS, 459, 3432
- Mapelli et al. (2021) Mapelli M., et al., 2021, MNRAS, 505, 339
- Marchant & Moriya (2020a) Marchant P., Moriya T. J., 2020a, A&A, 640, L18
- Marchant & Moriya (2020b) Marchant P., Moriya T., 2020b, Astron. Astrophys., 640, L18
- Miller & Hamilton (2002) Miller M. C., Hamilton D. P., 2002, MNRAS, 330, 232
- Mortlock et al. (2015) Mortlock A., et al., 2015, MNRAS, 447, 2
- Neumayer & Walcher (2012) Neumayer N., Walcher C. J., 2012, Advances in Astronomy, 2012, 709038
- Neumayer et al. (2020) Neumayer N., Seth A., Böker T., 2020, A&ARv, 28, 4
- Nokhrina et al. (2019) Nokhrina E. E., Gurvits L. I., Beskin V. S., Nakamura M., Asada K., Hada K., 2019, MNRAS, 489, 1197
- Ownsworth et al. (2016) Ownsworth J. R., Conselice C. J., Mundy C. J., Mortlock A., Hartley W. G., Duncan K., Almaini O., 2016, MNRAS, 461, 1112
- Peters (1964) Peters P. C., 1964, Physical Review, 136, 1224
- Piotrovich et al. (2022) Piotrovich M. Y., Buliga S. D., Natsvlishvili T. M., 2022, Astronomische Nachrichten, 343, e10020
- Poggianti et al. (2013) Poggianti B. M., Moretti A., Calvi R., D’Onofrio M., Valentinuzzi T., Fritz J., Renzini A., 2013, ApJ, 777, 125
- Qin et al. (2018) Qin Y., Fragos T., Meynet G., Andrews J., Sørensen M., Song H. F., 2018, A&A, 616, A28
- Quinlan (1996) Quinlan G. D., 1996, New Astron., 1, 35
- Reynolds (2013) Reynolds C. S., 2013, Class. Quant. Grav., 30, 244004
- Reynolds (2021) Reynolds C. S., 2021, ARA&A, 59, 117
- Rizzuto et al. (2021) Rizzuto F. P., et al., 2021, MNRAS, 501, 5257
- Rodriguez et al. (2016a) Rodriguez C. L., Chatterjee S., Rasio F. A., 2016a, Phys. Rev. D, 93, 084029
- Rodriguez et al. (2016b) Rodriguez C. L., Zevin M., Pankow C., Kalogera V., Rasio F. A., 2016b, Astrophys. J. Lett., 832, L2
- Rodriguez et al. (2018a) Rodriguez C. L., Amaro-Seoane P., Chatterjee S., Kremer K., Rasio F. A., Samsing J., Ye C. S., Zevin M., 2018a, Phys. Rev. D, 98, 123005
- Rodriguez et al. (2018b) Rodriguez C. L., Amaro-Seoane P., Chatterjee S., Rasio F. A., 2018b, Phys. Rev. Lett., 120, 151101
- Rodriguez et al. (2019) Rodriguez C. L., Zevin M., Amaro-Seoane P., Chatterjee S., Kremer K., Rasio F. A., Ye C. S., 2019, Phys. Rev. D, 100, 043027
- Romero-Shaw et al. (2020) Romero-Shaw I., Lasky P. D., Thrane E., Calderón Bustillo J., 2020, ApJ, 903, L5
- Romero-Shaw et al. (2021) Romero-Shaw I., Lasky P. D., Thrane E., 2021, ApJ, 921, L31
- Romero-Shaw et al. (2022a) Romero-Shaw I. M., Loutrel N., Zevin M., 2022a, arXiv e-prints, p. arXiv:2211.07278
- Romero-Shaw et al. (2022b) Romero-Shaw I., Lasky P. D., Thrane E., 2022b, ApJ, 940, 171
- Romero-Shaw et al. (2023) Romero-Shaw I. M., Gerosa D., Loutrel N., 2023, MNRAS, 519, 5352
- Sabhahit et al. (2023) Sabhahit G. N., Vink J. S., Sander A. A. C., Higgins E. R., 2023, MNRAS, 524, 1529
- Sakstein et al. (2020) Sakstein J., Croon D., McDermott S. D., Straight M. C., Baxter E. J., 2020, Phys. Rev. Lett., 125, 261105
- Samsing (2018) Samsing J., 2018, Phys. Rev. D, 97, 103014
- Samsing et al. (2018) Samsing J., Askar A., Giersz M., 2018, Astrophys. J., 855, 124
- Schechter (1976) Schechter P., 1976, ApJ, 203, 297
- Schödel et al. (2007) Schödel R., et al., 2007, A&A, 469, 125
- Schödel et al. (2009) Schödel R., Merritt D., Eckart A., 2009, A&A, 502, 91
- Schödel et al. (2020) Schödel R., Nogueras-Lara F., Gallego-Cano E., Shahzamanian B., Gallego-Calvente A. T., Gardini A., 2020, A&A, 641, A102
- Seth et al. (2008) Seth A., Agüeros M., Lee D., Basu-Zych A., 2008, ApJ, 678, 116
- Song et al. (2016) Song M., et al., 2016, ApJ, 825, 5
- Sopuerta et al. (2007) Sopuerta C. F., Yunes N., Laguna P., 2007, ApJ, 656, L9
- Spera & Mapelli (2017) Spera M., Mapelli M., 2017, MNRAS, 470, 4739
- Spera et al. (2022) Spera M., Trani A. A., Mencagli M., 2022, Galaxies, 10, 76
- Stegmann et al. (2022) Stegmann J., Antonini F., Schneider F. R. N., Tiwari V., Chattopadhyay D., 2022, Phys. Rev. D, 106, 023014
- Stevenson et al. (2017a) Stevenson S., Vigna-Gómez A., Mandel I., Barrett J. W., Neijssel C. J., Perkins D., de Mink S. E., 2017a, Nature Commun., 8, 14906
- Stevenson et al. (2017b) Stevenson S., Berry C. P. L., Mandel I., 2017b, MNRAS, 471, 2801
- Stone et al. (2017) Stone N. C., Küpper A. H. W., Ostriker J. P., 2017, MNRAS, 467, 4180
- Tetarenko et al. (2016) Tetarenko B. E., et al., 2016, ApJ, 825, 10
- Tiwari (2023) Tiwari V., 2023, arXiv e-prints, p. arXiv:2304.03498
- Tiwari & Fairhurst (2021) Tiwari V., Fairhurst S., 2021, ApJ, 913, L19
- Valcin et al. (2021) Valcin D., Jimenez R., Verde L., Bernal J. L., Wandelt B. D., 2021, J. Cosmology Astropart. Phys., 2021, 017
- Vink et al. (2001) Vink J. S., de Koter A., Lamers H. J. G. L. M., 2001, A&A, 369, 574
- Vink et al. (2021) Vink J. S., Higgins E. R., Sander A. A. C., Sabhahit G. N., 2021, MNRAS, 504, 146
- Wang et al. (2019) Wang K., Huang Z.-p., Wang J.-m., 2019, Chinese Astron. Astrophys., 43, 217
- Wang et al. (2020) Wang L., Iwasawa M., Nitadori K., Makino J., 2020, MNRAS, 497, 536
- Wen (2003) Wen L., 2003, ApJ, 598, 419
- Woosley (2017) Woosley S. E., 2017, Astrophys. J., 836, 244
- Woosley & Heger (2021) Woosley S. E., Heger A., 2021, ApJ, 912, L31
- Yuan et al. (2023) Yuan G.-W., et al., 2023, arXiv e-prints, p. arXiv:2303.09391
- Yungelson et al. (2008) Yungelson L. R., van den Heuvel E. P. J., Vink J. S., Portegies Zwart S. F., de Koter A., 2008, A&A, 477, 223
- Zevin et al. (2021) Zevin M., Romero-Shaw I. M., Kremer K., Thrane E., Lasky P. D., 2021, ApJ, 921, L43