Fact-checking information generated by a large language model
can decrease news discernment
)
Abstract
Fact checking can be an effective strategy against misinformation1, 2, 3, but its implementation at scale is impeded by the overwhelming volume of information online4. Recent artificial intelligence (AI) language models have shown impressive ability in fact-checking tasks5, 6, but how humans interact with fact-checking information provided by these models is unclear. Here, we investigate the impact of fact-checking information generated by a popular large language model (LLM) on belief in, and sharing intent of, political news in a preregistered randomized control experiment. Although the LLM performs reasonably well in debunking false headlines, we find that it does not significantly affect participants’ ability to discern headline accuracy or share accurate news. Subsequent analysis reveals that the AI fact-checker is harmful in specific cases: it decreases beliefs in true headlines that it mislabels as false and increases beliefs in false headlines that it is unsure about. On the positive side, the AI fact-checking information increases sharing intents for correctly labeled true headlines. When participants are given the option to view LLM fact checks and choose to do so, they are significantly more likely to share both true and false news but only more likely to believe false news. Our findings highlight an important source of potential harm stemming from AI applications and underscore the critical need for policies to prevent or mitigate such unintended consequences.
Significance Statement
This study explores the effects of fact-checking information generated by large language models (LLMs) on public perception and dissemination of political news. Despite the public’s growing adoption of this artificial intelligence (AI) technology, and practitioners testing its ability to combat online misinformation, little is known about how people respond to LLM-driven fact-checking. This randomized control experiment reveals that even LLMs that effectively debunk false headlines do not necessarily enhance users’ abilities to discern news accuracy or promote accurate news sharing. Notably, LLM fact checks can inadvertently reduce trust in true news wrongly labeled as false and increase belief in dubious headlines when the AI is unsure about an article’s veracity. These findings highlight the urgent need for thorough research into the unintended impacts of AI fact-checking, guiding the development of policies that ensure this new technology bolsters information integrity in our increasingly digital world.
Digital misinformation has rapidly become a critical issue of modern society7, 8. Recent work suggests that misinformation can erode support for climate change9, 10, contribute to vaccine hesitancy11, 12, 13, exacerbate political polarization14, and even undermine democracy15. As a mitigation strategy, fact checking has proved effective at reducing people’s belief in3, 1, 16 and intention to share17 misinformation in various cultural settings2. However, this approach is not scalable, greatly limiting its applications4.
To tackle this challenge, researchers and social media platforms have been exploring automated methods18 to detect misinformation19, 20 and fact-check claims21, 22, 18, 23, 24, 25. A robust fact-checking system must possess the ability to detect claims, retrieve relevant evidence, assess the veracity of each claim, and yield justifications for the provided conclusions26, 27. Previous work attempting to meet these goals typically adopts cutting-edge artificial intelligence (AI) methods, specifically natural language processing. Nevertheless, building a functional system that can handle the vast volume of digital information on the internet, spanning various contexts and languages, remains a daunting task.
Recent advances in large language models (LLMs) may appear to provide a feasible path forward. Trained on massive datasets of text from the internet, including news articles, books, and websites28, these models are knowledgeable about a wide range of topics and have shown impressive performance on tasks such as text summarization and named entity recognition29, 30. Outside the laboratory, LLMs have demonstrated remarkable abilities, even passing challenging exams designed for humans31, 32.
Analyses of ChatGPT, a prominent LLM, suggest it can rate the credibility of news outlets33 and fact-check claims5, 34 without special configuration. Messages provided by LLMs to correct social media misinformation can be better than corrective messages generated by humans6. These models can generate convincing justifications for the information they provide and even engage in conversations with users to provide additional context and facilitate understanding in multiple languages. Such capabilities of LLMs, coupled with open-sourcing efforts35, 36, create a favorable environment for the development of scalable and reliable AI systems that can verify nearly all claims on the internet.
However, realizing this potential requires humans to integrate LLMs into the digital information ecosystem effectively. Unfortunately, human-AI interaction is notoriously complex37. Prior work has shown that AI is often seen as objective38, 39, 40, 41, yet trust in AI depends on various factors such as individual expectations42, 43, system interactivity44, 45, and whether the AI provides information about its recommendations46, 47.
In the present context, it remains unclear how humans would interact with fact-checking information provided by state-of-the-art LLMs. Therefore, a thorough analysis of this misinformation intervention is necessary before deploying models in the wild. To this end, we conduct a preregistered48, randomized controlled experiment to examine the causal effects of viewing fact-checking information provided by ChatGPT on individual beliefs in and intention to share political news. We selected ChatGPT for our study despite it not being specifically tailored for fact-checking. This decision was driven by its widespread public availability and use as well as the promising results emerging from tests of its claim verification capabilities at the time34, 49, 5.
Results
We recruited a representative sample of U.S. participants (see Methods for more information). All participants were presented with the same 40 real political news stories, which included a headline, lede sentence (if present), and image. Half of these headlines were true and the other half were false. Half were favorable to Democrats and the other half were favorable to Republicans (see Methods for details).
Participants were separated into “belief” and “sharing” groups in which they were asked to indicate, respectively, whether they believed headlines to be accurate or would be willing to share them on social media. These questions were asked separately as priming individuals to think about headline veracity can alter sharing behavior50, 4. Three conditions were designed for each group, consisting of a control and two treatment conditions that aimed to simulate hypothetical scenarios for an automated fact-checking system on a social media platform: treated subjects were either forced to view fact-checking information provided by ChatGPT (forced condition) or given the option to reveal that information by clicking a button (optional condition). ChatGPT fact-checking information was identical for all treated subjects and presented directly below the corresponding headline (see Methods for more details). Subjects in the control condition were only shown headlines and asked the belief/sharing question without being exposed to any fact-checking information. Study participants were assigned randomly to one of the six experimental conditions. The experimental design is illustrated in Fig. 1a. See Methods for more details.
Unless otherwise stated, all values presented here are generated with two-tailed Mann-Whitney U tests and adjusted with Bonferroni correction for multiple comparisons. In Supplementary information, we also report on linear regression for all results, employing robust standard errors clustered on participant and headline.
Accuracy of LLM fact-checking information
To contextualize our results, we first illustrate in Fig. 1b the accuracy of ChatGPT’s fact-checking information. True headlines were accurately fact-checked 15% of the time (3/20) whereas 20% (4/20) were erroneously reported as “false.” For the remaining 65% of true headlines (13/20), ChatGPT expressed some degree of uncertainty (labeled as “unsure”). These responses often contained language such as “It is possible that … but I don’t have any information on whether this has happened or not.” For false headlines, ChatGPT was unsure in 10% (2/20) of cases; the remaining 90% (18/20) were accurately judged as “false.”
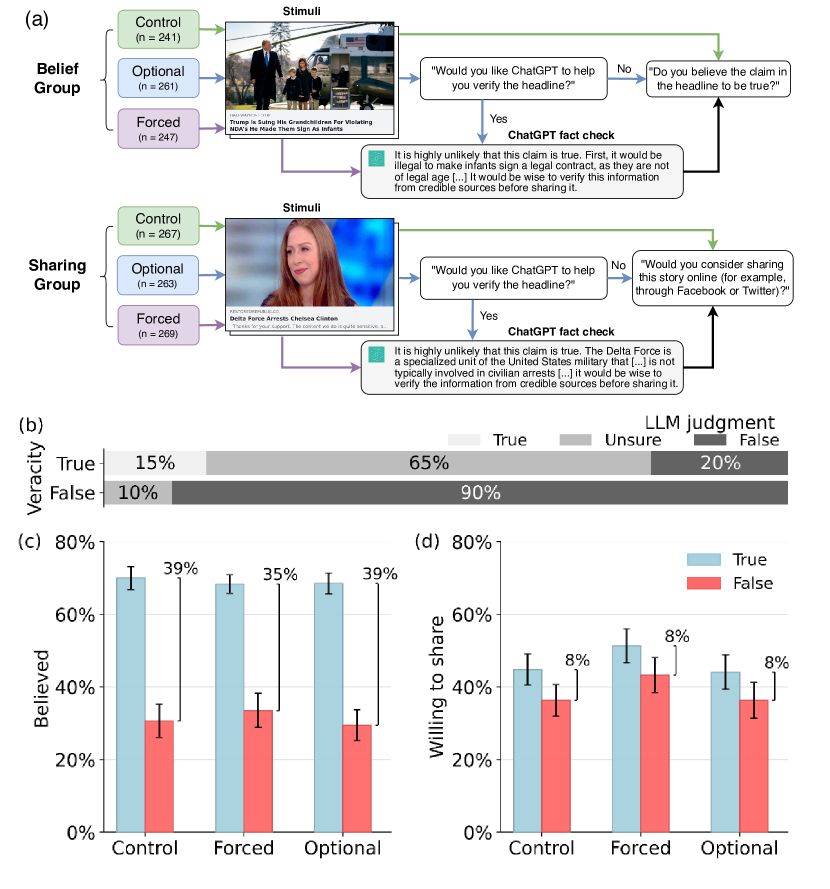
Although limited in size, our set of headlines provides us with a balanced representation of political biases and factual accuracy to evaluate the LLM. Overall, this analysis suggests that the LLM is an accurate fact-checker for false content. For true headlines, it is less accurate but can generally identify and explain when it cannot provide accurate fact-checking information. These results align with earlier studies that delve into the accuracy of LLM fact-checking utilizing much larger datasets49, 5, 34.
Ineffectiveness of LLM intervention
To evaluate the effectiveness of a misinformation intervention, it is crucial to measure its impact on belief in and sharing of both true and false headlines51, 50. Although the veracity of headlines may not always fit neatly into true and false categories, as in the case of rumors with unclear veracity that are later clarified52, this framework defines the desired outcome: an effective misinformation intervention should enhance individuals’ ability to distinguish between true and false headlines such that they believe/share more accurate news.
To capture the causal effects of LLM-generated fact-checking information, we compare the average discernment of participants in the treatment conditions (forced and optional) to those in the control condition. Discernment is defined as the difference between the proportion of true and false headlines that participants believe (or are willing to share), capturing the intervention’s impact on both news categories.
Figure 1 (panels c,d) illustrates the effects of LLM fact checking on belief in and intent to share true and false headlines under each condition, including the mean group discernment as an annotation. In contrast with our preregistered expectations, discernment within both the belief and sharing groups was unaffected by the treatment, regardless of condition. In the belief group (Fig. 1c), participants who were forced to view AI fact checks displayed a slight mean reduction (%) in discernment when compared to the control group (, , , 95% CI: ). The discernment of those given the option to view fact checks in this group was virtually unaffected, decreasing on average by only % (, , , 95% CI: ).
Similarly in the sharing group (Fig. 1d), we do not observe any significant changes in discernment for either treatment condition. Compared to the control group, the forced and optional conditions displayed a mean reduction of % (, , , 95% CI: ) and % (, , , 95% CI: ), respectively.
In summary, these results indicate that the fact-checking information provided by the LLM is not an effective intervention against misinformation. This is unexpected considering that the AI provides participants with useful information, particularly for false headlines. However, this analysis does not account for the accuracy of the AI’s responses, nor does it examine how behaviors vary when individuals choose to view or not view this information. To delve deeper into these dynamics, we have supplemented our preregistered design with two additional exploratory analyses in the sections that follow.
Accounting for LLM accuracy
Here, we explore the causal effects of viewing LLM fact-checking information when accounting for model accuracy. The judgments made by ChatGPT for both true and false headlines fall into one of three categories: correct, incorrect, or unsure. This results in six different scenarios (True/False Correct/Incorrect/Unsure) in which effects may be observed. However, our data contain no false headlines judged by ChatGPT to be true, resulting in five scenarios for each previously considered comparison (Belief/Sharing Control/Optional/Forced).
To evaluate the potential impact of LLM-generated fact checks, we compare the forced and control conditions in these five scenarios, as illustrated in Fig. 2. Annotations indicate mean group differences and highlight the significant effects identified through Bonferroni-adjusted Mann-Whitney U tests.

In the belief group, we found significant undesirable effects showing that LLM fact checks decreased participants’ discernment. Specifically, there was a 12.75% decrease in the belief of true headlines incorrectly judged as false by ChatGPT (, , , 95% CI: ) and a 9.12% increase in the belief of false headlines where the AI expressed uncertainty (, , , 95% CI: ). Both cases demonstrate a behavioral change that is counter to the intended outcome of a misinformation intervention.
Regarding the sharing group, we observed mixed results. While there was an 11.09% increase in participants’ intention to share true headlines correctly judged by ChatGPT (, , , 95% CI: ), there was also a 9.77% increase in the intention to share false headlines where ChatGPT expressed uncertainty (, , , 95% CI: ). The former increases sharing discernment, while the latter reduces it by a similar amount.
These results indicate that LLMs can affect belief in and intent to share both true and false news, depending on how they judge a headline. While most effects are small, some reflect harmful outcomes in the sense of reduced discernment.
Opt in versus opt out
We next analyze participants’ behavior in the optional condition, comparing those who opt in to see LLM fact-checking information versus those who opt out. Figure 3 illustrates the belief in and intention to share headlines for which subjects chose to see versus not see LLM fact checks, for both true and false headlines. Each subject’s contribution to the group mean values and confidence intervals are weighted by the number of times they chose to see (or not see) each type of headline. Figure 3a shows that participants who chose to see LLM fact checks were significantly more likely to believe false headlines (29.47% increase; , , , 95% CI: ), whereas no significant difference in belief was observed for true headlines (1.50% increase; , , , 95% CI: ). On the other hand, Figure 3b shows that participants who viewed LLM fact checks were more willing to share headlines from both categories, with a 34.06% increase for true headlines (, , , 95% CI: ) and a 37.61% increase for false headlines (, , , 95% CI: ).
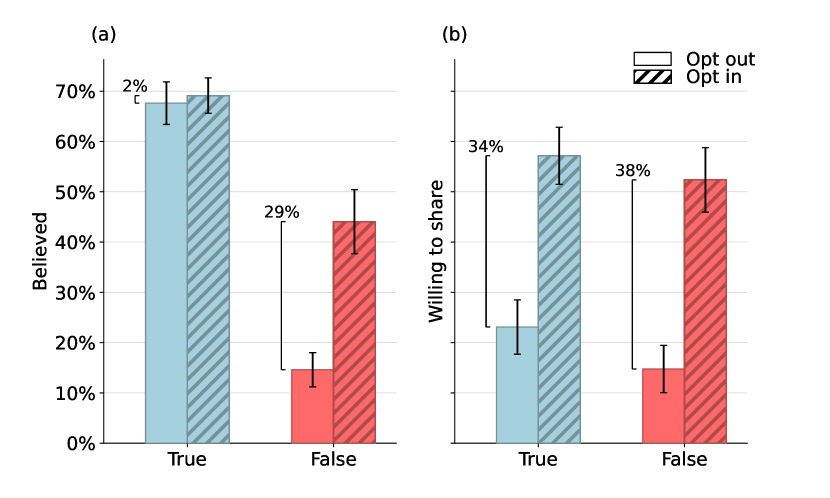
We note that this particular within-group analysis does not allow us to identify causal effects because participants are not randomly assigned to the treatment (opt in) or comparison (opt out) group for each headline. Nonetheless, when participants viewed LLM-generated fact-checking information they were much more likely to share both true and false news, but only more likely to believe false news.
Attitudes toward AI and partisan congruence
Our preregistered analyses also examined the potential roles played by individual attitudes toward AI and by the partisan congruence of headlines. We find evidence of both variables impacting results in certain cases when individuals are given the choice to view LLM fact-checking information. Specifically, the result that participants who opted to view LLM-generated fact checks were more likely to share all content and to believe false content was more pronounced among participants with positive attitudes towards AI. Similarly, participants who opted to view LLM fact checks about partisan false headlines were more likely to believe headlines that were congruent, as opposed to incongruent, with their partisan interests. For more information about these analyses, please see the Interaction analyses section in Supplementary information.
Discussion
While our experimental design allows us to assess the causal effects of LLM fact-checking information on the discernment of true and false news, it is important to exercise caution when generalizing these results to different contexts. First, we use a specific version of ChatGPT to generate fact-checking information; the findings may not apply to other AI models. Second, design choices intended to emulate a realistic social media environment — such as including headline sources and lede text — may contribute to people’s assessments, although these effects should be equal for all experimental conditions. Third, the survey setting of our experiment may not fully capture the complexities of real-world information consumption and sharing behaviors. However, previous research has shown a correlation between self-reported willingness to share news in online surveys and actual sharing behavior on social media platforms53. Finally, while our study presents real news headlines that replicate a common social media design, the results may not generalize beyond our relatively small selection of political news headlines. Nevertheless, the pretest conducted on these articles ensured they are balanced with respect to dimensions known to be important to believing and sharing news (see Methods).
Despite these limitations, our study provides valuable insights into the complex interplay between humans and AI in the context of automated fact checking. ChatGPT performs well at debunking false headlines while it mostly reports being unsure about true headlines, consistent with previous research49, 5, 34. Although an ideal model would, of course, be largely correct, the LLM’s ability to clearly communicate uncertainty (without specific instruction to do so) may be considered a desirable quality of an automated fact-checking system54. Furthermore, ChatGPT is a general-purpose model; given the rapid development of AI technology, performance in fact checking is likely to improve as language models are developed explicitly for this task.
The average belief and sharing discernment of participants were not affected by viewing LLM fact-checking information, whether or not such information was optional. These results are surprising given previous work suggests that LLMs can persuade humans on controversial topics55, 56. However, we found that AI-generated fact checks can affect belief in and intent to share news headlines, and this effect is contingent upon the accuracy of the AI’s responses relative to the veracity of the headlines. Consistent with literature showing that AI may be perceived as objective38, 39, participants tended to believe true headlines less when the LLM incorrectly labeled them as false. Conversely, when the LLM expressed uncertainty about the veracity of false headlines, participants were more inclined to believe them. We also found that participants were more likely to share false headlines in this scenario, although the effect was less significant. Confirmation bias may partially explain these results57, but further research is needed to understand the underlying mechanisms. Participants also demonstrated an increased willingness to share true headlines that were correctly identified by the LLM. While most of our results indicate undesirable behavioral changes, this outcome is encouraging, as it aligns with efforts to improve the acceptance of reliable information58.
The behavior of participants in the optional condition revealed a strong selection bias. When participants were given the choice to view LLM fact-checking information, those who chose to do so were significantly more likely to share both true and false news, but only more likely to believe false news. These results suggest that individuals may have already formed their opinion about a headline before accessing the fact-checking information. For example, they might wish to confirm what they believe to be true or see if the AI is wrong. Irrespective of the motivation, they subsequently disregard the fact check. This pattern is particularly evident with respect to false headlines, for which ChatGPT provides highly accurate information. Despite being presented with helpful information indicating that these headlines were false, participants were still much more likely to report believing or being willing to share that content. Further interaction analyses suggest that individual attitudes towards AI, as well as partisan congruence with headlines, are related to this behavior. Although our study design cannot reveal the exact mechanism behind the outcomes of the optional condition, the findings suggest that this misinformation intervention design is unlikely to be helpful. An interesting extension of this experiment would be to test an intervention in which users are not aware that fact-checking information is AI-generated.
We present these results in the context of concerns raised by experts about the potential for AI to contribute to the digital misinformation problem59, 60, 61, 62. These concerns are well-founded; malicious AI-powered bots are virtually undetectable on social media63 and even the developers of ChatGPT report that their technology is likely to be weaponized by malicious actors64, 60. To make matters worse, recent research suggests that state-of-the-art LLMs can persuade individuals on polarized topics56, 65, providing an incentive for their use in political information campaigns60.
As artificial intelligence becomes increasingly integrated into our information environment, it is crucial that we thoroughly understand the risks as well as the opportunities it creates. Our results reveal that the dynamics of human-AI interaction make the application of LLMs to fact checking potentially harmful despite its accuracy.
Methods
Participant sampling.
We utilized Qualtric’s quota-matching system to ensure that our sample was representative of the United States population with respect to gender, age, race, education, and partisanship. We utilized 2020 U.S. Census66 and Pew Research67 data as references for our quota criteria, which Qualtrics guaranteed with a 5% accuracy. Further details can be found in Supplementary methods. After sampling, data for 1,548 participants were collected. In the belief group, the control, optional, and forced conditions had 241, 261, and 247 participants, respectively. In the sharing group, the control, optional, and forced conditions had 267, 263, and 269 participants, respectively. We conducted tests to compare the distributions of sharing and accuracy groups (control vs. optional vs. forced) across the above dimensions and found no significant differences. All subjects confirmed their consent to participate in this study, which was approved by Indiana University’s IRB (protocol 1307012383).
News stories.
We utilize 40 headlines with a balance of perceived partisanship, impact, familiarity, sensationalism, and the likelihood of being shared and believed. Half were true and half false. Each story included a headline, a lede sentence (if present), and an image. All headline stimuli are included in our preregistration48. Further details can be found in Supplementary methods.
LLM fact checks.
Fact-checking information was generated by submitting to ChatGPT the prompt “I saw something today that claimed HEADLINE TEXT. Do you think that this is likely to be true?” This prompt was designed to capture a realistic scenario in which someone uses an AI chatbot to fact-check a headline to which they were exposed. All fact checks are included in our preregistration48. Further details can be found in Supplementary methods. To quantify and account for ChatGPT’s fact-checking accuracy, the first three authors independently labeled the fact-checking information as either “True,” “Unsure,” or “False.” Final annotations were based on the majority labels (Krippendorff’s 0.79).
Participant flow.
All participants began by completing a brief survey, followed by exposure to their respective experimental conditions, followed by another brief survey and debriefing. Regardless of the condition, all participants saw the same headlines in random order. These stimuli were presented simultaneously with fact-checking information or questions about viewing fact checks (depending on experimental condition) along with questions regarding individual belief and sharing intention. Participants who failed an attention check were excluded from the study. Further details can be found in Supplementary methods.
Code and data availability
All analysis code and data is available at: github.com/osome-iu/AI_fact_checking.
Acknowledgements
The authors would like to acknowledge Lisa Fazio, David Rand, Stephan Lewandowsky, Adam Berinsky, Mark Susmann, and Gordon Pennycook who kindly shared the news headline stimuli developed for the Mercury Project “Building a better toolkit (for fighting misinformation)”68. This research was supported in part by Knight Foundation and Volkswagen Foundation.
Author contributions
M.R.D. conceived of the research and developed the study design with help from H.Y.Y. and K.Y. M.R.D. manually generated the fact checks. M.R.D., H.Y.Y., and K.Y. developed the survey. M.R.D. and H.Y.Y. conducted data analysis, with input from K.Y. and F.M. M.R.D. wrote the paper, with input from all authors.
Competing interests
The authors declare no competing interests.
References
- Brashier et al. 2021 Nadia M Brashier, Gordon Pennycook, Adam J Berinsky, and David G Rand. Timing matters when correcting fake news. Proceedings of the National Academy of Sciences, 118(5):e2020043118, 2021. URL https://doi.org/10.1073/pnas.2020043118.
- Porter and Wood 2021 Ethan Porter and Thomas J. Wood. The global effectiveness of fact-checking: Evidence from simultaneous experiments in Argentina, Nigeria, South Africa, and the United Kingdom. Proc Natl Acad Sci U.S.A, 118(37):e2104235118, September 2021. URL https://doi.org/10.1073/pnas.2104235118.
- Walter et al. 2020 Nathan Walter, Jonathan Cohen, R Lance Holbert, and Yasmin Morag. Fact-checking: A meta-analysis of what works and for whom. Political Communication, 37(3):350–375, 2020. URL https://doi.org/10.1080/10584609.2019.1668894.
- Pennycook and Rand 2021 Gordon Pennycook and David G Rand. The psychology of fake news. Trends in cognitive sciences, 25(5):388–402, 2021. URL https://doi.org/10.1016/j.tics.2021.02.007.
- Hoes et al. 2023 Emma Hoes, Sacha Altay, and Juan Bermeo. Leveraging ChatGPT for Efficient Fact-Checking. PsyArXiv, April 2023. URL https://doi.org/10.31234/osf.io/qnjkf.
- He et al. 2023 Bing He, Mustaque Ahamad, and Srijan Kumar. Reinforcement Learning-based Counter-Misinformation Response Generation: A Case Study of COVID-19 Vaccine Misinformation. In WWW ’23: Proceedings of the ACM Web Conference 2023, pages 2698–2709. Association for Computing Machinery, April 2023. URL https://doi.org/10.1145/3543507.3583388.
- Lewandowsky et al. 2017 Stephan Lewandowsky, Ullrich KH Ecker, and John Cook. Beyond misinformation: Understanding and coping with the “post-truth” era. Journal of Applied Research in Memory and Cognition, 6(4):353–369, 2017. URL https://doi.org/10.1016/j.jarmac.2017.07.008.
- Lazer et al. 2018 David M. J. Lazer, Matthew A. Baum, Yochai Benkler, Adam J. Berinsky, Kelly M. Greenhill, Filippo Menczer, Miriam J. Metzger, Brendan Nyhan, Gordon Pennycook, David Rothschild, Michael Schudson, Steven A. Sloman, Cass R. Sunstein, Emily A. Thorson, Duncan J. Watts, and Jonathan L. Zittrain. The science of fake news. Science, 359(6380):1094–1096, March 2018. URL https://doi.org/10.1126/science.aao2998.
- Van der Linden et al. 2017 Sander Van der Linden, Anthony Leiserowitz, Seth Rosenthal, and Edward Maibach. Inoculating the public against misinformation about climate change. Global challenges, 1(2):1600008, 2017. URL https://doi.org/10.1002/gch2.201600008.
- Biddlestone et al. 2022 Mikey Biddlestone, Flavio Azevedo, and Sander van der Linden. Climate of conspiracy: A meta-analysis of the consequences of belief in conspiracy theories about climate change. Current Opinion in Psychology, page 101390, 2022. URL https://doi.org/10.1016/j.copsyc.2022.101390.
- Pierri et al. 2022 Francesco Pierri, Brea L Perry, Matthew R DeVerna, Kai-Cheng Yang, Alessandro Flammini, Filippo Menczer, and John Bryden. Online misinformation is linked to early COVID-19 vaccination hesitancy and refusal. Scientific reports, 12(1):5966, 2022. URL https://doi.org/10.1038/s41598-022-10070-w.
- Rathje et al. 2022 Steve Rathje, James K He, Jon Roozenbeek, Jay J Van Bavel, and Sander van der Linden. Social media behavior is associated with vaccine hesitancy. PNAS Nexus, 1(4), 2022. URL https://doi.org/10.1093/pnasnexus/pgac207.
- Loomba et al. 2021 Sahil Loomba, Alexandre de Figueiredo, Simon J Piatek, Kristen de Graaf, and Heidi J Larson. Measuring the impact of COVID-19 vaccine misinformation on vaccination intent in the UK and USA. Nature human behaviour, 5(3):337–348, 2021. URL https://doi.org/10.1038/s41562-021-01056-1.
- Tucker et al. 2018 Joshua A Tucker, Andrew Guess, Pablo Barberá, Cristian Vaccari, Alexandra Siegel, Sergey Sanovich, Denis Stukal, and Brendan Nyhan. Social media, political polarization, and political disinformation: A review of the scientific literature. SSRN, 2018. URL https://dx.doi.org/10.2139/ssrn.3144139.
- Van Bavel et al. 2021 Jay J Van Bavel, Elizabeth A Harris, Philip Pärnamets, Steve Rathje, Kimberly C Doell, and Joshua A Tucker. Political psychology in the digital (mis) information age: A model of news belief and sharing. Social Issues and Policy Review, 15(1):84–113, 2021. URL https://doi.org/10.1111/sipr.12077.
- Nyhan et al. 2020 Brendan Nyhan, Ethan Porter, Jason Reifler, and Thomas J Wood. Taking fact-checks literally but not seriously? The effects of journalistic fact-checking on factual beliefs and candidate favorability. Political Behavior, 42:939–960, 2020. URL https://doi.org/10.1007/s11109-019-09528-x.
- Yaqub et al. 2020 Waheeb Yaqub, Otari Kakhidze, Morgan L Brockman, Nasir Memon, and Sameer Patil. Effects of credibility indicators on social media news sharing intent. In Proceedings of the 2020 CHI Conference on Human Factors in Computing Systems, pages 1–14, 2020. URL https://doi.org/10.1145/3313831.3376213.
- Lee et al. 2020 Nayeon Lee, Belinda Z. Li, Sinong Wang, Wen-tau Yih, Hao Ma, and Madian Khabsa. Language Models as Fact Checkers? In Proceedings of the Third Workshop on Fact Extraction and VERification (FEVER), pages 36–41. Association for Computational Linguistics, jul 2020. URL https://aclanthology.org/2020.fever-1.5.
- Shu et al. 2017 Kai Shu, Amy Sliva, Suhang Wang, Jiliang Tang, and Huan Liu. Fake news detection on social media: A data mining perspective. ACM SIGKDD explorations newsletter, 19(1):22–36, 2017. URL https://doi.org/10.1145/3137597.3137600.
- Zhou and Zafarani 2020 Xinyi Zhou and Reza Zafarani. A survey of fake news: Fundamental theories, detection methods, and opportunities. ACM Computing Surveys (CSUR), 53(5):1–40, 2020. URL https://doi.org/10.1145/3395046.
- Nakov et al. 2021 Preslav Nakov, David Corney, Maram Hasanain, Firoj Alam, Tamer Elsayed, Alberto Barrón-Cedeño, Paolo Papotti, Shaden Shaar, and Giovanni Da San Martino. Automated fact-checking for assisting human fact-checkers. In Proceedings of the Thirtieth International Joint Conference on Artificial Intelligence, IJCAI-21, pages 4551–4558. International Joint Conferences on Artificial Intelligence Organization, 8 2021. URL https://doi.org/10.24963/ijcai.2021/619.
- Yang et al. 2021 Jing Yang, Didier Vega-Oliveros, Tais Seibt, and Anderson Rocha. Scalable Fact-checking with Human-in-the-Loop. In 2021 IEEE International Workshop on Information Forensics and Security (WIFS), pages 1–6. IEEE, December 2021. URL https://doi.org/10.1109/WIFS53200.2021.9648388.
- Graves 2018 D. Graves. Understanding the promise and limits of automated fact-checking. Reuters Institute for the Study of Journalism, February 2018. URL https://ora.ox.ac.uk/objects/uuid:f321ff43-05f0-4430-b978-f5f517b73b9b.
- Hassan et al. 2017 Naeemul Hassan, Fatma Arslan, Chengkai Li, and Mark Tremayne. Toward Automated Fact-Checking: Detecting Check-Worthy Factual Claims by ClaimBuster. In Proceedings of the 23rd ACM SIGKDD International Conference on Knowledge Discovery and Data Mining, page 1803–1812, 2017. URL https://doi.org/10.1145/3097983.3098131.
- Ciampaglia et al. 2015 Giovanni Luca Ciampaglia, Prashant Shiralkar, Luis M. Rocha, Johan Bollen, Filippo Menczer, and Alessandro Flammini. Computational Fact Checking from Knowledge Networks. PLoS One, 10(6):e0128193, June 2015. URL https://doi.org/10.1371/journal.pone.0128193.
- Zeng et al. 2021 Xia Zeng, Amani S Abumansour, and Arkaitz Zubiaga. Automated fact-checking: A survey. Language and Linguistics Compass, 15(10):e12438, 2021. URL https://doi.org/10.1111/lnc3.12438.
- Guo et al. 2022 Zhijiang Guo, Michael Schlichtkrull, and Andreas Vlachos. A Survey on Automated Fact-Checking. Transactions of the Association for Computational Linguistics, 10:178–206, 2022. URL https://doi.org/10.1162/tacl_a_00454.
- Brown et al. 2020 Tom Brown, Benjamin Mann, Nick Ryder, Melanie Subbiah, Jared D Kaplan, Prafulla Dhariwal, Arvind Neelakantan, Pranav Shyam, Girish Sastry, Amanda Askell, Sandhini Agarwal, Ariel Herbert-Voss, Gretchen Krueger, Tom Henighan, Rewon Child, Aditya Ramesh, Daniel Ziegler, Jeffrey Wu, Clemens Winter, Chris Hesse, Mark Chen, Eric Sigler, Mateusz Litwin, Scott Gray, Benjamin Chess, Jack Clark, Christopher Berner, Sam McCandlish, Alec Radford, Ilya Sutskever, and Dario Amodei. Language models are few-shot learners. In H. Larochelle, M. Ranzato, R. Hadsell, M.F. Balcan, and H. Lin, editors, Advances in Neural Information Processing Systems, volume 33, pages 1877–1901, 2020. URL https://proceedings.neurips.cc/paper_files/paper/2020/file/1457c0d6bfcb4967418bfb8ac142f64a-Paper.pdf.
- Ye et al. 2023 Junjie Ye, Xuanting Chen, Nuo Xu, Can Zu, Zekai Shao, Shichun Liu, Yuhan Cui, Zeyang Zhou, Chao Gong, Yang Shen, et al. A Comprehensive Capability Analysis of GPT-3 and GPT-3.5 Series Models. Preprint arXiv:2303.10420, 2023. URL https://doi.org/10.48550/arXiv.2303.10420.
- Qin et al. 2023 Chengwei Qin, Aston Zhang, Zhuosheng Zhang, Jiaao Chen, Michihiro Yasunaga, and Diyi Yang. Is ChatGPT a general-purpose natural language processing task solver? Preprint arXiv:2302.06476, 2023. URL https://doi.org/10.48550/arXiv.2302.06476.
- Katz et al. 2023 Daniel Martin Katz, Michael James Bommarito, Shang Gao, and Pablo Arredondo. GPT-4 Passes the Bar Exam. SSRN, March 2023. URL https://dx.doi.org/10.2139/ssrn.4389233.
- OpenAI 2023 OpenAI. GPT-4 Technical Report. ArXiv, Mar 2023. URL https://doi.org/10.48550/arXiv.2303.08774.
- Yang and Menczer 2023a Kai-Cheng Yang and Filippo Menczer. Large language models can rate news outlet credibility. arXiv, April 2023a. URL https://arxiv.org/abs/2304.00228.
- Kuznetsova et al. 2023 Elizaveta Kuznetsova, Mykola Makhortykh, Victoria Vziatysheva, Martha Stolze, Ani Baghumyan, and Aleksandra Urman. In Generative AI we Trust: Can Chatbots Effectively Verify Political Information? arXiv, December 2023. URL https://doi.org/10.48550/arXiv.2312.13096.
- Taori et al. 2023 Rohan Taori, Ishaan Gulrajani, Tianyi Zhang, Yann Dubois, Xuechen Li, Carlos Guestrin, Percy Liang, and Tatsunori B. Hashimoto. Alpaca: A Strong, Replicable Instruction-Following Model. Stanford Center for Research on Foundation Models Blog, April 2023. URL https://crfm.stanford.edu/2023/03/13/alpaca.html. [Online; accessed 7. Apr. 2023].
- Conover et al. 2023 Mike Conover, Matt Hayes, Ankit Mathur, Xiangrui Meng, Jianwei Xie, Jun Wan, Ali Ghodsi, Patrick Wendell, and Matei Zaharia. Hello Dolly: Democratizing the magic of ChatGPT with open models. Databricks Blog, March 2023. URL https://www.databricks.com/blog/2023/03/24/hello-dolly-democratizing-magic-chatgpt-open-models.html. [Online; accessed 7. Apr. 2023].
- Hancock et al. 2020 Jeffrey T. Hancock, Mor Naaman, and Karen Levy. AI-Mediated Communication: Definition, Research Agenda, and Ethical Considerations. J Comput Mediat Commun, 25(1):89–100, March 2020. URL https://doi.org/10.1093/jcmc/zmz022.
- Sundar 2008 S. Shyam Sundar. The MAIN Model: A Heuristic Approach to Understanding Technology Effects on Credibility. In Digital Media, Youth, and Credibility, volume 2008, pages 73–100. The MIT Press, 2008. doi: 10.1162/dmal.9780262562324.073.
- Sundar and Kim 2019 S. Shyam Sundar and Jinyoung Kim. Machine Heuristic: When We Trust Computers More than Humans with Our Personal Information. In Proceedings of the 2019 CHI Conference on Human Factors in Computing Systems, CHI ’19, pages 1–9, New York, NY, USA, May 2019. Association for Computing Machinery. ISBN 978-1-4503-5970-2. doi: 10.1145/3290605.3300768. URL https://doi.org/10.1145/3290605.3300768.
- Sundar 2020 S Shyam Sundar. Rise of Machine Agency: A Framework for Studying the Psychology of Human–AI Interaction (HAII). Journal of Computer-Mediated Communication, 25(1):74–88, 2020. URL https://doi.org/10.1093/jcmc/zmz026.
- DeAndrea 2014 David C. DeAndrea. Advancing Warranting Theory. Commun Theory, 24(2):186–204, May 2014. URL https://doi.org/10.1111/comt.12033.
- Luger and Sellen 2016 Ewa Luger and Abigail Sellen. “Like Having a Really Bad PA”: The Gulf between User Expectation and Experience of Conversational Agents. In CHI ’16: Proceedings of the 2016 CHI Conference on Human Factors in Computing Systems, pages 5286–5297. Association for Computing Machinery, May 2016. URL https://doi.org/10.1145/2858036.2858288.
- Meurisch et al. 2020 Christian Meurisch, Cristina A. Mihale-Wilson, Adrian Hawlitschek, Florian Giger, Florian Müller, Oliver Hinz, and Max Mühlhäuser. Exploring User Expectations of Proactive AI Systems. Proc ACM Interact Mob Wearable Ubiquitous Technol, 4(4):1–22, December 2020. URL https://doi.org/10.1145/3432193.
- Shi et al. 2022 Li Shi, Nilavra Bhattacharya, Anubrata Das, Matt Lease, and Jacek Gwizdka. The Effects of Interactive AI Design on User Behavior: An Eye-tracking Study of Fact-checking COVID-19 Claims. In CHIIR ’22: Proceedings of the 2022 Conference on Human Information Interaction and Retrieval, pages 315–320. Association for Computing Machinery, March 2022. URL https://doi.org/10.1145/3498366.3505786.
- Smith-Renner et al. 2020 Alison Smith-Renner, Ron Fan, Melissa Birchfield, Tongshuang Wu, Jordan Boyd-Graber, Daniel S. Weld, and Leah Findlater. No Explainability without Accountability: An Empirical Study of Explanations and Feedback in Interactive ML. In Proceedings of the 2020 CHI Conference on Human Factors in Computing Systems, CHI ’20, pages 1–13, New York, NY, USA, April 2020. Association for Computing Machinery. URL https://doi.org/10.1145/3313831.3376624.
- Zhang et al. 2020 Yunfeng Zhang, Q. Vera Liao, and Rachel K. E. Bellamy. Effect of confidence and explanation on accuracy and trust calibration in AI-assisted decision making. In FAT ’20: Proceedings of the 2020 Conference on Fairness, Accountability, and Transparency, pages 295–305. Association for Computing Machinery, January 2020. URL https://doi.org/10.1145/3351095.3372852.
- Bansal et al. 2021 Gagan Bansal, Tongshuang Wu, Joyce Zhou, Raymond Fok, Besmira Nushi, Ece Kamar, Marco Tulio Ribeiro, and Daniel Weld. Does the Whole Exceed its Parts? The Effect of AI Explanations on Complementary Team Performance. In Proceedings of the 2021 CHI Conference on Human Factors in Computing Systems, CHI ’21, pages 1–16, New York, NY, USA, May 2021. Association for Computing Machinery. URL https://doi.org/10.1145/3411764.3445717.
- DeVerna et al. 2023 Matthew R. DeVerna, Harry Yaojun Yan, Kai-Cheng Yang, and Filippo Menczer. ChatGPT Fact-checking as a Misinformation Intervention. OSF Preregistration, doi: 10.17605/OSF.IO/58RMU, March 2023. URL https://osf.io/58rmu.
- Quelle and Bovet 2023 Dorian Quelle and Alexandre Bovet. The Perils & Promises of Fact-checking with Large Language Models. arXiv, October 2023. URL https://doi.org/10.48550/arXiv.2310.13549.
- Pennycook et al. 2021a Gordon Pennycook, Ziv Epstein, Mohsen Mosleh, Antonio A. Arechar, Dean Eckles, and David G. Rand. Shifting attention to accuracy can reduce misinformation online. Nature, 592:590–595, 2021a. URL https://doi.org/10.1038/s41586-021-03344-2.
- Guay et al. 2023 Brian Guay, Adam Berinsky, Gordon Pennycook, and David Rand. How To Think About Whether Misinformation Interventions Work. Nature Human Behaviour, 2023. doi: 10.1038/s41562-023-01667-w. URL https://doi.org/10.1038/s41562-023-01667-w.
- DeVerna et al. 2022 Matthew R. DeVerna, Andrew M. Guess, Adam J. Berinsky, Joshua A. Tucker, and John T. Jost. Rumors in Retweet: Ideological Asymmetry in the Failure to Correct Misinformation. Pers Soc Psychol Bull, September 2022. URL https://doi.org/10.1177/01461672221114222.
- Mosleh et al. 2020 Mohsen Mosleh, Gordon Pennycook, and David G. Rand. Self-reported willingness to share political news articles in online surveys correlates with actual sharing on Twitter. PLoS One, 15(2):e0228882, February 2020. ISSN 1932-6203. URL https://doi.org/10.1371/journal.pone.0228882.
- Kotonya and Toni 2020 Neema Kotonya and Francesca Toni. Explainable Automated Fact-Checking: A Survey. In Proceedings of the 28th International Conference on Computational Linguistics, pages 5430–5443. International Committee on Computational Linguistics, dec 2020. doi: 10.18653/v1/2020.coling-main.474. URL https://aclanthology.org/2020.coling-main.474.
- Kalla and Broockman 2018 Joshua L. Kalla and David E. Broockman. The Minimal Persuasive Effects of Campaign Contact in General Elections: Evidence from 49 Field Experiments. American Political Science Review, 112(1):148–166, February 2018. URL https://doi.org/10.1017/S0003055417000363.
- Bai et al. 2023 (Max) Hui Bai, Jan G. Voelkel, johannes C. Eichstaedt, and Robb Willer. Artificial Intelligence Can Persuade Humans on Political Issues, February 2023. URL https://osf.io/stakv/.
- Nickerson 1998 Raymond S. Nickerson. Confirmation Bias: A Ubiquitous Phenomenon in Many Guises. Review of General Psychology, 2(2):175–220, June 1998. URL https://doi.org/10.1037/1089-2680.2.2.175.
- Acerbi et al. 2022 Alberto Acerbi, Sacha Altay, and Hugo Mercier. Research note: Fighting misinformation or fighting for information? Harvard Kennedy School Misinformation Review, January 2022. URL https//doi.org/10.37016/mr-2020-87.
- Spitale et al. 2023 Giovanni Spitale, Nikola Biller-Andorno, and Federico Germani. AI model GPT-3 (dis)informs us better than humans. Sci Adv, 9(26):eadh1850, June 2023. ISSN 2375-2548. URL https://doi.org/10.1126/sciadv.adh1850.
- Goldstein et al. 2023 Josh A. Goldstein, Girish Sastry, Micah Musser, Renee DiResta, Matthew Gentzel, and Katerina Sedova. Generative Language Models and Automated Influence Operations: Emerging Threats and Potential Mitigations, January 2023. URL http://arxiv.org/abs/2301.04246. arXiv:2301.04246.
- Brewster et al. 2023 Jack Brewster, Lorenzo Arvanitis, and McKenzie Sadeghi. Could chatgpt become a monster misinformation superspreader? NewsGuard, March 2023. URL https://www.newsguardtech.com/misinformation-monitor/jan-2023.
- Menczer et al. 2023 Filippo Menczer, David Crandall, Yong-Yeol Ahn, and Apu Kapadia. Addressing the harms of AI-generated inauthentic content. Nat Mach Intell, 5:679–680, July 2023. URL https://doi.org/10.1038/s42256-023-00690-w.
- Yang and Menczer 2023b Kai-Cheng Yang and Filippo Menczer. Anatomy of an ai-powered malicious social botnet. Preprint 2307.16336, arXiv, 2023b. URL https://doi.org/10.48550/arXiv.2307.16336.
- Solaiman et al. 2019 Irene Solaiman, Miles Brundage, Jack Clark, Amanda Askell, Ariel Herbert-Voss, Jeff Wu, Alec Radford, et al. Release strategies and the social impacts of language models. ArXiv, November 2019. URL https://doi.org/10.48550/arXiv.1908.09203.
- Karinshak et al. 2023 Elise Karinshak, Sunny Xun Liu, Joon Sung Park, and Jeffrey T. Hancock. Working With AI to Persuade: Examining a Large Language Model’s Ability to Generate Pro-Vaccination Messages. Proceedings of the ACM on Human-Computer Interaction, 7(CSCW1):1–29, 2023. URL https://doi.org/10.1145/3579592.
- U.S. Census Bureau 2020 U.S. Census Bureau. Educational Attainment in the United States: 2020, 2020. URL https://www.census.gov/data/tables/2020/demo/educational-attainment/cps-detailed-tables.html.
- Pew Research Center 2020 Pew Research Center. What the 2020 Electorate Looks Like by Party, Race and Ethnicity, Age, Education and Religion, 2020. URL https://www.pewresearch.org/short-reads/2020/10/26/what-the-2020-electorate-looks-like-by-party-race-and-ethnicity-age-education-and-religion/.
- Council 2023 Social Science Research Council. Building a better toolkit (for fighting misinformation): Large collaborative project to compare misinformation interventions, 2023. URL https://www.ssrc.org/grantees/large-collaborative-project-to-compare-misinformation-interventions/. Accessed August 2, 2023.
- Faul et al. 2007 Franz Faul, Egon Erdfelder, Achim-Gerd Lang, and Axel Buchner. G*power 3: A flexible statistical power analysis program for the social, behavioral, and biomedical sciences. Behavior Research Methods, 39(2):175–191, 2007. doi: 10.3758/BF03193146.
- Pennycook et al. 2021b Gordon Pennycook, Jabin Binnendyk, Christie Newton, and David G. Rand. A Practical Guide to Doing Behavioral Research on Fake News and Misinformation. Collabra: Psychology, 7(1), January 2021b. URL https://doi.org/10.1525/collabra.25293.
- Pennycook and Rand 2019 Gordon Pennycook and David G Rand. Lazy, not biased: Susceptibility to partisan fake news is better explained by lack of reasoning than by motivated reasoning. Cognition, 188:39–50, 2019. URL https://doi.org/10.1016/j.cognition.2018.06.011.
- Pennycook et al. 2020 Gordon Pennycook, Adam Bear, Evan T Collins, and David G Rand. The implied truth effect: Attaching warnings to a subset of fake news headlines increases perceived accuracy of headlines without warnings. Management science, 66(11):4944–4957, 2020. URL https://doi.org/10.1287/mnsc.2019.3478.
- OpenAI 2023 OpenAI. ChatGPT — Release Notes, May 2023. URL https://help.openai.com/en/articles/6825453-chatgpt-release-notes. [Online; accessed 16. May 2023].
- Sindermann et al. 2021 Cornelia Sindermann, Peng Sha, Min Zhou, Jennifer Wernicke, Helena S. Schmitt, Mei Li, Rayna Sariyska, Maria Stavrou, Benjamin Becker, and Christian Montag. Assessing the Attitude Towards Artificial Intelligence: Introduction of a Short Measure in German, Chinese, and English Language. KI - Künstliche Intelligenz, 35(1):109–118, March 2021. URL https://doi.org/10.1007/s13218-020-00689-0.
Supplementary information
Appendix 1 Supplementary methods
1.1 Sampling details
Our goal was to obtain .95 power to detect a small effect size of .1 at the standard .05 error probability with two-by-three-level between-subject manipulations ([Accuracy vs. Sharing groups] [Control, Forced, Option conditions]). Power analysis by the G*Power69 software suggested a minimum number of 44 subjects per condition (), but we aimed for a larger target sample size of (250 participants per condition) to increase the precision of our measurements.
In our final sample, females comprised 52.45% of the sample, males 47.42%, and other genders 0.13%. Age segments were 65+ (20.35%), 55-64 (16.67%), 45-54 (17.76%), 35-44 (16.73%), 25-34 (17.25%), and 18-24 (11.24%). Race percentages were: White (60.40%), Hispanic or Latino/a (17.31%), Black or African American (13.37%), Asian (5.04%), and Other (3.88%). Slightly more than half of the sample (54.46%) had less than a college education, while 45.54% had a college degree. With respect to party identification, 48.20% identified as Democrat or Democrat-leaning, 42.76% as Republican or Republican-leaning, 6.65% as Independent, and 0.26% as Other, while 1.81% reported having no preference, and 0.32% reported not knowing their affiliation.
1.2 Stimuli curation
We selected the news stories used as stimuli from a project aimed at comparing misinformation interventions 68. Specifically, 40 headlines were selected from a set of 317 political news stories using a pretest approach70, 71, 72 to balance the selected headlines in terms of perceived partisanship, impact, familiarity, sensationalism, and the likelihood of being shared and believed.
The 20 false headlines were originally selected from a third-party fact-checking website (snopes.com), ensuring their falsehood. The 20 true headlines were all accurate and selected from mainstream news outlets (e.g., New York Times, Washington Post, Fox News, and Wall Street Journal) to be roughly contemporary with the false news headlines.
The claims were presented in a digital format resembling popular social media platforms, commonly known as the “Facebook format”50.
1.3 Fact check generation
A new ChatGPT session was created on the publicly available OpenAI website (chat.openai.com), where the headline text was inserted into a prompt asking, “I saw something today that claimed HEADLINE TEXT. Do you think that this is likely to be true?” The source of an article (e.g., “nytimes.com”) was excluded. If an article’s lede sentence was shown in the stimulus image, it was also included in the prompt, separated by a colon. The prompt for each headline was provided to ChatGPT only once, and the response was saved as a screenshot. All headlines were generated on January 25, 2023, between 12:30–8:00pm Eastern Standard Time. According to the release notes73, the language model utilized by ChatGPT at that time was a version of GPT-3.5 that has since been updated and is no longer available.
1.4 Attention check
We incorporated an attention-check question that involved a headline created by the researchers stating that the color of the sky is yellow. Prior to viewing any headlines, participants were informed about this specific headline and instructed to later answer “Yes” when asked if they believed the headline or were willing to share it, depending on their respective experimental conditions. To minimize the distinction between the attention check and the regular experimental stimuli, this question was formatted in the same manner as all other headlines. This attention check headline was then presented randomly within the 40 stimuli headlines. Participants who answered this question incorrectly were excluded from the final data sample provided by Qualtrics.
Appendix 2 Covariates
2.1 Education
The participants’ level of education was assessed by asking the following question: “What is the highest level of education you have completed?” The provided options, numbered by their corresponding recoded values for our regression analyses (see Section Regression analyses for details), are listed below:
-
1.
Less than high school degree
-
2.
High school graduate (high school diploma or equivalent including GED)
-
3.
Some college but no degree
-
4.
Associate degree in college (2-year)
-
5.
Bachelor’s degree in college (4-year)
-
6.
Master’s degree
-
7.
Doctoral degree
-
8.
Professional degree (JD, MD)
2.2 Attitude towards AI
Participants’ attitudes towards artificial intelligence (ATAI) were estimated with a four-item battery that is a slightly altered version of one developed by Sindermann et al. (2021). Specifically, it included the following four items:
-
1.
I fear artificial intelligence
-
2.
I trust artificial intelligence
-
3.
Artificial intelligence will destroy humankind
-
4.
Artificial intelligence will benefit humankind
Questions were answered with a seven-point Likert scale ranging from “strongly disagree” to “strongly agree.” Items 1 and 3 were reverse coded such that higher values on all items indicated greater trust in artificial intelligence. For our regression analyses (see Section Regression analyses for details), each participant’s ATAI is calculated as the mean value of their responses to this battery.
2.3 Headline congruence
A headline is considered “congruent” with a participant’s partisan perspective if it is typically considered to be favorable towards the political party that they are affiliated with. Headlines are either pro-Democrat or pro-Republican, based on the pretest described in the main text. Thus, a congruent headline for a Democrat (Republican) would be one that is pro-Democrat (pro-Republican). Conversely, an incongruent headline for a Democrat (Republican) would be one that is pro-Republican (pro-Democrat).
We estimated participant partisanship by asking participants the following question: “Generally speaking do you think of yourself as a Republican, a Democrat, an Independent, or what?” Possible answers were “Democrat,” “Republican,” “Independent,” “No Preference,” “Don’t know,” and “Other” (with a text box to fill if this option is selected). If a participant selected “Independent” as their answer to this question they were then asked, “Do you think of yourself as closer to the Republican or Democratic Party?” Possible answers were “Republican Party,” “Democratic Party,” “Don’t know,” and “Neither.” We consider participants who answered “Democrat” for the first question or “Democratic Party” for the second question as Democrats. We consider as Republicans those who answered “Republican” for the first question or “Republican Party” for the second question. In other words, Independents who lean towards Democrats (Republicans) were recoded as Democrats (Republicans) in our analysis.
Appendix 3 Regression analyses
In this section, we aim to reproduce the results presented in the main text via regression analysis.
In our preregistered research design, we proposed an exploratory analysis employing logistic cross-classified multilevel modeling (MLM) to predict item-level response accuracy. This approach categorizes responses into two distinct groups: those considered desirable (i.e., believing or sharing true news, and not believing or sharing false news) and those deemed undesirable (believing or sharing false news, and not believing or sharing true news). However, we later noticed two problems with this approach that drove us to pursue a different exploratory analysis. First, the MLM experienced issues converging properly, raising doubts about its reliability. Second, we recognized that this methodology does not allow us to separately analyze responses to true and false news, crucial to assessing discernment. Consequently, to align with the analysis in the main text, we opted to employ linear regression with clustered standard errors, focusing on participant responses as the dependent variable. This deviation from our preregistered exploratory design brings our methodology in line with precedents set in the literature50, 70. The dependent variable in all models is the participant’s response indicating belief or willingness to share a specific headline, coded as 1 for “Yes” and 0 for “No.” Age and Education level (as described in Education) are included as covariates in all analyses.
3.1 Ineffectiveness of LLM fact checks
To examine the robustness of the finding that exposure to LLM fact checks did not significantly affect participants’ discernment, our model incorporates dummy variables for the experimental Condition and headline Veracity, as well as a variable for their interaction51, 50.
Tables S1 and S2 display the results obtained from fitting our data to this model for the belief and share groups, respectively. Of particular relevance to our primary findings, the interaction terms of interest, namely “Condition(Forced):Veracity(True)” and “Condition(Optional):Veracity(True),” are not significant predictors in either model. As shown previously51, 50, the coefficients of such interaction terms directly quantify the average change in discernment driven by each respective experimental treatment. Thus, this analysis provides further support for our result that exposure to LLM fact-checking information did not significantly impact average discernment.
| Variable | Estimate | Std. Error | value | Sig. | |
| (Intercept) | 0.563 | 0.050 | 11.229 | *** | |
| Condition(Forced) | 0.035 | 0.030 | 1.180 | 0.238 | |
| Condition(Optional) | 0.007 | 0.030 | 0.220 | 0.826 | |
| Veracity(True) | 0.393 | 0.027 | 14.774 | *** | |
| Age | -0.006 | 0.001 | -7.299 | *** | |
| Education | 0.008 | 0.006 | 1.358 | 0.175 | |
| Condition(Forced):Veracity(True) | -0.045 | 0.036 | -1.259 | 0.208 | |
| Condition(Optional):Veracity(True) | -0.003 | 0.033 | -0.083 | 0.934 | |
| Significance codes: *** , ** , * , | |||||
| Variable | Estimate | Std. Error | value | Sig. | |
| (Intercept) | 0.835 | 0.043 | 19.449 | *** | |
| Condition(Forced) | 0.049 | 0.029 | 1.706 | 0.088 | |
| Condition(Optional) | -0.006 | 0.031 | -0.195 | 0.846 | |
| Veracity(True) | 0.085 | 0.018 | 4.708 | *** | |
| Age | -0.008 | 0.001 | -10.704 | *** | |
| Education | -0.022 | 0.009 | -2.528 | 0.011 | * |
| Condition(Forced):Veracity(True) | -0.004 | 0.017 | -0.262 | 0.794 | |
| Condition(Optional):Veracity(True) | -0.007 | 0.019 | -0.351 | 0.725 | |
| Significance codes: *** 0.001, ** 0.01, * 0.05, 0.1 | |||||
3.2 Accounting for LLM accuracy
To incorporate the accuracy of the LLM fact checks, we include an interaction between experimental condition and fact-checking (FC) scenario (True/False Correct/Incorrect/Unsure). These variables capture the five scenarios found in our data. We remind the reader that no false headlines were judged to be true in our data. To match the analysis from the main text and highlight the potential effects of LLM fact-checking information, we focus on the forced and control conditions.
Tables S3 and S4 present the results of fitting our data to this model for the belief and share groups, respectively.111Note that a few standard errors cannot be computed leading to ‘NaN’ values in Tables S4, S13, and S14. This occurs only in the “False unsure” scenario, likely due to the low number of headlines (two) in that scenario. Some significant interaction terms are observed for specific FC scenarios. This tells us that the Condition FC Scenario relationship is significantly different in these scenarios relative to the “reference group” FC Scenario (False false) — not shown in the table. However, this is not the appropriate reference group: we wish to specifically test the significance of this interaction within each fact-checking scenario. To this end, we conduct post-hoc comparisons similar to those presented within the main text for each group. Utilizing the fitted models, estimated marginal mean values for the Control and Forced groups are calculated and compared in each headline scenario, adjusting values with Bonferroni’s method. The results of these post-hoc comparisons for the belief and share groups are shown in Tables S5 and S6, respectively. We observe significant mean differences for fact-checking scenarios in both groups that are consistent with those presented in the main text. However, in the share group, we also observe a significant mean difference when False headlines were correctly identified as False by the LLM, suggesting that the LLM fact-checking information is harmful in this case as well. This last result is not reported in the main text because it is inconsistent with the corresponding analysis based on mean differences calculated from the raw data, where adjusted suggests insignificant effects.
| Variable | Estimate | Std. Error | value | Sig. | |
| (Intercept) | 0.556 | 0.055 | 10.079 | *** | |
| Cond.(Forced) | 0.029 | 0.030 | 0.960 | 0.337 | |
| FC Scen.(False unsure) | 0.025 | 0.009 | 2.782 | 0.005 | ** |
| FC Scen.(True false) | 0.360 | 0.034 | 10.574 | *** | |
| FC Scen.(True true) | 0.448 | 0.026 | 17.161 | *** | |
| FC Scen.(True unsure) | 0.394 | 0.030 | 13.198 | *** | |
| Age | -0.007 | 0.001 | -7.334 | *** | |
| Education | 0.017 | 0.008 | 2.269 | 0.023 | * |
| Cond.(Forced):FC Scen.(False unsure) | 0.070 | 0.024 | 2.865 | 0.004 | ** |
| Cond.(Forced):FC Scen.(True false) | -0.149 | 0.040 | -3.749 | *** | |
| Cond.(Forced):FC Scen.(True true) | 0.020 | 0.034 | 0.572 | 0.567 | |
| Cond.(Forced):FC Scen.(True unsure) | -0.017 | 0.040 | -0.434 | 0.664 | |
| Significance codes: *** , ** , * , | |||||
| Variable | Estimate | Std. Error | value | Sig. | |
| (Intercept) | 0.858 | 0.050 | 17.262 | *** | |
| Cond.(Forced) | 0.047 | 0.029 | 1.613 | 0.107 | |
| FC Scen.(False unsure) | -0.010 | NaN | |||
| FC Scen.(True false) | 0.063 | 0.017 | 3.721 | *** | |
| FC Scen.(True true) | 0.049 | 0.033 | 1.486 | 0.137 | |
| FC Scen.(True unsure) | 0.098 | 0.020 | 4.904 | *** | |
| Age | -0.008 | 0.001 | -8.226 | *** | |
| Education | -0.037 | 0.011 | -3.481 | *** | |
| Cond.(Forced):FC Scen.(False unsure) | 0.031 | NaN | |||
| Cond.(Forced):FC Scen.(True false) | -0.032 | 0.006 | -5.068 | *** | |
| Cond.(Forced):FC Scen.(True true) | 0.044 | 0.016 | 2.717 | 0.007 | ** |
| Cond.(Forced):FC Scen.(True unsure) | -0.002 | 0.018 | -0.133 | 0.894 | |
| Significance codes: *** , ** , * , | |||||
| Headline Scenario | Control Forced | Std. Err. | df | ratio | Adj. | Sig. |
| True False | 0.120 | 0.020 | 19508 | 5.915 | 0.001 | *** |
| True Unsure | -0.012 | 0.011 | 19508 | -1.021 | 1.000 | |
| True True | -0.048 | 0.023 | 19508 | -2.063 | 1.000 | |
| False False | -0.029 | 0.010 | 19508 | -2.995 | 0.124 | |
| False Unsure | -0.098 | 0.029 | 19508 | -3.427 | 0.028 | * |
| Significance codes: *** , ** , * , | ||||||
| Bonferroni’s method comparing a family of 45 estimates | ||||||
| Headline Scenario | Control Forced | Std. Err. | df | ratio | Adj. | Sig. |
| True False | -0.015 | 0.020 | 21428 | -0.756 | 1.000 | |
| True Unsure | -0.045 | 0.011 | 21428 | -3.992 | 0.003 | ** |
| True True | -0.091 | 0.023 | 21428 | -3.922 | 0.004 | ** |
| False False | -0.047 | 0.001 | 21428 | -4.943 | 0.001 | *** |
| False Unsure | -0.078 | 0.028 | 21428 | -2.739 | 0.277 | |
| Significance codes: *** , ** , * , | ||||||
| Bonferroni’s method comparing a family of 45 estimates | ||||||
3.3 Opt in versus opt out
To provide support for our analysis related to the optional condition, we now incorporate a dummy variable that captures whether a participant in this condition chose to see LLM fact-checking information (opt in) or not (opt out).
Tables S7 and S8 present the results of fitting our data for the belief and share groups, respectively. To confirm the results presented in the main text, we utilize the models to perform the same comparisons of estimated marginal means. These post-hoc comparisons further support our findings, and are shown for the belief and share groups in Tables S9 and S10, respectively.
| Variable | Estimate | Std. Error | value | Sig. | |
| (Intercept) | 0.637 | 0.061 | 10.523 | *** | |
| Option(opt out) | -0.245 | 0.038 | -6.406 | *** | |
| Veracity(True) | 0.259 | 0.039 | 6.671 | *** | |
| Age | -0.004 | 0.001 | -3.817 | *** | |
| Education | -0.008 | 0.009 | -0.846 | 0.398 | |
| Option(opt out):Veracity(True) | 0.267 | 0.047 | 5.679 | *** | |
| Significance codes: *** , ** , * , | |||||
| Variable | Estimate | Std. Error | value | Sig. | |
| (Intercept) | 0.806 | 0.066 | 12.159 | *** | |
| Option(opt out) | -0.306 | 0.038 | -7.949 | *** | |
| Veracity(True) | 0.058 | 0.017 | 3.323 | *** | |
| Age | -0.007 | 0.001 | -5.255 | *** | |
| Education | 0.001 | 0.014 | 0.054 | 0.957 | |
| Option(opt out):Veracity(True) | 0.018 | 0.024 | 0.749 | 0.454 | |
| Significance codes: *** , ** , * , | |||||
| Veracity | Opt in Opt out | Std. Error | df | ratio | Adj. | Sig. |
| True | -0.022 | 0.013 | 10434 | -1.735 | 0.4964 | |
| False | 0.245 | 0.013 | 10434 | 19.371 | 0.001 | *** |
| Significance codes: *** , ** , * , | ||||||
| Bonferroni’s method comparing a family of 6 estimates | ||||||
| Veracity | Opt in Opt out | Std. Error | df | ratio | Adj. | Sig. |
| True | 0.287 | 0.013 | 10514 | 22.525 | *** | |
| False | 0.306 | 0.013 | 10514 | 24.095 | *** | |
| Significance codes: *** , ** , * , | ||||||
| Bonferroni’s method comparing a family of 45 estimates | ||||||
Appendix 4 Interaction analyses
In this section, we explore the potential moderation effects of two factors on our main results: attitude towards AI (ATAI) and headline congruence (see the Covariates section for details). We employ linear regression with robust standard errors clustered on participant and headline for each key finding discussed in the main text. Each analysis covered in Regression analyses is revisited to incorporate these variables and create three-way interactions. Covariates that were included in the earlier analyses (Age and Education level) are included again. The belief and sharing group data are modeled separately.
4.1 Attitude towards AI
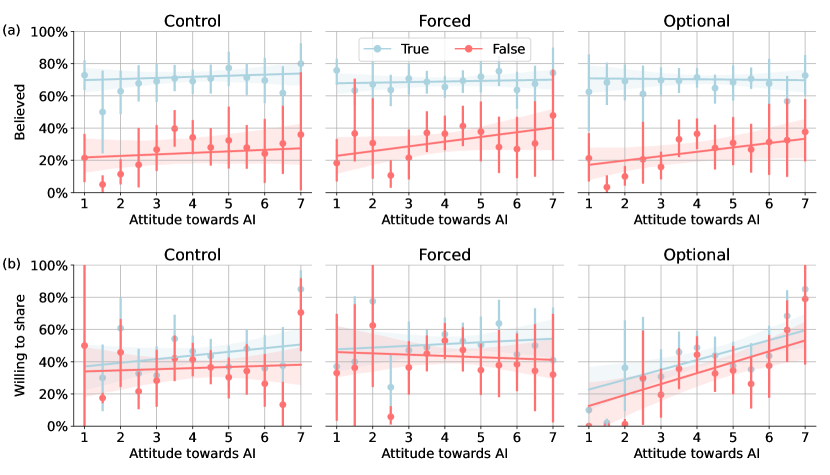
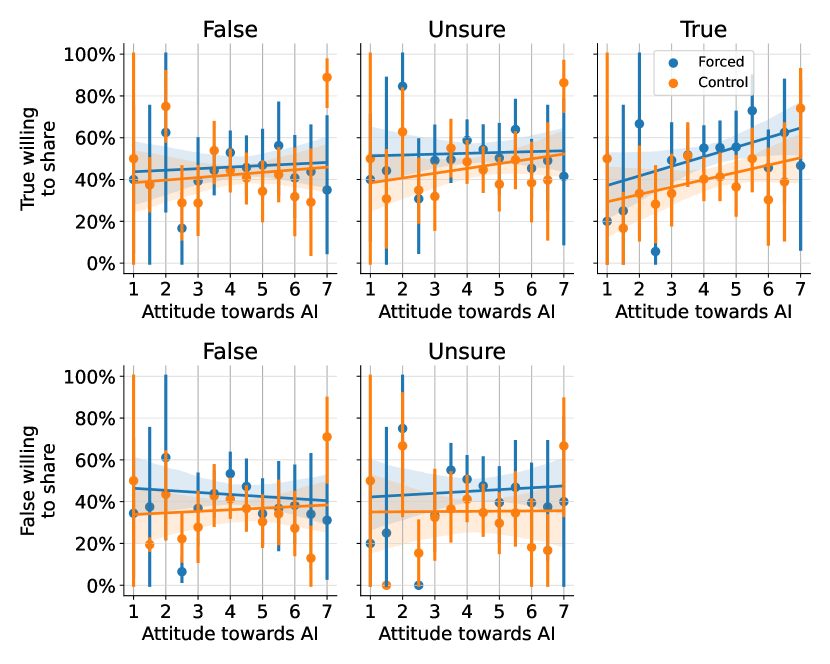
We begin by examining whether LLM fact-checking information remains ineffective amongst individuals with varying levels of ATAI. Therefore, we test the three-way interaction between Condition, Veracity, and ATAI (Condition Veracity ATAI). Figure S1 presents the relationship between participants’ ATAI and their belief in (panel a) and intent to share (panel b) true versus false headlines across all conditions. The results of our modeling analysis indicate that there is no significant three-way interaction between ATAI and either belief in (Table S11) or intent to share (Table S12) headlines for all conditions.
| Variable | Estimate | Std. Error | value | Sig. | |
| (Intercept) | 0.559 | 0.082 | 6.793 | *** | |
| Condition(Forced) | -0.012 | 0.090 | -0.136 | 0.892 | |
| Condition(Optional) | -0.052 | 0.087 | -0.596 | 0.551 | |
| Veracity(True) | 0.424 | 0.067 | 6.303 | *** | |
| ATAI | 0.001 | 0.015 | 0.089 | 0.929 | |
| Age | -0.006 | 0.001 | -7.294 | *** | |
| Education | 0.008 | 0.006 | 1.363 | 0.173 | |
| Condition(Forced):Veracity(True) | 0.027 | 0.085 | 0.314 | 0.753 | |
| Condition(Optional):Veracity(True) | 0.116 | 0.078 | 1.481 | 0.139 | |
| Condition(Forced):ATAI | 0.011 | 0.022 | 0.516 | 0.606 | |
| Condition(Optional):ATAI | 0.013 | 0.021 | 0.633 | 0.527 | |
| Veracity(True):ATAI | -0.008 | 0.015 | -0.499 | 0.618 | |
| Condition(Forced):Veracity(True):ATAI | -0.017 | 0.020 | -0.815 | 0.415 | |
| Condition(Optional):Veracity(True):ATAI | -0.026 | 0.019 | -1.408 | 0.159 | |
| Significance codes: *** , ** , * , | |||||
| Variable | Estimate | Std. Error | value | Sig. | |
|---|---|---|---|---|---|
| (Intercept) | 0.853 | 0.093 | 9.180 | *** | |
| Condition(Forced) | 0.089 | 0.119 | 0.752 | 0.452 | |
| Condition(Optional) | -0.268 | 0.118 | -2.265 | 0.023 | * |
| Veracity(True) | 0.015 | 0.055 | 0.276 | 0.782 | |
| ATAI | -0.005 | 0.018 | -0.279 | 0.781 | |
| Age | -0.008 | 0.001 | -10.190 | *** | |
| Education | -0.024 | 0.009 | -2.712 | 0.007 | ** |
| Condition(Forced):Veracity(True) | -0.017 | 0.066 | -0.261 | 0.794 | |
| Condition(Optional):Veracity(True) | 0.087 | 0.066 | 1.321 | 0.186 | |
| Condition(Forced):ATAI | -0.009 | 0.026 | -0.349 | 0.727 | |
| Condition(Optional):ATAI | 0.059 | 0.026 | 2.243 | 0.025 | * |
| Veracity(True):ATAI | 0.016 | 0.012 | 1.330 | 0.183 | |
| Condition(Forced):Veracity(True):ATAI | 0.003 | 0.016 | 0.211 | 0.833 | |
| Condition(Optional):Veracity(True):ATAI | -0.021 | 0.014 | -1.478 | 0.140 | |
| Significance codes: *** , ** , * , | |||||
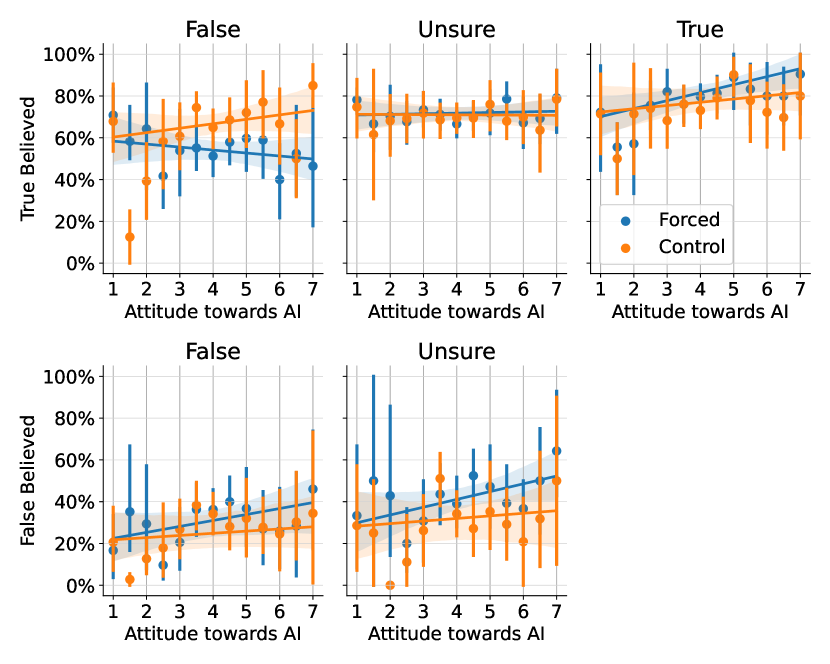
Next, we examine whether the effects of fact-checking scenarios stay consistent among people with different ATAI (the three-way interaction Condition FC Scenario ATAI). Again, we focus on the forced and control conditions and exclude data for the optional participants when fitting each model. Figure S2 illustrates the relationship between belief in headlines and ATAI for the control and forced conditions in each fact-checking scenario. The same relationship is presented with respect to sharing intent in Figure S3. The result of fitting the belief and share group models are found in Tables S13 and S14, respectively. These models are then utilized for post-hoc comparisons similar to those presented within the main text for each group. However, to test for an ATAI interaction, we now compare the slopes of the Control and Forced groups predicted response line, given different values of ATAI. These results, shown in Tables S15 and S16 for the belief and share groups, respectively, validate our results by illustrating that participants did not respond differently depending on ATAI.
| Variable | Estimate | Std. Error | value | Sig. | |
|---|---|---|---|---|---|
| (Intercept) | 0.556 | 0.087 | 6.423 | *** | |
| Cond.(Forced) | -0.012 | 0.091 | -0.135 | 0.893 | |
| FC Scen.(False unsure) | 0.041 | NaN | |||
| FC Scen.(True false) | 0.335 | 0.095 | 3.516 | *** | |
| FC Scen.(True true) | 0.436 | 0.102 | 4.298 | *** | |
| FC Scen.(True unsure) | 0.455 | 0.069 | 6.568 | *** | |
| ATAI | 1.901 | 0.015 | 0.013 | 0.990 | |
| Age | -0.007 | 0.001 | -7.277 | *** | |
| Education | 0.017 | 0.008 | 2.278 | 0.023 | * |
| Cond.(Forced):FC Scen.(False unsure) | 0.012 | 0.115 | 0.101 | 0.920 | |
| Cond.(Forced):FC Scen.(True false) | 0.054 | 0.102 | 0.535 | 0.593 | |
| Cond.(Forced):FC Scen.(True true) | 0.007 | 0.097 | 0.072 | 0.943 | |
| Cond.(Forced):FC Scen.(True unsure) | 0.024 | 0.091 | 0.268 | 0.788 | |
| Cond.(Forced):ATAI | 0.010 | 0.022 | 0.443 | 0.658 | |
| FC Scen.(False unsure):ATAI | -0.004 | NaN | |||
| FC Scen.(True false):ATAI | 0.006 | 0.018 | 0.345 | 0.730 | |
| FC Scen.(True true):ATAI | 0.003 | 0.023 | 0.119 | 0.905 | |
| FC Scen.(True unsure):ATAI | -0.015 | 0.016 | -0.942 | 0.346 | |
| Cond.(Forced):FC Scen.(False unsure):ATAI | 0.014 | 0.033 | 0.418 | 0.676 | |
| Cond.(Forced):FC Scen.(True false):ATAI | -0.048 | 0.022 | -2.210 | 0.027 | * |
| Cond.(Forced):FC Scen.(True true):ATAI | 0.003 | 0.023 | 0.130 | 0.897 | |
| Cond.(Forced):FC Scen.(True unsure):ATAI | -0.009 | 0.022 | -0.435 | 0.664 | |
| Significance codes: *** , ** , * , | |||||
| Variables | Estimate | Std. Error | value | Sig. | |
|---|---|---|---|---|---|
| (Intercept) | 0.862 | 0.096 | 8.998 | *** | |
| Cond.(Forced) | 0.103 | 0.118 | 0.875 | 0.382 | |
| FC Scen.(False unsure) | 0.019 | NaN | |||
| FC Scen.(True false) | 0.042 | 0.049 | 0.847 | 0.397 | |
| FC Scen.(True true) | -0.073 | 0.047 | -1.558 | 0.119 | |
| FC Scen.(True unsure) | 0.030 | 0.053 | 0.567 | 0.571 | |
| ATAI | -0.001 | 0.018 | -0.047 | 0.962 | |
| Age | -0.007 | 0.001 | -8.023 | *** | |
| Education | -0.037 | 0.011 | -3.496 | *** | |
| Cond.(Forced):FC Scen.(False unsure) | -0.079 | 0.052 | -1.526 | 0.127 | |
| Cond.(Forced):FC Scen.(True false) | -0.086 | 0.037 | -2.316 | 0.021 | * |
| Cond.(Forced):FC Scen.(True true) | -0.076 | 0.088 | -0.865 | 0.387 | |
| Cond.(Forced):FC Scen.(True unsure) | 0.005 | 0.067 | 0.074 | 0.941 | |
| Cond.(Forced):ATAI | -0.013 | 0.026 | -0.496 | 0.620 | |
| FC Scen.(False unsure):ATAI | -0.007 | NaN | |||
| FC Scen.(True false):ATAI | 0.005 | 0.008 | 0.576 | 0.565 | |
| FC Scen.(True true):ATAI | 0.028 | 0.013 | 2.069 | 0.039 | * |
| FC Scen.(True unsure):ATAI | 0.015 | 0.012 | 1.331 | 0.183 | |
| Cond.(Forced):FC Scen.(False unsure):ATAI | 0.025 | 0.017 | 1.482 | 0.138 | |
| Cond.(Forced):FC Scen.(True false):ATAI | 0.013 | 0.006 | 2.007 | 0.045 | * |
| Cond.(Forced):FC Scen.(True true):ATAI | 0.028 | 0.020 | 1.385 | 0.166 | |
| Cond.(Forced):FC Scen.(True unsure):ATAI | -0.001 | 0.016 | -0.088 | 0.930 | |
| Significance codes: *** , ** , * , | |||||
| Headline Scenario | Control Forced | Std. Err. | df | ratio | Adj. | Sig. |
| False false | -0.010 | 0.008 | 19498 | -1.234 | 1.000 | |
| False unsure | -0.023 | 0.023 | 19498 | -1.000 | 1.000 | |
| True false | 0.038 | 0.016 | 19498 | 2.313 | 0.934 | |
| True unsure | 0.009 | 19498 | -0.013 | 1.000 | ||
| True true | -0.013 | 0.019 | 19498 | -0.658 | 1.000 | |
| Significance codes: *** , ** , * , | ||||||
| Bonferroni’s method comparing a family of 45 estimates | ||||||
| Headline Scenario | Control Forced | Std. Err. | df | ratio | Adj. | Sig. |
| False false | 0.013 | 0.008 | 21418 | 1.537 | 1.000 | |
| False unsure | -0.012 | 0.025 | 21418 | -0.495 | 1.000 | |
| True false | 0.018 | 21418 | 0.017 | 1.000 | ||
| True unsure | 0.014 | 0.010 | 21418 | 1.449 | 1.000 | |
| True true | -0.015 | 0.021 | 21418 | -0.746 | 1.000 | |
| Significance codes: *** , ** , * , | ||||||
| Bonferroni’s method comparing a family of 45 estimates | ||||||
Next, we examine whether behavior in the optional condition depends on ATAI by introducing a three-way interaction term involving whether a participant chose to view LLM fact checks (opt in vs. opt out), headline veracity, and individual attitude towards AI (Opt-Condition Veracity ATAI). The results for the belief and share groups are presented in Tables S17 and S18, respectively. We conduct a post-hoc analysis that compares the slopes of the opt-in and opt-out conditions across varying levels of ATAI for the belief (Table S19) and sharing (Table S20) groups, respectively. Results of the post-hoc comparisons can be found in Tables S21 and S22 for the belief and sharing groups, respectively.
We observe that participants with more favorable ATAI are significantly more inclined to share news headlines after viewing LLM fact-checking information, irrespective of the veracity of the headlines (True headlines: , ; False headlines: , ). However, ATAI does not significantly influence sharing intention when participants choose to not view the LLM fact-checking information for the headlines (True headlines: , ; False headlines: , ). It is intriguing that ATAI has a significant and negative influence on belief in True headlines for participants who opt out (, ). In other words, when participants decide to not view LLM fact-checking information, they are less likely to believe True headlines if their attitudes towards AI are more positive. It would be interesting for future research to further explore the underlying psychological mechanisms that drive this complex relationship between attitudes towards AI, belief in True headlines, and the decision to engage with LLM fact-checking information.
| Variables | Estimate | Std. Error | value | Sig. | |
| (Intercept) | 0.602 | 0.122 | 4.921 | *** | |
| Option(opt out) | -0.197 | 0.120 | -1.643 | 0.100 | |
| Veracity(True) | 0.307 | 0.077 | 3.982 | *** | |
| ATAI | 0.008 | 0.023 | 0.355 | 0.723 | |
| Age | -0.004 | 0.001 | -3.900 | *** | |
| Education | -0.007 | 0.009 | -0.718 | 0.473 | |
| Option(opt out):Veracity(True) | 0.332 | 0.109 | 3.063 | 0.002 | ** |
| Option(opt out):ATAI | -0.010 | 0.026 | -0.390 | 0.697 | |
| Veracity(True):ATAI | -0.010 | 0.014 | -0.714 | 0.475 | |
| Option(opt out):Veracity(True):ATAI | -0.017 | 0.022 | -0.765 | 0.444 | |
| Significance codes: *** , ** , * , | |||||
| Variables | Estimate | Std. Error | value | Sig. | |
| (Intercept) | 0.613 | 0.143 | 4.295 | *** | |
| Option(opt out) | -0.152 | 0.142 | -1.076 | 0.282 | |
| Veracity(True) | 0.048 | 0.058 | 0.832 | 0.406 | |
| ATAI | 0.041 | 0.027 | 1.518 | 0.129 | |
| Age | -0.007 | 0.001 | -5.055 | *** | |
| Education | - | 0.014 | -0.022 | 0.982 | |
| Option(opt out):Veracity(True) | 0.052 | 0.087 | 0.591 | 0.555 | |
| Option(opt out):ATAI | -0.032 | 0.030 | -1.055 | 0.291 | |
| Veracity(True):ATAI | 0.003 | 0.013 | 0.200 | 0.842 | |
| Option(opt out):Veracity(True):ATAI | -0.008 | 0.019 | -0.430 | 0.667 | |
| Significance codes: *** , ** , * , | |||||
| Option | Veracity | Std. Err. | df | -ratio | Sig. | ||
| Opt in | False | 0.008 | 0.006 | 10430 | 1.250 | 0.211 | |
| Opt out | False | -0.002 | 0.007 | 10430 | -0.301 | 0.763 | |
| Opt in | True | -0.002 | 0.006 | 10430 | -0.358 | 0.720 | |
| Opt out | True | -0.029 | 0.007 | 10430 | -3.892 | 0.001 | *** |
| Significance codes: *** , ** , * , | |||||||
| Condition | Veracity | Std. Err. | df | -ratio | Sig. | ||
| Opt in | False | 0.041 | 0.007 | 10510 | 5.881 | 0.001 | *** |
| Opt out | False | 0.009 | 0.008 | 10510 | 1.125 | 0.260 | |
| Opt in | True | 0.043 | 0.007 | 10510 | 6.551 | 0.001 | *** |
| Opt out | True | 0.003 | 0.008 | 10510 | 0.390 | 0.700 | |
| Significance codes: *** , ** , * , | |||||||
| Veracity | Opt in Opt out | Std. Err. | df | ratio | Adj. | Sig. |
| True | 0.027 | 0.010 | 10430 | 2.807 | 0.030 | * |
| False | 0.010 | 0.009 | 10430 | 1.074 | 1.000 | |
| Significance codes: *** , ** , * , | ||||||
| Bonferroni’s method comparing a family of 6 estimates | ||||||
| Veracity | Opt in Opt out | Std. Err. | df | ratio | Adj. | Sig. |
| True | 0.040 | 0.011 | 10510 | 3.742 | 0.001 | ** |
| False | 0.032 | 0.011 | 10510 | 2.996 | 0.016 | * |
| Significance codes: *** , ** , * , | ||||||
| Bonferroni’s method comparing a family of 6 estimates | ||||||
4.2 Headline congruence
We now examine the potential moderating effects of headline congruence on participants’ belief in and intention to share them, shown in Figure S4. We model this relationship by including a three-way interaction between Condition, Veracity, and headline Congruence (Condition Veracity Congruence). The results related to belief and sharing intent can be found in Tables S23 and S24, respectively. We find no evidence of a significant three-way interaction between headline congruence in either group, suggesting that discernment is not altered by the effects of headline congruence.

| Variable | Estimate | Std. Error | value | Sig. | |
| (Intercept) | 0.600 | 0.051 | 11.724 | *** | |
| Cond.(Forced) | 0.029 | 0.031 | 0.943 | 0.346 | |
| Cond.(Optional) | - | 0.031 | -0.009 | 0.993 | |
| Veracity(True) | 0.409 | 0.031 | 13.322 | *** | |
| Congr.(Inc.) | -0.065 | 0.014 | -4.683 | *** | |
| Age | -0.006 | 0.001 | -7.444 | *** | |
| Education | 0.007 | 0.006 | 1.180 | 0.238 | |
| Cond.(Forced):Veracity(True) | -0.056 | 0.042 | -1.344 | 0.179 | |
| Cond.(Optional):Veracity(True) | -0.015 | 0.038 | -0.389 | 0.697 | |
| Cond.(Forced):Congr.(Inc.) | 0.017 | 0.010 | 1.588 | 0.112 | |
| Cond.(Optional):Congr.(Inc.) | 0.026 | 0.007 | 3.956 | *** | |
| Veracity(True):Congr.(Inc.) | -0.014 | 0.024 | -0.578 | 0.563 | |
| Cond.(For.):Veracity(True):Congr.(Inc.) | 0.018 | 0.023 | 0.769 | 0.442 | |
| Cond.(Opt.):Veracity(True):Congr.(Inc.) | 0.002 | 0.027 | 0.081 | 0.935 | |
| Significance codes: *** , ** , * , | |||||
| Variable | Estimate | Std. Error | value | Sig. | |
| (Intercept) | 0.886 | 0.046 | 19.123 | *** | |
| Cond.(Forced) | 0.023 | 0.032 | 0.740 | 0.459 | |
| Cond.(Optional) | -0.038 | 0.034 | -1.131 | 0.258 | |
| Veracity(True) | 0.102 | 0.026 | 3.912 | *** | |
| Congr.(Inc.) | -0.059 | 0.013 | -4.747 | *** | |
| Age | -0.008 | 0.001 | -10.418 | *** | |
| Education | -0.025 | 0.009 | -2.788 | 0.005 | ** |
| Cond.(Forced):Veracity(True) | -0.022 | 0.024 | -0.923 | 0.356 | |
| Cond.(Optional):Veracity(True) | -0.008 | 0.024 | -0.309 | 0.757 | |
| Cond.(Forced):Congr.(Inc.) | 0.015 | 0.016 | 0.973 | 0.331 | |
| Cond.(Optional):Congr.(Inc.) | 0.051 | 0.013 | 4.020 | *** | |
| Veracity(True):Congr.(Inc.) | -0.027 | 0.023 | -1.186 | 0.236 | |
| Cond.(Forced):Veracity(True):Congr.(Inc.) | 0.031 | 0.023 | 1.345 | 0.179 | |
| Cond.(Optional):Veracity(True):Congr.(Inc.) | -0.002 | 0.012 | -0.189 | 0.850 | |
| Significance codes: *** , ** , * , | |||||
Figure S5 illustrates the relationship between belief in headlines and their congruency across all fact-checking scenarios and experimental conditions. The same relationship is presented with respect to sharing intent in Figure S6. We model this relationship using a three-way interaction between Condition, fact-checking scenario, and headline congruence (Condition FC Scenario Congruence). Again, we focus on the forced and control conditions and exclude data for the optional participants when fitting each model. The results of fitting the belief and share group models are found in Tables S25 and S26. However, we again must utilize these models for post-hoc comparisons similar to those presented in the main text for each group. To do so, we recode congruent headlines as 0 and incongruent headlines as 1. Using this dummy coding, we then compare headline congruence fitted slopes between the Control and Forced groups. These results are shown in Tables S27 and S28 for the belief and share group, respectively, finding no evidence of significant interactions for either group in any FC scenario.
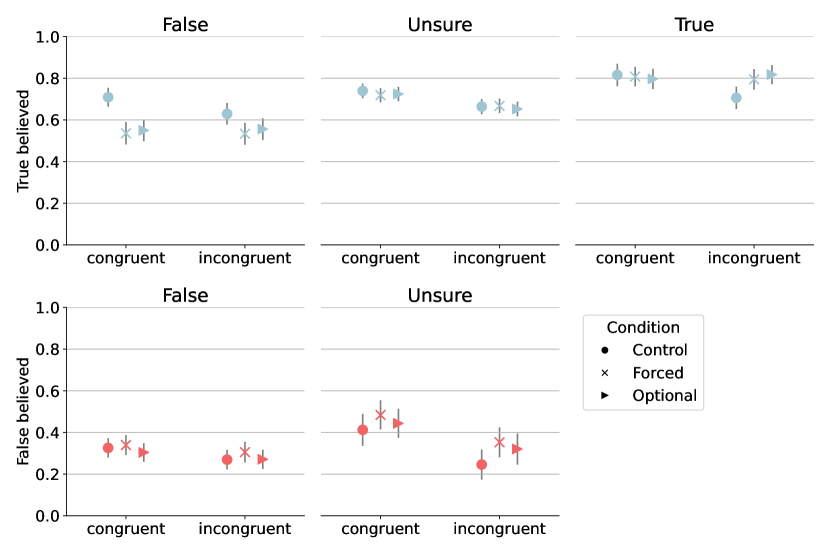
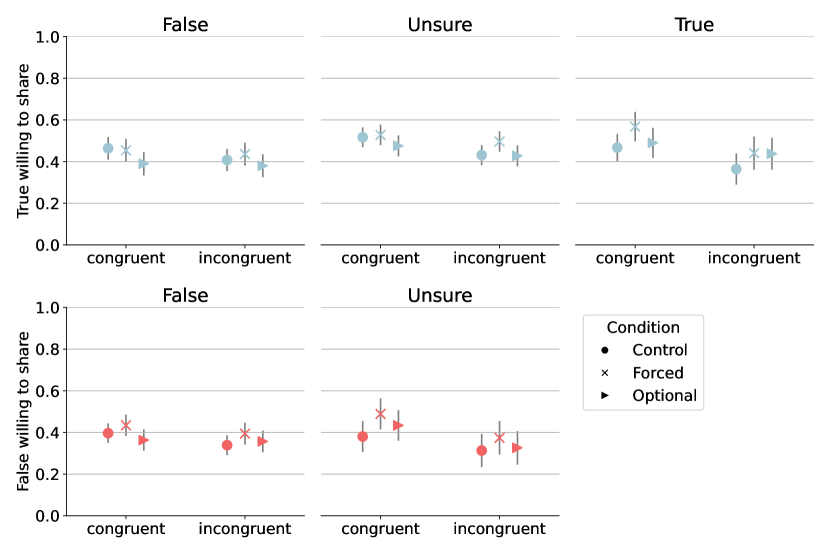
| Variable | Estimate | Std. Error | value | value | Sig. |
| (Intercept) | 0.589 | 0.057 | 10.377 | *** | |
| Cond.(Forced) | 0.022 | 0.031 | 0.719 | 0.472 | |
| FC Scen.(False unsure) | 0.081 | 0.029 | 2.792 | 0.005 | ** |
| FC Scen.(True false) | 0.383 | 0.035 | 10.847 | *** | |
| FC Scen.(True true) | 0.484 | 0.037 | 13.030 | *** | |
| FC Scen.(True unsure) | 0.412 | 0.034 | 12.013 | *** | |
| Congr.(Inc.) | -0.055 | 0.014 | -3.945 | *** | |
| Age | -0.007 | 0.001 | -7.507 | *** | |
| Education | 0.017 | 0.008 | 2.161 | 0.031 | * |
| Cond.(Forced):FC Scen.(False unsure) | 0.061 | 0.035 | 1.739 | 0.082 | |
| Cond.(Forced):FC Scen.(True false) | -0.190 | 0.052 | -3.683 | *** | |
| Cond.(Forced):FC Scen.(True true) | -0.019 | 0.039 | -0.487 | 0.626 | |
| Cond.(Forced):FC Scen.(True unsure) | -0.014 | 0.049 | -0.294 | 0.769 | |
| Cond.(Forced):Congr.(Inc.) | 0.017 | 0.013 | 1.302 | 0.193 | |
| FC Scen.(False unsure):Congr.(Inc.) | -0.102 | 0.040 | -2.537 | 0.011 | * |
| FC Scen.(True false):Congr.(Inc.) | -0.025 | 0.073 | -0.340 | 0.734 | |
| FC Scen.(True true):Congr.(Inc.) | -0.045 | 0.034 | -1.313 | 0.189 | |
| FC Scen.(True unsure):Congr.(Inc.) | -0.019 | 0.027 | -0.724 | 0.469 | |
| Cond.(Forced):FC Scen.(False unsure):Congr.(Inc.) | 0.008 | 0.045 | 0.173 | 0.862 | |
| Cond.(Forced):FC Scen.(True false):Congr.(Inc.) | 0.061 | 0.054 | 1.126 | 0.260 | |
| Cond.(Forced):FC Scen.(True true):Congr.(Inc.) | 0.069 | 0.035 | 1.962 | 0.050 | |
| Cond.(Forced):FC Scen.(True unsure):Congr.(Inc.) | -0.005 | 0.031 | -0.171 | 0.864 | |
| Significance codes: *** , ** , * , | |||||
| Variable | Estimate | Std. Error | value | Sig. | |
| (Intercept) | 0.916 | 0.054 | 17.043 | *** | |
| Cond.(Forced) | 0.015 | 0.032 | 0.478 | 0.633 | |
| FC Scen.(False unsure) | -0.036 | 0.021 | -1.693 | 0.090 | |
| FC Scen.(True false) | 0.062 | 0.040 | 1.530 | 0.126 | |
| FC Scen.(True true) | 0.051 | 0.055 | 0.919 | 0.358 | |
| FC Scen.(True unsure) | 0.122 | 0.027 | 4.468 | *** | |
| Congr.(Inc.) | -0.063 | 0.015 | -4.253 | *** | |
| Age | -0.008 | 0.001 | -7.974 | *** | |
| Education | -0.041 | 0.011 | -3.690 | *** | |
| Cond.(Forced):FC Scen.(False unsure) | 0.082 | 0.018 | 4.674 | *** | |
| Cond.(Forced):FC Scen.(True false) | -0.042 | 0.027 | -1.565 | 0.118 | |
| Cond.(Forced):FC Scen.(True true) | 0.074 | 0.046 | 1.604 | 0.109 | |
| Cond.(Forced):FC Scen.(True unsure) | -0.027 | 0.023 | -1.147 | 0.251 | |
| Cond.(Forced):Congr.(Inc.) | 0.025 | 0.018 | 1.369 | 0.171 | |
| FC Scen.(False unsure):Congr.(Inc.) | 0.029 | 0.039 | 0.739 | 0.460 | |
| FC Scen.(True false):Congr.(Inc.) | 0.007 | 0.048 | 0.140 | 0.889 | |
| FC Scen.(True true):Congr.(Inc.) | -0.006 | 0.068 | -0.093 | 0.926 | |
| FC Scen.(True unsure):Congr.(Inc.) | -0.041 | 0.027 | -1.481 | 0.139 | |
| Cond.(Forced):FC Scen.(False unsure):Congr.(Inc.) | -0.088 | 0.056 | -1.571 | 0.117 | |
| Cond.(Forced):FC Scen.(True false):Congr.(Inc.) | 0.013 | 0.038 | 0.351 | 0.726 | |
| Cond.(Forced):FC Scen.(True true):Congr.(Inc.) | 0.064 | 0.075 | -0.855 | 0.393 | |
| Cond.(Forced):FC Scen.(True unsure):Congr.(Inc.) | 0.046 | 0.026 | 1.783 | 0.075 | |
| Significance codes: *** , ** , * , | |||||
| Headline Scenario | Control Forced | Std. Error | df | ratio | Adj. | Sig. |
| False false | -0.017 | 0.019 | 18738 | -0.873 | 1.000 | |
| False unsure | -0.025 | 0.058 | 18738 | -0.425 | 1.000 | |
| True false | -0.078 | 0.041 | 18738 | -1.887 | 1.000 | |
| True true | -0.086 | 0.048 | 18738 | -1.804 | 1.000 | |
| True unsure | -0.012 | 0.023 | 18738 | -0.511 | 1.000 | |
| Significance codes: *** , ** , * , | ||||||
| Bonferroni’s method comparing a family of 45 estimates | ||||||
| Headline Scenario | Control Forced | Std. Error | df | ratio | Adj. | Sig. |
| False false | -0.025 | 0.020 | 19938 | -1.278 | 1.000 | |
| False unsure | 0.062 | 0.059 | 19938 | 1.055 | 1.000 | |
| True false | -0.038 | 0.042 | 19938 | -0.919 | 1.000 | |
| True true | 0.039 | 0.048 | 19938 | 0.815 | 1.000 | |
| True unsure | -0.071 | 0.023 | 19938 | -3.085 | 0.091 | |
| Significance codes: *** , ** , * , | ||||||
| Bonferroni’s method comparing a family of 45 estimates | ||||||
Next, we examine whether behaviors in the optional condition differ based on the congruence of headlines by introducing a three-way interaction term involving whether a participant chose to view LLM fact checks (opt in vs. opt out), headline veracity, and headline congruence (Opt-Condition Veracity Congruence). Tables S29 and S30 show the results of fitting these models for the belief and intent to share groups, respectively. We perform a post-hoc comparison of the belief (Table S31) and sharing (Table S32) group slopes, fit to the opt-in and opt-out conditions across different levels of congruence. The results of these post-hoc comparisons are shown in Tables S33 and S34, respectively.
We observe that partisan incongruency significantly and negatively influences participants’ belief in True headlines, regardless of whether they choose to view the LLM fact-checking information or not (Opt in: , ; Opt out: , ). Additionally, partisan incongruency has a negative impact on belief in False headlines when participants choose not to view the fact-checking information (, ). However, for false headlines in which participants choose to view LLM fact-checking information, the effects of partisan congruency are not significant (, ). In other words, when there is a mismatch between participants’ political affiliations and the content of the headlines, their belief in True headlines is significantly reduced, regardless of their decision to access fact-checking information. Similarly, partisan incongruency diminishes belief in False headlines when participants do not seek fact-checking information. But when participants actively choose to view LLM fact-checking information for false headlines, the influence of partisan congruency becomes statistically non-significant.
We find limited evidence for the influence of partisan congruency on participants’ sharing intention depending on their choice to view LLM fact-checking information. For False headlines, regardless of the choice to view the fact-checking information, the effects of partisan incongruency on sharing intention are non-significant (Opt in: , ; Opt out; , ). For True headlines, when participants opt in to view the information, there is a non-significant negative effect of partisan incongruency on sharing intention (, ). However, when participants choose to opt out of viewing the LLM fact-checking information, the effect of partisan incongruency on sharing intention for True headlines becomes significant (, ).
| Variable | Estimate | Std. Error | value | Sig. | |
| (Intercept) | 0.643 | 0.062 | 10.372 | *** | |
| Option(opt out) | -0.215 | 0.045 | -4.762 | *** | |
| Veracity(True) | 0.278 | 0.045 | 6.125 | *** | |
| Congr.(Inc.) | -0.002 | 0.021 | -0.085 | 0.933 | |
| Age | -0.004 | 0.001 | -3.836 | *** | |
| Education | -0.008 | 0.009 | -0.872 | 0.384 | |
| Option(opt out):Veracity(True) | 0.242 | 0.052 | 4.620 | *** | |
| Option(opt out):Congr.(Inc.) | -0.066 | 0.040 | -1.659 | 0.097 | |
| Veracity(True):Congr.(Inc.) | -0.037 | 0.031 | -1.202 | 0.229 | |
| Option(opt out):Veracity(True):Congr.(Inc.) | 0.041 | 0.050 | 0.807 | 0.420 | |
| Significance codes: *** , ** , * , | |||||
| Variable | Estimate | Std. Error | value | Sig. | |
| (Intercept) | 0.796 | 0.068 | 11.793 | *** | |
| Option(opt out) | -0.301 | 0.038 | -7.877 | *** | |
| Veracity(True) | 0.074 | 0.021 | 3.594 | *** | |
| Congr.(Inc.) | 0.015 | 0.006 | 2.485 | 0.013 | * |
| Age | -0.006 | 0.001 | -4.981 | *** | |
| Education | -0.001 | 0.014 | -0.054 | 0.957 | |
| Option(opt out):Veracity(True) | 0.027 | 0.030 | 0.895 | 0.371 | |
| Option(opt out):Congr.(Inc.) | -0.031 | 0.012 | -2.496 | 0.013 | * |
| Veracity(True):Congr.(Inc.) | -0.034 | 0.012 | -2.906 | 0.004 | ** |
| Option(opt out):Veracity(True):Congr.(Inc.) | -0.012 | 0.026 | -0.478 | 0.633 | |
| Significance codes: *** , ** , * , | |||||
| Condition | Veracity | Std. Error | df | -ratio | Sig. | ||
| Opt in | False | -0.002 | 0.018 | 9990 | -0.101 | 0.920 | |
| Opt out | False | -0.068 | 0.018 | 9990 | -3.818 | *** | |
| Opt in | True | -0.039 | 0.017 | 9990 | -2.372 | 0.018 | * |
| Opt out | True | -0.065 | 0.019 | 9990 | -3.372 | *** | |
| Significance codes: *** , ** , * , | |||||||
| Condition | Veracity | Std. Error | df | -ratio | Sig. | ||
| Opt in | False | 0.015 | 0.016 | 10150 | 0.938 | 0.348 | |
| Opt out | False | -0.016 | 0.019 | 10150 | -0.829 | 0.407 | |
| Opt in | True | -0.019 | 0.016 | 10150 | -1.183 | 0.237 | |
| Opt out | True | -0.062 | 0.020 | 10150 | -3.064 | 0.002 | ** |
| Significance codes: *** , ** , * , | |||||||
| Veracity | Opt in Opt out | Std. Error | df | ratio | Adj. | Sig. |
| True | 0.026 | 0.025 | 9990 | 1.012 | 1.000 | |
| False | 0.066 | 0.025 | 9990 | 2.642 | 0.050 | * |
| Significance codes: *** , ** , * , | ||||||
| Bonferroni’s method comparing a family of 6 estimates | ||||||
| Veracity | Opt in Opt out | Std. Error | df | ratio | Adj. | Sig. |
| True | 0.044 | 0.026 | 10150 | 1.699 | 0.536 | |
| False | 0.031 | 0.025 | 10150 | 1.239 | 1.000 | |
| Significance codes: *** , ** , * , | ||||||
| Bonferroni’s method comparing a family of 6 estimates | ||||||