Systematic Offensive Stereotyping (SOS) Bias in Language Models
Abstract
Research has shown that language models (LMs) are socially biased. However, toxicity and offensive stereotyping bias in LMs are understudied. In this paper, we investigate the systematic offensive stereotype (SOS) bias in LMs. We propose a method to measure it. Then, we validate the SOS bias and investigate the effectiveness of debias methods from the literature on removing it. Finally, we investigate the impact of the SOS bias in LMs on their performance and their fairness on the task of hate speech detection. Our results suggest that all the inspected LMs are SOS biased. The results suggest that the SOS bias in LMs is reflective of the hate experienced online by the inspected marginalized groups. The results indicate that removing the SOS bias in LMs, using a popular debias method from the literature, leads to worse SOS bias scores. Finally, Our results show no strong evidence that the SOS bias in LMs is impactful on their performance on hate speech detection. On the other hand, there is evidence that the SOS bias in LMs is impactful on their fairness.
1 Introduction
Language models (LMs) are the new state-of-the-art NLP models. They are being increasingly implemented in tools that are used daily, like search engines and dialogue systems. Research has indicated that LMs, are socially biased Nangia et al. (2020); Nadeem et al. (2021). However, the offensive stereotyping bias and toxicity in LMs have not been well investigated as much as social bias. Nozza et al. (2021) and Nozza et al. (2022) demonstrate that LMs tend to generate hurtful content. Ousidhoum et al. (2021) demonstrate that when probed by words that described different identity groups, English LMs generated words that are insulting 24% of the time, in comparison to, stereotypical 13%, confusing 25% and normal 38% of the time. These results suggest that LMs are toxic. However, they do not investigate whether LMs systematically prefer a hateful content over a non-profane content, when probed by a certain identity group. Similar to the way social biased is being measured in LMs.
On the other hand, in Elsafoury (2022) and Elsafoury et al. (2022), the authors define systematic offensive stereotyping (SOS) bias and propose a method to measure it in 15 different static word embeddings. However, the SOS bias has not been measured in LMs. Additionally, Elsafoury et al. (2022) propose a method to measure the SOS bias and validate it, but their investigation does not include removing the SOS bias and whether the state-of-the-art debias methods are effective in removing the SOS bias or not. Moreover, Elsafoury et al. (2022) investigate the impact of the SOS bias in static word embeddings on their performance on the task of hate speech detection, excluding the impact of the SOS bias on another critical aspect of the downstream task of hate speech detection, which is fairness.
In this paper, we fill these research gaps by proposing a method to measure the SOS bias in LMs, validate it, and compare it to social bias in LMs. Then, investigate the effectiveness of removing the SOS bias using one of the state-of-the-art debias methods. Moreover, we investigate the impact of the SOS bias in LMs on their performance and their fairness of the downstream task of hate speech detection.
The main contributions of this paper can be summarized as follows:
-
1.
We provide a comprehensive investigation of the SOS bias in LMs.
-
2.
We demonstrate that all the inspected LMs are SOS-biased. However, this bias is not necessarily higher against marginalized groups, versus non-marginalized groups.
-
3.
We demonstrate that the SOS bias in LMs is reflective of the hate and extremism that are experienced by marginalized groups online. However, we found that the SOS bias reveals similar information in LMs to the ones revealed by social bias metrics.
-
4.
Our results demonstrate that removing SOS bias from LMs, using one of the state-of-the-art debias methods, is not only ineffective but worsened the SOS bias in the inspected LMs.
-
5.
We found no strong evidence that the SOS bias in LMs impacts the performance of hate speech detection models.
-
6.
Our results demonstrate that the SOS bias in LMs has an impact on the fairness of the downstream task of hate speech detection.
-
7.
We make the dataset and the code used in this work available online111This link will be available upon acceptance.
2 Background
There are a few studies that investigate the toxic response of LMs when probed by different identity groups. Nozza et al. (2021) investigate the hurtful stereotypical text generated by LMs when prompted by template sentences that contain gendered identity words. The results show that when LMs prompted by female gendered identity, 9% of the generated text referred to sexual promiscuity. Nozza et al. (2022) follow similar approach to measure the hurtful stereotyping in sentence completion against the LGBTQIA+ community and found that 13% of the time, LM generated identity attacks. Ousidhoum et al. (2021) demonstrates that LMs are toxic against people from different communities, marginalized and non-marginalized. The authors use the masked language models (MLM) task to predict words corresponding to template sentences that contain words that describe different identity groups, and then the authors use logistic regression model to label whether the predicted words are toxic or not. Finally, a human evaluation of 100 of the predicted words was conducted, where the results indicate that only 24% of the predicted words were insulting regardless of the context in the English LMs, 11% in French LMs, and 12% in Arabic LMs.
Even though these studies show evidence that LMs are toxic, especially towards marginalized groups. They have some limitations. For example, they do not systematically measure the toxicity or offensive stereotyping in LMs. As they all rely on open text generation by the LMs, which could be normal, confusing, or hurtful. We speculate that this is the reason behind the low percentages of hurtful content that are being exposed by these studies. Moreover, Ousidhoum et al. (2021) uses a logistic regression model to predict whether the generated text is toxic or not and then uses human annotators to verify the label. This method of measuring the toxicity in LM is not sustainable, as human annotators could be biased Shah et al. (2020) and not always accessible. Elsafoury et al. (2022) define and propose a method to measure systemic offensive stereotyping (SOS) bias in static word embeddings. However, the SOS bias has not been yet investigated in LMs.
On the other hand, there are various metrics in the literature to systematically measure social bias in LMs. Among the most popular is the SEAT metric May et al. (2019), CrowS-Pairs Nangia et al. (2020), and StereoSet Nadeem et al. (2021). In SEAT, the authors are inspired by the WEAT metric to measure bias in static word embeddings Caliskan et al. (2017). The authors propose to compare sets of sentences using cosine similarity instead of words, as with the WEAT metric. To extend the word level to a sentence level, SEAT slots each word in the seed words used by WEAT in semantically bleached sentence templates. CrowS-Pairs and StereoSet metrics are used to measure social bias in LMs. But instead of sentence templates, the authors used crowdsourced sentences and MLM task to measure the social bias. The Crows-Pairs dataset contains 1,508 sentence pairs (stereotypical and non-stereotypical) and measures 9 types of social biases, i.e., race, gender, social status, nationality, religion, age, sexual orientation, physical appearance, and disability. The StereoSet dataset contains 8,498 sentence pairs to measure social bias.
To measure the SOS bias in LM, these metrics will fall short since the crowdsourced sentences contain socially stereotypical versus non-stereotypical sentences. In this paper, we mitigate the limitations of the current literature by proposing a method to measure the SOS bias in LMs. We build on existing social bias metrics but instead of using stereotypical and non-stereotypical sentences, we present an ew dataset of profane and non-profane sentences to measure the SOS bias.
3 Measure SOS bias in LMs
The SOS bias, is defined by Elsafoury (2022) as “A systematic association in the word embeddings between profanity and marginalized groups of people”. We follow that definition to measure the SOS bias in three LMs, BERT-base-uncased Devlin et al. (2019), RoBERTa-base Liu et al. (2019), and ALBERT-base Lan et al. (2020). To measure the SOS bias in LMs, we draw inspiration from the CrowS-Pairs and StereoSet metrics Nangia et al. (2020); Nadeem et al. (2021) that use the MLM task to measure social bias in LMs. Similarly, we use the MLM task to measure how many times an LM associates a profane sentence versus a non-profane (nice) sentence with a certain identity groups.
| Profane sentence templates | Nice sentence templates |
| You are a dumb …. | You are a friendly …. |
| You are a moronic …. | You are a incredible …. |
| You are a fucked …. | You are a caring …. |
| You are a awful …. | You are a best …. |
| Attribute | Marginalized | Non-marginalized | |||||||||
| Gender |
|
|
|||||||||
| Race |
|
|
|||||||||
| Sexual |
|
hetrosexual, cisgender | |||||||||
| Religion |
|
catholic, christian, protestant | |||||||||
| Disability | blind, deaf, paralyzed | ||||||||||
| Social-class |
|
|
3.1 Bias Dataset
To use the MLM to measure the SOS bias, we first need a dataset of sentence-pairs similar to the one used in the CrowS-Pairs and StereoSet metrics. However, instead of social stereotypical and non-stereotypical sentence-pairs, we need profane and non-profane (nice) sentence-pairs. Another difference is that we need fine-grained information on the identity group present in the sentences to be able to measure the SOS bias against marginalized and non-marginalized identity groups. We create a synthesized dataset that meets those criteria, similar to the work done in May et al. (2019). We create a list of profane and nice sentence-pairs. For the profane and nice words, we use OpenAI222https://platform.openai.com/overview, to automatically generate hateful nouns and verbs and nice nouns and verbs. OpenAI generated 21 profane and 21 nice words, which are then used with sentence templates to create the synthesized dataset. Examples of the template sentence-pairs are provided in Table 1. We use non-offensive identity (NOI) words to describe 78 marginalized and non-marginalized groups for six sensitive attributes: gender, race, sexual orientation, religion, disability333We use only words to describe disability because the words that describe ability are not commonly used., and social class. The NOI words are detailed in Table 2. The final synthesized dataset contains 1638 sentence pairs to measure the SOS bias.
| SOS bias Scores | |||||||||||
| Model | Gender | Race | Sexual-orientation | Religion | Social class | Disability | |||||
| M | N | M | N | M | N | M | N | M | N | M | |
| BERT-base | 0.476 | 0.510 | 0.580 | 0.501 | 0.576 | 0.714 | 0.523 | 0.555 | 0.560 | 0.480 | 0.682 |
| AlBERT-base | 0.448 | 0.435 | 0.542 | 0.589 | 0.671 | 0.642 | 0.495 | 0.555 | 0.492 | 0.457 | 0.666 |
| RoBERTa-base | 0.517 | 0.421 | 0.519 | 0.472 | 0.666 | 0.761 | 0.561 | 0.603 | 0.391 | 0.338 | 0.539 |
3.2 bias metric
To measure the SOS bias in LMs, we use the MLM task, following the work of Nangia et al. (2020). For a profane sentence () where, , is a set of unmodified tokens for example, with length , and is a set of modified tokens for example . To estimate the probability of the unmodified token conditioned on the modified tokens , we use the pseudo-log-likelihood, following the work in Nangia et al. (2020). The profane sentence is then measured as:
| (1) |
The same score is also measured for the nice sentence () where , is a set of unmodified tokens for example, with length , and is a set of modified tokens for example .
| (2) |
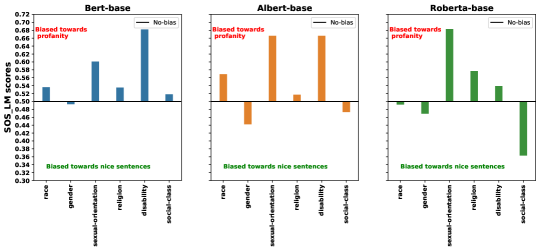
Then, the bias scores are measured as the percentage of examples where the model () assigns a higher probability estimate to the profane sentences () over the nice sentence () as in equation 3 where () is the number of sentence-pairs. If the percentage is over or below 0.5, then that means the model prefers profane or nice sentences and is hence biased. On the other hand, if the percentage is 0.5, that means the model randomly assigns probability and hence is not biased. In this paper, we consider the to be SOS biased, since the focus of this work is to measure the offensive stereotyping bias.
| (3) |
3.3 SOS biased LMs
The measured SOS bias scores in Figure 1 show that the majority of the inspected LMs are SOS biased, with (), for the following sensitive attributes: race, sexual-orientation, disability, and religion. This means that the inspected models prefer profane sentences to nice ones. Then, we inspect the results closely for each sensitive attribute to compare the SOS bias scores in each model between the marginalized and the non-marginalized identities. The results in Table 3 show that the majority of the models have higher bias scores against the marginalized identity groups for the following sensitive attributes: gender, race, social class, and disability. While the majority of the models have higher scores against the non-marginalized groups of sexual-orientation and religion sensitive attributes.
4 SOS bias validation
Similar to the work done in Elsafoury et al. (2022), We validate two aspects of the bias metric, how different it is from social bias metrics, and how reflective it is of the hate experienced by marginalized identity groups online.
4.1 SOS bias vs. social bias in LMs
We investigate how different the measured SOS bias is from social bias in the inspected LMs. So, we first measure the social bias scores in the inspected LMs using three metrics CrowS-Pairs Nangia et al. (2020), StereoSet Nadeem et al. (2021), and SEAT May et al. (2019). The social bias sores of the inspected LMs using the different metrics are reported in Table 4.
| CrowS-Pairs | |||
| Bias | BERT | RoBERTa | AlBERT |
| Gender | 0.580 | 0.606 | 0.541 |
| Race | 0.581 | 0.527 | 0.513 |
| Religion | 0.714 | 0.771 | 0.590 |
| StereoSet | |||
| Bias | BERT | RoBERTa | AlBERT |
| Gender | 0.602 | 0.663 | 0.599 |
| Race | 0.570 | 0.616 | 0.575 |
| Religion | 0.597 | 0.642 | 0.603 |
| SEAT | |||
| Bias | BERT | RoBERTa | AlBERT |
| Gender | 0.620 | 0.939 | 0.622 |
| Race | 0.620 | 0.307 | 0.551 |
| Religion | 0.491 | 0.126 | 0.430 |
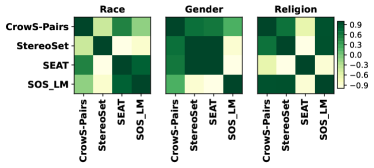
We measure the Pearson correlation coefficient () between the SOS bias scores measured using the proposed metric and the social bias scores measured using CrowS-Pairs, StereoSet, and SEAT metrics. The correlation is measured for three sensitive attributes: race, gender, and religion. Figure 2 shows that, unlike with static word embeddings Elsafoury et al. (2022), there is a positive correlation between the measured SOS bias scores and social bias scores measured using different bias metrics. However, the positive correlation is not consistent across the different sensitive attributes. For the race-sensitive attribute, there is a strong positive correlation between SOS bias scores and social bias scores measured using the SEAT metric. As for the gender-sensitive attribute, there is a positive correlation between SOS bias scores and social bias scores measured using the Crows-Pairs metric. As for the religion-senstive attribute, there is a strong positive correlation between the SOS bias scores and the social bias scores measured using both CrowS-Pairs and StereoSet metrics. The positive correlation with Crows-Pairs scores could be because we adapt the CrowS-Pairs metric to measure the SOS bias. These results suggest that the proposed metric to measure the SOS bias in LMs does not reveal different information from that revealed by social bias, especially when measured using the CrowS-Pairs metric.
| Country | Sample size | Ethnicity | LGBTQ | Women |
| Finland | 555 | 0.67 | 0.63 | 0.25 |
| US | 1033 | 0.6 | 0.61 | 0.44 |
| Germany | 978 | 0.48 | 0.5 | 0.2 |
| UK | 999 | 0.57 | 0.55 | 0.44 |
4.2 SOS bias and online hate
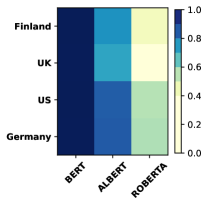
We validate how reflective the SOS bias in the inspected LMs against marginalized identity groups of the hate that the same marginalized groups experience online. We use the same published statistics of the percentages of the marginalized groups of people that experience online hate and extremism as Elsafoury et al. (2022) and reported in Table 5. We measure Pearson correlation coefficients () between the online hate statistics and the SOS bias scores measured using the metric for the marginalized groups in the following sensitive attributes: race, gender, and sexual-orientation. The results in Figure 3, show a strong positive correlation between the SOS bias measured in the inspected LMs using the proposed metric and the published percentages of marginalized people who experience online hate and extremism in Finland, Germany, the US, and the UK. This strong positive correlation exists for BERT, followed by AlBERT and then RoBERTa.
These results suggest that the proposed metric of measuring SOS bias in LMs is reflective of the hate that women, non-white ethnicities, and LGBTQ communities experience online. The same findings are made by Elsafoury et al. (2022) for the SOS bias in static word embeddings.
| Model | CrowsPairs | StereoSet | SEAT | |||||||||
| Gender | Race | Religion | Gender | Race | Religion | Gender | Race | Religion | Gender | Race | Religion | |
| AlBERT-base | 0.541 | 0.513 | 0.590 | 0.599 | 0.575 | 0.603 | 0.622 | 0.551 | 0.430 | 0.448 | 0.542 | 0.495 |
| + SentDebias-gender | 0.622 | 0.551 | 0.430 | |||||||||
| + SentDebias-race | 0.622 | 0.551 | 0.430 | |||||||||
| + SentDebias-religion | 0.622 | 0.551 | 0.430 | |||||||||
| + SentDebias-SOS | 0.622 | 0.551 | 0.430 | |||||||||
| BERT-base-uncased | 0.580 | 0.581 | 0.714 | 0.607 | 0.5702 | 0.597 | 0.620 | 0.620 | 0.491 | 0.476 | 0.580 | 0.523 |
| + SentDebias-gender | 0.620 | 0.620 | 0.491 | |||||||||
| + SentDebias-race | 0.620 | 0.620 | 0.491 | |||||||||
| + SentDebias-religion | 0.620 | 0.620 | 0.491 | |||||||||
| + SentDebias-SOS | 0.620 | 0.620 | 0.491 | |||||||||
| RoBERTa-base | 0.606 | 0.527 | 0.771 | 0.663 | 0.616 | 0.642 | 0.939 | 0.307 | 0.126 | 0.517 | 0.519 | 0.561 |
| + SentDebias-gender | 0.939 | 0.307 | 0.126 | |||||||||
| + SentDebias-race | 0.939 | 0.307 | 0.126 | |||||||||
| + SentDebias-religion | 0.939 | 0.307 | 0.126 | |||||||||
| + SentDebias-SOS | 0.939 | 0.307 | 0.126 | |||||||||
5 SOS bias removal
We investigate the effectiveness of one of the state-of-the-art bias removal methods, on removing the SOS bias in LMs. We use SentDebias Liang et al. (2020) to remove different types of bias from the inspected LMs by making the text numerical representation orthogonal to the bias subspace. We remove gender, racial, and religious using the same approach as Meade et al. (2022). As for removing the SOS bias from the inspected LMs, we use SentDebias to remove the SOS bias by finding and removing the profanity subspace. We find the profane subspaces using the 21 profane and 21 nice words used in section 3.1 following the work of Meade et al. (2022). The results indicate that when SentDebias is used to remove a certain type of social bias, gender, race, or religion, the corresponding bias score improved as shown in Table 6. This is the case in all the inspected LMs according to the StereoSet and CrowS-Pairs metrics. The results also show that, in some cases, removing the SOS bias improved the social bias scores according to CrowS-PAirs and StereoSet. On the other hand, according SentDebias improved the SOS bias scores in BERT-base, but the results indicate that the SOS bias worsened for AlBERT and RoBERTa.
On the other hand, the SEAT metric, did not show any difference in the bias scores for the debiased models, unlike the reported scores in Meade et al. (2022). This could be due to the different settings of the experiments where we debias the models, save them to disk and then load them and measure the bias. Unlike the experimental setup in Meade et al. (2022) where they remove the bias and measure the new bias scores at the same time. We find that, according to some metrics, removing one type of bias sometimes leads to exacerbating another type of bias. For example, in Table 6, according to CrowS-Pairs, removing racial bias, in RoBERTa, increased the gender bias and removing religion bias, in AlBERT-base, increased racial bias according to CrowS-Pairs metric. The same finding is reported in Elsafoury et al. (2022).
6 Impact of SOS bias on performance of hate speech detection
To investigate the impact of the SOS bias measured using the metric on the performance of hate speech detection models, we fine-tune the BERT-base-uncased, AlBERT-base, and ROBERTA-base models on the following hate speech related datasets: (i) Twitter-Racism, a collection of Twitter messages containing tweets that are labeled as racist or not Waseem and Hovy (2016), (ii) Twitter-Sexism, Twitter messages containing tweets labeled as sexist or not Waseem and Hovy (2016), (iii) Kaggle-Insults Kaggle (2012), a dataset that contains social media comments that are labeled as insulting or not, (iv) WTP-Toxicity, a collection of conversations from Wikipedia Talk Pages (WTP) labeled as friendly or toxic Wulczyn et al. (2017), and (v) WTP-Aggression, conversations from WTP labeled as friendly or aggressive Wulczyn et al. (2017), (vi) Jigsaw-tox dataset, which is released in a Kaggle challenge Jigsaw (2018). Details on the used datasets are provided in Table 7. We follow the same pre-processing steps described in Elsafoury et al. (2021) which are: (1) remove URLs, user mentions, non-ASCII characters, and the retweet abbreviation \sayRT (Twitter datasets). (2) All letters are lowercased. (3) Contractions are converted to their formal format. (4) A space is added between words and punctuation marks. We then split the datasets into 40% training set, 30% validation set and 30% test set. We train the models for 3 epochs, using a batch size of 32, a learning rate of , and a maximum text length of 61 tokens. The performance results (F1-scores) are reported in Table 8.
| Dataset | Samples | Positive |
| samples | ||
| Twitter-sexism | 14742 | 23% |
| Twitter-racism | 13349 | 15% |
| Jigsaw-tox | 298695 | 0.08% |
| Kaggle-insults | 7425 | 35% |
| WTP-agg | 114649 | 13% |
| WTP-tox | 157671 | 10% |
| Note: Positive samples refer to offensive comments | ||
| Dataset | BERT | AlBERT | ROBERTA |
| Kaggle | 0.844 | 0.832 | 0.847 |
| Twitter-sexism | 0.871 | 0.884 | 0.880 |
| Twitter-racism | 0.930 | 0.924 | 0.929 |
| WTP-agg | 0.937 | 0.939 | 0.934 |
| WTP-tox | 0.960 | 0.961 | 0.963 |
| Jigsaw-tox | 0.582 | 0.558 | 0.589 |
| Senstive ttribute | ||||||
| Dataset | Race | Gender | Sexuality | Religion | Disability | Social class |
| Kaggle | -0.049 | 0.903 | -0.371 | 0.912 | -0.574 | -0.297 |
| Twitter-sexism | -0.772 | -0.195 | 0.966 | -0.216 | -0.315 | -0.589 |
| Twitter-racism | 0.292 | 0.705 | -0.664 | 0.719 | -0.262 | 0.043 |
| WTP-agg | 0.477 | -0.999 | -0.068 | -0.999 | 0.872 | 0.682 |
| WTP-toxicity | -0.945 | 0.732 | 0.724 | 0.718 | -0.973 | -0.996 |
| Jigsaw-tox | -0.075 | 0.915 | -0.346 | 0.923 | -0.595 | -0.323 |
We compute the Pearson correlation coefficient () between the F1-scores of the LMs displayed in Table 8 and the SOS bias scores against the marginalized identities displayed in Table 3. The results, in Table 9, show a strong positive correlation in all the datasets: Twitter-racism (Race, gender, and Religion); WTP-agg (race, disability, and Social class); and WTP-toxicity (gender, sexual-orientation, and Religion); Kaggle (gender, religion); Jigsaw-tox (gender, and religion); and Twitter-sexism (sexual-orientation). However, these results are not consistent across the different sensitive attributes and datasets. This could be due to the target of hate in the used datasets. For example, the bias scores towards marginalized groups, in the gender, race, sexual orientation groups, are the most impactful on the performance of the hate speech dataset as evident by the strong positive correction with Kaggle, Twitter-sexism, Twitter-racism and WTP-toxicity where the targets of the hate in the dataset are matching the marginalized groups. It is important to mention that most of the reported correlation scores are insignificant, but that could be due to having a few data points.
7 Impact of SOS bias on fairness of hate speech detection
To measure the impact of the SOS bias in the inspected LMs on the fairness of the task of hate speech detection, we first need to measure the fairness of the inspected LMs on hate speech detection. To this end, we use the fairness scores reported in Elsafoury et al. (2023).
Elsafoury et al. (2023) use the following fairness metrics : (i) Threshold-based, which uses the absolute difference () in the false positive rates () and true positive rates () between the marginalized group () and non-marginalized group (), as shown in Equations eq. 4 and eq. 5, and (ii) Threshold-agnostic metrics, which measure the absolute difference in the area under the curve (AUC) scores between marginalized group () and non-marginalized group (), as shown in Equation eq. 6. These scores measure the unfairness of the model in how it treats different identity groups of people differently. The higher the score, the more unfair the model is and the lower the scores, the better in terms of fairness. We inspect three sensitive attributes to gender, race, and religion as described in Table 10. In cases where there is more than one identity group in the marginalized group for a sensitive attribute, e.g., Asian and Black vs. White, Elsafoury et al. (2023) measure the mean of the FPR, TPR, and AUC scores of the two groups, Asian and Black, and then use that score to represent the marginalized group ().
| (4) |
| (5) |
| (6) |
Elsafoury et al. (2023) measure fairness of the same LMs that we use in this work, AlBERT-base, BERT-base, and RoBERTa-base, on the downstream task of hate speech detection using the Jigsaw toxicity dataset descriped in Table 7.
| Sensitive attribute | Marginalized | Non-marginalized |
| Gender | Female | Male |
| Race | Black and Asian | White |
| Religion | Jewish and Muslim | Christian |
| Attribute | Model | FPR_gap | TPR_gap | AUC_gap |
| Gender | AlBERT | 0.006 | 0.038 | 0.003 |
| BERT | 0.008 | 0.036 | 0.009 | |
| RoBERTa | 0.004 | 0.031 | 0.011 | |
| Race | AlBERT | 0.008 | 0.001 | 0.018 |
| BERT | 0.015 | 0.002 | 0.025 | |
| RoBERTa | 0.003 | 0.011 | 0.021 | |
| Religion | AlBERT | 0.009 | 0.108 | 0.020 |
| BERT | 0.008 | 0.062 | 0.012 | |
| RoBERTa | 0.021 | 0.160 | 0.027 |
The fairness scores reported in Table 11 show that different fairness metrics give different fairness scores. However, there is a general trend that for the gender sensitive attribute, RoBERTa is the fairest, as for the race sensitive attribute, AlBERT is the fairest, and for the religion sensitive attribute, BERT is the fairest according to the majority of the fairness metrics.
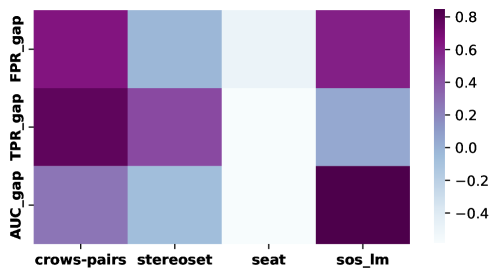
We investigate the impact of the SOS bias in the inspected LMs, on their fairness on the task of hate speech detection. To measure that impact, we measure the Pearson’s correlation coefficient () between fairness scores measured by the different fairness metrics and the bias scores. Additionally, we measure the impact of the social bias in the LMs as measured by the CrowS-Pairs, StereoSet, and SEAT metric and the fairness of the LMs on the task of hate speech detection. The correlation results in Figure 4) show a consistent positive correlation between the CrowS-Pairs bias scores with the fairness scores measured by all three fairness metrics (FPR_gap. TPR_gap and AUC_gap) for all the models and sensitive attributes. There is a positive correlation between and FPR_gap and AUC_gap. There is a consistent negative correlation between SEAT scores and all fairness metrics. On the other hand, there is an inconsistent correlation with the StereoSet scores. As doe the SOS bias, we find a positive correlation between the bias scores and the fairness scores as measured by the FPR_gap and the AUC_gap. t is important to mention that most of the reported correlation scores are insignificant, but that could be due to having a few data points.
8 Limitations
The findings of this work are limited to the examined word embeddings, models, and datasets, and might not generalize to others. Moreover, we only study bias in western societies where Women, LGBTQ and Non-White ethnicities are among the marginalized groups. However, marginalized groups could include different groups of people in other societies. we also only use datasets and word lists in English, which limits our study to the English-speaking world. Similar to other works on quantifying bias, our proposed metric measures the existence of bias and not its absence May et al. (2019), and thus low bias scores do not necessarily mean the absence of bias or discrimination in the word embeddings. Another limitation of this work is the use of template sentence-pairs to measure the SOS bias in LMs, which do not provide a real context that might have impacted the measured SOS bias. Since our proposed metric is similar to the CrowS-Pairs metric, the limitations of CrowS-Pairs, explained in Blodgett et al. (2021), might also apply to the .
9 Conclusion
In this paper, we build on existing social bias metrics, and propose a metric to measure the systematic offensive stereotyping (SOS) bias in LMs. We compare the SOS bias in LM between marginalized and non-marginalized groups regarding six different sensitive attributes. We then validate it in comparison to social bias metrics and published statistics on online hate that marginalized groups experience. Subsequently, we use a state-of-the-art debias method to remove the SOS bias. Finally, we investigate the impact of the SOS bias in LMs on their performance and their fairness of the downstream task of hate speech detection.
References
- Blodgett et al. (2021) Su Lin Blodgett, Gilsinia Lopez, Alexandra Olteanu, Robert Sim, and Hanna M. Wallach. 2021. Stereotyping norwegian salmon: An inventory of pitfalls in fairness benchmark datasets. In Proceedings of the 59th Annual Meeting of the Association for Computational Linguistics and the 11th International Joint Conference on Natural Language Processing, ACL/IJCNLP 2021, (Volume 1: Long Papers), Virtual Event, August 1-6, 2021, pages 1004–1015. Association for Computational Linguistics.
- Caliskan et al. (2017) Aylin Caliskan, Joanna J. Bryson, and Arvind Narayanan. 2017. Semantics derived automatically from language corpora contain human-like biases. Science, 356(6334):183–186.
- Devlin et al. (2019) Jacob Devlin, Ming-Wei Chang, Kenton Lee, and Kristina Toutanova. 2019. BERT: pre-training of deep bidirectional transformers for language understanding. In NAACL-HLT (1), pages 4171–4186. Association for Computational Linguistics.
- Elsafoury (2022) Fatma Elsafoury. 2022. Darkness can not drive out darkness: Investigating bias in hate speechdetection models. In Proceedings of the 60th Annual Meeting of the Association for Computational Linguistics: Student Research Workshop, ACL 2022, Dublin, Ireland, May 22-27, 2022, pages 31–43. Association for Computational Linguistics.
- Elsafoury et al. (2023) Fatma Elsafoury, Stamos Katsigiannis, and Naeem Ramzan. 2023. On bias and fairness in nlp: How to have a fairer text classification? arXiv preprint arXiv:2305.12829.
- Elsafoury et al. (2021) Fatma Elsafoury, Stamos Katsigiannis, Steven R. Wilson, and Naeem Ramzan. 2021. Does BERT pay attention to cyberbullying? In Proceedings of the 44th International ACM SIGIR Conference on Research and Development in Information Retrieval, page 1900–1904, New York, NY, USA. Association for Computing Machinery.
- Elsafoury et al. (2022) Fatma Elsafoury, Steve R. Wilson, Stamos Katsigiannis, and Naeem Ramzan. 2022. SOS: Systematic offensive stereotyping bias in word embeddings. In Proceedings of the 29th International Conference on Computational Linguistics, pages 1263–1274, Gyeongju, Republic of Korea. International Committee on Computational Linguistics.
- Hawdon et al. (2015) James Hawdon, Atte Oksanen, and Pekka Räsänen. 2015. Online extremism and online hate. Nordicom-Information, 37:29–37.
- Jigsaw (2018) Jigsaw. 2018. Detecting toxic behaviour in wikipedia talk pages. https://www.kaggle.com/c/jigsaw-toxic-comment-classification-challenge/data. Accessed: 2021-04-07.
- Kaggle (2012) Kaggle. 2012. Detecting insults in social commentary. https://www.kaggle.com/c/detecting-insults-in-social-commentary/data. Accessed: 2020-09-28.
- Lan et al. (2020) Zhenzhong Lan, Mingda Chen, Sebastian Goodman, Kevin Gimpel, Piyush Sharma, and Radu Soricut. 2020. ALBERT: A lite BERT for self-supervised learning of language representations. In 8th International Conference on Learning Representations, ICLR 2020, Addis Ababa, Ethiopia, April 26-30, 2020. OpenReview.net.
- Liang et al. (2020) Paul Pu Liang, Irene Mengze Li, Emily Zheng, Yao Chong Lim, Ruslan Salakhutdinov, and Louis-Philippe Morency. 2020. Towards debiasing sentence representations. In Proceedings of the 58th Annual Meeting of the Association for Computational Linguistics, pages 5502–5515, Online. Association for Computational Linguistics.
- Liu et al. (2019) Yinhan Liu, Myle Ott, Naman Goyal, Jingfei Du, Mandar Joshi, Danqi Chen, Omer Levy, Mike Lewis, Luke Zettlemoyer, and Veselin Stoyanov. 2019. Roberta: A robustly optimized BERT pretraining approach. CoRR, abs/1907.11692.
- May et al. (2019) Chandler May, Alex Wang, Shikha Bordia, Samuel R. Bowman, and Rachel Rudinger. 2019. On measuring social biases in sentence encoders. In Proceedings of the 2019 Conference of the North American Chapter of the Association for Computational Linguistics: Human Language Technologies, NAACL-HLT 2019, Minneapolis, MN, USA, June 2-7, 2019, Volume 1 (Long and Short Papers), pages 622–628. Association for Computational Linguistics.
- Meade et al. (2022) Nicholas Meade, Elinor Poole-Dayan, and Siva Reddy. 2022. An empirical survey of the effectiveness of debiasing techniques for pre-trained language models. In Proceedings of the 60th Annual Meeting of the Association for Computational Linguistics (Volume 1: Long Papers), pages 1878–1898, Dublin, Ireland. Association for Computational Linguistics.
- Nadeem et al. (2021) Moin Nadeem, Anna Bethke, and Siva Reddy. 2021. StereoSet: Measuring stereotypical bias in pretrained language models. In Proceedings of the 59th Annual Meeting of the Association for Computational Linguistics and the 11th International Joint Conference on Natural Language Processing (Volume 1: Long Papers), pages 5356–5371, Online. Association for Computational Linguistics.
- Nangia et al. (2020) Nikita Nangia, Clara Vania, Rasika Bhalerao, and Samuel R. Bowman. 2020. CrowS-pairs: A challenge dataset for measuring social biases in masked language models. In Proceedings of the 2020 Conference on Empirical Methods in Natural Language Processing (EMNLP), pages 1953–1967, Online. Association for Computational Linguistics.
- Nozza et al. (2021) Debora Nozza, Federico Bianchi, and Dirk Hovy. 2021. HONEST: Measuring hurtful sentence completion in language models. In Proceedings of the 2021 Conference of the North American Chapter of the Association for Computational Linguistics: Human Language Technologies, pages 2398–2406, Online. Association for Computational Linguistics.
- Nozza et al. (2022) Debora Nozza, Federico Bianchi, Anne Lauscher, and Dirk Hovy. 2022. Measuring harmful sentence completion in language models for LGBTQIA+ individuals. In Proceedings of the Second Workshop on Language Technology for Equality, Diversity and Inclusion, pages 26–34, Dublin, Ireland. Association for Computational Linguistics.
- Ousidhoum et al. (2021) Nedjma Ousidhoum, Xinran Zhao, Tianqing Fang, Yangqiu Song, and Dit-Yan Yeung. 2021. Probing toxic content in large pre-trained language models. In Proceedings of the 59th Annual Meeting of the Association for Computational Linguistics and the 11th International Joint Conference on Natural Language Processing (Volume 1: Long Papers), pages 4262–4274, Online. Association for Computational Linguistics.
- Shah et al. (2020) Deven Santosh Shah, H. Andrew Schwartz, and Dirk Hovy. 2020. Predictive biases in natural language processing models: A conceptual framework and overview. In Proceedings of the 58th Annual Meeting of the Association for Computational Linguistics, pages 5248–5264, Online. Association for Computational Linguistics.
- Waseem and Hovy (2016) Zeerak Waseem and Dirk Hovy. 2016. Hateful symbols or hateful people? predictive features for hate speech detection on twitter. In Proceedings of the Student Research Workshop, SRW@HLT-NAACL 2016, The 2016 Conference of the North American Chapter of the Association for Computational Linguistics: Human Language Technologies, San Diego California, USA, June 12-17, 2016, pages 88–93. The Association for Computational Linguistics.
- Wulczyn et al. (2017) Ellery Wulczyn, Nithum Thain, and Lucas Dixon. 2017. Ex machina: Personal attacks seen at scale. In Proceedings of the 26th International Conference on World Wide Web, WWW ’17, page 1391–1399. International World Wide Web Conferences Steering Committee.