11email: jzhang@iac.es 22institutetext: Departamento de Astrofísica, Universidad de La Laguna (ULL), E-38206 La Laguna, Tenerife, Spain
Optical Properties of Metal-poor T Dwarf Candidates
Abstract
Context. Metal-poor brown dwarfs are poorly understood because they are extremely faint and rare. Only a few candidates have been identified as T-type subdwarfs in infrared surveys and their optical properties remain unconstrained.
Aims. We aim to improve the knowledge of the optical properties of T subdwarf candidates to break the degeneracy between metallicity and temperature and to investigate their atmospheric properties.
Methods. Deep -band images of 10 known T subdwarf candidates were collected with the 10.4-m Gran Telescopio Canarias. Low-resolution optical spectra for two of them were obtained with the same telescope. Photometric measurements of the -band flux were performed for all the targets and they were combined with infrared photometry in , , , and -bands from the literature to obtain the colours. The spectra were compared with solar-metallicity T dwarf templates and with laboratory spectra.
Results. We found that the targets segregate into three distinct groups in the vs. colour-colour diagram. Group I objects are mixed with solar-metallicity T dwarfs. Group III objects have colours similar to T dwarfs but very red colours. Group II objects lie between Group I and III. The two targets for which we obtained spectra are located in Group I and their spectroscopic properties resemble normal T dwarfs but with water features that are deeper and have a shape akin to pure water.
Conclusions. We conclude that the vs. colour-colour diagram is excellent to break the metallicity-temperature degeneracy for objects cooler than L-type. A revision of the spectral classification of T subdwarf might be needed in the future, according to the photometric and spectroscopic properties of WISE1810 and WISE0414 in Group III discussed in this work.
| Full name | , (deg) | MJD | (mas/yr) | Spectral Type |
|---|---|---|---|---|
| (1)WISEA J000430.66260402.3 | (11)1.12785926.067652 | (11)57234.57 | (11)+14, 2444 | T,(11)T |
| (2)WISEA J001354.40+063448.1 | (7)3.476628+6.580049 | (7)55373.51 | +1170, 540 | T |
| (1)WISEA J030119.39231921.1 | (11)45.33122123.322665 | (11)57262.58 | (11)+2343, 1194 | T |
| (3)WISEA J042236.95044203.5 | 65.6567124.702669 | 58467.54 | +1150, 695 | T |
| (2)WISEA J083337.81005213.8 | (12)128.408480+0.869044 | (12)56658.5 | (12)+7903, 15913 | T |
| (4,10)ULAS J092605.47083516.9 | (8)141.522819+8.588039 | (8)54120.72 | 472, 438 | T |
| (5)ULAS J131610.28075553.0 | 199.042845+7.931394 | (8)53885.71 | 1012, +103 | T |
| (4,10)ULAS J131943.77+120900.2 | 199.932377+12.150072 | (8)54206.05 | 525,+111 | T |
| (3)WISEA J155349.96693355.2 | 238.445876+69.567907 | 58358.98 | 1684, +1348 | (3)T, (6)T4.0 |
| (6)CWISE J221706.28145437.6 | (9)334.27619114.910465 | (9)57591.34 | +1637, 919 | T |
(1) Greco et al. (2019); (2) Pinfield et al. (2014); (3) Meisner et al. (2020); (4) Murray et al. (2011); (5) Burningham et al. (2014); (6) Meisner et al. (2021); (7) WISE All-Sky data Release Cutri et al. (2012); (8) UKIDSS LAS DR9 Lawrence et al. (2007a); (9) CatWISE2020 Marocco et al. (2021); (10) Burningham et al. (2010); (11) Best et al. (2020); (12) Kirkpatrick et al. (2019).
1 Introduction
Brown dwarfs (BDs) are substellar objects that have insufficient mass to maintain stable hydrogen thermonuclear burning (Kumar, 1963; Burrows & Liebert, 1993; Baraffe et al., 1995). Since the discovery of the first BD, Teide 1 in the Pleiades (Rebolo et al., 1995), and the first BD companion, Gliese 229 B (Nakajima et al., 1995), thousands of BDs have been identified. Characterizing BDs of different ages, temperatures, masses and metallicities is critical for tracing substellar evolution paths and building ultracool atmospheric models. BDs are extremely faint because of their low surface temperatures and small radii. Large-scale deep optical and near-infrared (NIR) sky surveys, such as 2MASS, the Two Micron All Sky Survey (Cutri et al., 2003; Skrutskie et al., 2006); SDSS, the Sloan Digital Sky Survey (York et al., 2000); UKIDSS, the United Kingdom Infrared Telescope Infrared Deep Sky Survey (Lawrence et al., 2007b); WISE, the Wide-field Infrared Survey Explorer (Wright et al., 2010); and DES, Dark Energy Survey (Abbott et al., 2018; Morganson et al., 2018; Flaugher et al., 2015), have been used to search for brown dwarfs.
Brown dwarfs are classified into different spectral types based on their spectral features. After the spectral type M, new type sequences L, T, and Y have successively been established over the last three decades. The effective temperature drops from 2400 K for the earliest L-type to less than 300 K for the latest Y-type. Kirkpatrick et al. (1999) and Martín et al. (1999) defined the L-type spectral class by noting the strengthening of alkali metal lines, the fading of oxide bands and the enhancement of hydride and water bands with respect to M dwarfs. Burgasser et al. (2002) and Geballe et al. (2002) independently made robust T-type classifications based on strong methane bands in NIR spectra. Both L- and T-type have been divided into into sub-classes from 0.0 (‘early type’) to 9.5 (‘late type’). Note that late-M and early-L dwarfs are mixtures of young massive BDs and old very low-mass dwarf stars (Dupuy & Liu, 2017; Zhang, 2019). Delorme et al. (2008), Cushing et al. (2011a), and Kirkpatrick et al. (2011) found the first examples of Y dwarfs and proposed that ammonia absorption in the -band could be a characteristic of this class, which is cooler than T. So far, only tens of Y dwarfs have been discovered and this class extends only to the Y2 subclass.
Metal-poor dwarfs are also called subdwarfs. Their chemical composition remains pristine except for the fusion of some light elements such as deuterium (Chabrier et al., 2000) and lithium for the most massive ones close to the substellar limit (Rebolo et al., 1992; Basri et al., 1996). They have been continuously fading and cooling down for billions of years with increasingly degenerate cores and no significant thermonuclear reactions. Thousands of M subdwarfs (Zhang et al., 2019) and dozens of L subdwarfs (Zhang et al., 2018) have been identified, but only a handful of T subdwarf candidates have been announced.
The optical properties of T subdwarf candidates have not been explored yet and may be crucial for breaking the metallicity and temperature degeneracy, as has been done for M and L subdwarfs (Zhang et al., 2017; Lodieu et al., 2019).
In this paper, we present observations of 10 metal-poor T subdwarf candidates that allow us to obtain photometry in the -band for all of them and optical spectroscopy for two of them. Section 2 describes the observation protocols and data reduction processes. Sections 3, 4 and 5 show the results of astrometry, photometry, and spectroscopy, as well as our analysis. Section 6 describes a new potential metallicity indicator the colour, and discusses possible changes required to the current T subdwarf classification. The last section 7 provides a summary and discussion of the impact of this research and future applications.
| Name | Observation MJD | Instrument | Total exp. (s) | Std. star |
| W0004 | 59810.14, 59811.21 | OSIRIS Long Slit R500R | 7200 | Ross 640 |
| W0301 | 59844.13, 59871.11 | OSIRIS Long Slit R500R | 7200 | Feige 110 |
| W0004 | 59811.16 | OSIRIS -band acquisition | 90 | |
| W0013 | 59810.19 | OSIRIS -band | 2500 | |
| W0301 | 59844.13 | OSIRIS -band acquisition | 90 | |
| W0422 | 59844.18 | OSIRIS -band | 2000 | |
| W0833 | 59971.50 | OSIRIS -band | 2100 | |
| U0926 | 59971.54 | OSIRIS -band | 2350 | |
| U1316 | 59725.91 | OSIRIS -band | 2150 | |
| U1319 | 59725.94 | OSIRIS -band | 2000 | |
| W1553 | 59725.02 | OSIRIS -band | 1700 | |
| W2217 | 59826.03 | OSIRIS -band | 2000 |
2 Observations
Our sample consists of 10 T subdwarf candidates from the literature that are observable from the Roque de los Muchachos Observatory on the island of La Palma (Spain). Burningham et al. (2010, 2014) discovered ULAS0926, ULAS1316 and ULAS1319 from the Large Area Survey (LAS) of UKIDSS based on their blue NIR colours. Their ultracool subdwarf status was confirmed by NIR spectroscopy. Pinfield et al. (2014) discovered the two late-T subdwarf candidates WISE0013 and WISE0833 from -only detection in WISE and classified them based on their halo kinematics, metal-poor NIR colours and NIR spectroscopy. Greco et al. (2019) identified WISE0004 and WISE0301 from the NEOWISE proper motion survey and classified them as T subdwarfs after NIR spectroscopic follow-up. Meisner et al. (2020, 2021) identified WISE0422, WISE1553 and WISE2217 from the Backyard Worlds: Planet 9 Citizen Science Project, which visually selects the candidates with high proper motions. Target information is listed in Table 1.
2.1 Observation details
We collected -band photometry of these candidates using the imaging mode of Optical System for Imaging and low-Intermediate-Resolution Integrated Spectroscopy (OSIRIS Cepa et al. 2000) on the 10.4 m Gran Telescopio Canarias (GTC) on La Palma. We requested four-point dithering pattern with ten 50 s exposures at each point. Our weather constraints were seeing less than 0.9”, grey nights and clear sky. In practice, the support astronomer adapted the numbers of exposures for some of the objects to the observing conditions, resulting in slightly different total integration times, see Table 2.
We also made spectroscopic observations using the OSIRIS long slit mode of the two brightest targets, WISE0004 and WISE0301, under the same weather constraints as for the imaging mode. Before the spectroscopic exposures we took three 30 s acquisition images with -band filter and made use of them for the -band photometry. We used the R500R grism and 1.0” slit, resulting in a resolving power . We selected parallactic angle to prevent flux lost due to atmospheric refraction. We created two observing blocks for two nights, each with two spectra of 1800 s shifted along the slit by 10′′, and for each observing block we observed a spectroscopic standard star using the same grism and slit width with and without the -band filter. Zapatero Osorio et al. (2018) first introduced this method of using the -filtered standard spectrum to eliminate the second-order contamination (approximately from Å to Å) from the blue light (from Å to Å), which is a problem for all the OSIRIS red grisms. Our targets have negligible flux in the blue part so there is no second-order contamination.
We note that ULAS0926 and WISE0833 were observed after the CCD replacement of OSIRIS on 2022 December 12. The main differences is that the new camera, called OSIRIS, has one monolithic CCD instead of two, and that it improves the sensitivity specially in the blue wavelength range ( Å). A summary of all observations is provided in Table 2.
2.2 Data reduction
We reduced the OSIRIS -band imaging data using IRAF (Tody, 1986). First, the sky frame of each position in the four-point dithering pattern was created by median-scaling and median-combining all the images at the other three positions, but two thirds of the highest pixels were rejected, as we regarded the lowest to represent the optimal sky value. The corresponding sky frame was then subtracted from all the images with respect to each position. Finally all the sky-subtracted images were aligned and average-combined, but two highest and two lowest pixels were rejected.
We reduced the OSIRIS spectroscopic data with PypeIt (Prochaska et al., 2020, 2020). PypeIt can generate calibration frames, subtract the sky, extract the object spectra, do the wavelength calibration, generate the sensitivity function and use it to do the flux calibration, coadd the spectra and finally perform the telluric correction. We tuned PypeIt to find the object in the y-pixel region between 1200 to 1600, because our objects are red and have very little flux below 8000 Å.
The sensitivity function for instrumental response correction was generated from the standard star spectrum. We spliced the part before Å of non--filtered standard spectrum and the part after Å of the -filtered standard spectrum to obtain the standard spectrum covering the whole wavelength range without second-order contamination; the method is explained in Section 2.1.
We fit a low-order polynomial to the observed spectrum. The Å to Å water absorption wavelength region of the spectra was masked in the fit. Then the pipeline used the Maunakea telluric grids to correct the spectra from the telluric contribution.
3 Astrometry
3.1 Object recognition
We created the world coordinate system (WCS) for the OSIRIS images using Astrometry.net (Lang et al., 2010), which extracts stars and solves the WCS by matching subsets of four stars to the pre-computed 4200 series index based on the 2MASS catalogue. We requested Astrometry.net to match only the field around the telescope’s pointing position within one degree.
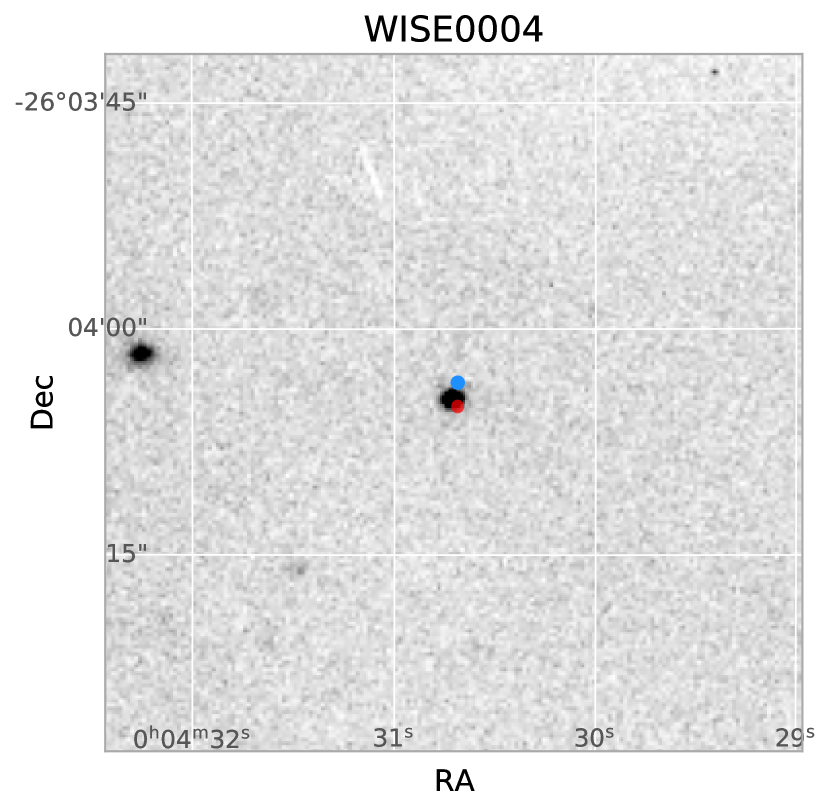
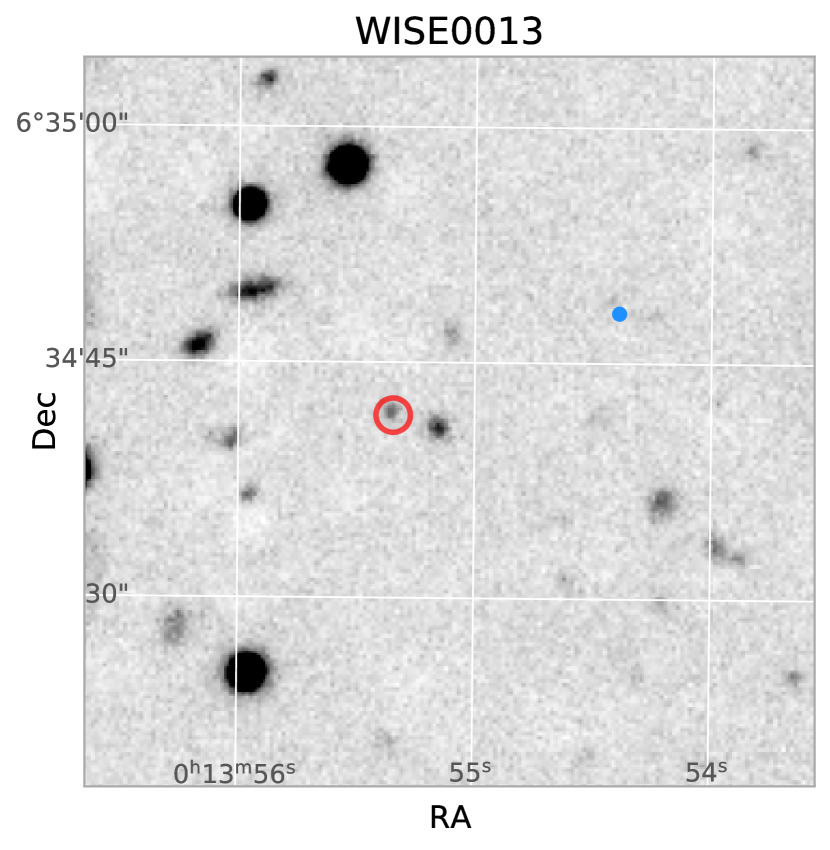
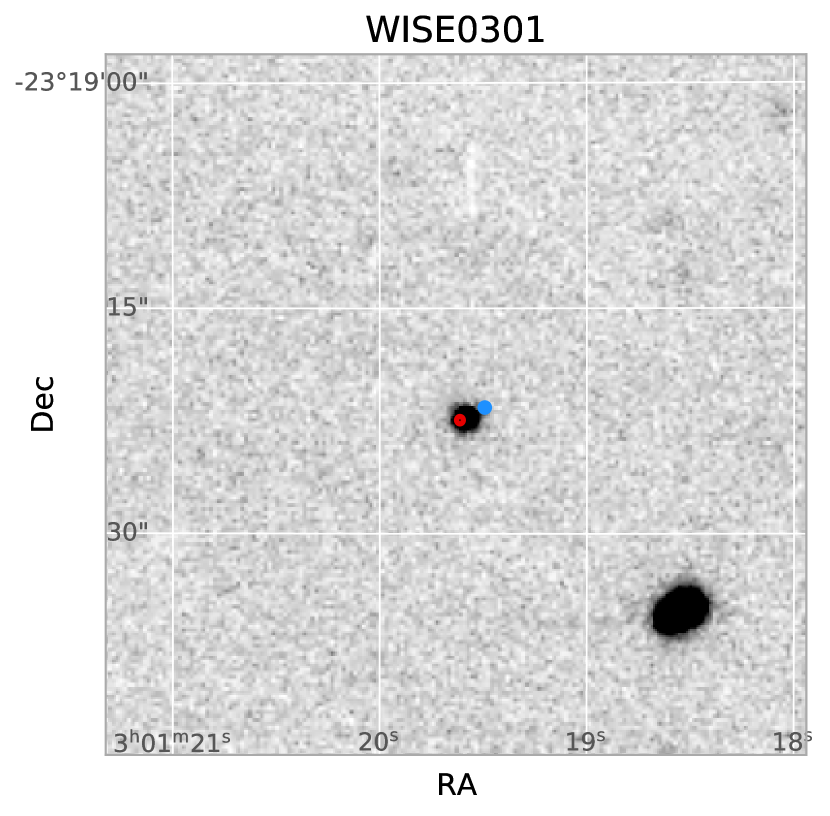
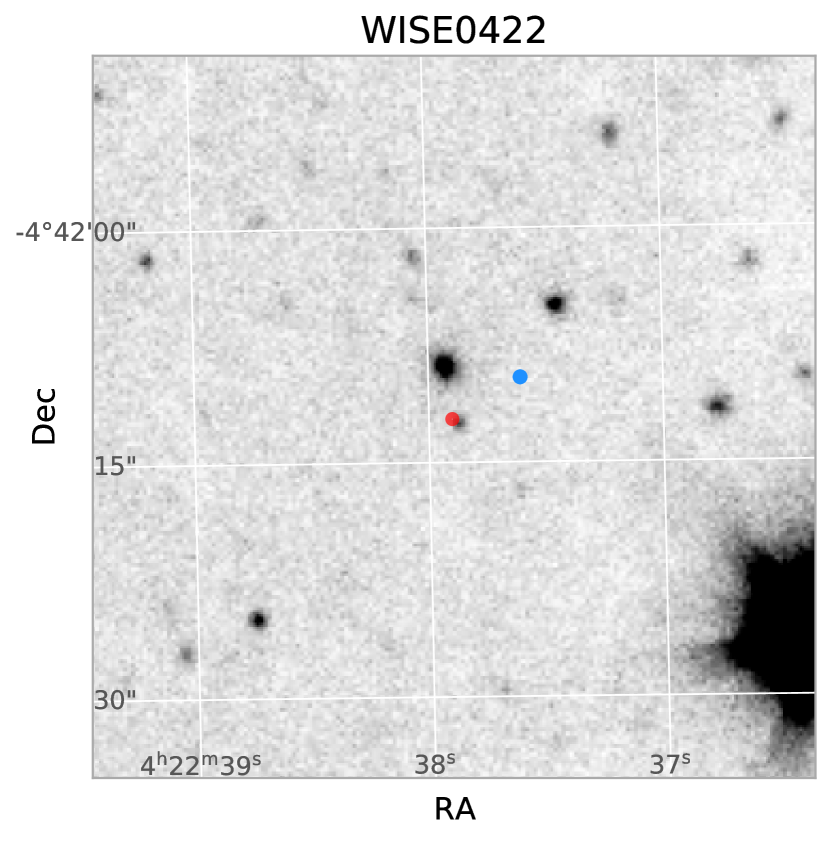
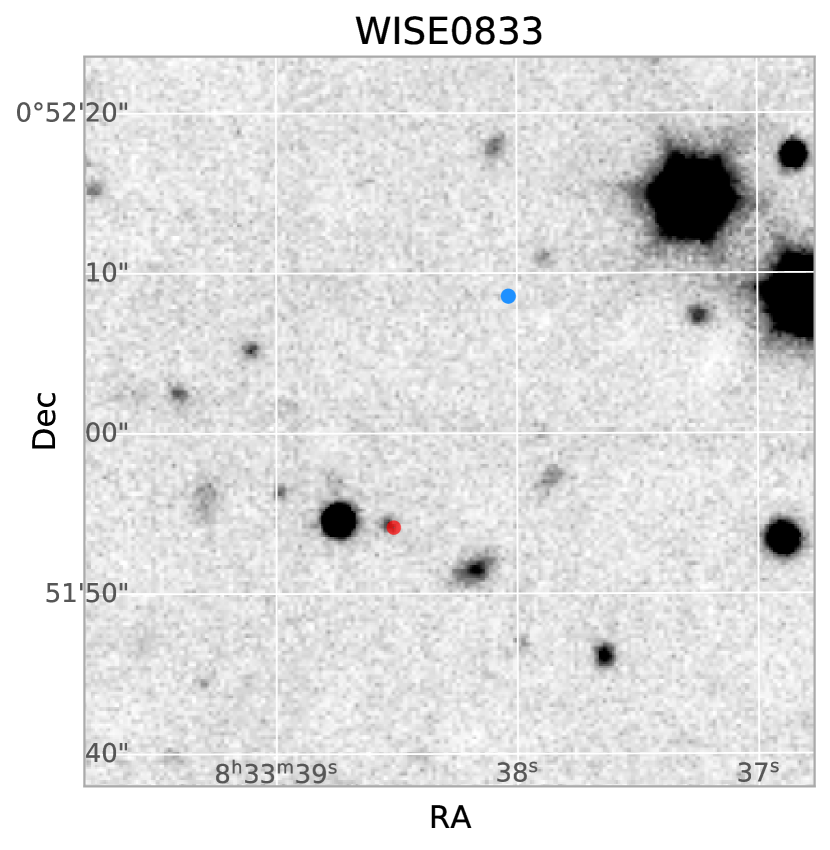
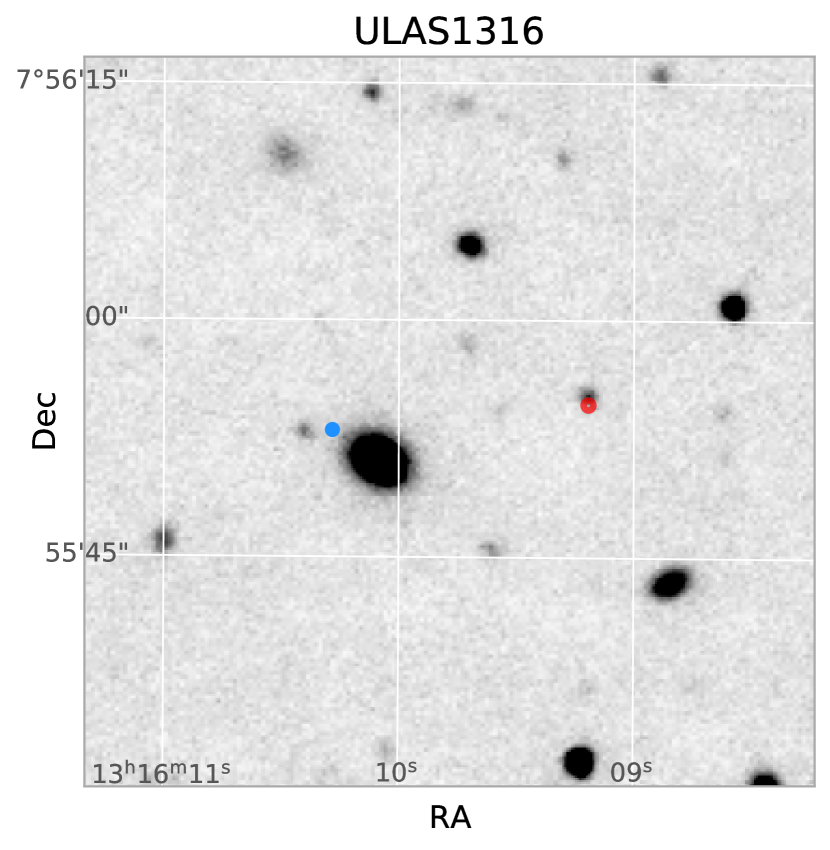
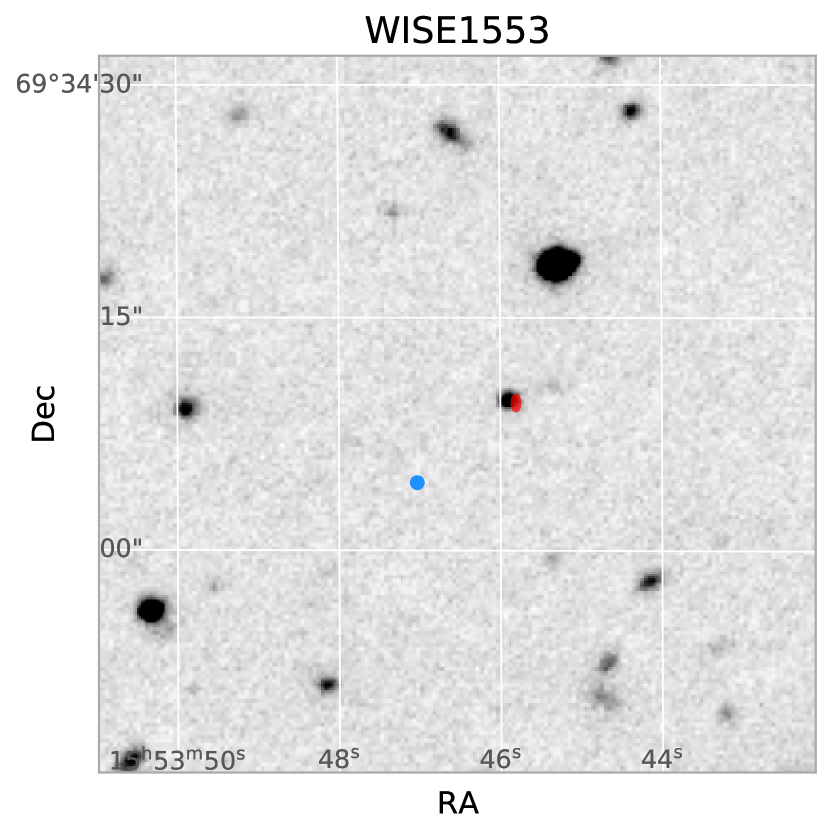
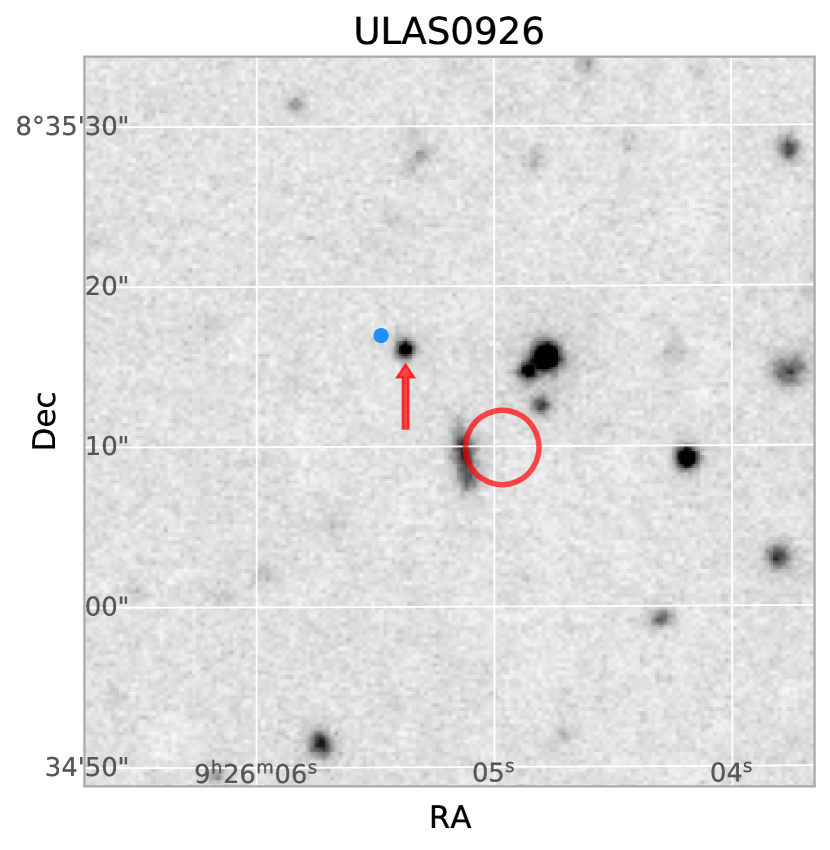
2000-second exposure of GTC ORISIS -band goes deep down to 24.5 mag (3-, 1.0” seeing and dark condition), such that there are no counterpart -band images with a similar depth requiring us to exclude the contamination and identify the objects. Therefore, to avoid false recognition we projected the expected position region of the objects in the OSIRIS images based on their proper motions and their associated errors, the positions and the epoch of the corresponding position, and the time differences between the previous epoch and the epoch our OSIRIS observation. Table 1 lists the proper motions from the literature. We drew a circle with a radius equal to the error centred on the projected position for each target.
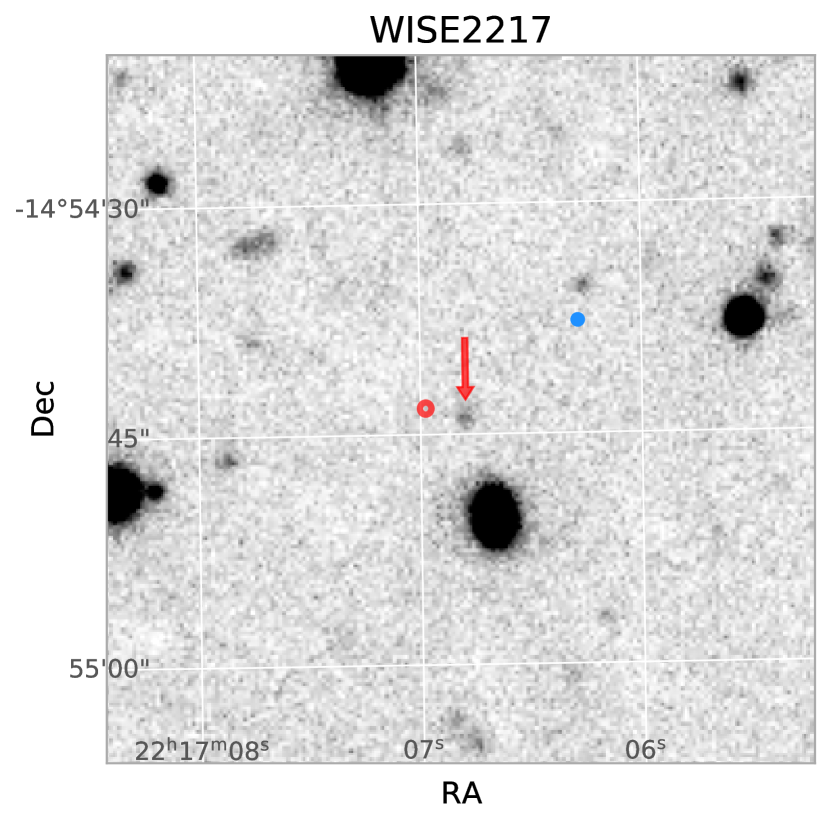
We detected beyond doubt WISE0004, WISE0013, WISE0301, WISE0422, WISE0833, and ULAS1316 at their projected positions. However, there are no detections at the projected positions of ULAS0926, ULAS1319 and WISE2217. For ULAS0926 and ULAS1319, the proper motions given by Burningham et al. (2010) are over-estimated because the epoch differences are too short; and for WISE2217, the projection was slightly displaced from the object. The objects are indicated by the red arrows, see the bottom three cutouts in Figure 6.
3.2 Proper motion revision
For the latter three objects, we used the pixel positions with the centroid errors given by the IRAF task imcentroid and the WCS from Astrometry.net to get their coordinates in our observations. To be sure about the astrometric accuracy, we calculated the rms of the fit of the coordinate transformation using the index pixel positions and field pixel positions in X and Y in corr.fits files generated by Astrometry.net. The rms is the standard deviation of the mean of the pixel deviation of the matched reference stars (matchweight ). For the three objects the rms are at sub-pixel level. We derived proper motions using two epochs: the first epoch in Table 1 and the second epoch of our observations. Murray et al. (2011) gave the first epoch position errors of ULAS0926 and ULAS1319; and CatWISE provided those for WISE2217. The results are given in Table 3.
ULAS0926 at MJD 59971.54
, (deg)
141.522478+8.587854
rmsX,Y (pix)
0.313, 0.187
errX,Y (pix)
0.061, 0.063
scale (mas/pix)
254.92 (OSIRIS+)
(mas/yr)
,
ULAS1319 at MJD 59725.91
, (deg)
199.932017+12.150141
rmsX,Y (pix)
0.619, 0.332
errX,Y (pix)
0.053, 0.065
scale (mas/pix)
258.30
(mas/yr)
,
WISE2217 at MJD 59826.03
, (deg)
334.27840214.912140
rmsX,Y (pix)
0.375, 0.396
errX,Y (pix)
0.126, 0.152
scale (mas/pix)
259.25
(mas/yr)
,
4 Photometry
We performed aperture photometry on the reduced images of those objects using the Astropy package photutils. The aperture radius is fixed to be 1”, and the background residual after the sky subtraction is from the median value in an annulus of 3.5” inner radius and 5.5” outer radius. We did the same photometric measurements on an extra set of 3–6 neary stars of Pan-STARRS magnitudes between 18 mag and 20.3 mag (AB system, Oke (1974); Chambers et al. (2016)). We used their -band magnitudes to find the zero-points. We assumed there to be Poisson errors and the uncertainties from zero-point fit. The Poissonian error of aperture count from the average combination of exposures with same exposure time is . The final error is simply the square root of the quadratic sum of the Poissonian error and the zero-point uncertainty.
4.1 Two extra objects: WISE0414 and WISE1810
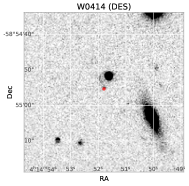
For reference sources, we added two extra extreme T subdwarf candidates WISEA J041451.67585456.7 and WISEA J181006.18101000.5, which were reported and spectroscopically characterized in the NIR by Schneider et al. (2020). They have metallicities [Fe/H] dex and dex, respectively. Lodieu et al. (2022) collected GTC OSIRIS -band photometry and spectroscopy allowing them to place improved constraints on the metallicity of WISE1810 ( dex). We also found that WISE0414 has -band detection in the Dark Energy Survey (DES), see Figure 7. The DES also recorded its magnitudes in the -band at 26.541.39 mag; and in the -band at 25.711.13 mag.
4.2 Correction for Pan-STARRS magnitude
The filter of Pan-STARRS111Transmission profile of the PS1 filter: http://svo2.cab.inta-csic.es/theory/fps/index.php?id=PAN-STARRS/PS1.z&&mode=browse&gname=PAN-STARRS&gname2=PS1#filter. and the filter of SDSS used by OSIRIS222Transmission profile of the Sloan filter on OSIRIS: http://svo2.cab.inta-csic.es/theory/fps/index.php?id=GTC/OSIRIS.sdss_z&&mode=browse&gname=GTC&gname2=OSIRIS#filter are very different; the latter in particular allows the flux beyond pass through and the former does not. Moreover, the SED profiles of T dwarfs are quite inclined around this wavelength. Thus we are obliged to apply an offset to the GTC OSIRIS magnitudes to get the magnitudes under the Pan-STARRS AB system.
We synthesized photometry and computed the offsets between OSIRIS magnitude and Pan-STARRS magnitude against the NIR spectral types of dwarfs based on two filter profiles and L dwarf optical templates (Kirkpatrick et al., 1999); the T dwarf optical templates (Burgasser et al., 2002, 2003b), and Y dwarf theoretical models (Morley et al., 2014). The Y dwarf models have gravity , sedimentation efficiency , cloud cover , and effective temperature from 450K to 200K. We converted the of the Y dwarf to spectral types (Schneider et al., 2015; Cushing et al., 2021). Not all the dwarf templates are metal-poor, but we consider that, within a bandwidth in -band, the difference in the SED slopes are so small that we can also apply this to our metal-poor samples. Because WISE0414 was detected in DES we repeated the procedure for the DES filters.333Transmission profile of DECam filter of DES: https://noirlab.edu/science/node/41112. The DES filter has more transmitivity than the SDSS filter in the red part. Table 4 lists the results.
We did a consistency check on the calculated offset values. The two brightest objects have detections in Pan-STARRS DR1 (PS1): WISE0004 which is recently classified as a T2 or T4 and WISE0301 which is classified as a T1 (Best et al., 2020). Both are early-T type dwarfs. The differences between Pan-STARRS AB magnitudes and the GTC magnitudes are mag and mag, respectively. We recalculated the offsets using their ORISIS spectra (presented in Section 5) and found mag and mag, respectively. If we assume an uncertainty of in the sub-class in the spectral type of these two objects, both results are consistent with Table 4, which are from to mag and from to mag, respectively. We computed the offset of WISE1810 using its OSIRIS spectra (obtained by Lodieu et al. (2022) and presented in Section 5). WISE1810 has mag, which is consistent in Table 4 with its spectral type estimation ( to mag; T0.01.0, Schneider et al. (2020)). We also computed the offset for the Y dwarf WISE J173835.53+273259.0 with OSIRIS spectrum obtained by Martín (2023). It has an estimated effective temperature of 300–450 K (Kirkpatrick et al., 2011), which corresponds to Y0–Y2, although Kirkpatrick et al. (2011) classified it as a Y0 in the NIR. The offset turns out to be mag, which is in line with the predicted results in Table 4 ( to mag). The mid-T types reach the maximum offset around 0.9 mag for both the GTC and the DES.
| Spec. type | ||
|---|---|---|
| L6.0 | ||
| L7.0 | ||
| L8.0 | ||
| T0.0 | ||
| T1.0 | ||
| T2.0 | ||
| T3.0 | ||
| T4.5 | ||
| T5.0 | ||
| T6.0 | ||
| T7.0 | ||
| T8.0 | ||
| Y0.0 | ||
| Y1.0 | ||
| Y2.0 |
For the two brightest objects, WISE0004 and WISE0301, we simply adopted their Pan-STARRS AB magnitudes. For WISE1810, we use the correction calculated using its spectrum. For the rest, we applied the offsets in Table 4 to all the objects according to their estimated NIR spectral types in Table 1. The uncertainty of the correction comes from both the uncertainty of the spectral type and the coarseness of the spectral-type step in Table 4. The final error is the square root of the quadratic sum of this uncertainty and the photometric error of . The photometry results are shown in Table 5.
| Name | ||||||||
|---|---|---|---|---|---|---|---|---|
| W0004 | 16.180.02 | 15.210.04 | 14.130.04 | 15.590.13 | ¿ 15.52 | 19.530.02 | 20.120.03 | |
| W0013 | 19.750.05 | ¿ 18.31 | 15.040.11 | 20.020.05 | 23.390.05 | 24.210.05 | ||
| W0301 | 16.630.02 | 14.830.03 | 14.040.04 | 15.800.16 | 15.580.23 | 19.680.02 | 20.140.05 | |
| (1)W0414 | 19.630.11 | 16.710.03 | 15.290.03 | 21.620.17 | ¿ 18.82 | 23.350.23 | ||
| W0422 | 19.430.23 | 18.820.41 | 16.020.08 | ¿ 19.97 | ¿ 18.89 | 23.940.08 | 24.640.14 | |
| W0833 | 20.280.10 | ¿ 18.35 | 14.960.10 | 20.430.21 | 20.630.10 | (4) ¿ 18.20 | 23.570.09 | 24.270.15 |
| U0926 | 18.570.02 | (3)18.060.13 | (3)17.100.18 | 19.860.15 | 18.690.01 | 19.140.25 | 22.290.03 | 23.080.07 |
| U1316 | 19.290.12 | (3)16.540.04 | (3)15.950.06 | 20.000.14 | (4) ¿ 18.80 | (4) ¿ 18.20 | 22.880.04 | 23.720.05 |
| U1319 | 18.900.05 | 20.390.05 | 18.900.15 | 19.410.10 | 22.780.04 | 23.640.04 | ||
| W1553 | (5)19.170.03 | 17.070.03 | 15.620.03 | (5)18.870.05 | (5)19.240.03 | 22.080.02 | 22.940.02 | |
| (1,2)W1810 | 17.290.04 | 13.920.03 | 12.58 0.04 | 18.940.13 | 16.520.03 | 17.100.17 | 20.150.08 | 20.690.08 |
| W2217 | 20.660.02 | 17.430.08 | 15.780.06 | (5)20.660.06 | ¿ 18.20 | 23.520.08 | 24.360.09 |
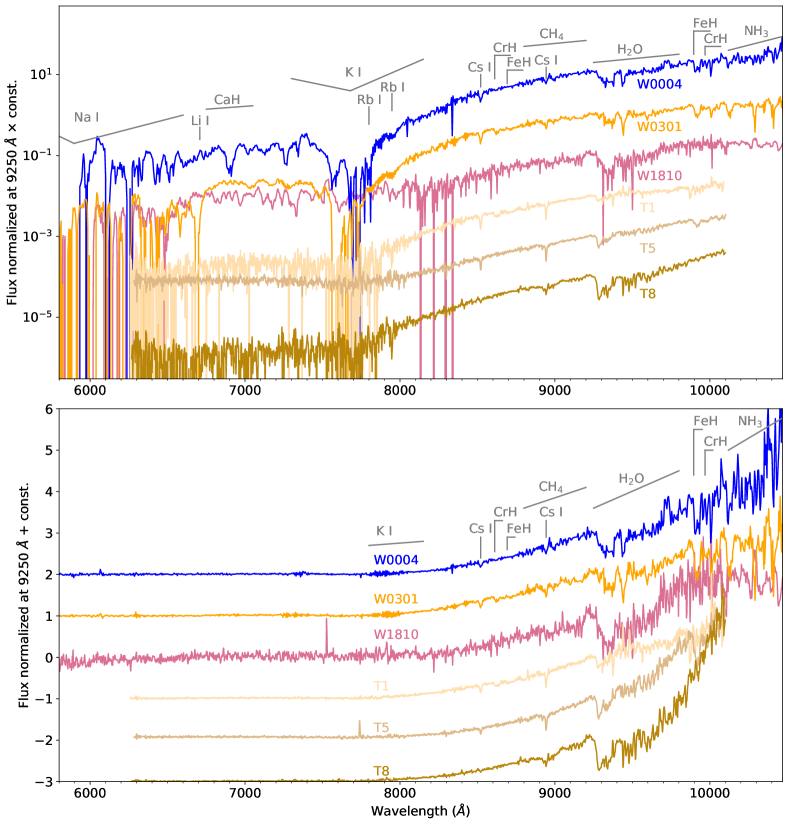
We plotted optical spectra of the T1 standard SDSS0837, the T5 standard 2MASS0755 and the T8 standard 2MASS0415 (Burgasser et al., 2003b) for comparison.
4.3 -band magnitudes and colour–colour diagrams
Table 5 shows the GTC -band magnitudes and the offset-corrected Pan-STARRS AB magnitude as well as the magnitudes or magnitude limits for all the targets in our sample. of WISE0414 is corrected from its DES magnitude, and its estimated spectral type T0.01.0, the same as WISE1810 (Schneider et al., 2020). We noticed that our GTC magnitude of WISE1553 is in agreement with mag (Nidever et al., 2018) from Mosaic3 with a filter similar to that of DES of Kitt Peak Nicholas Mayall Telescope (Dey et al., 2016). We took the offset between our and DES into account (shown in Table 4). Our magnitude for ULAS0926 is consistent at the 1- level with the magnitude mag converted by Burningham et al. (2010) from the magnitude of ESO Multi-Mode Instrument (EMMI). For ULAS1316, we adopted the photometric measurement at epoch 2006.41 rather than those at epoch 2010.24, because ULAS1316 gradually moved onto a background galaxy during that time and thus the photometry had more contamination. For the same reason, the and magnitudes are questionable. For ULAS1319, there is no nor magnitude because the WISE satellite was not able to resolve it from a nearby bright star WISE J131943.68+120907.0 ( mag).
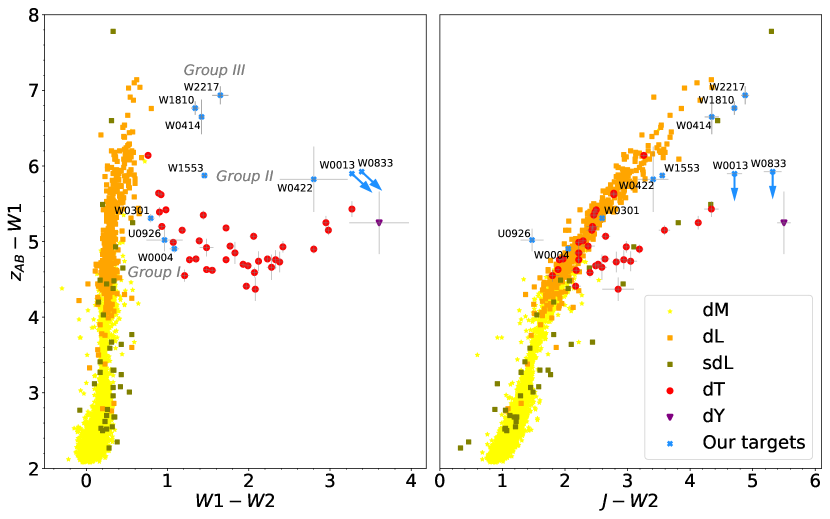
Figure 1 shows the colour–colour diagrams of vs. and vs. for all the objects except ULAS1316 and ULAS1319, with extra 8508 M dwarfs, 800 L dwarfs and 42 T dwarfs from the Pan-STARRS1 3 Survey (Best et al., 2018); one Y0 dwarf WISEP J173835.52+273258.9 discovered by Cushing et al. (2011b) with both and detection and was detected in using GTC OSIRIS (Lodieu et al., 2013); 39 L subdwarfs with photometric errors less than 0.2 mag in , and -bands (Zhang et al., 2018).
Kirkpatrick et al. (2011) showed observationally that the colour is a very powerful aid to distinguishing solar-metallicity T and Y dwarfs from M and L dwarfs; the colour becomes redder monotonically towards later types, and the slope of colour vs. spectral type relation curve increases dramatically after passing the L/T transition point. The colour, however, has some degeneracy among late-L and early-T dwarfs.
In the first vs. colour–colour diagram, all of our objects have and split into three quite distinctive groups in colours: Group I is mixed with the normal T dwarf sequence, Group III has an extremely red colour mag and Group II lies in between Group I and Group III. The separation between the three groups in the second vs. colour–colour diagram is not as clear as that in the first diagram. We explain in Section 6 that can be a good metallicity indicator for objects with colours similar to those of T dwarfs.
5 Spectroscopy
Our two brightest targets, WISE0004 and WISE0301, lie in Group I at the beginning of the T dwarf sequence in the vs. colour–colour diagram. In this section we present and discuss their optical spectra (shown in Figure 2), 3, and 4. To compare the T subdwarf with normal T dwarf, we used three spectra of T standards from the Low Resolution Imaging Spectrograph (LRIS) on Keck I, the T1 standard SDSS J083717.31000018.0, the T5 standard 2MASS J075547952212169 and the T8 standard 2MASS J041519540935066 (Burgasser et al., 2003b). We also included the GTC OSIRIS spectrum of WISE1810, which is from Group III (Lodieu et al., 2022) in the comparison, but we shall discuss it in detail in Section 6.
5.1 Spectral slope
Figure 2 shows that in the optical, the spectral slopes of our two targets are quite similar to each other and resemble the normal early-T dwarf slope. We used the least-squares method to compare the two spectra with the entire T dwarf standard grid provided by (Burgasser et al., 2003b). We used the wavelength range from to . We found that WISE0004 matches T2 best, and WISE0301 matches T1. This is in agreement with the spectral types estimated from the NIR spectra for WISE0004 (T2) and WISE0301 (T1) by Greco et al. (2019). Although Best et al. (2020) estimate a type T4 for WISE0004.
5.2 Hydrides
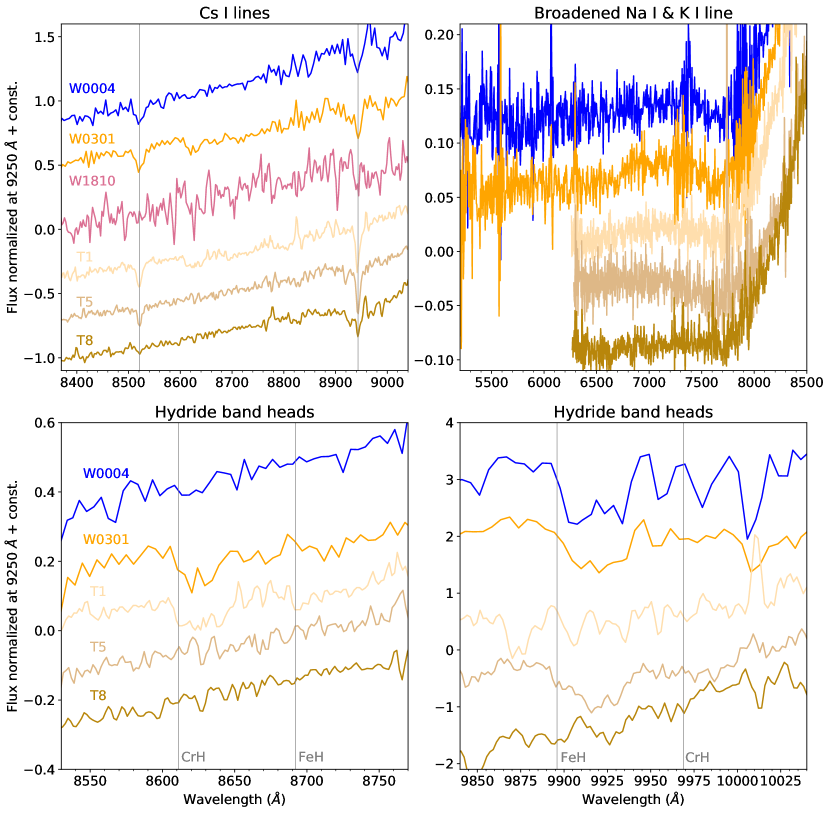
WISE0301 shows a CrH bandhead starting at Å that is just like the T1 dwarf standard, but WISE0004 does not show it. This absorption feature disappears from spectral classes T1 to T5. These effects are illustrated in the lower left panel of Figure 3.
Both targets have deeper FeH absorption at Å than the T1 standard and are similar to the T5 standard. This can be seen in the lower right panel of Figure 3. Neither object shows strong CrH at Å or FeH at Å just like their solar-metallicity counterparts.
5.3 Alkali atomic lines
The Na I and K I resonance doublets are known to be extremely broad in ultracool dwarfs (Martín et al., 1999). The red wing of the Na I feature in our two targets shapes the optical spectra from Å to Å as can be seen in the upper logarithmic-scale plot in Figure 2 and the upper right linear-scale plot in Figure 3. In the same figures, the strong K I resonance doublet at Å and Å forms V-shaped notches in both targets. These are as deep and wide as that of the T5 standard.
The extended absorption due to the Na I and K I resonance features render the signal-to-noise ratio (S/N) in the continuum very low in our spectra shortwards and prevent us from detecting or setting any significant limits to the presence of the Li I resonance doublet at Å (a trademark of substellar status) or the Rb I resonance doublet at Å and Å.
The Cs I resonance doublet at Å and Å is prominent. We used the IRAF programmes rspec and splot to convert the Pypeit fits table to fits image and then to measure the equivalent width (EW) of these two lines. The measurement of the second line is tricky because it is located within the CH4 absorption band. The first line of WISE0004 has an EW of Å and of WISE0301 has an EW of Å the second line of WISE0004 has an EW of Å and of WISE0301 has an EW of Å. Burgasser et al. (2003b) reported that for early and mid-T dwarfs both of the caesium lines have an EW of about 7 to 9 , and Lodieu et al. (2015) reported that the EW of the caesium Å line of normal T dwarfs peaks in early-T dwarfs is about Å. The two T subdwarfs have EWs comparable to the EWs of normal T dwarfs.
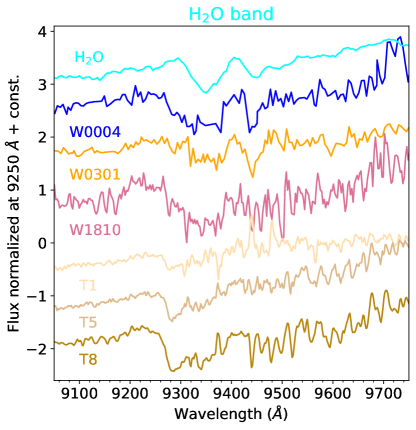
5.4 Water bands
We compared our GTC OSIRIS T subdwarf spectra and WISE1810 spectra with normal T dwarf standards and with a laboratory spectrum of pure H2O gas (Martín et al., 2021). The normal T dwarfs show a H2O bandhead that reaches the deepest level at the beginning of the band at Å and attenuates for longer wavelengths. The T subdwarfs have the deepest absorption feature at Å like the laboratory water spectrum. The two T subdwarfs also have a second absorption feature centred at Å that is also seen in the laboratory spectrum but not in the normal T dwarfs. See the comparison in Figure 4.
To explain the similarity of the optical water bands in the T subdwarfs and the laboratory spectrum, and the difference from the normal T dwarfs, we speculate that the physical conditions in metal-poor atmospheres may favour the condensation of pure water molecules that interact more among themselves and less with other molecules and with atoms than in the case of metal-rich atmospheres.
6 Metallicity Gradient
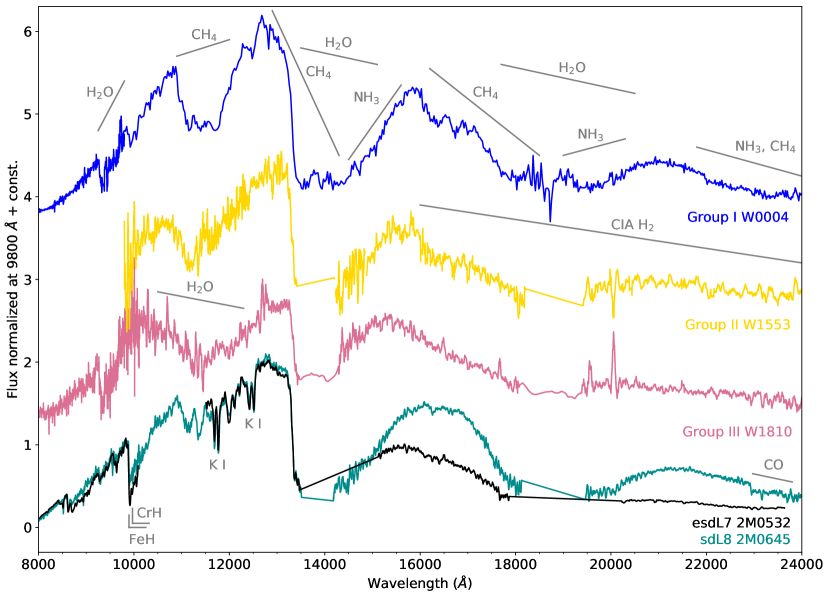
Figure 5 illustrates how the optical and NIR spectra change in Group I, II, III. For the Group I object WISE0004, the optical and the NIR part are from this study and NASA IRTF (Greco et al., 2019), respectively. For the Group II object WISE1553 there is only the NIR spectrum from KECK NIRES (Meisner et al., 2021). We smoothed its spectrum with a window size of 21 to match the spectral resolution of other spectra. The optical spectrum of Group III object WISE1810 is from GTC OSIRIS (Lodieu et al., 2022), and the NIR part is from Palomar/TripleSpec (Schneider et al., 2020) .
As can be seen in Figure 5, Group I keeps the three NIR flux peaks of normal T dwarfs at 1.25, 1.60 and 2.10 m (Burgasser et al., 2002) at the same positions, as well as the peak at 1.08 m in the optical far red. Group III, has the optical far red peak at 1.00 m because of very broad triangular shaped H2O absorption that dominates in the -band window. The NIR flux peaks are located at 1.3 m, owing to the lack of CH4 absorption in the -band, and 1.52 m, possibly because of the lack of NH3. The flux peak at 2.0 m is flattened by the CIA of H2.
The CH4 absorption in the NIR is the trademark of T dwarfs and is shown by both T subdwarfs in Group I and II. Methane is what distinguishes T dwarfs from L dwarfs; in fact T dwarfs are also known as methane dwarfs. However, the CH4 features are very weak or completely missing in the Group III objects. The disappearance of methane is a clear sign of very low metallicity.
6.1 The colour as new metallicity indicator
There is a gradient of the spectral morphology between the groups: From Group I to Group III, the -band H2O absorption is getting stronger; the peak around 1.3 m moves to the red; the -band CH4 absorption is getting weaker; the weaker NH3 absorption makes the third peak and the fourth peak moves blueward; and the - and -bands get more suppressed by the CIA of H2.
The metallicity estimation of T subdwarfs relies strongly on atmospheric modelling and it is very hard to consider developing at the present time a quantitative relationship between the physical observables and the metallicity values with such a small sample. The spectral morphology, however, can show the metallicity trend. Constructing a qualitative metallicity indicator based on this trend is feasible.
Group III objects have a estimated/approximate metallicity between 1.5 and 1.0 dex (Schneider et al., 2020; Lodieu et al., 2022). Meisner et al. (2021) reported that WISE1553 has a metallicity [Fe/H] according to the NIR spectroscopy and the PHOENIX atmospheric models (Hauschildt & Baron, 1999; Allard et al., 2013) extending to low metallicity (Gerasimov et al., 2020), but [Fe/H] according to the broad-band photometry and the LOWZ model of the author. Group I was classified as a T subdwarf but the exact metallicity is unknown. According to the most similarity between the normal T dwarf spectra and Group I spectra, we imply that they have metallicity close to the normal T dwarfs, i.e., [Fe/H] .
Overall, we observe a general decreasing trend of metallicity from 0 to 1.5 dex from Group I to Group III that coincide with the increase of the colour from 5 mag to 7 mag. Therefore we argue that the robustness of the colour might be a qualitative metallicity indicator, for ultracool dwarfs with colour redder than 0.8 mag, which have temperatures lower than that of normal L dwarfs.
Cushing et al. (2005) showed there is a strong methane absorption in the MIR from 3.0 m to 3.8 m (fully covered by the -band) when the T dwarf sequence starts. The reddening of the colour from Group I to Group III can be attributed to the attenuation of the major methane absorption in the -band We also expect that there should be a limit for this indicator when the metallicity becomes too low and the band is no longer affected by methane. Further MIR observations are needed to support this hypothesis and determine the lowest metallicity that this indicator can still be valid.
6.2 Extreme T subdwarf?
Two objects in Group III, WISE1810 and WISE0414 were tentatively designated as esdT0.01.0 (Schneider et al., 2020). However, the lack of methane absorption features at the NIR wavelengths raises the question on the spectral classification of these objects which might require a revision once JWST MIR become available.
Schneider et al. (2020) also noticed that the CIA of hydrogen shapes the spectra of WISE1810 and WISE0414 in a way that resembles the extreme L subdwarfs in and bands, indicating a similar metallicity to the extreme L subdwarf. Indeed, Lodieu et al. (2022) assigned a metallicity [Fe/H] to WISE1810, which falls in the metallicity range of the extreme L subdwarfs, [Fe/H] from down to (Zhang et al., 2017). So are Group III objects in fact late-L subdwarfs? To answer this, we show another comparison in the lower part of Figure 5. The sdL8 2MASS J064531536646120 represents an L subdwarf (both the optical and the NIR part were taken by Zhang et al. (2018) using X-shooter on the VLT, Chile), together with the esdL7 2MASS J05325346+8246465 from Burgasser et al. (2003a) using LRIS and NIRSPEC on the Keck I and II.
First of all, Group III objects have a redder colour, not mixing with any L dwarfs or L subdwarfs in the vs. colour–colour diagram. Second, The hydride bands, especially FeH, become stronger when metallicity decreases (Burgasser et al., 2007; Zhang et al., 2018), as seen from the comparison between the sdL8 and esdL7 in Figure 5. However, Group III objects do not show any signs of hydride in their optical or NIR spectra. Thirdly, the L subdwarfs and extreme L subdwarfs show very little H2O absorption, but Group III objects have very strong H2O bands in both the and the -bands. Group III objects also do not show the strong potassium K I lines in the -band, which appear strong in both late-L subdwarf and extreme subdwarf spectra.
7 Conclusions
The photometric and spectroscopic characterization of metal-poor BDs widens the parameter space over which substellar mass objects are investigated. We used GTC OSIRIS to obtain -band photometry for ten T subdwarf candidates, and optical spectroscopy for two of them, namely WISE0004 and WISE0301. We downloaded -band photometry of WISE0414 from the DES database.
We noticed that our targets segregated into three subgroups in the vs. colour–colour diagram. Group I mixed with the T dwarf sequence from the literature; Group III is composed of only three objects (WISE1810, WISE0414 and WISE2217) and has extraordinarily red colours. Group II is located between the other two groups.
We examined the optical spectra of two early-T subdwarfs in Group I (WISE0004 and WISE0301). Their optical spectra appear similar to those of early-T dwarfs that are dominated by alkali metals and hydrides. We inferred that these two early-T subdwarfs do not have very low metallicity. Nevertheless, they have a deeper water absorption feature in the optical. This water absorption feature in T subdwarf spectra is more similar to the water transmission absorption spectra obtained in the laboratory compared with normal T dwarf spectra.
Based on the peculiar position of these T subdwarf candidates in the colour–colour diagram, we compared the spectra of the early-T subdwarf WISE0004 in Group I, mid-T subdwarf WISE1553 in Group II, WISE1810 in Group III, the late-L subdwarf 2MASS0645 and the late-L extreme subdwarf 2MASS0532. We conclude that the colour is qualitatively a good metallicity indicator for objects with temperatures comparable to that of T dwarfs.
The spectroscopy of the late-type objects in Group II, WISE0422, is needed in the future to test the robustness of the colour as a metallicity indicator for cooler objects; as well as the spectroscopy of the third object in Group III, WISE2217, to confirm its metal-poor nature, although it will be extremely challenging ( = 20.66 mag).
The spectral classification of Group III objects might require a revision because of the weak or absent methane absorption at NIR wavelengths, a key molecular feature to classify T-type dwarfs. We anticipate that new JWST MIR observations will bring new insight on the spectral classification of metal-poor BDs. An option could be using new letters to classify spectra that are different to those previously classified with the letters L, T and Y. We note that the letters H and Z are still available.
More objects of these three groups, and those filling the gaps between them need to be discovered to improve the statistical significance of the connection between the colour and metallicity. We also need more accurate metallicity measurements of these objects to be able to establish this relationship. To achieve this is promising in the near future. A quantum leap is expected in the numbers of substellar objects that can be identified with the advent of deep large area surveys such as the Euclid space mission and Legacy Survey of Space and Time (LSST) at the Vera Rubin Observatory. Thousands of T dwarf slitless low-resolution NIR spectra are expected from the Euclid surveys (Martín et al., 2021), and LSST will become a powerful search engine for Group III objects and those even more metal-poor, expanding more than 1000 times of the space volume in the solar vicinity that we have explored so far.444Here we assumed LSST coadded 5- -band limit to be 25.6 mag, and considering the fact that WISE1810 has 20.7 mag in . LSST -band filter is similar to Pan-STARRS’s. About the LSST depth calculation see https://smtn-002.lsst.io.
Acknowledgements.
Funding for this research was provided by the European Union (ERC, SUBSTELLAR, project number 101054354) and the Agencia Estatal de Investigación del Ministerio de Ciencia e Innovación (AEI-MCINN) under grant PID2019-109522GB-C53. Based on observations made with the Gran Telescopio Canarias (GTC), installed at the Spanish Observatorio del Roque de los Muchachos of the Instituto de Astrofísica de Canarias, on the island of La Palma. This work is (partly) based on data obtained with the instrument OSIRIS, built by a Consortium led by the Instituto de Astrofísica de Canarias in collaboration with the Instituto de Astronomía of the Universidad Autónoma de México. OSIRIS was funded by GRANTECAN and the National Plan of Astronomy and Astrophysics of the Spanish Government. This research has made use of data provided by Astrometry.net. This work has used the Pan-STARRS1 Surveys (PS1) and the PS1 public science archive that have been made possible through contributions by the Institute for Astronomy, the University of Hawaii, the Pan-STARRS Project Office, the Max-Planck Society and its participating institutes, the Max Planck Institute for Astronomy, Heidelberg and the Max Planck Institute for Extraterrestrial Physics, Garching, The Johns Hopkins University, Durham University, the University of Edinburgh, the Queen’s University Belfast, the Harvard-Smithsonian Center for Astrophysics, the Las Cumbres Observatory Global Telescope Network Incorporated, the National Central University of Taiwan, the Space Telescope Science Institute, the National Aeronautics and Space Administration under Grant No. NNX08AR22G issued through the Planetary Science Division of the NASA Science Mission Directorate, the National Science Foundation Grant No. AST-1238877, the University of Maryland, Eotvos Lorand University (ELTE), the Los Alamos National Laboratory, and the Gordon and Betty Moore Foundation. This publication makes use of data products from the Wide-field Infrared Survey Explorer, which is a joint project of the University of California, Los Angeles, and the Jet Propulsion Laboratory/California Institute of Technology, funded by the National Aeronautics and Space Administration. This project used public archival data from the Dark Energy Survey (DES). Funding for the DES Projects has been provided by the U.S. Department of Energy, the U.S. National Science Foundation, the Ministry of Science and Education of Spain, the Science and Technology Facilities Council of the United Kingdom, the Higher Education Funding Council for England, the National Center for Supercomputing Applications at the University of Illinois at Urbana–Champaign, the Kavli Institute of Cosmological Physics at the University of Chicago, the Center for Cosmology and Astro-Particle Physics at the Ohio State University, the Mitchell Institute for Fundamental Physics and Astronomy at Texas A&M University, Financiadora de Estudos e Projetos, Fundação Carlos Chagas Filho de Amparo à Pesquisa do Estado do Rio de Janeiro, Conselho Nacional de Desenvolvimento Científico e Tecnológico and the Ministério da Ciência, Tecnologia e Inovação, the Deutsche Forschungsgemeinschaft and the Collaborating Institutions in the Dark Energy Survey. The Collaborating Institutions are Argonne National Laboratory, the University of California at Santa Cruz, the University of Cambridge, Centro de Investigaciones Enérgeticas, Medioambientales y Tecnológicas–Madrid, the University of Chicago, University College London, the DES-Brazil Consortium, the University of Edinburgh, the Eidgenössische Technische Hochschule (ETH) Zürich, Fermi National Accelerator Laboratory, the University of Illinois at Urbana-Champaign, the Institut de Ciències de l’Espai (IEEC/CSIC), the Institut de Física d’Altes Energies, Lawrence Berkeley National Laboratory, the Ludwig-Maximilians Universität München and the associated Excellence Cluster Universe, the University of Michigan, the National Optical Astronomy Observatory, the University of Nottingham, The Ohio State University, the OzDES Membership Consortium, the University of Pennsylvania, the University of Portsmouth, SLAC National Accelerator Laboratory, Stanford University, the University of Sussex, and Texas A&M University. Based in part on observations at Cerro Tololo Inter-American Observatory, National Optical Astronomy Observatory, which is operated by the Association of Universities for Research in Astronomy (AURA) under a cooperative agreement with the National Science Foundation. This work made use of Astropy:555http://www.astropy.org a community-developed core Python package and an ecosystem of tools and resources for astronomy (Astropy Collaboration et al., 2013, 2018, 2022). We appreciate the referee report for providing useful and insightful comments.References
- Abbott et al. (2018) Abbott, T. M. C., Abdalla, F. B., Allam, S., et al. 2018, ApJS, 239, 18
- Allard et al. (2013) Allard, F., Homeier, D., Freytag, B., Schaffenberger, W., & Rajpurohit, A. S. 2013, Memorie della Societa Astronomica Italiana Supplementi, 24, 128
- Astropy Collaboration et al. (2022) Astropy Collaboration, Price-Whelan, A. M., Lim, P. L., et al. 2022, ApJ, 935, 167
- Astropy Collaboration et al. (2018) Astropy Collaboration, Price-Whelan, A. M., Sipőcz, B. M., et al. 2018, AJ, 156, 123
- Astropy Collaboration et al. (2013) Astropy Collaboration, Robitaille, T. P., Tollerud, E. J., et al. 2013, A&A, 558, A33
- Baraffe et al. (1995) Baraffe, I., Chabrier, G., Allard, F., & Hauschildt, P. 1995, The Astrophysical Journal, 446, L35
- Basri et al. (1996) Basri, G., Marcy, G. W., & Graham, J. R. 1996, The Astrophysical Journal, 458, 600
- Best et al. (2020) Best, W. M. J., Liu, M. C., Magnier, E. A., & Dupuy, T. J. 2020, AJ, 159, 257
- Best et al. (2018) Best, W. M. J., Magnier, E. A., Liu, M. C., et al. 2018, ApJS, 234, 1
- Burgasser et al. (2007) Burgasser, A. J., Cruz, K. L., & Kirkpatrick, J. D. 2007, ApJ, 657, 494
- Burgasser et al. (2002) Burgasser, A. J., Kirkpatrick, J. D., Brown, M. E., et al. 2002, ApJ, 564, 421
- Burgasser et al. (2003a) Burgasser, A. J., Kirkpatrick, J. D., Burrows, A., et al. 2003a, ApJ, 592, 1186
- Burgasser et al. (2003b) Burgasser, A. J., Kirkpatrick, J. D., Liebert, J., & Burrows, A. 2003b, ApJ, 594, 510
- Burningham et al. (2010) Burningham, B., Pinfield, D. J., Lucas, P. W., et al. 2010, MNRAS, 406, 1885
- Burningham et al. (2014) Burningham, B., Smith, L., Cardoso, C. V., et al. 2014, MNRAS, 440, 359
- Burrows & Liebert (1993) Burrows, A. & Liebert, J. 1993, Reviews of Modern Physics, 65, 301
- Cepa et al. (2000) Cepa, J., Aguiar-Gonzalez, M., Gonzalez-Escalera, V., et al. 2000, in Optical and IR Telescope Instrumentation and Detectors, Vol. 4008, SPIE, 623–631
- Chabrier et al. (2000) Chabrier, G., Baraffe, I., Allard, F., & Hauschildt, P. 2000, The Astrophysical Journal, 542, L119
- Chambers et al. (2016) Chambers, K. C., Magnier, E. A., Metcalfe, N., et al. 2016, arXiv e-prints, arXiv:1612.05560
- Cushing et al. (2011a) Cushing, M. C., Kirkpatrick, J. D., Gelino, C. R., et al. 2011a, ApJ, 743, 50
- Cushing et al. (2011b) Cushing, M. C., Kirkpatrick, J. D., Gelino, C. R., et al. 2011b, ApJ, 743, 50
- Cushing et al. (2005) Cushing, M. C., Rayner, J. T., & Vacca, W. D. 2005, ApJ, 623, 1115
- Cushing et al. (2021) Cushing, M. C., Schneider, A. C., Kirkpatrick, J. D., et al. 2021, ApJ, 920, 20
- Cutri et al. (2003) Cutri, R. M., Skrutskie, M. F., van Dyk, S., et al. 2003, VizieR Online Data Catalog, II/246
- Cutri et al. (2012) Cutri, R. M., Wright, E. L., Conrow, T., et al. 2012, Explanatory Supplement to the WISE All-Sky Data Release Products, Explanatory Supplement to the WISE All-Sky Data Release Products
- Delorme et al. (2008) Delorme, P., Delfosse, X., Albert, L., et al. 2008, A&A, 482, 961
- Dey et al. (2016) Dey, A., Rabinowitz, D., Karcher, A., et al. 2016, in Society of Photo-Optical Instrumentation Engineers (SPIE) Conference Series, Vol. 9908, Ground-based and Airborne Instrumentation for Astronomy VI, ed. C. J. Evans, L. Simard, & H. Takami, 99082C
- Dupuy & Liu (2017) Dupuy, T. J. & Liu, M. C. 2017, ApJS, 231, 15
- Flaugher et al. (2015) Flaugher, B., Diehl, H. T., Honscheid, K., et al. 2015, AJ, 150, 150
- Geballe et al. (2002) Geballe, T. R., Knapp, G. R., Leggett, S. K., et al. 2002, ApJ, 564, 466
- Gerasimov et al. (2020) Gerasimov, R., Homeier, D., Burgasser, A., & Bedin, L. R. 2020, Research Notes of the American Astronomical Society, 4, 214
- Greco et al. (2019) Greco, J. J., Schneider, A. C., Cushing, M. C., Kirkpatrick, J. D., & Burgasser, A. J. 2019, AJ, 158, 182
- Hauschildt & Baron (1999) Hauschildt, P. H. & Baron, E. 1999, Journal of Computational and Applied Mathematics, 109, 41
- Kirkpatrick et al. (2011) Kirkpatrick, J. D., Cushing, M. C., Gelino, C. R., et al. 2011, ApJS, 197, 19
- Kirkpatrick et al. (2019) Kirkpatrick, J. D., Martin, E. C., Smart, R. L., et al. 2019, ApJS, 240, 19
- Kirkpatrick et al. (1999) Kirkpatrick, J. D., Reid, I. N., Liebert, J., et al. 1999, ApJ, 519, 802
- Kumar (1963) Kumar, S. S. 1963, The Astrophysical Journal, 137, 1121
- Lang et al. (2010) Lang, D., Hogg, D. W., Mierle, K., Blanton, M., & Roweis, S. 2010, AJ, 139, 1782
- Lawrence et al. (2007a) Lawrence, A., Warren, S. J., Almaini, O., et al. 2007a, MNRAS, 379, 1599
- Lawrence et al. (2007b) Lawrence, A., Warren, S. J., Almaini, O., et al. 2007b, MNRAS, 379, 1599
- Lodieu et al. (2019) Lodieu, N., Allard, F., Rodrigo, C., et al. 2019, A&A, 628, A61
- Lodieu et al. (2013) Lodieu, N., Béjar, V. J. S., & Rebolo, R. 2013, A&A, 550, L2
- Lodieu et al. (2022) Lodieu, N., Zapatero Osorio, M. R., Martín, E. L., Rebolo López, R., & Gauza, B. 2022, A&A, 663, A84
- Lodieu et al. (2015) Lodieu, N., Zapatero Osorio, M. R., Rebolo, R., et al. 2015, A&A, 581, A73
- Marocco et al. (2021) Marocco, F., Eisenhardt, P. R. M., Fowler, J. W., et al. 2021, ApJS, 253, 8
- Martín et al. (1999) Martín, E. L., Delfosse, X., Basri, G., et al. 1999, AJ, 118, 2466
- Martín et al. (2021) Martín, E. L., Zhang, J. Y., Esparza, P., et al. 2021, A&A, 655, L3
- Martín (2023) Martín, E. L. 2023, in prep.
- Meisner et al. (2020) Meisner, A. M., Faherty, J. K., Kirkpatrick, J. D., et al. 2020, ApJ, 899, 123
- Meisner et al. (2023) Meisner, A. M., Leggett, S. K., Logsdon, S. E., et al. 2023, arXiv e-prints, arXiv:2301.09817
- Meisner et al. (2021) Meisner, A. M., Schneider, A. C., Burgasser, A. J., et al. 2021, ApJ, 915, 120
- Morganson et al. (2018) Morganson, E., Gruendl, R. A., Menanteau, F., et al. 2018, PASP, 130, 074501
- Morley et al. (2014) Morley, C. V., Marley, M. S., Fortney, J. J., et al. 2014, ApJ, 787, 78
- Murray et al. (2011) Murray, D. N., Burningham, B., Jones, H. R. A., et al. 2011, MNRAS, 414, 575
- Nakajima et al. (1995) Nakajima, T., Oppenheimer, B., Kulkarni, S., et al. 1995, nature, 378, 463
- Nidever et al. (2018) Nidever, D. L., Dey, A., Olsen, K., et al. 2018, AJ, 156, 131
- Oke (1974) Oke, J. B. 1974, ApJS, 27, 21
- Pinfield et al. (2014) Pinfield, D. J., Gomes, J., Day-Jones, A. C., et al. 2014, MNRAS, 437, 1009
- Prochaska et al. (2020) Prochaska, J. X., Hennawi, J., Cooke, R., et al. 2020, pypeit/PypeIt: Release 1.0.0
- Prochaska et al. (2020) Prochaska, J. X., Hennawi, J. F., Westfall, K. B., et al. 2020, Journal of Open Source Software, 5, 2308
- Rebolo et al. (1992) Rebolo, R., Martin, E. L., & Magazzu, A. 1992, The Astrophysical Journal, 389, L83
- Rebolo et al. (1995) Rebolo, R., Osorio, M., & Martín, E. 1995, Nature, 377, 129
- Schneider et al. (2020) Schneider, A. C., Burgasser, A. J., Gerasimov, R., et al. 2020, ApJ, 898, 77
- Schneider et al. (2015) Schneider, A. C., Cushing, M. C., Kirkpatrick, J. D., et al. 2015, ApJ, 804, 92
- Skrutskie et al. (2006) Skrutskie, M. F., Cutri, R. M., Stiening, R., et al. 2006, AJ, 131, 1163
- Tody (1986) Tody, D. 1986, in Society of Photo-Optical Instrumentation Engineers (SPIE) Conference Series, Vol. 627, Instrumentation in astronomy VI, ed. D. L. Crawford, 733
- Wright et al. (2010) Wright, E. L., Eisenhardt, P. R. M., Mainzer, A. K., et al. 2010, AJ, 140, 1868
- York et al. (2000) York, D. G., Adelman, J., Anderson, John E., J., et al. 2000, AJ, 120, 1579
- Zapatero Osorio et al. (2018) Zapatero Osorio, M. R., Béjar, V. J. S., Lodieu, N., & Manjavacas, E. 2018, MNRAS, 475, 139
- Zhang et al. (2019) Zhang, S., Luo, A. L., Comte, G., et al. 2019, ApJS, 240, 31
- Zhang (2019) Zhang, Z. 2019, MNRAS, 489, 1423
- Zhang et al. (2018) Zhang, Z. H., Galvez-Ortiz, M. C., Pinfield, D. J., et al. 2018, MNRAS, 480, 5447
- Zhang et al. (2017) Zhang, Z. H., Pinfield, D. J., Gálvez-Ortiz, M. C., et al. 2017, MNRAS, 464, 3040
Appendix A -band images of the targets