Inferring Power Grid Information with Power Line Communications: Review and Insights
Abstract
High-frequency signals were widely studied in the last decade to identify grid and channel conditions in Power Line Networks (PLNs). Power Line Modems (PLMs)operating on the grid’s physical layer are capable of transmitting such signals to infer information about the grid. Hence, Power Line Communication (PLC)is a suitable communication technology for Smart Grid (SG)applications, especially suited for grid monitoring and surveillance. In this paper, we provide several contributions: 1) a classification of PLC-based applications; 2) a taxonomy of the related methodologies; 3) a review of the literature in the area of PLC Grid Information Inference (GII); and, insights that can be leveraged to further advance the field. We found research contributions addressing PLMs for three main PLC-GII applications: topology inference, anomaly detection, and physical layer key generation. In addition, various PLC-GII measurement, processing, and analysis approaches were found to provide distinctive features in measurement resolution, computation complexity, and analysis accuracy. We utilize the outcome of our review to shed light on the current limitations of the research contributions and suggest future research directions in this field.
Index Terms:
Power Line Communication, Smart Grid, Physical Layer, Signal Analysis, Cybersecurity, Anomaly Detection, Grid Inference, and Topology Inference.I Introduction
Power Line Communications (PLC) is a technology that transmits data over power lines and serves the grid for a wide range of applications [1]. Remote meter data collection, grid control, fault detection, and data transmissions are the main applications of PLC [2]. PLC development over time allowed for enhanced utility and consumer experiences. Additionally, different PLC standards are characterized by a variety of bandwidths and carrier frequencies ranging from a few kHz in the Ultra Narrow Band (UNB)-PLC to several hundreds of MHz in Broadband (BB)-PLC [3, 4].
PLC is expected to play a significant role in grid operations management as recent advances in grid technologies revealed a potential adoption of new grid configurations (e.g., Microgrids (MGs), Internet of Things (IoT)networks, and Distributed Energy Resources (DERs)) [5, 6, 7, 8]. Indeed, enhanced grid protection, communication, and control methods are a need to enable the integration of the new technologies [9, 10, 11]. Such methods rely mainly on automating grid operations to provide generation-demand balance and stability [12]. In addition, they provide continuous monitoring of grid assets, two-way communication, and improved Demand Side Management (DSM)[3]. Monitoring grid assets, including lines and nodes, generally requires deploying measurement equipment (e.g., sensors around the grid) to gather diagnostic data [13]. However, studies of the grid and channel effects on PLC and high-frequency signals [14, 15, 16] revealed alternative grid diagnostics and monitoring methods. A common need between the two approaches is a communication medium to collect the measurements and fault information for further processing and decision-making. Fortunately, PLC can provide measurement and communication aspects in a single technology through Power Line Modems (PLMs)[17]. Hence, recent studies in this research area focused on enhanced grid monitoring solutions using PLC. Furthermore, security analysis of the grid communications showed potential enhancements through using the grid Physical Layer Security (PLS)techniques [18]. On the one hand, channel characteristics can extract common randomness between grid nodes to derive shared security keys [19]. In addition, variations of the Channel State Information (CSI)and noise provide information about possible network intrusions and aid the intrusion location identifications [20].
| Acronym | Definition |
| AMI | Advanced Metering Infrastructure |
| BB | Broadband |
| BIS | Broadband Impedance Spectroscopy |
| CENELEC | European Committee for Electrotechnical Standardization |
| CFR | Channel Frequency Response |
| CIR | Channel Impulse Response |
| CS | Compressed Sensing |
| CSS | Chirp Spread Spectrum |
| CSI | Channel State Information |
| CTF | Channel Transfer Function |
| DER | Distributed Energy Resource |
| DNRA | Dynamic Network Reconstruction Algorithm |
| DSM | Demand Side Management |
| EIS | Electrical Impedance Spectroscopy |
| EMI | Electromagnetic Interferences |
| FDR | Frequency Domain Reflectometry |
| FFT | Fast Fourier Transform |
| FMCW | Frequency Modulated Carrier Wave |
| GII | Grid Information Inference |
| GLRT | Generalized Likelihood Ratio Test |
| HIF | High Impedance Fault |
| HS-OFDM | Hermi-tian Symmetric OFDM |
| ICMP | Internet Control Message Protocol |
| IFT | Inverse Fourier Transform |
| IoT | Internet of Things |
| JTFDR | Joint Time Frequency Domain Reflectometry |
| LV | Low Voltage |
| MG | Microgrid |
| ML | Machine Learning |
| MTL | Multiconductor Transmission Line |
| NNs | Neural Networks |
| NTP | Network Time Protocol |
| OFDM | Orthogonal Frequency Division Multiplexing |
| PD-FDR | Phase Detection-FDR |
| PHEV | Plug-in Hybrid Electric Vehicle |
| PHY | Physical Layer |
| PILC | Paper-Insulated Lead-Covered |
| PLC | Power Line Communication |
| PL-ID | Power Line Identification |
| PLM | Power Line Modem |
| PLM | Power Line Modem |
| PLS | Physical Layer Security |
| PUL | Per Unit Length |
| P2P | Point-to-Point |
| RNJA | Rooted Neighbor-Joining Algorithm |
| SG | Smart Grid |
| SNR | Signal to Noise Ratio |
| STP | Shortest Time Path |
| SVMs | Support Vector Machines |
| SWR-FDR | Standing Wave Ratio-FDR |
| TDoA | Time Difference of Arrival |
| TDR | Time Domain Reflectometry |
| TEM | Transverse Electromagnetic |
| TF | Transfer Function |
| TFDR | Time Frequency Domain Reflectometry |
| ToA | Time of Arrival |
| ToF | Time of Flight |
| TTL | Time to Live |
| UNB | Ultra Narrow Band |
| UWB | Ultra-Wideband |
| W-FDR | Wideband-FDR |
| WSS | Wide Sense Symmetry |
| WT | Water Treeing |
| XLPE | Cross-Linked Polyethylene |
| Symbol | Meaning |
| PUL capacitance | |
| Distance from node to node | |
| PUL conductance | |
| CFR | |
| CIR | |
| PUL inductance | |
| PUL resistance | |
| Signal propagation time | |
| Signal transmission coefficient | |
| Reflected voltage wave | |
| Transmitted voltage wave | |
| Signal propagation speed | |
| Characteristic impedance | |
| Line length | |
| Line segment | |
| Signal attenuation coefficient | |
| Signal propagation coefficient | |
| Signal reflection coefficient | |
| Signal propagation constant |
The emerging applications of PLC were not reviewed or classified previously. Instead, related surveys were found to cover the classification of cable fault detection methods in Power Line Networks (PLNs)[21, 22]. Meanwhile, one only covered a general review of PLC grid monitoring applications and methods [23]. However, it did not provide detailed classifications or new insights into the field.
I-A Contribution
In light of the aforementioned limitations of the related works, this paper studies the PLC-Grid Information Inference (GII)related contributions and presents a classification of applications and methodologies. In particular, we provide several contributions:
-
•
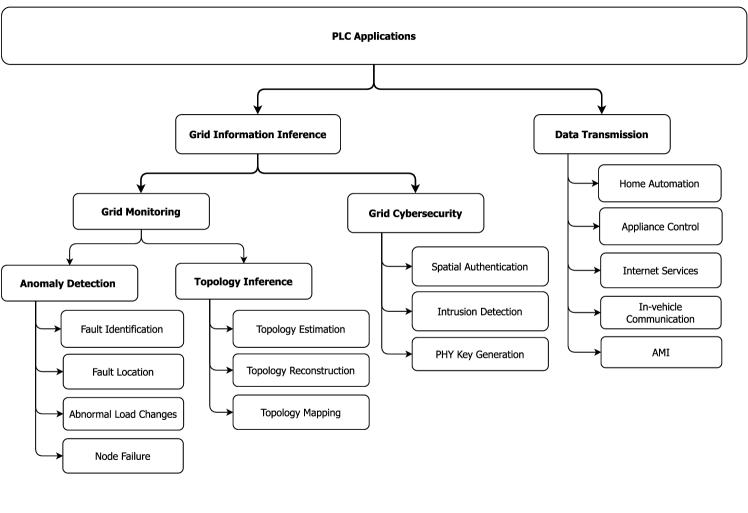
A new classification of PLC applications: we identify two main domains, namely, data transmission and GII, where the latter is further classified into grid monitoring and cybersecurity applications.
-
•
Taxonomies of the PLC-GII methodologies: covering the measurement, processing, and analysis phases. A comparison of the different techniques is presented to clarify their use cases.
-
•
Review and analysis of the related contributions: we compare the features of model solutions and draw conclusions relating the used methodologies to the intended applications.
-
•
We finally provide a general evaluation of the research contributions in this field and present potential future research directions.
This study’s results are expected to potentially influence this research community by organizing the current contributions, identifying the limitations, and providing ideas for future research directions.
I-B Paper Organization
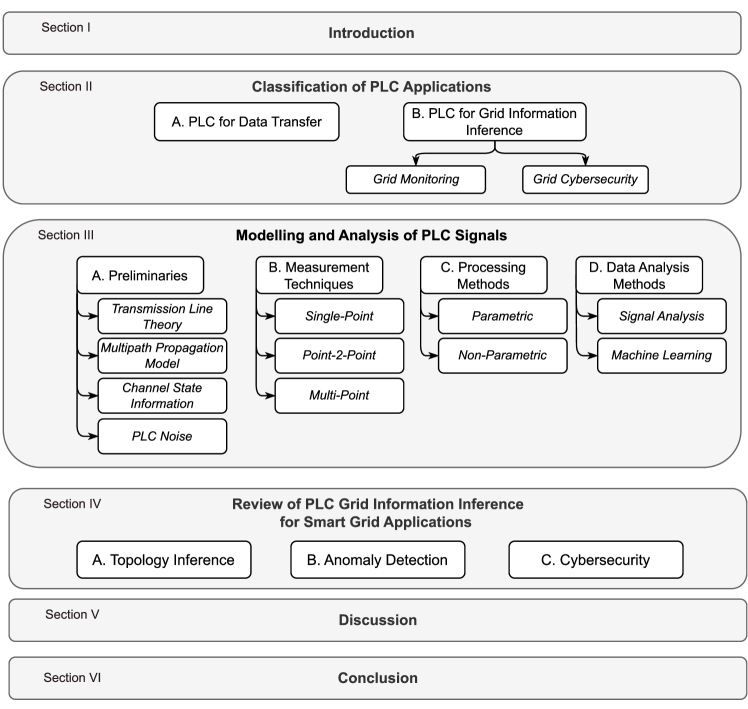
The remainder of the paper is arranged as shown in Fig. 1; a new classification of PLC applications is presented in Section II. Preliminary background information combined and taxonomies of measurement, processing, and analysis methodologies are provided in Section III. A review of the related contributions is presented in Section IV. A final discussion about the current research contributions and future research directions in Section V is followed by a conclusion in Section VI. In addition, tables I and II list all acronyms and symbols used throughout the paper with their meaning.
II Classification of PLC Applications
The legacy electric grid is being modernized to integrate new technologies such as DERs or Plug-in Hybrid Electric Vehicle (PHEV)[24, 25, 26, 27]. The smart electric grid design requires a reliable communication system to enable data transmissions and two-way communications [3]. PLC is proven to provide this requirement. In addition, it allows sensing and inferring latent grid information. Therefore, PLC applications in the smart grid are classified into two categories i) data transmission and ii) GII, as detailed in the following subsections.
II-A PLC for Data Transmission
PLC actively provides communication services at all grid levels and supports multiple application areas with reliable and efficient deployments. Among other technologies, PLC assisted the Advanced Metering Infrastructure (AMI)work by providing a ready-deployed data-transmission network. Moreover, home automation and appliance control were further simplified since control units and wiring installations were reduced using PLC to transfer control signal [28]. In addition, BB-PLC networks allow utilities to supply internet services to consumers and can be integrated with other communication networks (e.g., Ethernet and wireless) for inter- and intra-network communications[29, 30, 31, 32]. PLC was further considered for in-vehicle telecommunication and control applications [33, 34, 35].
II-B PLC for Grid Information Inference
Applications of PLC are not limited to telecommunications. Indeed, they can be extended to cover other domains and to serve the grid itself [36]. Since the transmission medium spans the whole grid, PLMs can serve as sensors by generating signals of varying frequency ranges and types [37]. Consequently, measurements collected from PLMs can be analysed to obtain information about the grid’s physical layer. In the following, we will refer to this type of PLC applications as “PLC Grid Information Inference”. Grid monitoring is a PLC application domain that exploits the “through the grid” feature of PLC [3]. Additionally, the cybersecurity domain exploits the grid and channel characteristics to enhance security and privacy. A detailed classification and discussion of these applications are provided in the following sections and summarized in Fig. 2.
II-B1 Grid Monitoring
The PLC channel is known to be time-variant due to variations in the grid’s physical parameters, e.g., line impedance, loads, and topology [38]. Grid parameter variations can further impact other grid operations, such as communication, control, asset management, error detection, and others [39, 40]. Hence, continuous grid monitoring is essential to provide timely actions to counter effect the grid dynamics changes [41]. Topology inference and anomaly detection are among the main applications of grid monitoring.
We describe topology inference as the ability to deduce topology parameters based on state measurements of the grid. Inferred parameters include the number of nodes, node arrangement, branch lengths, and line impedance. In this paper, topology inference is further classified based on: 1) the level of prior knowledge about the topology, 2) the inferred topology parameters, and 3) the estimation frequency. We identify topology estimation, topology reconstruction, and topology mapping as the main variants of topology inference. First, topology estimation is the blind prediction of the PLN arrangement regarding the number of nodes, lines, distances, and node arrangements [42, 43]. Second, topology reconstruction recalculates few or all topological parameters with the full previous knowledge of the topology arrangement [44, 45]. Third, topology mapping is a simplified operation that results in the discovery of node assignments to specific domains or sectors of the grid [46, 47]. Finally, topology estimation can be further enhanced to detect topology changes, such as nodes joining or detaching the network. Hence, we consider topology change detection the dynamic version of topology estimation that monitors network changes and provides intrusion detection alerts.
On the other hand, anomaly detection is a broad term that indicates identifying, classifying, and localizing abnormal grid conditions. Anomalies include all undesired events, such as line faults, broken conductors, and node failures. The significant drawbacks of the state-of-the-art cable diagnostic methods are the need for dedicated equipment, offline mode testing, and complexity of work [48]. Hence, an essential requirement for successful SG anomaly detection is a simplified online processing method that does not interfere with standard grid operations. Anomaly detection by continuously evaluating grid and channel conditions using PLMs is a valid solution to the previously highlighted issues. As it will be discussed in section IV, most of the current anomaly detection contributions target only the detection of line faults, such as soft, hard, and distributed faults. However, there exist many other anomalies to be considered in reality. According to Fig. 2, we classify anomaly detection applications into fault identification, fault location, abnormal load changes, and node failure. Fault identification is the detection and identification of the fault’s nature (e.g., High Impedance Fault (HIF)[49, 50], degradation and aging [51, 52], or more severe faults [14]), severity, and impact on the power and data transmissions. Fault location determines the fault position in the network [48, 53]. The location unit could be the distance from measurement PLMs or a specific branch in a topology. Node failure includes the operational or security side of the network’s abnormal working mode (e.g., hardware failure, security attacks, communication outage, or others) [54].
II-B2 Grid Cybersecurity
Grid security is gaining more interest due to the significant importance of PLC networks in various applications, given the recent advancements in PLC technologies. With the adoption of PLC in SG applications, access to the grid is not constrained in such physical broadcast networks, which allows adversaries to perform illegitimate activities [55]. The protection of SGs should meet multiple security requirements such as confidentiality, integrity, authentication, privacy, and access control. Cryptography algorithms and protocols have been adopted in PLC designs to achieve some levels of security. However, such complexity-based methods are built on the assumption of outperforming the adversary in terms of computational power and resources. Therefore, adopting information-theoretic security algorithms is preferred to provide a more strict notion of security [56]. Hence, new secure and simplified key agreement and distribution methods with minimal node interactions are needed. Nonetheless, physical layer intrusion detection methods (i.e., illegitimate physical access and malware traffic injection) are essential to reduce the nodes’ threat exposure. Additionally, exciting features like spatial authentication are rising, thanks to the nature of node connection in indoor and home PLNs, and the noise characteristics [57, 58].
III Modelling and Analysis of PLC Signals
This section presents a classification and discussion of the related methodologies and approaches to the non-telecommunication applications of PLC. Preliminary background knowledge of the power grid channels modeling is provided in the following subsection to aid the understanding of the remaining subsections.
III-A Preliminaries
III-A1 Transmission Line Theory
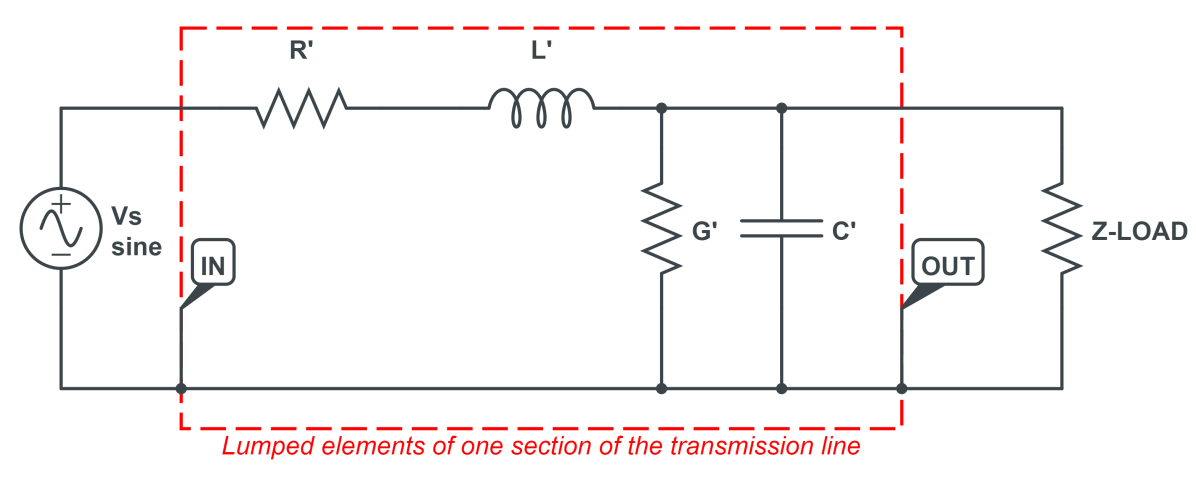
Power lines provide the backbone of the grid. Understanding the characteristics of transmission lines greatly impacts power delivery, loss control, and communication reliability. Since PLC relies on transmission lines as signal propagation medium, channel estimation is usually performed based on transmission line modeling and theory (e.g., bottom-up approach) [59, 60]. Transmission lines are modeled as two port conductors, where the power source connects to one port, and the load connects to the other. Parallel wire configuration is segmenting a transmission line of length into a cascade of infinite equal-length sections . The lumped-element circuit model is the most common for Transverse Electromagnetic (TEM)lines, where each line segment composes of series resistance and inductance , and shunt (parallel) capacitance and conductance components called transmission line parameters, as shown in Fig. 3 [61].
The characteristic impedance is an important property of transmission lines, and the geometry and materials of the transmission line determine its value. For a uniform line, is not dependent on the line length. When applying the transmission line model based on the telegrapher’s equations [61], the general expression for the characteristic impedance of a transmission line is:
| (1) |
where is the angular frequency (rad/sec). However, the characteristic impedance is a measured quantity; its value equals the ratio of voltage to current amplitudes of an incident wave propagating along the line. The input impedance of an infinite line is equal to the characteristic impedance since the transmitted wave is never reflected from the end. Variations in impedance value along line segments create discontinuities, which cause distortions and reflections to the propagating signal. The impedance mismatch value at nodes, branch points and line terminations affects the signal reflection or propagation amount. Signal reflection and propagation phenomena significantly impact channel estimation for PLC grid information inference applications.
III-A2 Multipath Propagation Model
Signal propagation over a power line is determined by the propagation constant , as well as reflections and transmissions at line discontinuities (i.e., impedance mismatch points). The signal propagation constant is defined as:
| (2) |
where, and are the frequency dependant attenuation and propagation coefficients, respectively. The transmission coefficient and reflection coefficient at discontinuities are defined as:
| (3) |
| (4) |
where is the line impedance at the reflection point.
Simply put, as the signal propagates through the line, it encounters discontinuities. The reflection coefficient causes a signal’s attenuated and phase-shifted version to back-propagate towards the signal source. Similarly, the transmission coefficient affects the signal propagation in its original direction. Signals continue to experience such reflections at line discontinuities until they fade away. Hence, replicas of the same signal will be detected at the transmitter and receiver. This propagation behavior is called multipath propagation, as the signal experiences different paths and time delays for each signal replica [62].
III-A3 Channel State Information
Signal propagation in a communication channel is subjected to changes due to the surrounding effects of the transmission medium. These changes (e.g., fading, scattering, noise, interference, and multipath propagation) reflect on the delivery and quality of the transmitted signal [63]. Generally, channels are divided into two main categories based on the frequency of channel state variation, namely: fast fading and slow fading channels. Fast fading is the rapid changes of channel conditions for one transmitted symbol. In contrast, slow fading is the fixed or slow variations of conditions of a channel. Therefore, variations of channel conditions should be accounted for via channel estimation and equalization to improve signal reception quality and provide reliable communications and high data rates. Instantaneous channel estimation methods are suitable for the slow-fading channels, while statistical channel estimation methods are preferred for the fast-fading channels. Regardless of the estimation method, the channel state (AKA: Channel Transfer Function (CTF)) is usually represented by the Channel Frequency Response (CFR)or Channel Impulse Response (CIR), denoted by and , respectively. and are related by the Fourier transform equation:
| (5) |
CFR can be obtained from the multipath propagation by accumulating the signal reflection and transmission coefficients along each path as in (6). Assuming paths are detected with discontinuities along each path, the CFR can be expressed as:
| (6) |
where, and denote the reflection and transmission coefficients at discontinuity in path , respectively, and is the length of path .
III-A4 PLC Noise
The noise observed on power lines originates mainly from two sources: 1) surrounding electrical activities and 2) the electromagnetic radiations absorbed by power lines. Base-band impulsive noises are generated by non-linear circuit elements drawing electric current [64]. Continuous impulsive noise at a harmonic of the fundamental frequency is observed during the activity of electro-mechanical devices such as motors and silicon-controlled rectifiers. In addition, transient impulsive noises are observed during the power cycle switching activity of devices, which usually lasts in a few milliseconds [65]. On the other hand, power lines are excellent antennas that can be excited by broad electromagnetic emissions. Radiations of nearby devices have a greater impact on this type of noise, in addition to the geometry and distribution of power lines in the area [57]. The spatial correlation of noise makes power lines a special transmission medium for PLS applications. Co-located devices experiencing similar noise patterns can perform spatial authentication and generate shared secret keys.
III-B PLC Measurements
PLC-GII comprises three phases: 1) measurement, 2) processing, and 3) analysis. In the first phase, PLMs produce various channel and signal measurements. Consequently, measurements are processed to produce featured data for the analysis phase. Finally, data analysis uses various methods to extract grid information in a centralized or distributed fashion.
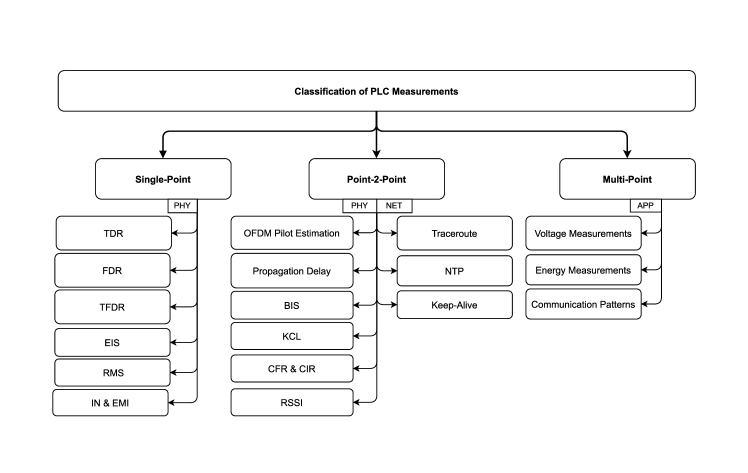
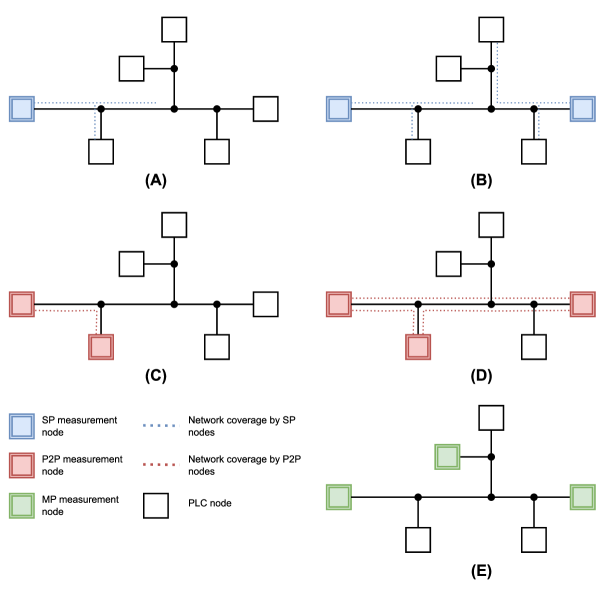
PLC Measurements are presented in three dimensions, the measurement setup, the signal representation domain, and the processing layer. Fig 4 presents the classification of all PLC measurement techniques and metrics. As it can be interpreted, PLC measurements mainly fall under Single-Point, Point-2-Point (P2P), or Multi-Point measurement setups. The variation of measurement setups provides a trade-off between setup complexity (increasing from left to right) and network coverage (increasing from left to right). In practical implementations, coverage of Single-Point and P2P coverage can be expanded by extended-Single-Point and extended-P2P setups as illustrated in Fig. 5. Single-point measurements rely on a single node to measure grid parameters by analysis of PLN noise, features of main harmonic, or reflected signals (i.e., reflectometry techniques) [66]. P2P measurements rely on a pair od nodes exchanging messages to estimate the channel and grid parameters [67]. Multi-Point measurements are operational data collected from many devices in different electrical domains.
Grid information can be predicted from measurements at the physical, network, or application layers. Our analysis showed that this diversity provides a trade-off between the measurement technique complexity (decreasing from left to right) and depth of inference (decreasing from left to right). For instance, application data (e.g., voltage and power meter readings) do not infer the grid’s physical parameters, such as impedance and CSI, but data collection and processing are simple. Physical layer measurements imply that PLMs estimate channels via Sing-Point or P2P setups. On the other hand, approaches utilizing network protocols such as the Network Time Protocol (NTP)handshake [68] and traceroute [45] tend to infer higher-level information about nodes and links in the network. Application layer approaches utilize statistics from many PLM devices [46] to predict information about the grid. The latter two approaches require prior knowledge of the grid regarding nodes and addresses, while Single-Point physical layer measurements tend to infer data blindly.
Finally, variations in the measurement representation domain provide a trade-off between the measurement complexity and the resolution, as proven for the reflectometry family in the following section.
III-B1 Single-Point Measurements
Reflectometry is a popular technique used for wire testing and line length estimation in various applications. It relies on the concept of signal reflections at impedance mismatch points [22]. Consequently, reflectometry is a good candidate for topology diagnostic and inference applications since distortions of the reflected signal reveal information about the communication medium. With simple processing, it also reveals initial information about line lengths and branching points without prior knowledge of the topology. Since reflectometry is based on the correlation of the incident and reflected signals, it enables the measurement of the reflection coefficient at impedance mismatch points, such that [69]. The impedance at load or mismatch points is then obtained According to equation (3). Analysis of signal delays, magnitude, and phase provides information about the discontinuity locations, which is useful for many grid inference applications. Reflectometry measurements are usually represented by the reflection coefficients in the range of [-1, 1]. There are different variations of reflectometry due to the deployment of different types of incident waves and hardware requirements. We discuss the following: Time Domain Reflectometry (TDR), Frequency Domain Reflectometry (FDR), and Time Frequency Domain Reflectometry (TFDR)in this section.
Time Domain Reflectometry: a short time raise voltage step wave is used in TDR as the incident signal. The measurement distance is proportionally related to the energy of the pulse signal, which can be controlled by adjusting the pulse width and magnitude. Reflections of the incident wave enable the detection and identification of line faults by simply analyzing the reflected signal magnitude and polarity using the reflection coefficient values. Measurement of the signal delay estimates the fault distance, given that the propagation speed is known. Although TDR is the simplest method among the reflectometry family in terms of hardware requirements, it has few limitations in practical grid inference implementations. Due to the cumulative attenuation of reflected signals at series line faults, TDR hardly identifies and locates multiple discontinuities on the same line. In addition, signal dispersion due to variations in frequency and propagation speed limits the accurate detection of reflected signals, which then causes reduced measurement resolution [21, 70, 71].
Frequency Domain Reflectometry: a set of linearly stepped sine waves are transmitted through the wires as incident waves. The measurement of different sine-wave properties, such as frequency, magnitude, and phase, provides variations of FDR. Frequency Modulated Carrier Wave (FMCW) measures frequency shifts between the incident and reflected wave to identify and locate faults. The incident wave uses a liner function (usually a ramp) to supply variable frequency. The frequency shift at the reflection detection instant can be converted to time delay using the speed at which the frequency sweeper operates, which can be converted to distance, assuming the propagation speed is known. Additionally, there existed other variants of FDR such as Wideband-FDR (W-FDR), Phase Detection-FDR (PD-FDR), and Standing Wave Ratio-FDR (SWR-FDR)[21, 72, 73].
Time-Frequency Domain Reflectometry: a special signal combination is used as the incident wave, that is, the Gaussian enveloped chirp signal. After the reflection happens, a coupler at the source separates the generated signal from the reflected signal. Consequently, a cross-correlation function identifies and locates the faults along the wire. Apart from the higher complexity of this method, it provides higher resolution and accuracy in faults and discontinuity detection than the previous methods, as it captures both time and frequency information simultaneously [42].
Impedance frequency spectroscopy is a method to estimate the line impedance for frequency sweep signals. Estimating the impedance response is helpful for fault detection and possibly line discontinuity identification. However, traditional Electrical Impedance Spectroscopy (EIS)is a time-consuming process. Recently, there were some modifications to adapt EIS in PLMs as Broadband Impedance Spectroscopy (BIS)using Orthogonal Frequency Division Multiplexing (OFDM)schemes. BIS is a faster process than EIS with an expected reduced accuracy [74].
In contrast, RMS and noise measurements do not require signals to be transmitted by PLMs. This type of measurement is directly extracted from the power signals flowing through the devices.
III-B2 Point-2-Point Measurements
These measurements include all that depends on a packet exchange between two or more network devices on the physical or network layers. OFDM channel estimation is one prevalent P2P measurement method used in PLC systems utilizing the OFDM transmission scheme. OFDM modulation enables the injection of pilot symbols known to the transmitter and receiver over multiple pilot sub-carriers. This allows the receiver to estimate the channel in terms of the CTF. In addition, OFDM-enabled PLC systems can adapt other measurement techniques such as the EIS and Time of Arrival (ToA)estimation of the multipath propagation model [74, 75]. However, in the latter case, ToA estimation over OFDM pilots adds complexity to the system as it requires data collection and a parameter estimation algorithm to converge the solution. Calculations of the line length (and hence the distance between two nodes) are feasible based on the knowledge of signal propagation time and propagation speed , s.t.: . However, this requires an accurate estimation of the signal propagation time, which is challenging in PLNs due to multipath propagation. There exist different proposed methodologies to estimate the time of propagation (AKA: Time of Flight (ToF), and signal propagation delay). On the physical layer, OFDM pilots and signal cross-correlation are methods to estimate the propagation time. On the network layer, the NTP handshake enables the estimation of signal travel time through round trip time estimation. Traceroute returns information about node connections and adjacent links through the routing path. PRIME Keep-Alive mechanism is used to infer topology information based on the physical layer analysis of energy conservation at branch points.
III-B3 Multi-Point Measurements
Signal and operation statistics collected from smart meters and other PLC devices can be used to infer grid information. Measurements of energy flowing between devices can be used to extract nodes’ connections based on energy conservation laws. Similarly, Co-located devices are expected to provide correlated power and voltage level measurements, which helps identify feeder assignments in the network. Finally, the data transmission patterns provide insights into the grid’s physical activities. Although Multi-Point measurements are extracted from individual devices at the physical layer, they are treated as application data since they are regularly logged for general purposes. Additionally, they are considered Multi-Point because data collected from many devices are correlated and analysed to find outlaws or matching operational patterns, which does not apply to single-device data.
III-C PLC Processing Methods
In this section, processing refers to the post-sensing computations done on the collected measurements to produce data for the final analysis algorithms. Two main methods are considered for measurement processing: parametric and non-parametric [76]. On the one hand, non-parametric processing is the computation that causes the transformation of measurements’ diversity or the extraction of measurements’ hidden features, such as peaks. Fast Fourier Transform (FFT), Inverse Fourier Transform (IFT), cross-correlation, thresholding, and peak extraction are examples of non-parametric methods.
On the other hand, parametric processing is the estimation of one or more unknown parameters from a given signal model or set of equations. This method requires collecting data to form a system of equations and then applying the parameter estimation algorithms (e.g., subspace algorithms) to find the solution. ToA estimation via time-shifted OFDM signals and distance estimation via BIS are examples of parametric processing methods.
III-D Data Analysis Methods
The data analysis phase is the final stage, where final inference results are expected to be produced. The way data can be analyzed highly depends on the purpose of analysis and the application. The main two analysis methods are signal analysis and Machine Learning (ML). Signal analysis for topology estimation is mainly the iterative analysis of peaks or distance information to form the topology graph. Despite the different variants, it all starts with a simple initial topology (single node or two connected nodes). Then all possibilities of merging points to the current graph are considered. Indeed only one topology is expected to be correct. Hence an evaluation runs at every iteration to accept or reject the new changes based on the chosen evaluating metric. Until the final iteration, the algorithm considers all collected measurement points and produces a final result which might include multiple candidate solutions to the problem.
On the other hand, baseline comparison was only observed for anomaly detection. It mainly requires capturing the grid response (e.g., CFR, CIR, or others) in healthy conditions, considered a baseline. Consequently, the monitoring devices capture the grid response periodically and compare the current response with the baseline. Based on the measured and compared quantities, a threshold is set at which a fault or anomaly is presented. Alternatively, parameter-adjustable models are used; cables or faults are analyzed and modelled with an analytical expression. The fault expression has multiple unknown parameters which describe the fault nature. Hence, the extensive search of these parameters to match the cable measurements leads to fault detection and identification.
Machine learning models, such as Support Vector Machines (SVMs)and Neural Networks (NNs), were recently used to detect anomalies in the power grid. Such models require collecting a high number of measurements for several conditions, such as healthy, faulty lines, and load variations. The model must be trained before the system deployment, and the training phase should be repeated when the data set is updated.
IV Review of PLC grid information inference for Smart Grid Applications
This section presents a study of the research contributions related to grid monitoring and cybersecurity fields of PLC-GII. The contributions are presented in three subsections: topology inference, anomaly detection, and cybersecurity. We aim to describe each work in brief words and compare its features with related ones.
IV-A Topology Inference
It was stated previously that topology inference is a distance estimation problem of grid discontinuities. Hence, given the taxonomy of methodologies provided in Section III, PLC-based topology inference works can be divided into physical layer-based and higher layer-based distance estimation approaches, Table III Presents a summary of the topology inference contributions and their features. In addition, Table IV compares the features and efficiency of topology graph prediction algorithms.
| References | Application | Layer | Measurement Technique | CSI | Setup | Summary |
| [66] | Topology Estimation | PHY | FDR | ✓ | Single-Point | CFR was obtained via signal reflections correlation, CIR was then used to calculate the estimated discontinuity distances based on peak occurrence time. The graph is estimated via Peak-by-peak processing. |
| [42] | PHY | TFDR | ✓ | Single-Point | TFDR is used to measure discontinuity distances with high resolution () and less complexity. The distances are fed to a node-by-node algorithm to predict the graph. | |
| [77] | PHY | FDR | ✗ | Extended-Single-Point | CoMaTeCh algorithm runs on a central node to predict topology parameters and graphs based on the FDR distance estimation of multiple PLC nodes. | |
| [78, 75] | PHY | OFDM Pilots | ✓ | Extended-P2P | OFDM pilot transmission of all node pairs are used to estimate the signal time of arrival on a parametric estimation basis. RNJA and DNRA predict the topologies in [78] and [75], respectively. | |
| [67, 68] | Network | NTP Handshake | ✗ | Extended-P2P | NTP handshake protocol is used as the distance measurement technique based on ToA. While [67] uses RNJA, [68] uses a hypothesis testing approach based on GLRT for graph prediction. | |
| [43] | PHY | Impedance measurements | ✗ | Extended-Single-Point | Based on the prior knowledge of load and cable parameters, the admittance is measured at all node ends. The topology graph and line length are then derived correctly in robust networks. | |
| [44] | Topology Reconstruction | PHY | ToF | ✗ | Extended-P2P | Propagation delays between indoor network outlets are collected using a pulse emitter and receiver. The outlet pair distances are then calculated based on matrix equations and prior grid information. |
| [79] | PHY | ToF | ✗ | Extended-P2P | Distance ranging was approached based on the two-way handshake protocol to reconstruct the address-distance pairs of all nodes. The node neighbors are calculated based on the shortest direct paths. | |
| [45] | Network | Traceroute | ✗ | Extended-P2P | Traceroute protocol is used to discover the message hubs between two nodes. The collected nodes’ responses helped reconstruct the topology and predict the node connections. | |
| [80] | Topology Mapping | Network | Keep-Alive / KCL | ✗ | Extended-P2P | PRIME Keep-Alive Packets are used to construct the meters’ current RMS values. The analysis of these measurements provides information about the correct feeder assignment of each device. |
| [46, 47] | Application | Energy measurements. | ✗ | Multi-Point | Voltage measurements collected from smart meters were used for feeder identification and grid mapping. Meter grouping was approached by signal correlation of the meter measurements. |
| Algorithm | Input | Output | Convergence Ratio | Evaluation Metric | Advantages | Disadvantages/Limitations |
| Peak-by-peak [66] | • CIR peaks | A set of possible topologies | Higher for longer measurement ranges | FDR consistency | • No prior grid information is required. | • Complexity grows exponentially with the number of nodes. • Includes redundant search of branches. |
| Node-by-node [42] | • • CIR peaks | A set of possible topologies | Higher for smaller and distances | Path lengths consistency with peak locations | • Amiguity rate is in the worst case. | • Requires prior grid information: . • Works only for indoor and similar PLC networks. |
| RNJA [78] [67] | • Distances • | A single binary tree topology | High for robust measurement methods | Distance from root node | • A single solution is provided. | • Requires prior grid information: topology type and number of nodes. • Works only for tree topology (binary trees). |
| CoMaTaCh [77] | • Multi-node CIR | A single tree topology | Higher for higher number of measurement points | CIR consistency | • Few nodes are required to be PLC-equipped. | • Works only for tree topology. |
| Hypothesis testing [68] | • Shortest Time Paths (STPs) | A binary neighborhood matrix for all nodes | High for robust measurement methods | Likelihood probability | • A-GLRT provides simplifications of F-GLRT for online deployments. | • Works for loop-less topologies. • Does not provide graph or node connections. |
| DNRA [75] | • Distances • Root node • • Electrical length resolution | A single tree topology | High for robust measurement methods | Distance from root node | • Less complexity () than RNJA (). • A single solution is provided. | • Requires prior grid information: topology type and number of nodes. • Works only for tree topology and targets outdoor SMGs. |
IV-A1 Topology Inference Based on Physical Layer Techniques
Using a simple setup to blindly infer topology parameters and node connections, Ahmed et al. proposed an algorithm to estimate the PLN network topology based on distance measurements collected via FDR [66]. The proposed technique correlated the reflections of multiple frequency-shifted signals over a specific measurement bandwidth to reconstruct the channel frequency response. Consequently, distance measurements were obtained from the CIR using the IFT and the signal propagation speed. CIR produces a final graph consisting of peaks at discontinuity locations. As for the graph prediction algorithm, peaks of the CIR plot are processed one by one regardless of the peak magnitude or phase to form a list of candidate topologies at each peak processing time (iteration). Based on the consistency of the measured CIR and every candidate topology’s simulated CIR, topologies are either accepted for the next iteration or rejected. However, since the complexity of the algorithm grows exponentially with peaks’ count, and the resolution measurement of the FDR method is relatively small (), Zhang et al. proposed a more efficient algorithm based on a higher resolution distance measurements [42]. Distances are estimated based on a joint TFDR approach which provides a much higher resolution () with a reduced measurement bandwidth. Like the peak-by-peak algorithm, discontinuity locations are only considered for the inference algorithm operating node-by-node. For this algorithm to run successfully, the expected maximum number of nodes in the network must be provided in advance. However, the greedy node-by-node search algorithm follows a similar concept to the peak-by-peak approach since it compares the theoretical path lengths of the candidate set to the measured ones iteratively as an evaluation metric. Ravishankar et al. combined CTDR and FDR in a hybrid method to estimate the bus topology. Multiple measurement points are required to obtain the CTDR response, revealing the initial approximate topology. The genetic algorithm (GA) was then used to refine the estimation by the MSE comparison of computed and measured FDR responses of the estimated and actual topology, respectively [81, 82].
Mlynek et al. [83], and Ulrich et al. [77] investigated the impact of line discontinuities on signal propagation between multiple points via the study of the channel impulse response. Although the setup in [83] tends to be P2P than Single-Point measurement, it was limited to only the CIR plots comparison of different topologies for path length estimation. In contrast, the work in [77] used the CIR of the FDR measurements from many network devices to propose an algorithm that predicts the network connections. Based on the CIR Wide Sense Symmetry (WSS)property between two measurement devices. Distances between node pairs and the intermediate nodes are extracted, and connections are added to the candidate topology. Like previous algorithms, the simulated CIR of the candidate topologies correlated to the measured one is used as an evaluation metric of the candidate topologies. Passerini et al. investigated the possibility of PLN topology estimation based on admittance measurements only [43]. The model solution relies on transmission line theory to relate the line length connecting two nodes with the network and load admittance measurements at the two ends. The algorithm targets the topology estimation in PLNs without noise, yet further analysis was done to understand the impact of noise on the algorithm. However, since this method does not guarantee an online measurement of the load’s admittance, it is advised to use FDR techniques or other real-time impedance estimation methods such as the one in [39]. Aouichal et al. deployed multiple pulse emitters and receivers inside an indoor network to measure the distances between outlets based on the propagation delay of impulses (i.e., ToF). The distances between the pair outlets are obtained based on matrix equations. This method highly depends on the prior information of the topology as the binary matrix stores the outlet connection equations [44]. ToF was also approached by Costabeber et al. to compute the distances between nodes to reconstruct each node’s local topology based on shortest direct paths [79]. This ranging approach was part of a token-based DMG control model to deliver power efficiently to loads.
Parametric and non-parametric methods of distance estimation in PLNs based on end-to-end communication and reflectometry were discussed in [76]. Subsequently, Ahmed et al. used the frequency-shifted time-delayed OFDM samples to estimate ToA based on channel frequency response derivations [78]. The same measurement method was approached in [75], with a different choice of the parameter estimation algorithm. Ahmed et al. used the subspace method to obtain the missing ToA parameters. At the same time, [75] used the Bayesian Compressed Sensing (CS)method to improve the estimation under high Signal to Noise Ratio (SNR)conditions and to increase the spectrum efficiency with reduced pilot overhead. In both cases, The estimated end-to-end distances are transmitted to a central node THAT runs the topology estimation algorithm. Considering a tree topology, the Rooted Neighbor-Joining Algorithm (RNJA)was used in [78] to combine the leaf nodes based on the reported distances until one final leaf node remains unlinked. Dynamic Network Reconstruction Algorithm (DNRA)[75] works similarly but without bulk-inputting all the node-pair measurements. However, both algorithms have a good convergence rate and tolerance to the error in path length estimation.
IV-A2 Topology Inference Based on Higher Layers Techniques
Network protocols such as NTP and traceroute can infer network topology parameters based on signal propagation time estimation. That said, previous contributions utilized NTP to estimate the Shortest Time Path (STP)between two nodes in moderate to high SNR environments to have a high detection accuracy of ToA [67, 68]. Consequently, Erseghe et al. followed a hypothesis-based testing method to decide node connections to neighboring nodes relying on the generalized likelihood ratio test (GLRT) to strengthen the correct hypothesis selection rate [68]. Likewise, Ahmed et al. used the estimated STP measurements to input the RNJA algorithm. Most importantly, with the end-to-end measurements, it can now detect and estimate the distance of a PLC-unequipped node in the middle of two PLC-equipped nodes. Similarly, [45] implemented the topology reconstruction algorithm based on traceroute data collected from distributed nodes. The traceroute data include the Internet Control Message Protocol (ICMP)command and Time to Live (TTL)values to identify routers on the path. The topology reconstruction algorithm works in three phases to classify nodes in a virtual topology, generate merging options, and iteratively connect links until the options set is null and the final topology is obtained. The PRIME Keep-alive control packets are used in [80] to map feeders to nodes based on the concept of Kirchhoff’s current law. The RMS current of each signal was extracted and mapped to the transmitter using an inductive coupler at each feeder end. Statistical analysis is then applied to identify the location of PRIME devices with respect to feeders. Application layer data processing based on meter statistical measurements, such as energy and voltage measurements, showed potential success in topology inference. Meter energy measurements were used in [46] for phase nodes and topology identification based on the energy conservation concepts in a distributed network. Voltage measurements of many meters were correlated and analyzed to provide node mapping to topology sections and discover feeder assignment [47].
| Reference | Fault Type | Classification | Severity | Location | Measurements | Summary |
| [84] [85] [86] | HIF | ✗ | ✗ | ✗ | Input impedance | Detection of HIF in CENELEC A and BB-PLC bands based on the evaluation and analysis of the measured input impedance . A baseline model approach was followed for varying topology types and parameters. |
| [49] | HIF or broken conductor | ✗ | ✓ | CIR | Reflectometric and E2E measurements were used to construct the CIR, which was compared to a reference CIR in a healthy state to determine the fault location. | |
| [50] | ✗ | ✗ | ✗ | Input impedance | Generalization of the work proposed in [86] to cover the multi-conductor transmission lines configurations. | |
| [87][51] | WT | Localized, distributed, or load variation | ✓ | ✗ | CFR | Water Treeing (WT) detection in XLPE cables based on a WT cable aging model and PLC CFR measurements. ML models enabled the classification and evaluation of fault severity and load variations. |
| [52] | Thermal | ✗ | ✗ | CFR | Cable degradation due to thermal conditions were modeled for PILC cables, and PLC CFR measurements were used to detect and classify faults in a similar manner to [51]. | |
| [48] | WT | ✓ | ✓ | CIR & JTFDR | A complete ML framework for WT fault detection, classification, and localization was proposed based on the findings of [51]. The fault localization was done based on the CIR estimation of JTFDR. | |
| [14][53][40] | N/A | ✗ | ✓ | CFR | The proposal of fault detection [53][40] and localization algorithm [40] based on the chain representation model as given by the theoretical analysis in [14]. | |
| [74] | ✗ | ✗ | ✓ | Input impedance | Input impedance measurements are used to match the different fault properties obtained by the extensive search of parameters given in the line fault model. | |
| [88] | Ground | ✗ | ✗ | ✓ | Impedance estimation via CFR | CFR measurements of PLMs were used to estimate the real-time cable impedance, followed by ML-based analysis to predict the cable condition. |
| [89] | Aging | ✗ | ✗ | ✓ | CTF | Detection of aged cable segments based on the analysis of PLM CTF measurements via advanced ML models. |
| [90] | Soft | ✗ | ✗ | ✓ | estimation | Online Transmission coefficient estimation was used to build a soft fault detection algorithm considering complex topology configurations and real-world data validation. |
IV-B Anomaly Detection
PLC-based anomaly detection contributions were found to cover fault type and location identification. The proposed methods to detect and locate faults vary slightly, but the majority can be classified as physical layer approaches. Table V Presents the main anomaly detection contributions and their features.
HIF are crucial and challenging to detect in large distribution networks [91]. Milioudis et al. studied the possibility of HIF detection using PLC signals in the CENELEC A, and BB-PLC bands [84]. A detailed study was conducted to understand the effect of fault locations and severity on the impedance frequency response. HIFs model was proposed as a parallel impedance element that affects the overall input impedance measured at line ends. Consequently, with frequency response obtained in healthy conditions, HIFs can be detected by the baseline model comparison method since HIFs produce detectable changes to the frequency response. Nonetheless, the work was extended in [85] to include complex topologies and further examine some parameters related to the earth’s electromagnetic properties. Altogether, the efforts were combined in [86] followed by useful considerations for the practical implementation aspects of the proposed method. Following that, a method for HIF location estimation was proposed based on the CIR baseline model comparison of reflectometric and P2P measurements simultaneously, using two PLC devices at the line ends [49]. The method was tested on a real network, but it requires some pre-deployment experiments to choose the optimal frequency ranges for the measurements to be accurate. Finally, as to cover the configuration variations between single and multi-conductor transmission lines, the previous works were extended to simulate and test HIF detection in Multiconductor Transmission Line (MTL)configurations. Results showed that a single PLC device installed on one phase could detect faults on the other conductors [50]. De Oliveira et al. presented an analytical study of different PLC-generated time domain pulses (i.e., Hermi-tian Symmetric OFDM (HS-OFDM), impulsive Ultra-Wideband (UWB), and Chirp Spread Spectrum (CSS)for HIF detection [92]. The corresponding closed-form solutions and autocorrelation functions were derived. Numerical results showed that UWB pulses yield a larger number of reflectograms, while HS-OFDM and CSS pulses provide higher reflectogram quality and better resolution in the same time intervals. Input impedance measurements were analyzed quite differently in [74]. With a similar fault model as [84], impedance spectroscopy in the BB-PLC band is used to detect and locate line faults based on a parameter-adjustable model.
Relying on the ready-deployed functionality of periodic CFR estimation in PLC devices, Forstel et al. considered the diagnosis and monitoring of Cable degradation in PLNs [87]. Water Treeing (WT)degradation in Cross-Linked Polyethylene (XLPE)cables was studied and modelled, where WT impact on CFR was analyzed. CFR-based detection of WT is feasible owing to the significant variations of CFR in terms of frequency shifting and increased attenuation caused by WT. With load variations in mind, SVM was used to train an ML model for binary classification of intact or degraded cable. Consequently, the work was extended with the same convention to expand the classification problem to identify the fault condition, whether localized or homogeneous and predict the severity and length of the affected cable part [51]. Furthermore, since Similar effects on the CFR are caused by thermal degradation in Paper-Insulated Lead-Covered (PILC)cables [52], the proposed ML framework [87] was modified to fit the automatic detection and severity estimation of thermal degradation faults. Finally, based on the previous findings, a complete ML-based framework was proposed to aid the online and automatic grid diagnosis and monitoring for fault identification and localization based on PLC-CFR and Joint Time Frequency Domain Reflectometry (JTFDR)measurements, respectively [48]. Additionally, Yang et al. proposed a scheme to detect power line faults using CFR measured between two PLMs [93]. Following the baseline comparison mode, variations of CFR due to changes in power line parameters such as conductivity constant, relative permeability constant, and relative magnetic permeability can lead to the identification of different line faults. Liang et al. considered detecting ground fault through real-time impedance estimation via CFR [88]. Inversion analysis and variational model decomposition were used to estimate the impedance and extract features for the ML model to identify the cable condition.
Passerini et al. provided a theoretical study of the high-frequency signal propagation phenomena through power lines, considering the presence of faults [14]. The study was concluded by proposing two models, namely, the chain representation and superposition of effects, that can extract information about PLN anomalies. The two models exploit three main measurements, namely: input admittance, reflection coefficient, and CTF, based on reflectometric and end-to-end measurements. Consequently, these findings were used to design two algorithms for faults detection, classification, and localization [53]. OFDM pilots estimate the line input admittance; based on the superposition model, faults are classified as distributed, localized, or load variations. Admittance variations are then used to locate the topology branch at which the fault occurred. A similar measurement approach and channel chain representation model was used in [40]. PLC channel was estimated using OFDM pilots, and the channel transfer function was considered as a product of the healthy and damaged parts of the line, s.t.: [40]. Therefore, a pre-recorded CFR of the healthy line state is used as a baseline model to extract the CTF damaged component , which represents an impulse in the time domain representation of the channel transfer function. Hong-shan et al. proposed a detection method of aged cable segments based on advanced ML models (i.e., sparse autoencoders and convolutional NNs). The ML models can detect and locate the aging segment based on CTF measurements [89]. Soft faults were proposed to be detected based on the online transmission coefficient estimation in PLC systems [90]. An algorithm was further developed to deal with complex topology networks by segmenting them into multiple Y-shaped sub-networks. The proposed algorithm was validated on data collected from a real test bench.
Smart meter signal strength measurements were used to discover anomalous operating behavior among a set of meters. Connection problems, such as wrong node assignments, rapid signal level drop, and frequent signal level fluctuations, are predicted using signal strength analysis [54]. Rao et al. identified 4 metrics that aid smart meter outlier detection: jumpiness score, flatness score, signal drop, and Z-score. Huo et al. proposed an anomaly detection and identification method for cable faults based on time series forecasting [94]. The model is completely agnostic to the topology, cable, and fault parameters and does not rely on a baseline model as a classification reference. ML and non-ML-based CSI time series predictors (i.e., ARIMA, L2Boost, FFNN, LSTM), were considered and evaluated on different data sets. A time series model was also proposed in [95] to detect anomalies in network traffic based on protocol field abstraction and Fourier transform. The model is expected to be applied to different industrial network protocols and detects several cyber attacks.
IV-C Cybersecurity
VoltKey [58], and PowerKey [57] are two physical layer key generation schemes that exploit channel measurements in power lines to extract common keys for secure communication. Given a trusted electrical domain to which adversaries have no physical access, a pair or multiple IoT devices can run VoltKey or PowerKey schemes to obtain a common shared secret key. VolKey starts with independent noise measurements at possibly different sampling rates; the two communication ends then re-estimate their sampling rates to obtain consistent noise measurements. VoltKey accounts for transmission delay by preamble transmission and identification for time synchronization. Finally, the bit sequence is obtained by segmenting and indexing noise measurements based on the maximum absolute voltage value per segment. On the other hand, devices establishing the PowerKey scheme compute the FFT of the Electromagnetic Interferences (EMI)measurements and extract the bit sequence based on frequency indexing and EMI spikes detection. Unlike VoltKey, this method requires offline processing to identify the frequency windows of the common least correlated EMI spikes for all devices. Key reconciliation based on error correction code is then applied to eliminate any bit errors in the key sequences at the two devices with minimum information exchange.
The extraction of common bit sequences from PLN signals is not limited to EMI and noise, as other sources of common randomness exist in the channel. Passerini et al. presented a detailed discussion of the symmetry and reciprocity of PLC channels and the conditions under which PLC channels can provide key generation protocol requirements [96]. Consequently, two key generation schemes were proposed based on the reciprocity of PLC channels between two devices. The two schemes rely on finding common CSI for both ends with minimal data exchange. Based on the voltage transfer function estimation, CIR was used to extract common bit sequences, yet this method is not preferred as it provides low key generation rates. In contrast, the channel transmission matrix estimation enables channel estimation in the two communication directions. Hence, CFR estimates (), and input impedance estimates () at both ends provide common information for key generation. However, at least one measurement ( or ) should be communicated by both the transmitter and receiver to enable the transmission matrix estimation.
Intrusion detection in PLC networks considers the detection of illegitimate physical access to the grid, which can be captured as topology changes. Fernandez et al. considered detecting the topology changes in a network based on the periodic generation and comparison of Power Line Identification (PL-ID)[20]. PL-ID is the generation of a unique bit sequence representing the channel impulse response between any two nodes in the network, based on a method to minimize the channel estimation error [97], and a CIR multilevel quantization scheme [98]. Nonetheless, Zhang et al. provided a method to detect topology changes based on Time Difference of Arrival (TDoA)of impulsive noise spikes, with the detection of the activity location [42].
V Discussion
In this section, insights about this research area, including limitations and possible future directions, are highlighted based on the study of previous PLC signal analysis methods and applications.
V-A Insights on Measurement Methods
-
•
Different alternatives are found for the distance estimation between nodes, varying from the physical layer to the network and higher layers. However, it was noted that the higher one goes in the OSI model, the less information can be obtained about the topology. For instance, when meter data are used (application layer), distances cannot be estimated. Yet, based on the behavior correlation of meters, one can only map the nodes to topological areas. In contrast, physical layer approaches always provide more details about the topology, which include distances and node connections. Additionally, Single-Point and P2P measurement methods also provide distinctive features. While P2P measurement methods require partial prior knowledge of the topology, reflectometric techniques can operate in complete blindness. Nonetheless, P2P measurement techniques provide higher resolution and reduced bandwidth measurements. On the other hand, network and application layer methods provide anomaly information about node failure or misbehavior, while physical layer methods can identify and locate cable faults.
-
•
The anomaly detection and graph derivation algorithms either depend on the knowledge of cable and load parameters or assumptions about the signal propagation nature through cables. In this regard, more robust measurement methods are required, with less environmental dependency and more tolerance to noise and measurement errors. Alternatively, an integration between measurement and precise environment parameter estimation methods is needed to overcome this limitation.
-
•
P2P and Multi-point measurement setups lack the discussion and design of measurement synchronization and coordination methods. This is important for noise and channel estimation-based measurement methods in time-variant networks, which is the case in PLC networks.
-
•
The vast majority of the contributions were only tested and validated on data generated from simulation environments. Hence, practical validation must be considered as it might introduce new unseen errors or design problems that overburden the implementation of the proposed models.
V-B Insights on Topology Inference
-
•
The frequency at which measurements occur and topology estimation algorithms run is an important parameter. That is usually related to the algorithm’s efficiency, complexity, and maintaining up-to-date records. Estimation frequency can be classified as fixed or dynamic. Most of the covered proposals follow the fixed frequency estimation method, although the re-estimation frequency is not specified. In contrast, [42]provided a method for the dynamic detection and estimation of topology based on the topology change event triggers (i.e., impulsive noise). Such dynamic topology estimation methods provide insights into possible topology changes and reduce estimation complexity for updating the topology parameters and graph.
-
•
The proposed algorithms are capable of estimating and reconstructing the graphs of tree topologies only, which do not have any loops or cycles. Therefore, methods found in the literature fit LV and indoor PLC network configurations as they usually follow the tree topology structure. In addition, current algorithms provide predictions of topology parameters and topology graphs in terms of node connections, yet no information can be retrieved about the nodes’ type, status, and health.
-
•
The topology retrieval rate is an important property of the topology inference model, which provides information about the ratio of predicted topology to the actual one. Such a feature could provide information about possible blind spots in the network where nodes possibly are not detected or faults prevented signal propagation. The estimation range, in terms of the longest inferred distance by a measurement node, could be the metric for the topology retrieval rate. In other words, the overlapping node measurements might provide details of the covered areas and the blind spots (unreachable areas) in the network. This method (or similar) was not approached, and this kind of validation metric was not prompted by any of the previous contributions.
V-C Insights on Anomaly Detection
-
•
The main limitation of the state-of-the-art fault detection techniques was the need for dedicated hardware and off-the-grid diagnosis. Hence, a common need among all PLC-based anomaly detection approaches was the online diagnosis and proactive communication to alert and report the precise fault type and location. Since the nature of a fault highly affects the remediation approaches, fault type identification and classification were considered in the new contributions. Regardless of all the development in fault detection methods, fault detection approaches are still focused on simple topologies (e.g., single line or wire-tap). Hence, more advanced algorithms to capture faults in complex topologies are needed to reduce setup complexity and deployment costs. This approach was proposed in [53], yet no analysis was done on different topology types.
-
•
One of the most important evaluation metrics of classification models, whether ML or non-ML based, is the false positives and negatives rates. In PLC environments, the channel state is variant and is affected by many activities at the same condition (e.g., fault condition). Hence it is imperative to consider these variations in the classification models. Load variations, for example, produce a considerable amount of noise, that affects the channel estimation output. Topology changes, on the other hand, produce significant changes in the channel frequency and impulse responses, causing a severe reduction in the accuracy of the detection algorithm. For the ML and the baseline fault detection models, it is mandatory to capture these variations in the classification model, which can be done by generating data sets that are environment-specific and cannot be generalized or transferred to other environments. Nonetheless, capturing all the possible topological changes and fault occurrences in the grid is hard, especially in the LV grids.
-
•
Baseline model and ML-based anomaly detection methods lack the description and identification of data specifications used to train and evaluate the proposed models. This is expected to have a great impact on the model as data sets capture distinctive features from the data collection sources, (e.g., topology parameters, noise, cable parameters, load parameters, and geographical parameters). In addition, understanding the data sets yields deeper analysis and understanding of the proposed models’ efficiency, robustness, and accuracy.
V-D Insights on Cybersecurity
-
•
Physical layer key generation approaches are promising in terms of the final results. However, they are considered weak in terms of the attack model. VoltKey and PowerKey consider the trusted domain concepts for the existence of common randomness. However, the attack model places a very strong assumption that the attacker is isolated from the trusted domain. In addition, they lack further security considerations, such as insider threats and TEMPEST attacks. Additionally, the possibility of utilizing these key generation schemes to generate and distribute multi-party keys was not emphasized or analyzed. Other possible cryptographic problems to be investigated are group encryption schemes and broadcast encryption based on physical layer key generation in PLNs.
-
•
It was noticed that the field is not oriented towards detecting and analyzing cyber attacks using physical layer techniques. Works were found addressing the security vulnerabilities of some protocols in PLC environments [99, 100, 101], yet no PLS-based solutions were found addressing the detection and prevention of such vulnerabilities.
VI Conclusion
In this paper, we reviewed the research contributions related to a new application area of power line communications, called PLC Grid Information Inference (GII). A new classification of PLC applications was introduced and discussed. Among those, topology inference and its variations stand out, since they are essential applications for asset management, control, grid monitoring, and security. For instance, automatic online anomaly detection significantly improves grid maintenance and control; in addition, security and privacy can be achieved at the physical layer for enhanced attack detection and prevention.
As the above cited research areas lack the proper identification of methodologies and terminologies, a detailed classification of GII methodologies was introduced. GII methodologies were classified into measurement, processing, and analysis methods, and further categorizations were provided for each methodology. Nonetheless, the activity in this area is on the rise, especially with the adoption of advanced ML models. The field encounters well-known limitations, such as fragile measurement methods, lack of data collection coordination in time-variant networks, lack of understanding of data sets, and lack of practical validation. Finally, our contributions also identified the limitations of the cited research area and highlighted possible new research problems that should improve PLC adoption for Smart Grid applications.
Acknowledgement
This publication is supported by Iberdrola S.A. as part of its innovation department research studies. Its contents are solely the responsibility of the authors and do not necessarily represent the official views of Iberdrola Group.
References
- [1] Cristina Cano, Alberto Pittolo, David Malone, Lutz Lampe, Andrea M. Tonello, and Anand G. Dabak, “State of the Art in Power Line Communications: From the Applications to the Medium,” IEEE Journal on Selected Areas in Communications, vol. 34, no. 7, pp. 1935–1952, 2016.
- [2] Melike Yigit, V. Cagri Gungor, Gurkan Tuna, Maria Rangoussi, and Etimad Fadel, “Power Line Communication Technologies for Smart Grid Applications: A Review of Advances and Challenges,” Computer Networks, vol. 70, pp. 366–383, 2014.
- [3] Stefano Galli, Anna Scaglione, and Zhifang Wang, “For The Grid and Through The Grid: The Role of Power Line Communications in The Smart Grid,” Proceedings of the IEEE, vol. 99, no. 6, pp. 998–1027, 2011.
- [4] M. R. Fliss, J. Hernandez Fernandez, A. Omri, and G. Oligeri, “Nb-plc successful transmission probability analysis,” in 2019 2nd International Conference on Smart Grid and Renewable Energy (SGRE), 2019, pp. 1–6.
- [5] Daniel E. Olivares, Ali Mehrizi-Sani, Amir H. Etemadi, Claudio A. Cañizares, Reza Iravani, Mehrdad Kazerani, Amir H. Hajimiragha, Oriol Gomis-Bellmunt, Maryam Saeedifard, Rodrigo Palma-Behnke, Guillermo A. Jiménez-Estévez, and Nikos D. Hatziargyriou, “Trends in Microgrid Control,” IEEE Transactions on Smart Grid, vol. 5, no. 4, pp. 1905–1919, 2014.
- [6] C.A. Hernandez-Aramburo, T.C. Green, and N. Mugniot, “Fuel Consumption Minimization of A Microgrid,” IEEE Transactions on Industry Applications, vol. 41, no. 3, pp. 673–681, 2005.
- [7] Pravin P. Varaiya, Felix F. Wu, and Janusz W. Bialek, “Smart Operation of Smart Grid: Risk-Limiting Dispatch,” Proceedings of the IEEE, vol. 99, no. 1, pp. 40–57, 2011.
- [8] M. Caprolu, J. Hernandez Fernandez, A. Alassi, and R. Di Pietro, “Increasing renewable generation feed-in capacity leveraging smart meters,” in 2020 IEEE Green Energy and Smart Systems Conference (IGESSC), 2020, pp. 1–7.
- [9] Jan Machowski, Zbigniew Lubosny, Janusz W Bialek, and James R Bumby, Power System Dynamics: Stability and Control, John Wiley & Sons, 2020.
- [10] F.F. Wu, K. Moslehi, and A. Bose, “Power System Control Centers: Past, Present, and Future,” Proceedings of the IEEE, vol. 93, no. 11, pp. 1890–1908, 2005.
- [11] Victor O. K. Li, Felix F. Wu, and Jin Zhong, “Communication Requirements for Risk-Limiting Dispatch in Smart Grid,” in 2010 IEEE International Conference on Communications Workshops, 2010, pp. 1–5.
- [12] Mustapha Muhammad Saidu, Shiva Pujan Jaiswal, Kuldeep Jayaswal, Shibamay Mitra, and Vikas Singh Bhadoria, “A Survey on: Automation of Micro Grid and Micro Distributed Generation,” Materials Today: Proceedings, vol. 49, pp. 3192–3196, 2022, National Conference on Functional Materials: Emerging Technologies and Applications in Materials Science.
- [13] Angel Esteban Labrador Rivas and Taufik Abrão, “Faults in Smart Grid Systems: Monitoring, Detection and Classification,” Electric Power Systems Research, vol. 189, pp. 106602, 2020.
- [14] Federico Passerini and Andrea M. Tonello, “Smart Grid Monitoring Using Power Line Modems: Effect of Anomalies on Signal Propagation,” IEEE Access, vol. 7, pp. 27302–27312, 2019.
- [15] Amir Mehdi Pasdar, Yilmaz Sozer, and Iqbal Husain, “Detecting and locating faulty nodes in smart grids based on high frequency signal injection,” IEEE Transactions on Smart Grid, vol. 4, no. 2, pp. 1067–1075, 2013.
- [16] Asier Llano, David De La Vega, Itziar Angulo, and Laura Marron, “Impact of Channel Disturbances on Current Narrowband Power Line Communications and Lessons to Be Learnt for the Future Technologies,” IEEE Access, vol. 7, pp. 83797–83811, 2019.
- [17] Federico Passerini and Andrea M. Tonello, “Full Duplex Power Line Communication Modems for Network Sensing,” in 2017 IEEE International Conference on Smart Grid Communications (SmartGridComm), 2017, pp. 213–217.
- [18] Jean Paul A. Yaacoub, Javier Hernandez Fernandez, Hassan N. Noura, and Ali Chehab, “Security of power line communication systems: Issues, limitations and existing solutions,” Computer Science Review, vol. 39, pp. 100331, 2021.
- [19] Werner Henkel, Abderraheem M. Turjman, Hayoung Kim, and Hisham K.H. Qanadilo, “Common Randomness for Physical-Layer Key Generation in Power-Line Transmission,” IEEE International Conference on Communications, vol. 2020-June, pp. 1–6, 2020.
- [20] Javier Hernandez Fernandez, Aymen Omri, and Roberto Di Pietro, “Power Grid Surveillance: Topology Change Detection System Using Power Line Communications,” International Journal of Electrical Power & Energy Systems, vol. 145, no. September 2022, pp. 108634, 2023.
- [21] Cynthia Furse, You Chung, Chet Lo, and Praveen Pendayala, “A Critical Comparison Of Reflectometry Methods For Location Of Wiring Faults,” Smart Structures and Systems, vol. 2, no. 1, pp. 25–46, 2006.
- [22] Qinghai Shi, Uwe Troeltzsch, and Olfa Kanoun, “Detection and Localization of Cable Faults by Time and Frequency Domain Measurements,” 2010 7th International Multi-Conference on Systems, Signals and Devices, SSD-10, , no. 2, 2010.
- [23] Federico Passerini and Andrea M. Tonello, “Power Line Communications for Grid Discovery and Diagnostics,” Encyclopedia of Wireless Networks, pp. 1–6, 2018.
- [24] Julio Romero Agüero, Erik Takayesu, Damir Novosel, and Ralph Masiello, “Grid Modernization: Challenges and Opportunities,” The Electricity Journal, vol. 30, no. 4, pp. 1–6, 2017, Special Issue: Contemporary Strategies for Microgrid Operation & Control.
- [25] Stan Mark Kaplan, Smart Grid: Modernizing Electric Power Transmission and Distribution; Energy Independence, Storage and Security; Energy Independence and Security Act of 2007 (EISA); Improving Electrical Grid Efficiency, Communication, Reliability, and Resiliency; Integrating New and Renewable Energy Sources, The Capitol Net Inc, 2009.
- [26] Ashish Ranjan Hota, Mahesh Juvvanapudi, and Prabodh Bajpai, “Issues and Solution Approaches in PHEV Integration to Smart Grid,” Renewable and Sustainable Energy Reviews, vol. 30, pp. 217–229, 2014.
- [27] Ataul Bari, Jin Jiang, Walid Saad, and Arunita Jaekel, “Challenges in the Smart Grid Applications: An Overview,” International Journal of Distributed Sensor Networks, vol. 10, no. 2, pp. 974682, 2014.
- [28] Muhammad Salman Yousuf and Mustafa El-Shafei, “Power Line Communications: An Overview - Part I,” in 2007 Innovations in Information Technologies (IIT), 2007, pp. 218–222.
- [29] A. Majumder and Jr. Caffery J, “Power line communications,” IEEE Potentials, vol. 23, no. 4, pp. 4–8, 2004.
- [30] Dietmar P. F. Möller and Hamid Vakilzadian, “Ubiquitous Networks: Power Line Communication and Internet of Things in Smart Home Environments,” in IEEE International Conference on Electro/Information Technology, 2014, pp. 596–601.
- [31] Gerd Bumiller, Lutz Lampe, and Halid Hrasnica, “Power Line Communication Networks for Large-scale Control and Automation Systems,” IEEE Communications Magazine, vol. 48, no. 4, pp. 106–113, 2010.
- [32] Jan Slacik, Petr Mlynek, Martin Rusz, Petr Musil, Lukas Benesl, and Michal Ptacek, “Broadband Power Line Communication for Integration of Energy Sensors within a Smart City Ecosystem,” Sensors, vol. 21, no. 10, 2021.
- [33] Freddy A. Pinto-Benel and Fernando Cruz-Roldán, “2-ASCET for Broadband Multicarrier Transmission over In-home and In-vehicle Power Line Networks,” in 2015 IEEE 18th International Conference on Intelligent Transportation Systems, 2015, pp. 1351–1356.
- [34] Massimo Antoniali, Andrea M. Tonello, Matteo Lenardon, and Andrea Qualizza, “Measurements and Analysis of PLC Channels in A Cruise Ship,” in 2011 IEEE International Symposium on Power Line Communications and Its Applications, 2011, pp. 102–107.
- [35] V. Degardin, I. Junqua, M. Lienard, P. Degauque, and S. Bertuol, “Theoretical Approach to the Feasibility of Power-Line Communication in Aircrafts,” IEEE Transactions on Vehicular Technology, vol. 62, no. 3, pp. 1362–1366, 2013.
- [36] Ivaylo Stoyanov, Teodor Iliev, Grigor Mihaylov, Elena Ivanova, and Panagiotis Kogias, “Smart grid communication protocols in intelligent service for household energy use,” in Cybernetics Approaches in Intelligent Systems, Radek Silhavy, Petr Silhavy, and Zdenka Prokopova, Eds., Cham, 2018, pp. 380–389, Springer International Publishing.
- [37] Konark Sharma and Lalit Mohan Saini, “Power-Line Communications for Smart Grid: Progress, Challenges, Opportunities and Status,” Renewable and Sustainable Energy Reviews, vol. 67, pp. 704–751, 2017.
- [38] Bilal Masood, M. Arif Khan, Sobia Baig, Guobing Song, Ateeq Ur Rehman, Saif Ur Rehman, Rao M. Asif, and Muhammad Babar Rasheed, “Investigation of Deterministic, Statistical and Parametric NB-PLC Channel Modeling Techniques for Advanced Metering Infrastructure,” Energies, vol. 13, no. 12, 2020.
- [39] Dong Liang, Huashan Guo, and Tao Zheng, “Real-Time Impedance Estimation for Power Line Communication,” IEEE Access, vol. 7, pp. 88107–88115, 2019.
- [40] Andreas M. Lehmann, Katrin Raab, Florian Gruber, Erik Fischer, Ralf Muller, and Johannes B. Huber, “A Diagnostic Method for Power Line Networks by Channel Estimation of PLC Devices,” 2016 IEEE International Conference on Smart Grid Communications, SmartGridComm 2016, pp. 320–325, 2016.
- [41] Mohammad Rihan, Applications and Requirements of Smart Grid, pp. 47–79, Springer Singapore, Singapore, 2019.
- [42] Chao Zhang, Xu Zhu, Yi Huang, and Gan Liu, “High-Resolution and Low-Complexity Dynamic Topology Estimation for Plc Networks Assisted by Impulsive Noise Source Detection,” IET Communications, vol. 10, no. 4, pp. 443–451, 2016.
- [43] Federico Passerini and Andrea M. Tonello, “On the Exploitation of Admittance Measurements for Wired Network Topology Derivation,” IEEE Transactions on Instrumentation and Measurement, vol. 66, no. 3, pp. 374–382, 2017.
- [44] Ismail Aouichak, Kassim Khalil, Imene Elfeki, Jean Charles Le Bunetel, and Yves Raingeaud, “Topology Identification Method for Unknown Indoor PLC Home Networks,” 2017 International Symposium on Electromagnetic Compatibility - EMC EUROPE 2017, EMC Europe 2017, pp. 6–9, 2017.
- [45] Xueliang Wang, Xun Dai, Huizhu Xian, Weiqiong Song, Baiyu Gao, Shuming Xu, Lin Pang, and Shuai Guo, “Fault Localization for Power Line Communications with Topology Inference,” Proceedings - 2019 International Conference on Intelligent Computing, Automation and Systems, ICICAS 2019, pp. 85–90, 2019.
- [46] Satya Jayadev Pappu, Nirav Bhatt, Ramkrishna Pasumarthy, and Aravind Rajeswaran, “Identifying Topology of Low Voltage Distribution Networks Based on Smart Meter Data,” IEEE Transactions on Smart Grid, vol. 9, no. 5, pp. 5113–5122, 2018.
- [47] Konrad Diwold, Matthias Stifter, and Paul Zehetbauer, “Network And Feeder Assignment Of Smart Meters Based On Communication And Measurement Data,” Proceedings - 2015 International Symposium on Smart Electric Distribution Systems and Technologies, EDST 2015, , no. September, pp. 541–546, 2015.
- [48] Yinjia Huo, Gautham Prasad, Lazar Atanackovic, Lutz Lampe, and Victor C.M. Leung, “Cable Diagnostics with Power Line Modems for Smart Grid Monitoring,” IEEE Access, vol. 7, pp. 60206–60220, 2019.
- [49] Apostolos N. Milioudis, Georgios T. Andreou, and Dimitrios P. Labridis, “Enhanced Protection Scheme for Smart Grids Using Power Line Communications Techniques-Part II: Location of High Impedance Fault Position,” IEEE Transactions on Smart Grid, vol. 3, no. 4, pp. 1631–1640, 2012.
- [50] Apostolos N. Milioudis, Georgios T. Andreou, and Dimitris P. Labridis, “Detection and Location of High Impedance Faults in Multiconductor Overhead Distribution Lines Using Power Line Communication Devices,” IEEE Transactions on Smart Grid, vol. 6, no. 2, pp. 894–902, 2015.
- [51] Yinjia Huo, Gautham Prasad, Lazar Atanackovic, Lutz Lampe, and Victor C.M. Leung, “Grid Surveillance and Diagnostics Using Power Line Communications,” 2018 IEEE International Symposium on Power Line Communications and its Applications, ISPLC 2018, pp. 1–6, 2018.
- [52] Yinjia Huo, Gautham Prasad, Lutz Lampe, and Victor C.M. Leung, “Cable Health Monitoring in Distribution Networks using Power Line Communications,” 2018 IEEE International Conference on Communications, Control, and Computing Technologies for Smart Grids, SmartGridComm 2018, pp. 1–6, 2018.
- [53] Federico Passerini and Andrea M. Tonello, “Smart Grid Monitoring Using Power Line Modems: Anomaly Detection and Localization,” IEEE Transactions on Smart Grid, vol. 10, no. 6, pp. 6178–6186, 2019.
- [54] Rakesh Rao, Srinivas Akella, and Gokhan Guley, “Power Line Carrier (PLC) Signal Analysis of Smart Meters for Outlier Detection,” 2011 IEEE International Conference on Smart Grid Communications, SmartGridComm 2011, pp. 291–296, 2011.
- [55] Sidney J. Golstein, François Rottenberg, François Horlin, Philippe De Doncker, and Julien Sarrazin, “Physical Layer Security in an OFDM Time Reversal SISO Communication With Imperfect Channel State Information,” IEEE Access, vol. 10, pp. 26778–26794, 2022.
- [56] Alberto Pittolo and Andrea M. Tonello, “Physical layer security in power line communication networks,” in Physical and Data-Link Security Techniques for Future Communication Systems, Marco Baldi and Stefano Tomasin, Eds., Cham, 2016, pp. 125–144, Springer International Publishing.
- [57] Fangfang Yang, Mohammad A. Islam, and Shaolei Ren, “PowerKey: Generating Secret Keys from Power Line Electromagnetic Interferences,” Lecture Notes in Computer Science (including subseries Lecture Notes in Artificial Intelligence and Lecture Notes in Bioinformatics), vol. 12570 LNCS, pp. 354–370, 2020.
- [58] Kyuin Lee, Neil Klingensmith, Suman Banerjee, and Younghyun Kim, “VoltKey: Continuous Secret Key Generation Based on Power Line Noise for Zero-Involvement Pairing and Authentication,” Proceedings of the ACM on Interactive, Mobile, Wearable and Ubiquitous Technologies, vol. 3, no. 3, pp. 1–26, 2019.
- [59] Wenfei Zhu, Xu Zhu, Enggee Lim, and Yi Huang, “State-of-Art Power Line Communications Channel Modelling,” Procedia Computer Science, vol. 17, pp. 563–570, 2013, First International Conference on Information Technology and Quantitative Management.
- [60] H. Meng, S. Chen, Y.L. Guan, C.L. Law, P.L. So, E. Gunawan, and T.T. Lie, “A Transmission Line Model for High-Frequency Power Line Communication Channel,” in Proceedings. International Conference on Power System Technology, 2002, vol. 2, pp. 1290–1295 vol.2.
- [61] F.T. Ulaby and U. Ravaioli, Fundamentals of Applied Electromagnetics, Pearson Education, 2015.
- [62] M. Zimmermann and K. Dostert, “A Multipath Model for the Powerline Channel,” IEEE Transactions on Communications, vol. 50, no. 4, pp. 553–559, 2002.
- [63] M. Gotz, M. Rapp, and K. Dostert, “Power Line Channel Characteristics and Their Effect on Communication System Design,” IEEE Communications Magazine, vol. 42, no. 4, pp. 78–86, 2004.
- [64] H. Meng, Y.L. Guan, and S. Chen, “Modeling and Analysis of Noise Effects on Broadband Power-Line Communications,” IEEE Transactions on Power Delivery, vol. 20, no. 2, pp. 630–637, 2005.
- [65] Luca Di Bert, Peter Caldera, David Schwingshackl, and Andrea M. Tonello, “On Noise Modeling for Power Line Communications,” in 2011 IEEE International Symposium on Power Line Communications and Its Applications, 2011, pp. 283–288.
- [66] Mohamed Osama Ahmed and Lutz Lampe, “Power Line Network Topology Inference Using Frequency Domain Reflectometry,” IEEE International Conference on Communications, , no. 3, pp. 3419–3423, 2012.
- [67] Lutz Lampe and Mohamed O. Ahmed, “Power Grid Topology Inference Using Power Line Communications,” 2013 IEEE International Conference on Smart Grid Communications, SmartGridComm 2013, pp. 336–341, 2013.
- [68] Tomaso Erseghe, Stefano Tomasin, and Alberto Vigato, “Topology Estimation for Smart Micro Grids via Powerline Communications,” IEEE Transactions on Signal Processing, vol. 61, no. 13, pp. 3368–3377, 2013.
- [69] S. Galli and D.L. Waring, “Loop Makeup Identification via Single Ended Testing: Beyond Mere Loop Qualification,” IEEE Journal on Selected Areas in Communications, vol. 20, no. 5, pp. 923–935, 2002.
- [70] S. Galli and K.J. Kerpez, “Single-ended Loop Make-up Identification-part I: A Method of Analyzing TDR Measurements,” IEEE Transactions on Instrumentation and Measurement, vol. 55, no. 2, pp. 528–537, 2006.
- [71] K.J. Kerpez and S. Galli, “Single-ended Loop-makeup Identification-part II: Improved Algorithms and Performance Results,” IEEE Transactions on Instrumentation and Measurement, vol. 55, no. 2, pp. 538–549, 2006.
- [72] B. Celaya and D.E. Dodds, “Single-ended DSL Line Tester,” in Canadian Conference on Electrical and Computer Engineering 2004 (IEEE Cat. No.04CH37513), 2004, vol. 4, pp. 2155–2158 Vol.4.
- [73] David E. Dodds, Muhammad Shafique, and Bernardo Celaya, “TDR and FDR Identification of Bad Splices in Telephone Cables,” in 2006 Canadian Conference on Electrical and Computer Engineering, 2006, pp. 838–841.
- [74] Antti Pinomaa, Jero Ahola, Antti Kosonen, and Tero Ahonen, “Diagnostics Of Low-Voltage Power Cables By Using Broadband Impedance Spectroscopy,” 2015 17th European Conference on Power Electronics and Applications, EPE-ECCE Europe 2015, 2015.
- [75] Xu Ma, Fang Yang, Wenbo Ding, and Jian Song, “Topology Reconstruction for Power Line Network Based on Bayesian Compressed Sensing,” 2015 IEEE International Symposium on Power Line Communications and Its Applications, ISPLC 2015, pp. 119–124, 2015.
- [76] Mohamed Osama Ahmed and Lutz Lampe, “Parametric and Nonparametric Methods for Power Line Network Topology Inference,” 2012 IEEE International Symposium on Power Line Communications and Its Applications, ISPLC 2012, pp. 274–279, 2012.
- [77] Michael Ulrich and Bin Yang, “Inference of Wired Network Topology Using Multipoint Reflectometry,” pp. 1965–1969, 2015.
- [78] Mohamed O. Ahmed and Lutz Lampe, “Power Line Communications for Low-Voltage Power Grid Tomography,” IEEE Transactions on Communications, vol. 61, no. 12, pp. 5163–5175, 2013.
- [79] Alessandro Costabeber, Paolo Tenti, Tomaso Erseghe, Stefano Tomasin, and Paolo Mattavelli, “Distributed Control of Smart Microgrids by Dynamic Grid Mapping,” IECON Proceedings (Industrial Electronics Conference), pp. 1323–1328, 2011.
- [80] Laura Marron, Xabier Osorio, Asier Llano, Aitor Arzuaga, and Alberto Sendin, “Low Voltage Feeder Identification for Smart Grids with Standard Narrowband PLC Smart Meters,” ISPLC 2013 - 2013 IEEE 17th International Symposium on Power Line Communications and Its Applications, Proceedings, pp. 120–125, 2013.
- [81] S. Ravishankar and R. Arjun, “A Hybrid Method for Physical and Power Line Loop Topology Estimation Using A Broadband Modem,” IEEE Radio and Wireless Symposium, RWS, vol. 2016-March, pp. 99–102, 2016.
- [82] S. Ravishankar and M. Bharathi, “Line Topology Estimation of Indoor Power Lines Using Multipoint Single Ended Loop Testing,” 2012.
- [83] Petr Mlynek, Radek Fujdiak, and Jiri Misurec, “Power Line Topology Prediction Using Time Domain Reflectometry,” 2016 39th International Conference on Telecommunications and Signal Processing, TSP 2016, pp. 199–202, 2016.
- [84] A. N. Milioudis, G. T. Andreou, and D. P. Labridis, “High Impedance Fault Detection Using Power Line Communication Techniques,” Proceedings of the Universities Power Engineering Conference, pp. 1–6, 2010.
- [85] A. N. Milioudis, G. T. Andreou, and D. P. Labridis, “High Impedance Fault Evaluation Using Narrowband Power Line Communication Techniques,” 2011 IEEE PES Trondheim PowerTech: The Power of Technology for a Sustainable Society, POWERTECH 2011, pp. 1–6, 2011.
- [86] Apostolos N. Milioudis, Georgios T. Andreou, and Dimitrios P. Labridis, “Enhanced Protection Scheme for Smart Grids Using Power Line Communications Techniques - Part I: Detection of High Impedance Fault Occurrence,” IEEE Transactions on Smart Grid, vol. 3, no. 4, pp. 1621–1630, 2012.
- [87] Lena Forstel and Lutz Lampe, “Grid Diagnostics: Monitoring Cable Aging Using Power Line Transmission,” 2017 IEEE International Symposium on Power Line Communications and its Applications, ISPLC 2017, pp. 1–6, 2017.
- [88] Dong Liang, Kaiwen Zhang, Song Ge, Yang Wang, and Deyi Wang, “A Novel Fault Monitoring Method Based on Impedance Estimation of Power Line Communication Equipment,” Frontiers in Energy Research, vol. 11, 2023.
- [89] Zhao Hong-shan, Guo Xiao-mei, Ma Li-bo, Wang Yan, Sun Cheng-yan, and Chang Jie-ying, “A Hierarchical Diagnosis Method of Cable Aged Segment Based on Transfer Function,” IET Science, Measurement & Technology, vol. 16, no. 9, pp. 512–522, 2022.
- [90] Abdel Karim Abdel Karim, M. Amine Atoui, Virginie Degardin, Pierre Laly, and Vincent Cocquempot, “Bus network decomposition for fault detection and isolation through power line communication,” ISA Transactions, 2023.
- [91] Amin Ghaderi, Herbert L. Ginn, and Hossein Ali Mohammadpour, “High Impedance Fault Detection: A Review,” Electric Power Systems Research, vol. 143, pp. 376–388, 2017.
- [92] Lucas Giroto de Oliveira, Mateus de L. Filomeno, Luiz Fernando Colla, H. Vincent Poor, and Moisés V. Ribeiro, “Analysis of Typical PLC Pulses for Sensing High-Impedance Faults Based on Time-Domain Reflectometry,” International Journal of Electrical Power & Energy Systems, vol. 135, pp. 107168, 2022.
- [93] Fang Yang, Wenbo Ding, and Jian Song, “Non-Intrusive Power Line Quality Monitoring Based On Power Line Communications,” ISPLC 2013 - 2013 IEEE 17th International Symposium on Power Line Communications and Its Applications, Proceedings, pp. 191–196, 2013.
- [94] Yinjia Huo, Gautham Prasad, Lutz Lampe, and Victor Leung, “Power Line Communication and Sensing Using Time Series Forecasting,” Sensors, vol. 22, no. 14, pp. 1–19, 2022.
- [95] Lizong Zhang, Xiang Shen, Fengming Zhang, Minghui Ren, Binbin Ge, and Bo Li, “Anomaly Detection for Power Grid Based on Time Series Model,” Proceedings - 22nd IEEE International Conference on Computational Science and Engineering and 17th IEEE International Conference on Embedded and Ubiquitous Computing, CSE/EUC 2019, pp. 188–192, 2019.
- [96] Federico Passerini and Andrea M. Tonello, “Secure PHY Layer Key Generation in the Asymmetric Power Line Communication Channel,” Electronics (Switzerland), vol. 9, no. 4, 2020.
- [97] Javier Hernandez Fernandez, Aymen Omri, and Roberto Di Pietro, “PLC Physical Layer Link Identification with Imperfect Channel State Information,” Energies, vol. 15, no. 16, 2022.
- [98] Javier Hernandez Fernandez, Aymen Omri, and Roberto Di Pietro, “Channel Impulse Response Multilevel Quantization for Power Line Communications,” IEEE Access, vol. 10, pp. 66113–66126, 2022.
- [99] Bernd Hirschler and Albert Treytl, “Internet Protocol Security and Power Line Communication,” in 2012 IEEE International Symposium on Power Line Communications and Its Applications, 2012, pp. 102–107.
- [100] Miguel Seijo Simó, Gregorio López López, and José Ignacio Moreno Novella, “Cybersecurity Vulnerability Analysis of The PLC Prime Standard,” Security and Communication Networks, vol. 2017, 2017.
- [101] Emmanuel C. Uwaezuoke and Theo G. Swart, “Network Attack Analysis of an Indoor Power Line Communication Network,” in 2021 IEEE International Symposium on Power Line Communications and its Applications (ISPLC), 2021, pp. 96–101.