Reverberation Time Control by Acoustic Metamaterials in a Small Room
Abstract
In recent years, metamaterials have gained considerable attention as a promising material technology due to their unique properties and customizable design, distinguishing them from traditional materials. This article delves into the value of acoustic metamaterials in room acoustics, particularly in small room acoustics that poses specific challenges due to their significant cavity resonant nature. Small rooms usually exhibit an inhomogeneous frequency response spectrum, requiring higher wall absorption with specific spectrum to achieve a uniform acoustic environment, i.e., a constant reverberation time over a wide audible frequency band. To tackle this issue, we developed a design that simultaneously incorporates numerous subwavelength acoustic resonators at different frequencies to achieve customized broadband absorption for the walls of a specific example room. The on-site experimental measurements agree well with the numerical predictions, attesting to the robustness of the design and method. The proposed method of reverse-engineering metamaterials by targeting specific acoustic requirements has broad applicability and unique advantages in small confined spaces with high acoustic requirements, such as recording studios, listening rooms, and car cabins.
keywords:
Acoustic metamaterials, Acoustic environment, Reverberation time, Optimal absorption, Spectrum customization[inst1]organization=Department of Mechanical Engineering, The University of Hong Kong,addressline=Pokfulam Road, city=Hong Kong, postcode=999077, country=China
[inst2]organization=Acoustic Metamaterials Group Ltd.,addressline=Data Technology Hub, TKO Industrial Estate, city=Hong Kong, postcode=999077, country=China
1 Introduction
Improving the auditory experience in enclosed spaces, particularly achieving a flat frequency response in a small room, has been an enduring challenge for room acoustics [1]. When recording or listening to natural sounds, it’s important to have an acoustic environment that can reproduce the sounds accurately without distortion [2]. In scenarios such as car interior, telephone booth and music practice room, a more uniform acoustic feedback is also comfortable for the users. However, small rooms tend to have oscillating responses due to a sparse modal distribution in frequency. Also, the sound fields as function of space can be highly inhomogeneous and anisotropic [3, 4]. To improve the acoustic environment, absorbing materials can be introduced to modify the resonant response. In theory, achieving complete flattening of the system response necessitates uneven specific boundary absorption in frequency, contingent upon the system’s original response spectrum and the desired acoustic requirements. While traditional porous acoustic materials [5, 6] can provide effective broadband absorption, their customization flexibility across frequencies is limited by its inherent porous structures and related dissipative nature. To effectively improve the acoustic environment of a small room, new acoustic materials or structures that allow customization of absorption performance over a wide bandwidth are needed. This article explores how acoustic metamaterials, an emerging technology in recent years, can offer a novel approach and effective solution to this problem.
Based on local resonances [7, 8], acoustic metamaterials have exhibited many intriguing properties [9, 10, 11] (such as negative refraction, perfect absorption, and topological transport, etc.) that were previously impossible for natural materials. Unfortunately, these properties depend highly on specific modes, so the desired functions can only be achieved at a single frequency or a few discrete frequencies. However, among the properties, absorption is one of the exceptions. Many researchers have found that broadband absorption is completely feasible by combining different resonant units [12, 13, 14]. In 2017, Yang et al. [15] proposed a general theoretical framework for designing broadband absorption metamaterials through the integration of Fabry–Pérot (FP) resonances, which pushed the absorption performance to the theoretical limit considering the thickness-absorption trade-off induced by causality constraint [16, 17, 18]. Another less recognized aspect is that the distribution of resonances can enable global and flexible control over the absorption spectrum of metamaterials [19, 20]. This phenomenon is analogous to selective absorption in optics, which has various applications such as radiative cooling [21], solar power generation [22], and image processing [23]. Here, we will explore how this characteristic can be leveraged to address the challenges associated with improving the acoustic environment of small rooms [24, 25, 26].
While the human perception of sound may be complex due to factors such as spaciousness, naturalness, and warmth, these indicators are closely associated with the reverberation time of indoor spaces [27, 28]. As an initial study, this article aims to achieve a uniform reverberation time across different frequencies by determining the ideal absorption spectrum of a room’s walls and inversely designing metamaterial absorbers. To this end, we use the Eyring equation to calculate the reverberation time above the Schroeder frequency [29] and the quality factor of the resonant system to calculate the lifetime of sound energy within the room below this frequency. As an example, we consider a small room with dimensions of [Figure 1(b)] and design a 6.8 cm-thick metamaterial absorption unit that utilizes a Helmholtz resonator and 44 FP resonators to target a uniform reverberation time () of 0.1 seconds above 175 Hz. Finally, we verify the effectiveness of the proposed approach by installing the designed metamaterials on three walls of a real room to regulate the reverberation time. The results demonstrate that the metamaterial-based solution outperforms the traditional foam-based approach by a significant margin.
In what follows, we defined the small sample room’s geometry and material properties in Section 2. The method of determining the wall materials’ absorption efficiency in different frequency bands according to the target reverberation time is described in detail in Section 3. In Section 4, we designed a broadband metamaterial absorber fulfilling the target and validated it through impedance tube experiments. In Section 5, we applied the large-area metamaterials in a real testing room and conducted on-site measurements. We conclude in Section 6.
2 Model Definitions
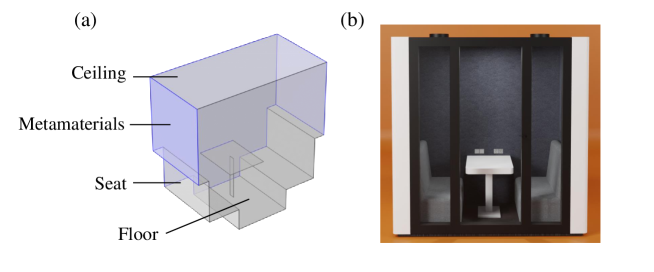
This study examines a small room with internal dimensions of approximately 1.1 2.1 2.1 m3, which contains two seats and one table [Figure 1(b)]. The room’s ceiling and floor are covered by polyester fibreboard, while the front wall with a door is made of transparent glass. The other three walls have covers that can be replaced with different materials, ranging from rigid walls and acoustic foam to metamaterial absorbers. The metamaterial is designed to have a specific impedance that matches the target reverberation time in the room.
A normal impedance kernel, , relates the local sound pressure on the surface, , to the past and present air molecule velocity, , along the normal direction at the same and nearby locations by . For metamaterials with resonators that only expose a subwavelength face to sound, the velocity’s contributions at the surrounding locations can be ignored. Thus, becomes a complex function of frequency that can be expressed through a summation of Lorentz forms [8],
in which is the damping coefficient, is the angular frequency, and are the resonance strength and angular frequency of the -th resonator, respectively, denotes the resonators’ total number, and the surface porosity is the ratio of resonators’ total opening area to the area exposed to the incident sound. For simplicity and generality, here we ignore the higher-order modes of the resonators, which can be corrected by a more exact treatment as shown in Section 4 [15]. Broadband metamaterials usually have a high modal density per unit frequency. Therefore, since the first term in the above summation changes sign from negative to positive around each resonant frequency, the summation of all the modes tends to cancel out, leading to a negligible net result. In contrast, since the second term of the summation is always positive, the contributions of all modes are cumulatively added to each other, resulting in a relatively large value. Thus, unlike traditional porous materials such as acoustic foam, the impedance of a broadband acoustic metamaterial is almost purely real [as illustrated in the inset of Fig. 5(c)] and can be approximated in terms of a real-valued integral,
| (1) |
here is the modal density, and is the lowest (highest) frequency of the resonances in considerations. One can, therefore, customize by designing the values of .
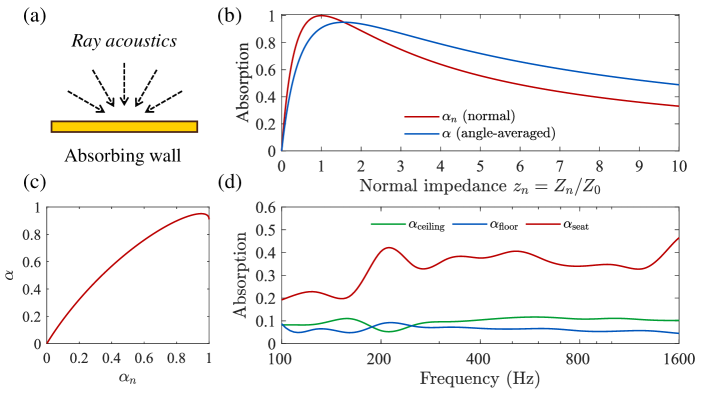
In the following, the absorption (or impedance) data of the ceiling, floor, and seat were obtained from Ref. [30] [see Figure 2(d)] and the surface of table and glass were treated as rigid. The classical Eyring equation can use these parameters to estimate the real-valued impedance for metamaterial design based on a desired reverberation time when the frequency is above the reverberation limit. To model the low-frequency range, where the Eyring equation is not applicable, we will employ the direct finite element method (FEM) simulation in COMSOL Multiphysics software to establish the relationship between the target metamaterial impedance and the desired volume-averaged sound decay rate (instead of the classically defined reverberation time).
3 Theoretical Framework: Reverberation Control
3.1 Transition from resonance to reverberation
The resonance modes of a room are typically sparse at low frequencies and denser at higher frequencies. When the modal density is sufficiently high, the contributions from different resonance modes will overlap significantly, resulting in a spatially uniform and fully reverberant sound field. The transition from the resonant to the reverberant condition is not clear-cut. Therefore, we use FEM to directly simulate this transition in the sample room.
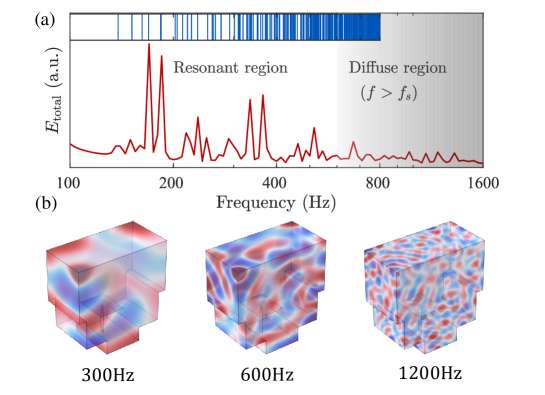
In the simulation, we used a sound monopole source on the top of the room (near the ceiling) to excite more diverse modes and calculated the room’s energy response curves at different frequencies [Figure 3(a)]. The total energy was estimated based on the volume integral of sound energy density [25]. As shown in Figure 3(a), for an untreated room with rigid walls on three sides, fluctuates at low frequencies and becomes relatively smooth when the frequency is high. This transition occurs around the Schroeder frequency, which is defined by with being the room’s volume, the reverberation time, and ranging from 2000[m/s] to 4000[m/s] [31]. In the current case, we took the commonly accepted value (), thus Hz. The transition can also be observed from the eigenfrequencies shown in the inset of Figure 3(a) by blue vertical lines. The region of high modal density (grey) coincides with the smooth response frequency range, which is above . Figure 3(b) displays the sound pressure field patterns at , and , which illustrate the transition of the overall field to a more reverberant and uniform pattern.
The computational resources required for numerical simulation increase rapidly as the frequency increases. Therefore, we will only perform full-wave simulation for the resonance and transition regions and use conventional ray acoustics theory to calculate higher frequencies.
3.2 Ray Acoustics Assumption and Reverberation Time
In room acoustics, ray acoustics assumes that when sound waves hit the surface of a wall, the probabilities of incidence at different angles are equal [Figure 2(a)]. Provided that the normal impedance of a wall is , according to the principle of the interference of incident and reflected plane waves, we know that the absorption coefficient for normal incidence is , where and is air’s characteristic impedance. For broadband acoustic metamaterial with an almost real-valued impedance, if we further take the impedance change under different incident angles into consideration, effectively, there can be an angle-averaged version of the absorption [1, 25]
| (2) |
A comparison of and is plotted in Figure 2(b). The angle-averaged absorption coefficient can never reach , and there are differences between the two definitions of absorption coefficient in terms of optimal impedance: for normal incidence, impedance matching is always desired case, while for maximum angle-averaged absorption, the required impedance is slightly greater than that of air [25]. We plotted the two absorption coefficient definitions in Figure 2(c) to avoid confusion and facilitate the following conversion.
By definition, after the sources stop their radiation, the reverberation time is the time required for the sound energy to decay by , approximately following the exponential relation
| (3) |
Based on ray acoustics, the most commonly used formula for prediction is the Eyring equation [32, 33]:
| (4) |
where can be treated as the surface area of wall (e.g., can be ceiling, floor, seat or metamaterial). is the angle-averaged absorption coefficient. It should be noted that Norris, Eyring, Schuster and Waitzmann all independently derived Equation (4). Although there are many more complex versions of prediction theory (such as when considering the coupling of two or more rooms [34, 35, 36]), Eyring equation is still the most simple but effective description that is also applicable for higher absorption [37].
To control the reverberation time within a reasonable range, we set the target reverberation time to , which needs to be maintained as constant as possible over a wide frequency range. This time is the recommended value for high speech clarity in recording studios [2] and can be modified to other values due to the flexibility of the reverse-design approach. In general, the optimal reverberation time is linearly proportional to the logarithm of the room volume [38] . Hence, optimal is relatively small for small rooms, thus requiring higher absorption than that of large rooms [39, 40].
By plugging this target value into the Eyring equation, we can obtain the following relationship,
| (5) |
yielding the target absorption for metamaterials
| (6) |
For the ease of designing normal impedance, we should convert according to the relation displayed in Figure 2(c).
Despite the limited validity of Equation (6), we still plot its results over the entire frequency band in the blue line in Figure 4(a), using the parameters in Figure 2(d). The discrepancy between it and the FEM calculation results introduced later reflects the failure of ray acoustics.
3.3 Sound Fields’ Lifetime in Resonance Conditions
At low frequencies, the room’s response is dominated by resonant behavior, which leads to a non-uniform sound field’s lifetime across space. Therefore, the classical definition of is not applicable [41]. We propose a simple correction of the reverberation time by calculating the decay time of the averaged field instead of a uniform field decay time, which extends the definition of to lower frequency bands. In practice, the acoustic field averaging is based on FEM simulation results, and the results obtained should be consistent with what is from classical ray acoustics at high frequencies.
If we treat the room as a resonant cavity, its quality factor [42] is defined by the ratio of the energy stored in the resonator to the energy dissipated per time cycle
| (7) |
where
| (8) | |||
| (9) |
Here, are the air density and bulk modulus. is the room’s interior space, while is the surface of the walls. The factors [ in Equation (8) and in Equation (9)] come from the time average of the complex fields, i.e., steady states are considered here. We consider frequency-domain solutions to reduce computation complexity as an alternative to time-domain simulations. Acoustic pressure field and particle velocity as a function of three-dimensional space can be extracted from FEM simulation.
From Equation (7), we can solve the differential equation and obtain . By comparing it with Equation (3), we can solve and obtain . By inserting the definition in Equation (7) into the above expression, we have
| (10) |
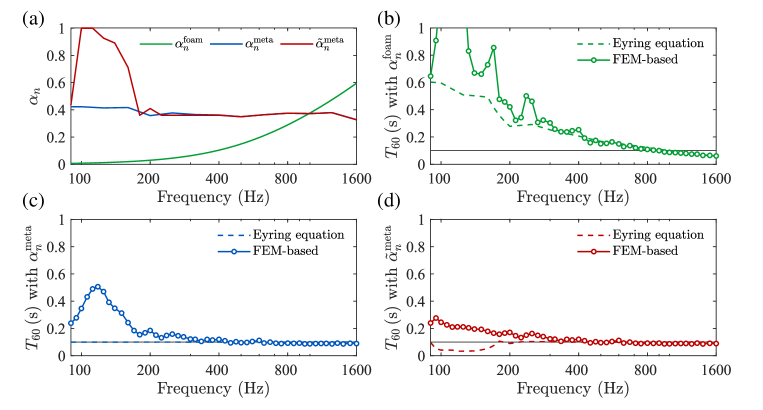
Therefore, by FEM, we can visualize the impact of metamaterials by simulating with different frequencies and absorption spectra to obtain reverberation time as a guiding map [Figure 5(a)]. By searching for the absorption coefficient closest to the target for each frequency, we can obtain the optimal absorption spectrum based on FEM [see red line in Figure 4(a) and dashed line in Figure 5(a)]. It can be seen, and are quite different below but beyond this frequency, the two almost coincide. Therefore, FEM provides a corrected optimal absorption spectrum, which we will use as the target for designing the metamaterial. In fact, is dependent on the initial setting of the sound source, which can determine the relative strengths of different modes. It should be noted that the subsequent designs we present here are custom-made for the current setting of the room.
In Figure 4(c), we have shown the results of incorporating the absorption design based on the Eyring formula into the FEM model: at high frequencies, this design is basically accurate, and is very close to the target value of . In the low-frequency region below , is much higher than the target value due to the reduced absorption of other materials in the room and the gradually emerging resonant characteristics of the room. Stronger absorption is needed to counteract this effect. In Figure 4(d), the results using the revised target spectrum are shown, and it can be seen that compared to Figure 4(c), the low-frequency part of the reverberation time is closer to the ideal value. In summary, the difference between the dashed lines and circles in Figure 4(b-d) confirms the necessity of introducing FEM-based approach to evaluation modal reverberation time.
We also examined traditional materials (absorbing foam) as a comparison [see green data in Figure 4(a-b)]. Based on the Johnson-Champoux-Allard (JCA) model [8, 43, 44], we set the equivalent parameters of the foam according to Ref. [8], which includes the porosity (), flow resistivity (), tortuosity (), viscous characteristic length () and thermal characteristic length (). We adjusted the foam thickness to so that its absorption coefficient at would result in a reverberation time of . However, after applying it to the FEM boundary conditions, we observe that the reverberation time deviated significantly from the target value below , which highlights the significance of the proposed target absorption spectrum (). Beyond , the reverberation time with foam should be lower than . Therefore, a broadband and constant spectrum cannot be achieved with traditional materials without a customized spectrum.
4 Realization of Customized Metamaterial Absorption
Based on the previous discussion, the required absorption spectrum consists of a low-frequency absorption peak followed by a subsequent flat curve (with an absorption coefficient of approximately 0.4). Figure 5(c) shows this spectrum as a dashed line. According to previous work [45], a suitable approach to design a low-frequency absorption peak is to use Helmholtz (HR) resonator, which can achieve a relatively pure single resonant mode. By adjusting the size and number of surface pores, as well as the volume of the rear cavity, impedance-matching conditions can be realized. The effect of the high-order modes is very weak, and it is in the high-frequency region (e.g., the second mode is already around 1550 Hz). So, the impedance of the HR resonator can be expressed in the Lorentzian function
| (11) |
where the coefficients can be obtained by comparing Equation (11) with the impedance function given by transfer matrix method [45]. The resonance frequency can be approximately determined by , where the aperture area . We set two HR necks with the diameter and neck length . The cavity volume . In this way, [see the red dot in Figure 5(b) and the peak location in Figure 5(c)]. The designed HR resonator is plotted with orange color in Figure 5(d).
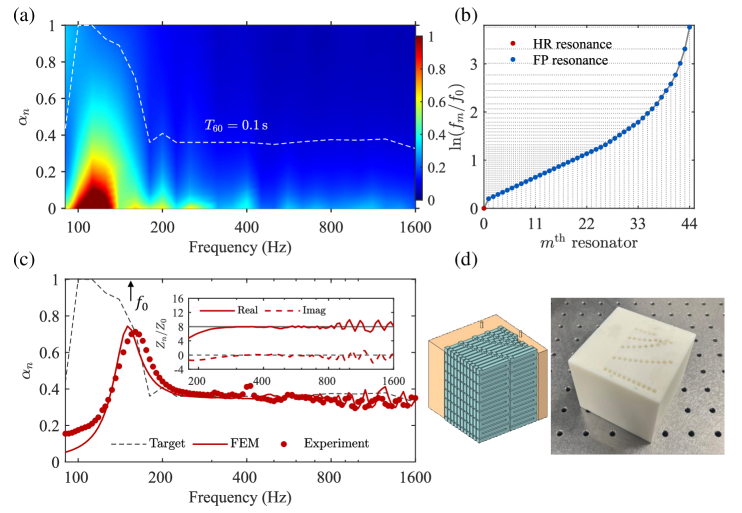
Due to the availability of rich higher-order resonances, integrated Fabry–Pérot (FP) resonators [8, 15, 19] are suitable for the absorption design with a flat smooth feature, whose overall impedance is
| (12) |
where the coefficient ( is the length of FP resonator), and the dissipation factor can be determined by the ratio between viscous boundary layer thickness and FP tube cross-section size ( here). The total number of FP resonators . Detailed discussions on how to derive Equations (11) and (12) for impedance design can be found in Ref. [46]. In this case, the final overall impedance can be extracted from
| (13) |
where the cross-section area of the impedance tube . Or, can be regarded as the horizontal area of a periodic unit (under the normal incidence of a plane wave). The aperture area of FP resonator . The FP resonance design follows the design scheme described in Ref. [15, 25] to achieve [thus ], which contributes to the blue dots in Figure 5(b). As shown in Figure 5(d), the FP tubes (blue part) are coiled up to form a compact structure (together with the HR resonator). The left schematic is the air part that supports resonant modes. A practical sample fabricated by 3D-printing technology is displayed on the right side. The overall sample has a thickness of and its absorption data [red dots in Figure 5(c)] agrees well with the targeted dashed line when . Below , in principle, we can introduce more resonances to cover the low-frequency band. Still, since the available space is limited, so under the current condition, we only achieve . The thickness-absorption trade-off can be well captured by the causality constraint relation in diverse wave systems [15, 47, 48].
5 Experimental Verification in a Small Room
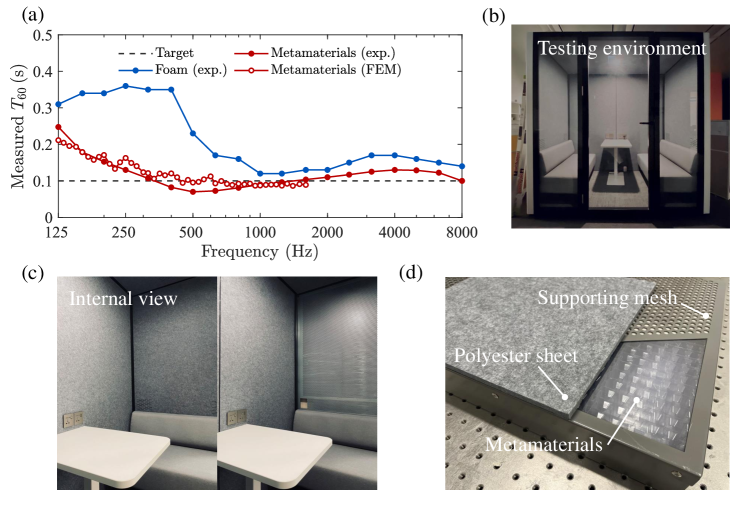
In the previous section, we demonstrated through simulation and experiment that metamaterials can achieve the desired absorption spectrum. Here, on the one hand, we further show that the customized metamaterials can function in a real room. The necessity of measuring the reverberation time in a room is that impedance tube testing can only characterize the effect of normal incidence and cannot include the interaction between metamaterials and the complex reverberating modes of the room. On the other hand, even if the metamaterials can mimic the target spectral shape, we still need to verify through room testing that the optimal absorption spectrum we derived is correct. Before we conducted the measurements, we modified the metamaterial by embedding it underneath a polyester fiber sheet as a dissipative material [see Figure 6(c-d)] for smoothing high-frequency oscillations of the absorption coefficient [8, 15]. Additionally, we utilized a molding process suitable for large-scale manufacturing as the sample fabrication technique.
The measurements were guided by ISO 3382 standards [49]. We used NTi-XL2 acoustic analyzer from NTi Audio AG company, which supports direct reverberation time measurements. The signal receiver was placed in the center of the room [see Figure 6(b)], with a broadband pulse sound source placed at the top of the room to excite diverse modes and prevent the strong resonant response of any specific single mode. The source power, which has the estimated power of , is high enough to maintain a high signal-to-noise ratio and the insertion loss between the room interior and outside space is about 20 dB. The built-in algorithm (Schroeder method) of the analyzer can automatically fit the pressure data received to output the reverberation time. This algorithm takes advantage of the ensemble average being equal to the backward integration of the squared impulse response, to obtain satisfactory accuracy especially for low decaying time. According to the ISO [49], a recommended quantitative method for checking the feasibility is to examine the following condition: , where is the filter bandwidth, and is the estimated reverberation time. In our case, because at (the lowest frequency in our experiment), for 1/3-octave band111For 1/3-octave band with center frequency , the bandwidth is . is and . As a comparison, we also tested a commercial foam222The foam is the interior material of an acoustic booth product XR-M F4 from Sound Box company. using the same method. The measurement results in Figure 6(a) showed that for the target (dashed line), the foam experienced a significant increase in reverberation time at low frequencies (blue points). By contrast, the metamaterial exhibited a more uniform response, fluctuating near , and this performance could be maintained from up to (red points). In Figure 6(a), we also plot red circles for the FEM simulated results [from Figure 4(d)] as a comparison. The highest simulation frequency is limited to 1600 Hz due to the limited computational resources. The good agreement between the experimental and simulated results within this frequency band evidences the effectiveness of the proposed reverse design method of metamaterials in small rooms.
6 Concluding Remarks
In summary, designing the acoustic environment of small rooms is difficult due to a significant portion of the audible frequency band being outside the realm of traditional ray acoustics. This results in high non-uniformity in both frequency and space, making it necessary to implement advanced absorption technologies that are highly efficient and customizable across the frequency spectrum in order to achieve a uniform and comfortable acoustic environment. Another challenge is extending the concept of reverberation time to cavity resonant region. In this article, we evaluate the lifetime of the acoustic signal in the resonant cavity by using its quality factor and combining it with the classical Eyring equation to calculate the reverberation time. We then reverse-engineer the required wall absorption spectrum for a target uniform reverberation time spectrum. The proposed approach involves utilizing customized broadband metamaterial absorption technology through an array of different resonators, which has shown promising results in both numerical simulations and experiments. This strategy of designing absorption materials in a reverse manner from the final acoustic requirements is scalable and can flexibly provide optimized acoustic environments for different types of rooms and purposes [50], including small recording studios, listening rooms, phone booths, and even car cabins with high acoustic requirements in enclosed spaces. Furthermore, this design approach can be extended to larger spaces such as concert halls, lecture halls, and theaters, as an alternative to traditional acoustic absorption materials. Finally, it should be noted that the design in this paper was based on passive resonators, which has the advantages of stability and low cost. In the future, the passive customized materials can be used as a supplementary component of the active solutions [51] to control the indoor sound field, in order to reduce costs and alleviate the difficulty of control algorithms at high frequencies.
CRediT authorship contribution statement
Sichao Qu: Writing – original draft, Visualization, Methodology, Investigation, Formal analysis, Software. Min Yang: Writing – review & editing, Formal analysis, Supervision, Funding acquisition, Conceptualization. Yunfei Xu: Validation, Data curation, Investigation. Songwen Xiao: Project administration, Resources. Nicholas X. Fang: Writing - Review & editing, Supervision, Validation.
Declaration of competing interest
The authors declare no conflict of interest.
Data availability
The data that support the findings of this study are available upon request from the corresponding author.
References
- Kuttruff and Mommertz [2012] H. Kuttruff, E. Mommertz, Room acoustics, in: Handbook of engineering acoustics, Springer, 2012, pp. 239–267.
- Parker [2009] B. Parker, Good vibrations: The physics of music, JHU Press, 2009.
- Garai et al. [2016] M. Garai, S. De Cesaris, F. Morandi, D. D’Orazio, Sound energy distribution in italian opera houses, in: Proceedings of Meetings on Acoustics 22ICA, volume 28, Acoustical Society of America, 2016, p. 015019.
- Nolan et al. [2020] M. Nolan, M. Berzborn, E. Fernandez-Grande, Isotropy in decaying reverberant sound fields, The Journal of the Acoustical Society of America 148 (2020) 1077–1088.
- Sagartzazu et al. [2008] X. Sagartzazu, L. Hervella-Nieto, J. Pagalday, Review in sound absorbing materials, Archives of Computational Methods in Engineering 15 (2008) 311–342.
- Shin and Kim [2020] H.-k. Shin, K.-w. Kim, Sound absorbing ceiling to reduce heavy weight floor impact sound, Building and Environment 180 (2020) 107058.
- Ma and Sheng [2016] G. Ma, P. Sheng, Acoustic metamaterials: From local resonances to broad horizons, Science advances 2 (2016) e1501595.
- Yang and Sheng [2017] M. Yang, P. Sheng, Sound absorption structures: From porous media to acoustic metamaterials, Annual Review of Materials Research 47 (2017) 83–114.
- Cummer et al. [2016] S. A. Cummer, J. Christensen, A. Alù, Controlling sound with acoustic metamaterials, Nature Reviews Materials 1 (2016) 1–13.
- Gu et al. [2021] Z. Gu, H. Gao, P.-C. Cao, T. Liu, X.-F. Zhu, J. Zhu, Controlling sound in non-hermitian acoustic systems, Physical Review Applied 16 (2021) 057001.
- Xue et al. [2022] H. Xue, Y. Yang, B. Zhang, Topological acoustics, Nature Reviews Materials (2022) 1–17.
- Jiménez et al. [2017] N. Jiménez, V. Romero-García, V. Pagneux, J.-P. Groby, Rainbow-trapping absorbers: Broadband, perfect and asymmetric sound absorption by subwavelength panels for transmission problems, Scientific reports 7 (2017) 13595.
- Jiang et al. [2014] X. Jiang, B. Liang, R.-q. Li, X.-y. Zou, L.-l. Yin, J.-c. Cheng, Ultra-broadband absorption by acoustic metamaterials, Applied Physics Letters 105 (2014) 243505.
- Long et al. [2019] H. Long, C. Shao, C. Liu, Y. Cheng, X. Liu, Broadband near-perfect absorption of low-frequency sound by subwavelength metasurface, Applied Physics Letters 115 (2019) 103503.
- Yang et al. [2017] M. Yang, S. Chen, C. Fu, P. Sheng, Optimal sound-absorbing structures, Materials Horizons 4 (2017) 673–680.
- Rozanov [2000] K. N. Rozanov, Ultimate thickness to bandwidth ratio of radar absorbers, IEEE Transactions on Antennas and Propagation 48 (2000) 1230–1234.
- Acher et al. [2009] O. Acher, J. Bernard, P. Maréchal, A. Bardaine, F. Levassort, Fundamental constraints on the performance of broadband ultrasonic matching structures and absorbers, The Journal of the Acoustical Society of America 125 (2009) 1995–2005.
- Meng et al. [2022] Y. Meng, V. Romero-García, G. Gabard, J.-P. Groby, C. Bricault, S. Goudé, P. Sheng, Fundamental constraints on broadband passive acoustic treatments in unidimensional scattering problems, Proceedings of the Royal Society A 478 (2022) 20220287.
- Yang and Sheng [2018] M. Yang, P. Sheng, An integration strategy for acoustic metamaterials to achieve absorption by design, Applied Sciences 8 (2018) 1247.
- Qu and Sheng [2022] S. Qu, P. Sheng, Microwave and acoustic absorption metamaterials, Physical Review Applied 17 (2022) 047001.
- Raman et al. [2014] A. P. Raman, M. A. Anoma, L. Zhu, E. Rephaeli, S. Fan, Passive radiative cooling below ambient air temperature under direct sunlight, Nature 515 (2014) 540–544.
- Li et al. [2019] Y. Li, C. Lin, D. Zhou, Y. An, D. Li, C. Chi, H. Huang, S. Yang, C. Y. Tso, C. Y. Chao, et al., Scalable all-ceramic nanofilms as highly efficient and thermally stable selective solar absorbers, Nano Energy 64 (2019) 103947.
- Wesemann et al. [2019] L. Wesemann, E. Panchenko, K. Singh, E. Della Gaspera, D. E. Gómez, T. J. Davis, A. Roberts, Selective near-perfect absorbing mirror as a spatial frequency filter for optical image processing, APL Photonics 4 (2019) 100801.
- Ma et al. [2018] G. Ma, X. Fan, P. Sheng, M. Fink, Shaping reverberating sound fields with an actively tunable metasurface, Proceedings of the National Academy of Sciences 115 (2018) 6638–6643.
- Qu and Sheng [2020] S. Qu, P. Sheng, Minimizing indoor sound energy with tunable metamaterial surfaces, Physical Review Applied 14 (2020) 034060.
- Wang et al. [2022] Q. Wang, P. del Hougne, G. Ma, Controlling the spatiotemporal response of transient reverberating sound, Physical Review Applied 17 (2022) 044007.
- Kaplanis et al. [2014] N. Kaplanis, S. Bech, S. H. Jensen, T. van Waterschoot, Perception of reverberation in small rooms: a literature study, in: Audio engineering society conference: 55th international conference: Spatial audio, Audio Engineering Society, 2014.
- Traer and McDermott [2016] J. Traer, J. H. McDermott, Statistics of natural reverberation enable perceptual separation of sound and space, Proceedings of the National Academy of Sciences 113 (2016) E7856–E7865.
- Schroeder [1987] M. R. Schroeder, Statistical parameters of the frequency response curves of large rooms, Journal of the Audio Engineering Society 35 (1987) 299–306.
- Aspöck et al. [2020] L. Aspöck, M. Vorländer, F. Brinkmann, D. Ackermann, S. Weinzierl, Benchmark for room acoustical simulation (bras), 2020. URL: 10.14279/depositonce-6726.3, from Audio Communication Group.
- Noxon [1987] A. M. Noxon, Controlled reflection isolation booth, in: Audio Engineering Society Convention 83, Audio Engineering Society, 1987.
- Eyring [1930] C. F. Eyring, Reverberation time in “dead” rooms, The Journal of the Acoustical Society of America 1 (1930) 217–241.
- Xiang [2020] N. Xiang, Generalization of sabine’s reverberation theory, The Journal of the Acoustical Society of America 148 (2020) R5–R6.
- Eyring [1931] C. F. Eyring, Reverberation time measurements in coupled rooms, The Journal of the Acoustical Society of America 3 (1931) 181–206.
- Schroeder [1965] M. R. Schroeder, New method of measuring reverberation time, The Journal of the Acoustical Society of America 37 (1965) 1187–1188.
- Billon et al. [2006] A. Billon, V. Valeau, A. Sakout, J. Picaut, On the use of a diffusion model for acoustically coupled rooms, The Journal of the Acoustical Society of America 120 (2006) 2043–2054.
- Prawda et al. [2022] K. Prawda, S. J. Schlecht, V. Välimäki, Calibrating the sabine and eyring formulas, The Journal of the Acoustical Society of America 152 (2022) 1158–1169.
- Long [2014] M. Long, Design of studios and listening rooms, in: M. Long (Ed.), Architectural Acoustics, second edition ed., Academic Press, Boston, 2014, pp. 829–871.
- Mei and Kang [2012] H. Mei, J. Kang, An experimental study of the sound field in a large atrium, Building and environment 58 (2012) 91–102.
- D’Orazio et al. [2020] D. D’Orazio, F. Montoschi, M. Garai, Acoustic comfort in highly attended museums: A dynamical model, Building and Environment 183 (2020) 107176.
- Prato et al. [2016] A. Prato, F. Casassa, A. Schiavi, Reverberation time measurements in non-diffuse acoustic field by the modal reverberation time, Applied Acoustics 110 (2016) 160–169.
- Jackson [2021] J. D. Jackson, Classical electrodynamics, John Wiley & Sons, 2021.
- Johnson et al. [1987] D. L. Johnson, J. Koplik, R. Dashen, Theory of dynamic permeability and tortuosity in fluid-saturated porous media, Journal of fluid mechanics 176 (1987) 379–402.
- Champoux and Allard [1991] Y. Champoux, J.-F. Allard, Dynamic tortuosity and bulk modulus in air-saturated porous media, Journal of applied physics 70 (1991) 1975–1979.
- Maa [1998] D.-Y. Maa, Potential of microperforated panel absorber, the Journal of the Acoustical Society of America 104 (1998) 2861–2866.
- Qu [3412] S. Qu, Broadband Microwave and Underwater Acoustic Absorption Metamaterials: Approaching the Causal Limit, Ph.D. thesis, The Hong Kong University of Science and Technology, 2022. URL: https://doi.org/10.14711/thesis-991013100058903412.
- Qu et al. [2021] S. Qu, Y. Hou, P. Sheng, Conceptual-based design of an ultrabroadband microwave metamaterial absorber, Proceedings of the National Academy of Sciences 118 (2021) e2110490118.
- Qu et al. [2022] S. Qu, N. Gao, A. Tinel, B. Morvan, V. Romero-García, J.-P. Groby, P. Sheng, Underwater metamaterial absorber with impedance-matched composite, Science Advances 8 (2022) eabm4206.
- ISO 3382-1:2008; 3382-2:2008 [2008] ISO 3382-1:2008; 3382-2:2008, Acoustics — Measurement of room acoustic parameters — Part 1: Performance spaces; Part 2: Reverberation time in ordinary rooms, Standard, International Organization for Standardization, Geneva, CH, 2008.
- Barron [2009] M. Barron, Auditorium acoustics and architectural design, Routledge, 2009.
- Cecchi et al. [2017] S. Cecchi, A. Carini, S. Spors, Room response equalization—a review, Applied Sciences 8 (2017) 16.