Stochastic resonance in a model of a periodically driven DNA : Multiple transitions, scaling and sequence dependence
Abstract
We numerically study stochastic resonance in the unzipping of a model double-stranded DNA by a periodic force. We observe multiple peaks in stochastic resonance in the output signal as the driving force frequency is varied for different force amplitudes, temperature, chain length, and chain heterogeneity. Multiple peaks point to the existence of multiple stable and metastable states, which correspond to dynamical states of partially zipped and unzipped conformations and transitions between them. We quantify such transitions by looking at the time evolution of the fraction of bound base pairs. We obtain phase diagrams in the force amplitude–temperature plane both in the resonance frequency of the primary peak and the output signal at the peak value. We further obtain an excellent scaling behavior of the output signal for changing lengths of the DNA. Resonance behavior is also affected by chain heterogeneity as it depends strongly on which base pair the periodic forcing is applied.
Introduction. Stochastic Resonance (SR) [1, 2, 3] has been studied in a wide variety of systems like the Brownian particles in a double well potential [4, 5], multithreshold systems [6], neuron models [7], and quantum systems [8, 9] to name a few. First put forward by Benzi et al. [1], it says that the response of a nonlinear system is amplified at a certain frequency due to the noise within the system (arising because of the probabilistic nature of the system) or by the input noise. The frequency at which the response is maximum is called the resonance frequency. Recently Hayashi et al. [10] performed experimental studies of unzipping of single DNA hairpins under the action of an oscillating mechanical force applied with optical tweezers. When the force oscillates around the average force needed to unfold the DNA, the hopping kinetics between folded and unfolded states synchronizes with the external frequency giving rise to SR.
Unzipping of a double-stranded DNA (dsDNA) is a first order phase transition [11, 12, 13, 14]. Considering that the dependence of the free energy of the system on the unzipping pathway coordinate has an asymmetric double well form; the transition between a folded ground state and an unfolded metastable state can be viewed as a barrier crossing problem [15]. When an external periodic force is applied, the free energy potential gets tilted asymmetrically up (down) while raising (lowering) the energy barrier. SR activates when the average waiting time between the two noise induced interwell transitions of the system is comparable to the time period of the external periodic force [6, 2, 16]. During this process, the response of the system towards the external force will be maximum.
Studies on unzipping of a dsDNA by a periodic force have provided valuable insight about the free energy landscapes that control the folding kinetics [17, 18, 19, 20, 21, 22, 23]. These studies have shown that by simply changing the frequency, , of an externally applied force, the dsDNA can be taken from a zipped phase to an unzipped phase via a dynamical phase. Hysteresis is observed in this process due to the lag between response of the DNA to the applied force. The area of this hysteresis loop increases with an increase in the frequency up to a certain value and then decreases on further increment in the frequency. Such a behavior is reminiscent of SR, which we explore in this study and show that it can be used as a measure of multiple dynamical transitions observed in the system [24, 19, 21, 22, 23].
We use Monte Carlo simulations to investigate SR in a model dsDNA driven by a periodic force. We measure the SR by looking at the oscillations of the separation of the end monomers of the strands where the periodic force is applied. We calculate the output signal () defined as the spectral density of the signal at an oscillation frequency and find that this is an excellent quantifier of SR in our system. as a function of the oscillation frequency at varying force amplitudes and temperatures shows multiple resonance peaks which appear as signatures of dynamical states of partially zipped and unzipped conformations and transitions between them. The time evolution of the fraction of bound base pairs and the average fraction of bound base pairs over a cycle corroborates our findings. The peak frequency increases with increasing chain lengths and shows excellent scaling behavior. We also looked at SR signatures for a heterogeneous DNA where heterogeneity is introduced in the form of repeated blocks with two different types of base pairs. Remarkably, shows a sequence dependence: there is significant difference in depending on which end is unzipped first.
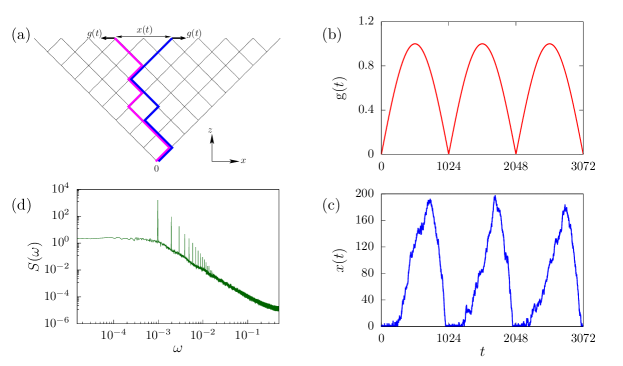
Model. In our model, the two strands of a homopolymer DNA are represented by two directed self-avoiding walks on a ()-dimensional square lattice. The walks, which start from the origin, are restricted to go towards the positive direction of the diagonal axis ( direction) without crossing each other [see Fig. 1(a)]. The directional nature of the walks ensures self-avoidance and the correct base pairing of the DNA strands. Two complementary monomers of the strands are allowed to occupy the same lattice site leading to a gain in energy (). To see the response of the system to a periodic force, one end of the DNA is anchored at the origin and a time-dependent periodic force is applied along the transverse direction ( direction) at the free end. denotes the amplitude and the frequency of the periodic force where is the time period.
Monte Carlo (MC) simulations of the model are performed using the Metropolis algorithm. Individual strands undergo Rouse dynamics involving local corner-flip or end-flip moves such that they do not cross each other. In the beginning of a Monte Carlo step, a random monomer of a randomly chosen strand is flipped. The move is accepted if it results in the overlapping of complimentary monomers giving rise to a base pair between the two strands. If the move results in the unbinding of a base pair, it is accepted with a Boltzmann probability for an interior monomer. If the monomer was initially in unbound form and after the flip remains so, the move is always accepted. If the move results in crossing of strands, it is rejected. If the chosen monomer lies along a straight line, the coordinate of the monomer and the change in energy would remain the same after flipping to preserve the bond length. Therefore, such a move is also accepted. For the end monomer, we again calculate the change in the energy () of the DNA configuration before and after the flipping of the monomer. In this case, an additional energy due to the pulling force, , where is the change in the distance after flipping the monomer, will also contribute. If the change in the energy , the move is always accepted. If , the move is accepted with the Boltzmann probability . Time is measured in Monte Carlo steps, with one step consisting of flip attempts whether the move is accepted or rejected. This is done to ensure that, on an average, in one time increment every monomer of the two strands has a chance to flip. Further, detailed balance is always satisfied throughout the simulation except for moves involving the end monomers.
Although the above model ignores finer details, such as bending rigidity of the dsDNA, sequence heterogeneity, and stacking of base pairs, to name a few, it has been found that the basic features, such as the first order nature of the unzipping transition and the existence of a re-entrant region allowing unzipping by decreasing temperature, are preserved by this model [25, 26]. For this model the zero force melting takes place at a temperature [27], where is the Boltzmann constant. Throughout this paper, we have chosen and . We work with temperatures which are lower than the melting temperature to prevent unzipping of DNA in the absence of a force. Most of the results presented are for .
In our simulations, the distance between the end monomers of the two strands, , as a function of time for various force amplitudes and frequencies are monitored. From Fig. 1(c), we can see that follows but with a lag. From the time series , we then obtain the power spectral density, , defined as the Fourier transform of autocorrelation function of ,
| (1) |
Here denotes the time average over the series. From the power spectral density , we can define an output signal as
| (2) |
serves as the resonance quantifier in our system. It is important to note that, in the case of some bistable systems, does not show a clear peak at resonance frequency. In such cases, signal-to-noise (SNR) ratio is used to identify SR [28]. SNR is defined as .
We present results for the output signal at different frequencies () and amplitudes () of the force and also at different temperatures (). In our study, is calculated from using the TISEAN 3.0.1 software package [29]. The average power spectral density is obtained by repeating the whole process for 50 different initial states for each set of frequency, amplitude, and temperature value.
Influence of force amplitude and temperature. In Fig. 1(b), we have plotted the time variation of the external periodic force for a DNA of length at a given value of and for three consecutive cycles. The corresponding time variation of the extension captures the folding and unfolding dynamics of the DNA with a largely unzipped state at the maximum of and a zipped state when [Fig. 1(c)]. The Fourier transform of the stationary correlation function of gives the power spectral density . As shown in Fig. 1(d), can be described as a superposition of a background spectral density and delta peaks at frequencies which are multiples of [2]. We then calculate the output signal () using Eq. (2).
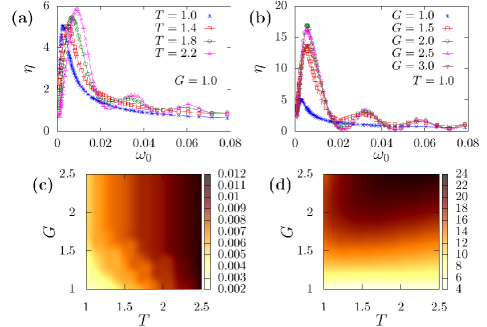
In Fig. 2(a), we have plotted as a function of at a fixed force amplitude () and for different values of temperature. At lower temperatures, increases with increasing frequency, reaching a peak value, and decreases as is increased further. For , the force amplitude lies slightly above the critical force needed to unzip the DNA and the majority of the monomers of the DNA are in the zipped state. For very low frequencies, the system is nearly in the equilibrium state and the is low. On the other hand, at very high frequencies, the oscillating force opens only a few of the base pairs and the resulting is small. If we start at high frequencies and begin to lower the frequency, the possibility of the DNA to relax to the oscillating force increases, leading to more base pair openings. At a certain critical frequency, we observe a peak in signaling SR [Fig. 2(a)].
As the temperature is raised (), the situation is very different. At these temperatures, we observe multiple smaller peaks in at higher frequencies. The presence of multiple peaks in the output signal is an indication of multiple stable and metastable states in the system and transitions between them. At higher temperatures the DNA is in an unzipped state and, with the oscillating force, the DNA settles into metastable states of partially zipped conformations. These partially zipped conformations occur near the base of the strands away from the end where the force is applied. With changing frequency, the system switches between these states resulting in secondary peaks in OS.
While increasing the temperature leads to multiple peaks in OS, changing temperatures can modify structural properties in an uncontrolled way by changing thermodynamic stability and therefore are best avoided. A better controlling parameter is the force amplitude. Indeed, in our system, we observe the same behavior when the temperature is kept fixed, while the force amplitude is varied [see Fig. 2(b)]. The primary peak in the output signal again shifts to higher frequency with increasing . At higher values of , secondary peaks of lower strength in start to appear. At these force amplitudes, the steady state of the system is one where the strands are completely unzipped. At low frequencies, the system can relax and settle into a zipped conformation giving rise to a primary peak in . With increasing frequencies, while it is difficult to settle into a completely zipped state, metastable states of partially zipped conformations are still possible. The occurrence of such states and the transitions between them leads to the secondary peaks in . This is the first main result of this paper.
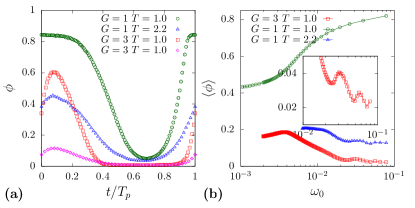
To quantify our claim about metastable states with partially zipped conformations, we looked at the time evolution of a fraction of bound base pairs () averaged over cycles at a given frequency for different values of force amplitudes () and temperatures () [see Fig. 3 (a)]. For all values of and , oscillates between (partially) zipped and (partially) unzipped states. For and , we looked at the time evolution of at the frequency where is maximum. starts from an almost completely zipped state () and with increasing goes to an almost unzipped configuration. At higher temperatures, , oscillates between a partially zipped and a nearly unzipped state.
While the time evolution of provides a picture of the transitions, it does not give a clear idea about the different peaks and troughs in . To do so, we looked at the average fraction of bound base pairs () over a cycle [see Fig. 3 (b)]. We plotted with the frequency of the periodic force at various values of and . At and , increases monotonically with increasing frequency indicating that the DNA is primarily in a zipped conformation. Strikingly, at a higher temperature, shows oscillations with increasing frequency similar to that observed in . The same feature is observed at .
In Fig. 2(c), we plot the phase diagram for the position of the peak frequency in the plane. At fixed , the peak shifts to higher frequencies with increasing . This shift is however nonmonotonic with increasing . At a higher , the peak frequencies are larger for the same temperature. In Fig. 2(d), we plot the phase diagram for the peak height in the plane. While the peak height increases marginally with increasing temperature for a fixed force amplitude, the variation is largely monotonic with increasing .
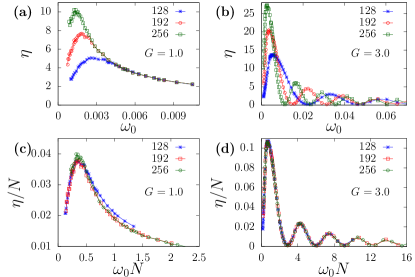
Influence of changing DNA lengths. In order to see what happens when we vary the length of the DNA, we observed the response of the system to periodic driving as is increased at a fixed temperature . In Fig. 4(a), we plot the output signal as a function of the driving frequency for three different chain lengths at . There is only one resonance peak for these parameter values as observed earlier. With increasing chain length, the peak height increases significantly and the resonance peak is sharper. The peak also shifts to lower frequencies with increasing length. In Fig. 4(b), we plot the output signal as a function of the driving frequency for three different chain lengths at . As expected, there are multiple secondary peaks for these parameter values. With increasing length, the peak positions shift to lower frequencies and the peak height increases.
The above observations indicate that, in the thermodynamics limit , the resonance peak frequency . This suggests a scaling of aa
| (3) |
where and are critical exponents. We observe excellent data collapse for both and with and [Figs. 4(c) and 4(d)]. This is the second main result of this paper.
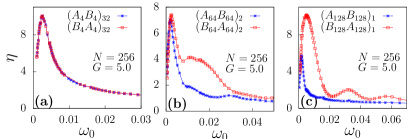
Influence of chain heterogeneity. We further ask if chain heterogeneity can lead to changes in the output signal. Heterogeneity in the DNA chain is introduced in the form of repeated blocks, or , where is the block length, and and are different types of base pairs with two- and three-hydrogen bonds, respectively. The introduction of chain heterogeneity implies that the end of the strands where the external periodic force is applied can be either an or base pair. We consider the variation of as a function of frequency at two different force amplitudes for different block lengths [, , ] as well as their opposite sequence [, , ] for a chain length .
The critical force is independent of the sequence of the DNA i.e., it does not matter whether the DNA is unzipped from the end having base pairing with three hydrogen bonds (stronger) or the base pairing with two hydrogen bonds. For periodic forcing with , we find that, for smaller block sizes like , shows a single resonance peak at lower frequency. For these block sizes, it again does not matter which end is being unzipped first (see Fig. 5(a)). However, as the block sizes increase, starts showing additional peaks at higher frequencies and there is a strong dependence on which end is unzipped first. For , multiple peaks are observed for sequences [see Fig. 5(b) and 5(c)]. With periodic forcing, it is easier to unzip the polymer end if the bonding is weaker. This is true where the pulling force is applied to A-type base pairs, i.e., for the sequences. The strands are therefore separated easier and these separated strands can explore more conformations. This difference in behavior of can serve as a measure to differentiate between block copolymer sequences and is the third main result of this paper.
Discussions. Motivated by experiments to probe how a DNA molecule which exhibits bistability by hopping between folded and unfolded conformations responds to an applied oscillating force, we have carried out a numerical study of SR in a periodically driven DNA. In line with experiments, we measured the power spectral density of the extension of the strands of the DNA and observed the frequency dependence of the output signal. The output signal quantifies SR in this system. We looked at how the various parameters in our numerical study such as the force amplitude, temperature, chain length, and heterogeneity influence the resonance behavior of the system.
A very interesting feature observed in our numerical study was the existence of multiple peaks in at a given force amplitude. The presence of multiple peaks in SR points to the existence of multiple stable and metastable states for a given force amplitude . This is equivalent to having multiple potential wells and particle hopping between them. While such cases have been reported earlier in an array of underdamped, nonlinear oscillators [30] and in a Fermi-Pasta-Ulam chain [31], this is a report of such a situation in a DNA chain.
While our numerical study exhibits some of the known features of SR in periodically driven DNA chains and predicts several others including the multiple peaks and a unique scaling behavior with increasing chain lengths, it does not have the experimental features like trap stiffness and DNA handles which have been shown to affect SR [10]. Langevin dynamics simulations with detailed set-up similar to experimental ones [23] will be able to give us a better understanding of the effect of these parameters. In addition, we would like to explore the role of bond stiffness and bending rigidity of the DNA in these systems. Further, exploring other SR quantifiers like the average mechanical work per period of the oscillation [32] and extracting the kinetic rates of hopping of molecules by measuring the frequency of resonance will be the subject of future studies.
Acknowledgments. We acknowledge the use of the computing facility at IISER Mohali. We thank an anonymous referee for valuable suggestions.
References
- Benzi et al. [1981] R. Benzi, A. Sutera, and A. Vulpiani, Journal of Physics A: mathematical and general 14, L453 (1981).
- Gammaitoni et al. [1998] L. Gammaitoni, P. Hänggi, P. Jung, and F. Marchesoni, Reviews of modern physics 70, 223 (1998).
- Wellens et al. [2004] T. Wellens, V. Shatokhin, and A. Buchleitner, Reports on progress in physics 67, 45 (2003).
- Simon and Libchaber [1992] A. Simon and A. Libchaber, Physical review letters 68, 3375 (1992).
- Mahato and Jayannavar [1998] M. C. Mahato and A. Jayannavar, Physica A: Statistical Mechanics and its Applications 248, 138 (1998).
- Gammaitoni [1995] L. Gammaitoni, Physics Letters A 208, 315 (1995).
- Wiesenfeld et al. [1994] K. Wiesenfeld, D. Pierson, E. Pantazelou, C. Dames, and F. Moss, Physical Review Letters 72, 2125 (1994).
- Grifoni and Hänggi [1996] M. Grifoni and P. Hänggi, Physical review letters 76, 1611 (1996).
- Witthaut et al. [2009] D. Witthaut, F. Trimborn, and S. Wimberger, Physical Review A 79, 033621 (2009).
- Hayashi et al. [2012] K. Hayashi, S. de Lorenzo, M. Manosas, J. Huguet, and F. Ritort, Physical Review X 2, 031012 (2012).
- Bhattacharjee [2000] S. M. Bhattacharjee, Journal of Physics A: Mathematical and General 33, L423 (2000).
- Danilowicz et al. [2004] C. Danilowicz, Y. Kafri, R. Conroy, V. Coljee, J. Weeks, and M. Prentiss, Physical review letters 93, 078101 (2004).
- Kapri et al. [2004] R. Kapri, S. M. Bhattacharjee, and F. Seno, Physical review letters 93, 248102 (2004).
- Kalyan and Murthy [2015] M. S. Kalyan and K. Murthy, Physica A: Statistical Mechanics and its Applications 428, 38 (2015).
- Volkov and Solov’yov [2009] S. Volkov and A. Solov’yov, The European Physical Journal D 54, 657 (2009).
- Gammaitoni et al. [1989] L. Gammaitoni, E. Menichella-Saetta, S. Santucci, F. Marchesoni, and C. Presilla, Physical Review A 40, 2114 (1989).
- Hatch et al. [2007] K. Hatch, C. Danilowicz, V. Coljee, and M. Prentiss, Physical Review E 75, 051908 (2007).
- Kumar and Mishra [2013] S. Kumar and G. Mishra, Physical Review Letters 110, 258102 (2013).
- Kapri [2014] R. Kapri, Physical Review E 90, 062719 (2014).
- Pal and Kumar [2018] T. Pal and S. Kumar, EPL (Europhysics Letters) 121, 18001 (2018).
- Kalyan and Kapri [2019] M. S. Kalyan and R. Kapri, The Journal of Chemical Physics 150, 224903 (2019).
- Yadav and Kapri [2021] R. K. Yadav and R. Kapri, Physical Review E 103, 012413 (2021).
- Kapri [2021] R. Kapri, Physical Review E 104, 024401 (2021).
- Huguet et al. [2009] J. M. Huguet, N. Forns, and F. Ritort, Physical review letters 103, 248106 (2009).
- Marenduzzo et al. [2001a] D. Marenduzzo, S. M. Bhattacharjee, A. Maritan, E. Orlandini, and F. Seno, Physical review letters 88, 028102 (2001a).
- Marenduzzo et al. [2001b] D. Marenduzzo, A. Trovato, and A. Maritan, Physical Review E 64, 031901 (2001b).
- Kapri [2012] R. Kapri, Physical Review E 86, 041906 (2012).
- Stocks [1995] N. Stocks, Il Nuovo Cimento D 17, 925 (1995).
- Hegger et al. [1999] R. Hegger, H. Kantz, and T. Schreiber, Chaos: An Interdisciplinary Journal of Nonlinear Science 9, 413 (1999).
- Lindner et al. [2001] J. F. Lindner, B. J. Breen, M. E. Wills, A. R. Bulsara, and W. L. Ditto, Physical Review E 63, 051107 (2001).
- Miloshevich et al. [2009] G. Miloshevich, R. Khomeriki, and S. Ruffo, Physical review letters 102, 020602 (2009).
- Mossa et al. [2009] A. Mossa, S. de Lorenzo, J. M. Huguet, and F. Ritort, The Journal of chemical physics 130, 234116 (2009).