Modelling UX Ori Star Eclipses based on Spectral Observations with the Nordic Optical Telescope. I. RR Tau
Abstract
Based on observations obtained with the Nordic Optical Telescope we investigate the spectral variability of the Herbig Ae star RR Tau. This star belongs to the UX Ori family, characterized by very deep fadings caused by the screening of the star with opaque fragments (clouds) of the protoplanetary discs. At the moments of such minima one observes strong spectral variability due to the fact that the dust cloud occults, for an observer, not only the star but also a part of the region where the emission spectrum originates. We calculated a series of obscuration models to interpret the observed variability of the H line parameters. We consider two main obscuration scenarios: (1) the dust screen rises vertically above the circumstellar disc, and (2) the screen intersects the line-of-sight moving azimuthally with the disc. In both cases the model of the emission region consists of a compact magnetosphere and a magneto-centrifugal disc wind. Comparison with observations shows that the first scenario explains well the variability of the radiation flux, the equivalent width, as well as the asymmetry of the H line during eclipses, while the second scenario explains them only partly. This permits us to suggest that in the case of RR Tau, the main causes of the eclipses are either a structured disc wind, or the charged dust lifted along the field lines of the poloidal component of the magnetic field of the circumstellar disc.
keywords:
stars: pre-main-sequence – stars: winds, outflows – stars: individual: RR Tau – line: formation – techniques: spectroscopic1 Introduction
The UX Orionis type of stars (UXORs) are young stars of mainly A - F spectral types. They stand out from other young stars by exhibiting large amplitude flux variations in a specific manner: their brightness undergoes sporadic weakening with an amplitude of up to 2-3m in the V - band and with duration from several days to several weeks (see e.g. Rostopchina et al., 1997). The origin of this variability lies is the non-homogeneous structure of their protoplanetary discs and the small inclination of the latter to the line of sight (Grinin et al., 1991), giving rise to changes in the circumstellar (CS) extinction caused by the passage of opaque gas and dust fragments from the CS discs across the stellar disc.
During such events the observed radiation of UXORs strongly changes. Its linear polarization increases. When the stars fade their reddening turns to blueing although the brightness continues to decrease (the so-called blueing effect). The scattered radiation of the protoplanetary discs plays a key role in all these changes (Grinin, 1988). In the bright state of the star the scattered light is present as a small addition to the observed radiation of the star. During eclipses its relative contribution increases because the dusty screen serves as a natural coronograph: when occulting the star it does not obscure the protoplanetary disc, as seen from the observer111Exceptions are very long-lasting eclipses when the dust screen is able to obscure the inner part of the disc, where a noticeable part of the scattered radiation forms (Shulman & Grinin, 2022).. Consequently, the brightness of the star cannot diminish more than to a given level determined by the scattered radiation. This is why the amplitude of the brightness minima in all UXORs do not exceed 2 - 3 stellar magnitudes: namely such is the level of the scattered radiation in the optical region for a typical protoplanetary disc (about 10% of the out-of-eclipse star brightness).
Another consequence of the coronographic effect is the spectral variability of UXORs during eclipses. When the star fades, the equivalent width of the H emission line increases (Kolotilov, 1977; Herbst et al., 1983; Grinin et al., 1994; Kozlova et al., 2000, 2006; Rodgers et al., 2002). This is explained by the fact that the emission spectra are formed in the extended regions which are only partially obscured by the dusty screen.
The spectrographs used in most of the works devoted to UXORs have had a low spectral resolution. In this paper we present the first results of a large program of monitoring of the spectral variability of these stars, based on high resolution spectra obtained with the Nordic Optical Telescope (NOT). The star RR Tau investigated in the present paper is one of the most photometrically active UXORs. Using the spectra obtained at the different states of their brightness, we model the observed variability of the H line. We probe physical features and parameters both of the screening object and the obscured disc wind.
2 Observations
2.1 Observational strategy
The observational project aimed at studying the behaviour of the line profiles as the program stars were going through their faint states. We selected four different UXORs, among them RR Tau, the focus of this paper. In order to sample spectroscopically these rapidly and irregularly variable stars and follow them through deep fading events, two requirements were essential: 1) a flexible telescope scheduling mode and 2) frequent photometric monitoring and a rapid communication of alerts in order to know when to trigger the spectroscopic observations.
The first was fulfilled by the Target-of-Opportunity (ToO) program offered at the NOT (Djupvik & Andersen, 2010) and its permanently available fibre-fed spectrograph. The second has been possible through strong synergy with observers in the Swedish Amateur Astronomy association SAAF222Svensk AmatörAstronomisk Förening who reported photometric magnitudes and alerted when a fading seemed to be taking place. Due to the rapid and irregular flux variability, it happened that what seemed to be the start of a fading, was not, or a fading could be over before we could obtain spectroscopy. Evidently, good weather was required both for the photometric monitoring as well as for the follow-up spectroscopy, and in addition to some luck that the alerts coincided with available service nights at the NOT. The success of the observational project relied heavily on the collaboration with SAAF.
2.2 Photometric monitoring by SAAF observers
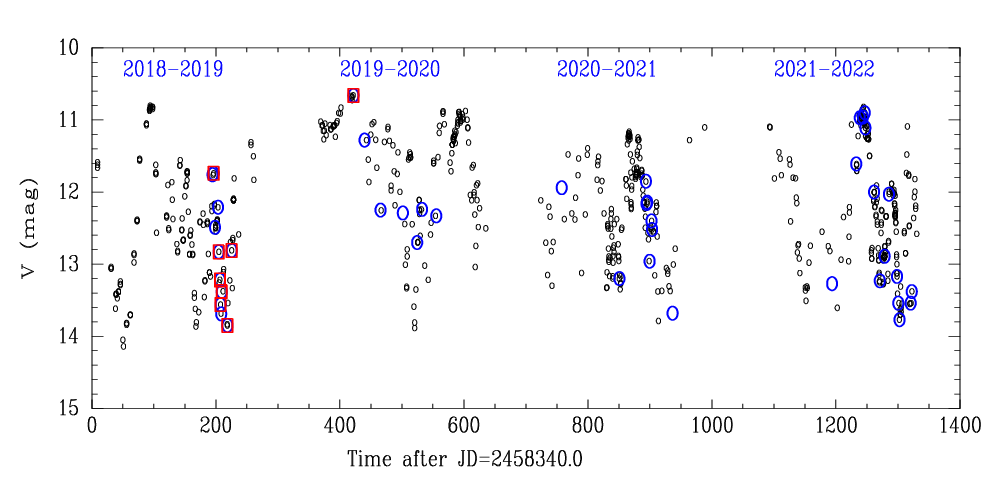
The photometry reported to us by SAAF was used to decide when to trigger a ToO observation at the NOT. Nevertheless, all the photometric data points are of value for the study of the photometric variability. These data are available, since practically all the SAAF photometry was promptly uploaded to the AAVSO333The American Association of Variable Star Observers database. An overview of the photometry from SAAF is shown in Fig. 1 together with indications of when spectra were obtained. In this paper we list only the V-band magnitude obtained nearest in time to each spectrum in Table 1 in order to give an idea of the faintness of the target at each epoch. In some cases the nearest photometric data point was obtained from the general AAVSO database. The separation in time between the photometry and the spectrum is given as an offset in fractional days. The median time difference is 6 hours.
2.3 FIES/NOT spectroscopy
We used the NOT’s high-resolution FIber-fed Echelle Spectrograph (FIES) with its low-resolution fibre, giving a resolving power of R 25000 (Telting et al., 2014). We aimed at the above resolution in order to provide a S/N ratio of around 30 in the V-band continuum while limiting the exposure time to 1800 seconds even when the target was in a faint state. As seen in Table 1 this aim was not always reached, mainly due to adverse sky conditions. In spite of the sometimes low S/N ratio in the continuum, however, the emission lines relative to the continuum increase by contrast when the star fades, therefore providing a sufficient spectral quality in most cases. The FIES throughput augmented after recoating the spectrograph mirrors in July 2021.
The wavelength coverage of FIES is around 3700 - 9100 Å in one setting for the low-resolution fibre. (The exact wavelength coverage shifted slightly upon operation inside the spectrograph, for instance when installing a pressure tank for the echellogram in June 2019.) The more than 90 spectral orders are spread out on the 2k 2k detector (CCD15), a deep-depleted CCD from e2v installed in 2016. Beyond 8300 Å there is no order overlap, but some gaps between orders, because the detector is not big enough to sample the full echellogram. Standard calibrations (21 halogen flats, 7 biases, and one ThAr) were obtained each afternoon. Data reduction was made with the FIEStool pipeline444FIEStool manual, Stempels 2005, Nordic Optical Telescope, see http://www.not.iac.es/instruments/fies/ version 1.5.1 until August 2021 when upgraded to version 1.5.2 with improved handling of the merging of overlapping orders. The merged spectra output from FIEStool were normalised by fitting a continuum and put on a heliocentric velocity grid using standard tasks in the IRAF package.
A specific feature seen in the RR Tau spectra in deep minima are ghosts from the very strong H emission line which peaks at 40 times the continuum. The ghosts are visible as broad double-peaked emission profiles in the neighbouring orders.
| DATE-TIME | S/N | V | t | ||
|---|---|---|---|---|---|
| mag | mag | days | |||
| 2019-02-19T22:59:30.86 | 1.10 | 23 | 11.76 | 0.03 | 1.04 |
| 2019-02-21T20:36:06.43 | 1.01 | 38 | 11.74 | 0.02 | -0.07 |
| 2019-02-23T22:21:30.47 | 1.06 | 26 | 12.49 | 0.01 | 0.87 |
| 2019-03-01T00:44:39.97 | 1.74 | 31 | 12.21 | 0.04 | -0.03 |
| 2019-03-01T21:30:28.18 | 1.03 | 27 | 12.83 | 0.05 | 0.28 |
| 2019-03-03T21:53:49.98 | 1.07 | 15 | 13.22 | 0.04 | 0.10 |
| 2019-03-04T21:44:01.71 | 1.06 | 18 | 13.56 | 0.05 | 0.05 |
| 2019-03-05T22:13:37.97 | 1.12 | 5 | 13.69 | 0.02 | -0.14 |
| 2019-03-06T22:37:21.18 | 1.19 | 13 | 13.38 | 0.03 | 2.10 |
| 2019-03-15T22:32:47.64 | 1.29 | 11 | 13.85 | 0.05 | 0.03 |
| 2019-03-22T21:30:34.36 | 1.17 | 28 | 12.81 | 0.04 | 0.04 |
| 2019-10-05T05:44:09.37 | 1.01 | 81 | 10.66 | 0.03 | -0.13 |
| 2019-10-23T06:16:50.18 | 1.04 | 48 | 11.28 | 0.02 | 2.87 |
| 2019-11-18T02:26:59.04 | 1.02 | 26 | 12.25 | 0.01 | 0.79 |
| 2019-12-24T02:49:04.77 | 1.10 | 26 | 12.29 | 0.10 | 0.20 |
| 2020-01-16T00:25:32.93 | 1.03 | 15 | 12.70 | 0.03 | 0.88 |
| 2020-01-23T21:31:25.25 | 1.06 | 14 | 12.24 | 0.03 | -1.02 |
| 2020-02-15T23:01:18.91 | 1.07 | 23 | 12.33 | 0.02 | -1.10 |
| 2020-09-05T05:20:19.37 | 1.25 | 36 | 11.94 | 0.10 | -0.79 |
| 2020-12-07T03:35:39.87 | 1.07 | 13 | 13.20 | 0.01 | -0.11 |
| 2021-01-19T00:16:57.89 | 1.03 | 32 | 11.85 | 0.01 | -0.09 |
| 2021-01-19T22:08:55.65 | 1.03 | 38 | 12.16 | 0.06 | 1.09 |
| 2021-01-20T23:16:07.67 | 1.00 | 35 | 12.14 | 0.07 | 0.17 |
| 2021-01-24T23:22:42.22 | 1.01 | 22 | 12.96 | 0.04 | -0.73 |
| 2021-01-27T23:28:32.99 | 1.02 | 30 | 12.40 | 0.01 | 0.26 |
| 2021-01-29T00:42:48.85 | 1.14 | 30 | 12.52 | 0.01 | -0.15 |
| 2021-03-02T23:22:00.51 | 1.29 | 12 | 13.68 | 0.10 | -0.88 |
| 2021-11-15T03:06:35.64 | 1.00 | 24 | 13.27 | 0.10 | -0.91 |
| 2021-12-24T04:40:59.71 | 1.54 | 48 | 11.61 | 0.03 | 0.59 |
| 2021-12-30T00:55:16.85 | 1.00 | 57 | 10.97 | 0.05 | -0.03 |
| 2022-01-04T00:30:33.85 | 1.00 | 67 | 10.96 | 0.03 | 0.26 |
| 2022-01-07T00:27:09.24 | 1.01 | 47 | 10.90 | 0.05 | -0.07 |
| 2022-01-08T02:33:45.72 | 1.21 | 52 | 11.11 | 0.10 | -0.10 |
| 2022-01-21T20:57:24.34 | 1.13 | 47 | 12.00 | 0.03 | 0.28 |
| 2022-01-31T02:56:47.39 | 1.95 | 17 | 13.23 | 0.02 | -0.33 |
| 2022-02-07T22:37:24.84 | 1.01 | 28 | 12.89 | 0.01 | -0.13 |
| 2022-02-14T21:16:51.39 | 1.00 | 41 | 12.03 | 0.03 | 0.34 |
| 2022-02-27T22:56:20.11 | 1.17 | 21 | 13.17 | 0.10 | -0.08 |
| 2022-03-01T21:14:07.14 | 1.02 | 18 | 13.54 | 0.05 | 0.10 |
| 2022-03-03T22:09:27.26 | 1.10 | 13 | 13.77 | 0.05 | -0.08 |
| 2022-03-21T21:42:39.13 | 1.20 | 10 | 13.54 | 0.03 | -1.14 |
| 2022-03-23T20:45:12.14 | 1.09 | 16 | 13.38 | 0.04 | 0.24 |
| 2022-10-05T04:24:48.75 | 1.09 | 6 | n.a. | n.a. | n.a. |
| 2022-10-08T01:42:32.91 | 1.81 | 48 | 11.30 | 0.10 | 0.96 |
| 2023-01-06T23:03:46.17 | 1.03 | 63 | 10.80 | 0.10 | -4.12 |
3 Observational data
For RR Tau we obtained 45 spectra in the period from February 2019 to January 2023, spanning a brightness range from V = 10.7 mag to V = 13.9 mag. The observational details are listed in Table 1.
Examples of selected regions of some observed spectra are shown in Fig. 2 in the star coordinate system, using the radial velocity RV = 11 km s-1 for RR Tau (Grinin et al., 2001). We chose to show the eclipse moments observed in March 2019. They are shown between two bright states of the star (2019-02-21 and 2019-10-05). The regions are: the prominent hydrogen emission lines H and H, the sodium lines Na I D and the photospheric iron line Fe II 4924 Å. The left panel showing H includes the value of the V-magnitude for the given date. It is seen from the figure that when the star is occulted, the Balmer hydrogen lines become strongly intensive, the sodium and iron lines have an emission, and the absorption component of the He I 5876 Å line weakens or is completely absent (seen next to the sodium lines). The Fe II line is observed as a photospheric line in the bright state and transforms to a blue-shifted emission line in the weak state. Analogous changes are observed for the two other components of this multiplet. The same effect was observed in the RR Tau spectra by Rodgers et al. (2002).


4 Modelling
We model the eclipses of RR Tau in the framework of two obscuration scenarios. We consider the dust and gas fragment of the protoplanetary disc or/and disc wind (cloud) which intersects the line-of sight (LOS), and model these dust clouds as simple screens. Up to now the origin of such fragments is unknown (see Discussion). Therefore we consider a simplified model of the screening body. Our goal is to clarify what type of screen motion is realized or dominates at the moments of the eclipse: vertical or horizontal.
4.1 Obscuration scenarios
In both scenarios the screen is placed at a distance equal to the dust sublimation radius which is assumed to be at 0.45 AU or 46 (Natta et al., 2001; Dullemond et al., 2001; Tannirkulam et al., 2007; Flock et al., 2017). The edge-on and pole-on sketches of the scenarios are shown in Fig. 3.
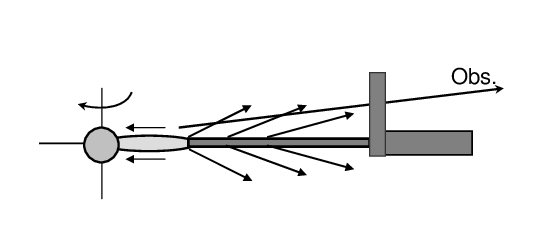
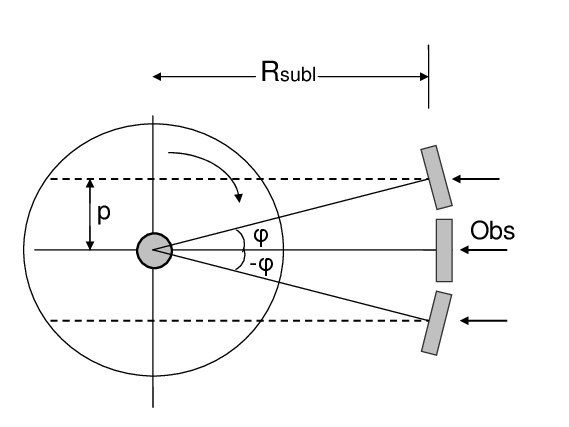
In the first scenario we fix the screen at some angle and raise it up gradually, calculating the line profiles at each height of the screen (Fig. 4 (1)). We assume that during an eclipse the location of the screen does not change azimuthally. Then we reposition the screen to the next azimuthal angle and repeat this procedure. In this manner we "reproduce" a situation where dust is lifted with the gas in the disc or in the dusty disc wind. The opacity of the screen does not change over the screen’s width but it varies with its height: the higher the screen, the more dense layers appear.
The optical depth of the screen is derived as follows
| (1) |
where , that is the height of the screen minus the height counted from the disc surface till the cross-point of the LOS with the screen, is the opacity of the screen at the height , and and are free parameters, chosen in such a way as to avoid a steep opacity gradient.
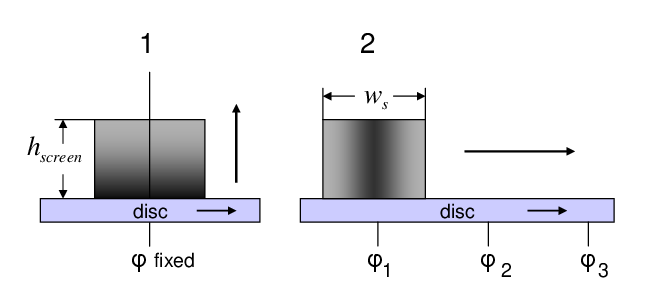
In the second scenario the screen also has a finite size , and is located at a fixed at the dust sublimation radius. The height of the screen is fixed and constant; it has to be high enough to occult the star’s light at the given inclination angle. The optical depth of the screen’s matter does not depend on the screen’s height but depends on its width (Fig. 4 (2)). In the 2nd scenario we "move" the screen over "reproducing" a situation when a dust and gas cloud - i.e. a disc or disc-wind fragment, or a protoplanet - orbits the star and its vicinity. We used the Gauss function to give the screen’s opacity in this case
| (2) |
where , and is the cross-point of the screen with the LOS, and are parameters.
4.2 Disc wind, accretion and scattered light models
The UX Ori type star RR Tau is a Herbig Ae star. Herbig stars do not possess strong magnetic fields, typical values are 100-200 G (Wade et al., 2007, 2009; Alecian et al., 2013a, b; Hubrig et al., 2015; Järvinen et al., 2019; Mendigutía, 2020). They are also known to be rapidly (100-250 km s-1) rotating stars (Mora et al., 2001; Grinin et al., 2001). One more characteristic feature of these stars is a compact accreting region that may be a consequence of the high rotation velocities and weak magnetic fields. This follows both from observational investigations (Cauley & Johns-Krull, 2014, 2015) and from spectroscopic and interferometric modelling of their emission spectra (Garcia Lopez et al., 2015; Caratti o Garatti et al., 2015; Kreplin et al., 2018; Tambovtseva et al., 2014, 2016, 2020). More information on the current knowledge of Herbig stars (and UXORs) can be found in the recent review by Brittain et al. (2023). In the models of the RR Tau emission spectra we take into account the contribution of the continuum emission (star) and the line emission (disc wind plus magnetospheric accretion + disc scattered radiation).
4.2.1 Disc wind
Our disc wind model is based on the theory of a magneto-centrifugal disc wind developed for the accretion discs surrounding black holes by Blandford & Payne (1982) and applied to young stellar objects by Pudritz & Norman (1986). The geometry and kinematics of the disc wind obtained from solutions of the magnetohydrodynamic (MHD) equations can be reproduced with the method of parametrization. Following Kurosawa et al. (2006) who developed it for the low mass T Tauri stars (TTS), we applied it for Herbig AeBe stars taking into account their special features. Besides we introduced the co-rotation zone because the disc wind removes an excess of the angular momentum from the system as is shown by the solution of the MHD equations (Safier, 1993).
We took into account that the gas in the disc wind is rapidly heated by ambipolar diffusion up to 10 000 K (Safier, 1993; Garcia et al., 2001). We assume that the disc wind consists of hydrogen atoms with a constant temperature (10 000 K) except for the regions just above the disc surface where the temperature is not high enough to excite hydrogen line emission. According to our calculations the gas has to be heated to at least 6000 K, therefore we exclude from consideration the very base of the disc wind.
An algorithm of disc wind modelling is as follows ((Tambovtseva et al., 2014));
1) We divide the wind region in a number of streamlines, and choose the parameters of the wind that determine the needed geometry, kinematics and mass loss rate. Then we compute the velocity and density distribution throughout the region.
The main model parameters are as follows. The footpoints of the disc and refer to the wind launching region for the first and last streamlines, respectively. is the half opening angle between the first streamline and the vertical axis. The poloidal velocity component changes along the streamlines, as given by
| (3) |
Here and are the initial and terminal velocities, and is a free parameter which permits us to vary the acceleration of the gas. We assume to be the sound velocity in the disc wind. The terminal velocity is =, where is the Keplerian velocity at the footpoint on the disc surface for the th streamline, and is a scale factor. Kurosawa et al. (2006) used for TTS = constant in their calculations. In reality, the parameter can change with the distance because the strength of the magnetic field decreases with .
The tangential velocity changes with the cylindric radius as follows: In the co-rotation zone (
| (4) |
in the zone of the conservation of the angular momentum
| (5) |
where is a free parameter. It permits us to introduce a boundary between the corotation zone and the zone of the conservation of the angular momentum.
The last two parameters are the mass loss rate and a parameter .
| (6) |
where is the local meaning of the mass loss rate per unit area on the disc surface and the factor 2 takes into account the mass loss through both surfaces of the disc (above and below). The disc itself treated as geometrically thin.
| (7) |
where is a free parameter which regulates the mass loading among the streamlines. The dependence of the line profiles on is presented in Grinin & Tambovtseva (2011).
2) For all emitting volumes around the star we performed a non-LTE modelling of the radiative transfer. The algorithm of the calculations is described in detail by Grinin & Tambovtseva (2011). The solution of the radiative transfer problem is based on the numerical code developed for media with large velocity gradients. The source functions were calculated in the Sobolev approximation (Sobolev, 1960), and the intensity of the radiation emergent at frequencies within a spectral line was calculated by exact integration over spatial coordinates in the approximation of full redistribution over frequency in the co-moving coordinate system. We took into consideration 15 hydrogen levels and the continuum, and used the Doppler profile of the absorption coefficient. The Stark broadening is negligible in our models.
3) We compute the intensities of the hydrogen line at the given frequencies in the integration region. The results are presented as line profiles, all of them are normalized to the star continuum which varies during an eclipse.
4.2.2 Accretion
In spite of the fact that Herbig Ae stars have small magnetic fields and small accreting region they are able to accrete disc matter onto the stars (see e.g. Vink et al., 2002, 2005; Mottram et al., 2007; Ababakr et al., 2017). Taking into account weak magnetic fields and fast rotation (100 - 200 km s-1), one can expect a different configuration of the magnetosphere compared to that of TTS. We can assume that the accreting matter does not come to the pole region of the star but to the middle latitudes, closer to the equator. We call this region the disc accretion zone.
The radial velocity of the gas is determined from the solution of the equation of motion under gravity:
| (8) |
where is the distance from the stellar center, the gravitational constant, and the mass of the star.
The rotational gas velocity is determined by a power law
| (9) |
where is the distance from the star, is the rotational velocity of the star at the point where gas reaches its surface, and is a parameter. The electron temperature was chosen following the law
| (10) |
where is a parameter and the electron temperature at the stellar surface.
4.2.3 Scattered light
As mentioned above, the brightness of UXORs cannot drop during an eclipse more than a few stellar magnitudes. This is due to the presence of the stellar radiation scattered by the disc and/or the disc wind . This additional emission can easily be extracted from the observed total emission :
| (11) |
where is the out-of-eclipse radiation of the star, the optical depth of the body screening the star at the wavelength .
Knowing the maximum changes in the brightness at the moment of an eclipse from photometric observations , one can obtain the contribution of the stellar radiation scattered by the CS dust into the out-of-eclipse radiation of the star
| (12) |
observed in the minima of UX Ori itself is usually 2 - 3 stellar magnitudes while that of RR Tau is 3 - 4 stellar magnitudes. Thus, estimates of the contribution of the scattered light for UX Ori is about 10% of the out-of-eclipse star brightness while for RR Tau this addition is about of 3% (Rostopchina et al., 1997). When modeling we add this amount of the scattered radiation to the intensity of radiation during eclipses.
4.2.4 Radiation flux in the H line
The radiation flux in the continuum at the observational moment is determined as follows
| (13) |
where , and is the star’s magnitude taken in the bright state and used as a unit555Here we assume that variation of the flux in the continuum of the star near the H line is close to the variation of the flux in the V-band. The radiation flux in the H line is given by the next expression
| (14) |
where is the equivalent width of the H line at the same moment . In order to obtain the radiation flux normalized to the flux in the bright state one has to divide by the meaning of the equivalent width at the bright state . The radiation flux in the emission lines has to decrease with the fading of the star because the gas and dust screen obscures regions of the disc wind.
5 Result
The aim of our modelling is to investigate the behavior of the H line profiles and their main parameters during eclipses. As mentioned above, the close vicinity of the star undergoes strong variations both due to intrinsic reasons (e.g., variable accretion rate) and external ones (variable extinction). Therefore we chose accretion and disc wind parameters which reproduce in total the observed line profiles and do not contradict the theoretical background.
We considered several hybrid models consisting of the same accretion model and different disc wind models. Here we present two of them: H1 and H2 whose disc wind parameters DW1 and DW2 correspondingly are given in Table 2.
| Model | |||||
|---|---|---|---|---|---|
| degree | yr-1 | ||||
| DW1 | 2 - 3.5 | 30 - 45 | 3 | 5 | |
| DW2 | 2 - 6 | 30 - 60 | 3 | 5 |
Here are the cylindric radii restricting the disc wind launching region, are the first and the last half opening angles of the disc wind, is a parameter that "distributes" the matter over streamlines, is a parameter in the poloidal velocity law, and is the total mass loss rate.
In the accretion model = 10 000 K, = 1/3, = 70 km s-1, the half-thickness of the magnetosphere is 0.75, the corotation radius is and the accretion rate is yr-1.
We assume next the parameters of RR Tau to be: the mass of the star , the radius R K, (Rostopchina, 1999). We use the Kurucz model with K and (Kurucz, 1979). All calculations have been made for the inclination angle ( means the pole-on viewing). This angle is chosen as the more probable for UXORs seen nearly edge-on (see e.g. Grinin et al., 1991; Kreplin et al., 2013, 2016).
5.1 The first obscuration scenario
The dependence of the optical depth on the screen’s height obeys Eq. 1. After probing different variants we chose as the appropriate parameters . For both hybrid models, differing only by the disc wind models, we calculated the H line profiles with screens of different widths. Besides we calculated the equivalent widths of the line profiles, the radiation fluxes in the line , and the blue-to-red peak ratios, which following tradition we give as V/R for violet/red. Thus, we obtained the behavior of the line profile parameters when the star is fading and compared it with the observed one.
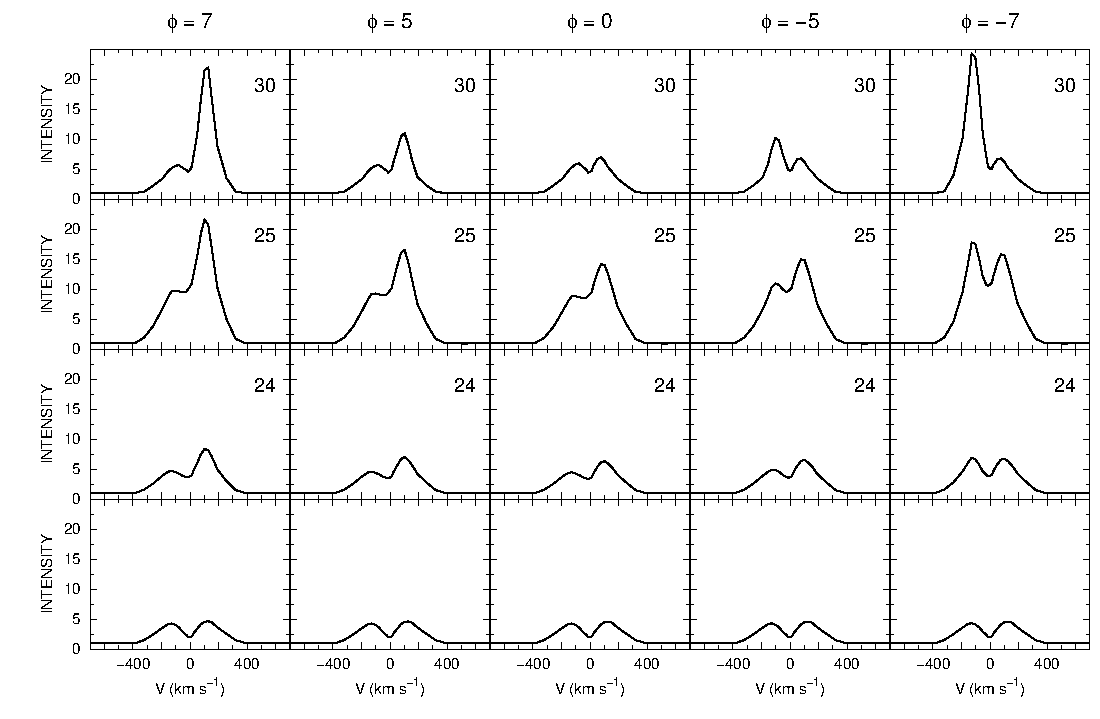
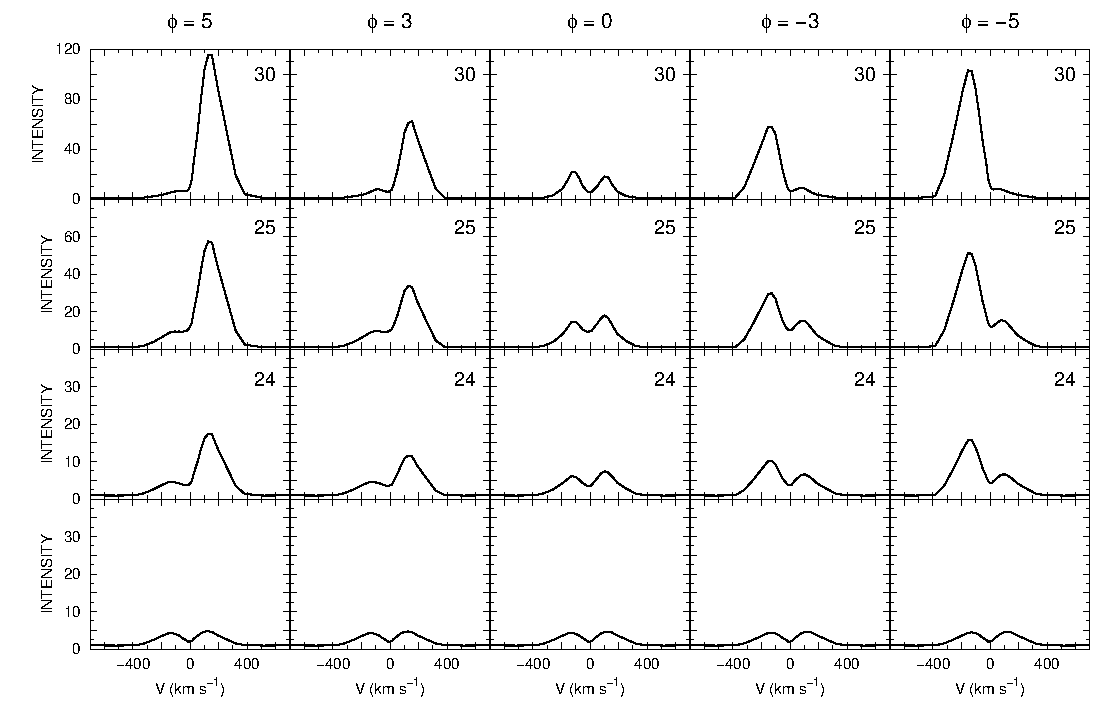
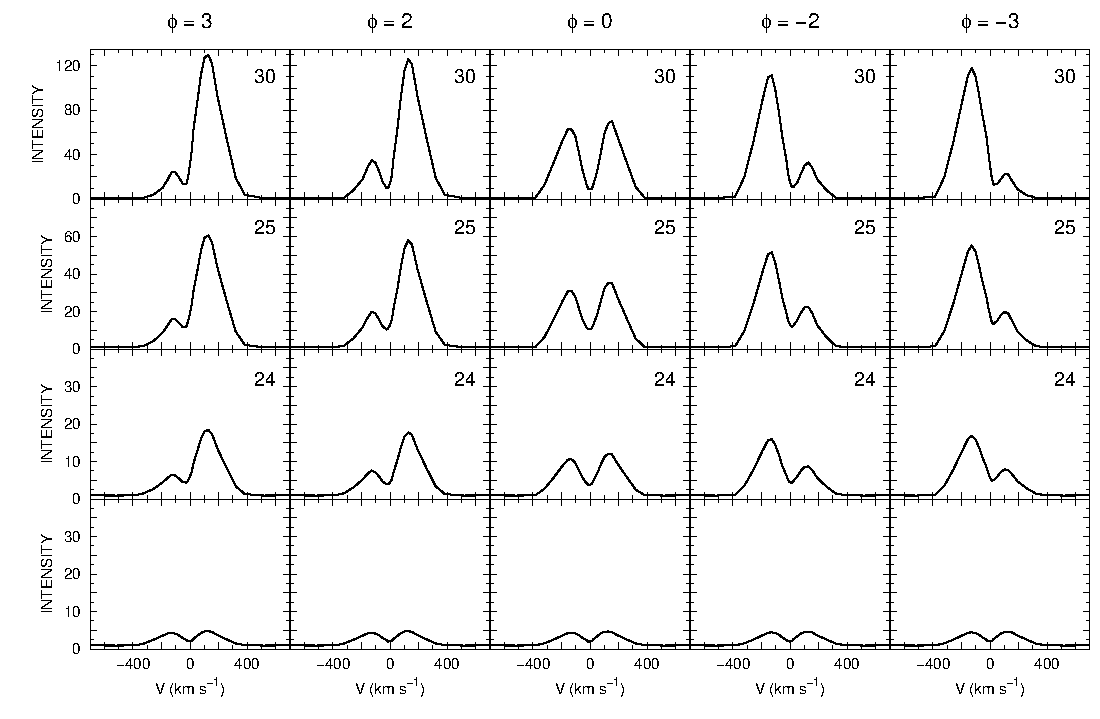
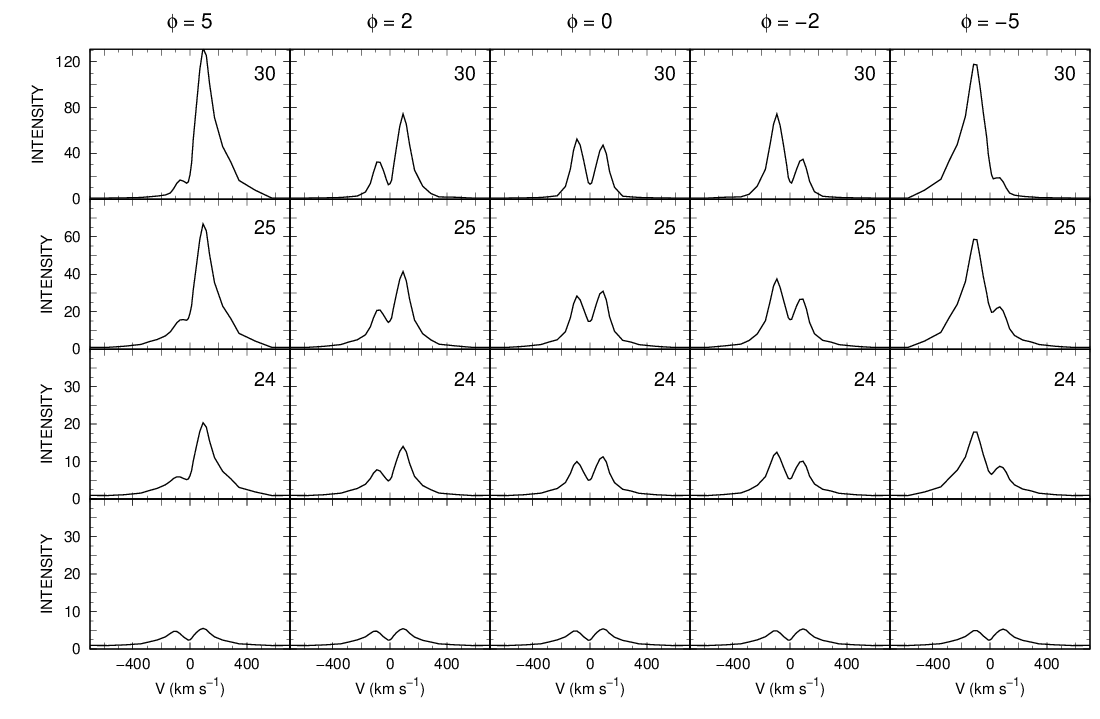
Figures 5, 6, and 7 show the H line profiles calculated with model H1 for different widths of the screen equal to 20, 10 and 5 respectively. The columns refer to different values of the azimuthal angle , and the rows show the line profiles at different heights of the screen. The lowest rows demonstrate the line profiles when the star is in the normal (bright) state. When the height of the screen increases, the star continuum decreases, and the intensities of the line profiles also decrease. In order to compare the model profiles with those observed, we normalized their intensities to their current continuum, thus the intensities of the model profiles grow with decreasing brightness. When the dusty screen reaches the height of the star continuum falls off so strongly that only the scattered light dominates.
When the star enters the brightness minimum the violet peak gradually decreases if the screen is located at positive values of because it covers the matter approaching towards the observer. When the star goes out of the minimum the blue peak is restored and the red one decreases because the screen now covers the matter moving away from the observer (negative ). This is seen more clearly in the case of a small screen (Figs. 6 and 7).
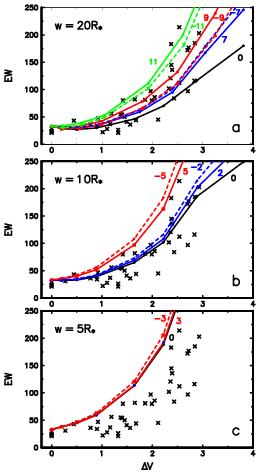
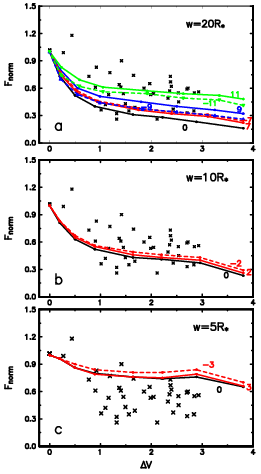
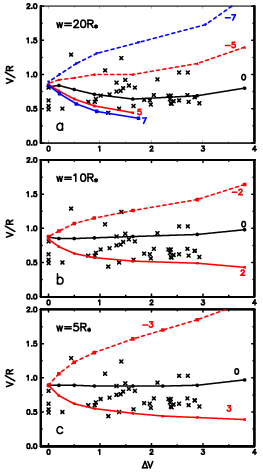
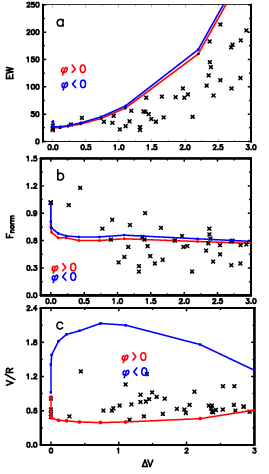
The behavior of the equivalent widths (EWs), the ratio of the blue to red intensity peaks of the H line profiles (V/R), and the radiation fluxes in the line during eclipses on the star brightness in the visible region of the spectrum for the hybrid model H1 is shown in Fig. 8. The crosses mark the observational data.
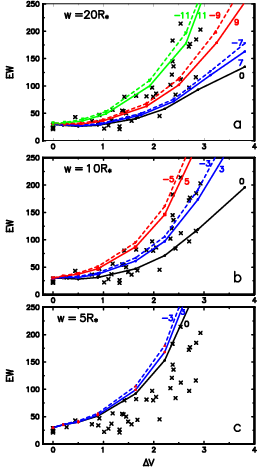
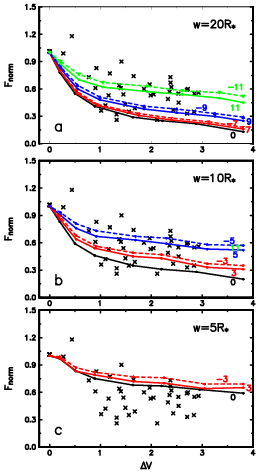
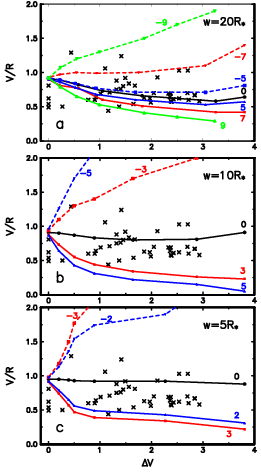
The EWs, the normalized , and the V/R peak ratios obtained for the screen of 20 width (Fig. 8a) are in a good agreement with the observed parameters in a large range of the azimuthal angles (). For the V/R intensity peak ratios, however, the range of suitable values of is slightly less. This may be connected with the fact that the initial line profile does not reproduce the observed profile perfectly, for example, the deep central gap. Nevertheless, this screen is the only (from those considered) that demonstrates a coincidence of all parameters with the observed ones. Calculations of eclipses with the smaller screen (10 ) gives acceptable results for the twice narrower range (), and reproduces the shapes of the line profiles (V/R) only near the central eclipse (), see Fig. 8b. The screen of a width of 5 is not able to reproduce the observed line profile parameters (except for the very central eclipse with ).
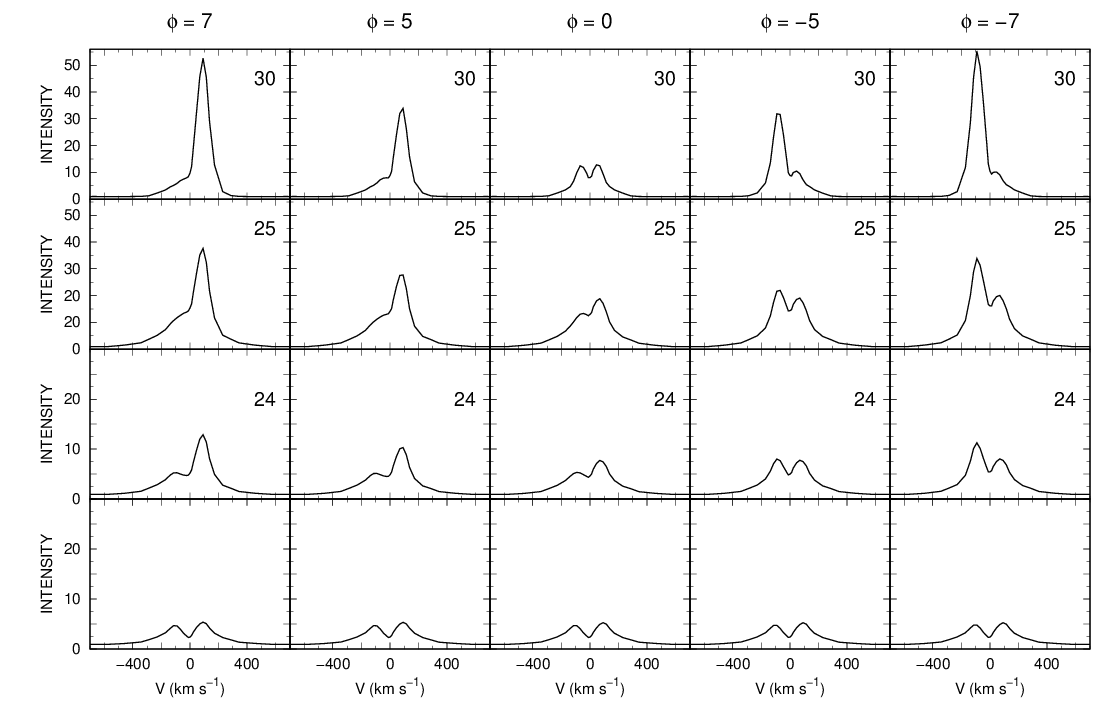
The same procedure has been followed for the hybrid model H2. The H line profiles for the cases of 10 and 20 widths of the screen is present in the Appendix (Sect. A). It should be noted that here the disc wind is launched from a more extended region of the disc and is "more flared". One can see from Figs. 13 and 14 that for both values of the screen widths the line profiles are practically single and blue or red shifted666Such a blue shifted profile was observed for UX Ori in the deep minima (Grinin et al., 1994) but has so far not been observed for RR Tau.. As shown in Fig. 9, for this model the suitable width of the screen is 20. The shorter V/R tracks in Fig. 9a for angles and 7∘ means that the line profiles do not have the blue peak at the current height of the screen (Fig. 13). In other words, the line profile is an asymmetric and single one.
5.2 The second obscuration scenario
First we estimated an optimal width of the obscuring body using a typical duration of an eclipse. If we assume that the latter lasts a week and keep in mind the Keplerian velocity at the dust sublimation radius, then the width of the screen will be about of 20 . Suitable parameters of the screen’s opacity are given with the Gauss function (eq. 2) with and .
The changes in the shape of the H line profile in the second obscuration scenario are present in Fig. 10. The results of the calculations are valid for both screen widths and . The left column demonstrates the line profile from the bright state of the star (the lowest row) when the screen is located at a large positive . As the screen moves towards the center it obscures the part of the envelope approaching towards an observer until it reaches the center where and the impact parameter are equal to zero.
During this passage the blue peak of the line profile "fades", and the red one increases relatively to the weakening continuum. At the screen covers the star at the densest part of the envelope (practically symmetrically) that results in the weak line profile with approximately equal peaks. As the screen continues to move towards negative , it obscures the recessing part of the envelope, and the line profile shape is inverted, compared to that at positive azimuthal angles. It should be noted that such a behaviour of the H line profile shape during the RR Tau eclipse was not observed.
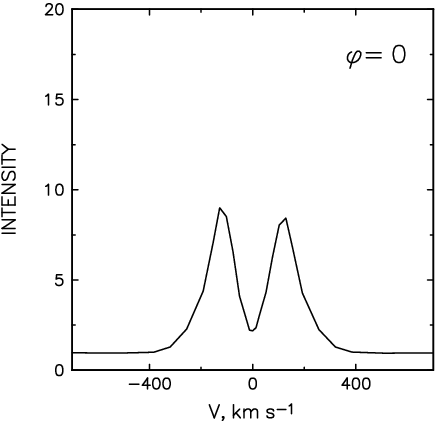
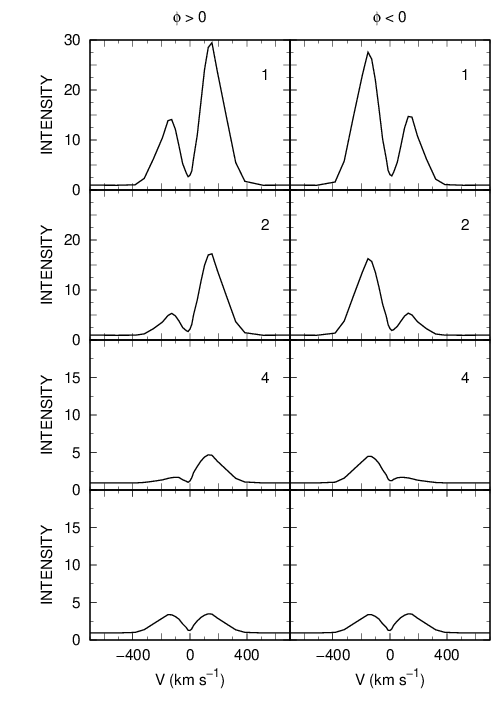
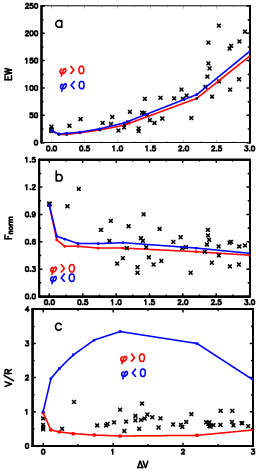
Figure 11 shows calculated EWs, V/R ratios and radiation fluxes in the H line during eclipses in the framework of the second obscuration scenario for the hybrid model H1. In Fig. 11 a and b one can see that in this case the equivalent widths of the profiles and the radiation fluxes in the line are in a good agreement with the observations. The peak ratios, however, contradict to the observational data both at positive and negative azimuthal angles, see Fig. 11 c.
The disc wind model DW2 in the hybrid model H2 differs from the disc wind model DW1 with a more extended launching region, a larger first opening angle, and a greater mass loss rate. From Fig. 9 representing changes in the main line profile parameters with the star brightness in the framework of the first obscuration scenario, one can see that the screen with the small width (5) does not give an agreement between the calculated and observed equivalent widths. As for other screens’ widths, conclusions are the same as those made for model H1: the gas and dust screen with the width of 20 and more is preferable because it gives a wider range of azimuthal angles where the line profile parameters agree with the observed ones. However, the calculated H line profiles become strongly asymmetric and single with the screen lifting, except for the central eclipse (see Figs. 13, 14), and that was not observed.
Figure 15 presents calculated EWs (top), radiation fluxes in the H line (medium) and V/R ratios (bottom) during eclipses in the framework of the second obscuration scenario for the hybrid model H2. The results are valid for screens with widths equal to 10 and 20. It is seen from the figure that an agreement with observations exists only for radiation fluxes in the H line (Fig. 15b) and the peak ratio at the positive azimuthal angles . For other line profile parameters we obtain a discrepancy between modelled and observational data.
It should be noted that the parameters of UXORs are constrained in rather narrow ranges. Therefore, the models calculated above may also be used for other stars of this family.
6 Discussion
In UX Ori stars, as well as in Herbig AeBe stars, the formation of the most intensive emission line, H, is mainly due to an extended disc wind, while in the formation of other Balmer lines, such as H and H, the role of the magnetospheric accretion noticeably increases because these lines originate in the less extended envelope near the star. However, modelling the hydrogen line profiles for RR Tau showed that the disc wind plays a dominant role also for the H line. Therefore we discuss the properties of the disc wind in more details. Our modelling permits us to accentuate and discuss the following conclusions.
6.1 The disc wind parameters.
The best coincidence of the calculated H line profiles with those observed with the NOT at the bright state of RR Tau (i.e. the shape and intensities of the line peaks) are as follows: (1) the wind launching region has to begin not very far from the star. The best values for the inner cylindric radii are 2 - 3 . The optimal values of the mass loss rate in such a case are ranged from yr-1. For more distant launching regions of the disc wind, the mass loss rate has to be larger in order to fit the observed peak intensities. In this case the central gap of the line profile will be filled in with additional emission and the shape of the modelled profiles will deviate from the observed one.
We also calculated the hybrid model H1 conserving accretion and wind parameters but using the values of the mass and radius of RR Tau recently published by Guzmán-Díaz et al. (2021). The shapes of the line profiles with parameters of the star given in the present paper and those by Guzmán-Díaz et al. (2021) coincide; the difference is in the value of the mass loss rate: in our case it is yr-1, while in the case of Guzmán-Díaz et al. (2021) it is yr-1. Also in the latter case, the dust sublimation radius is smaller (). The dynamics of the line profiles during eclipses does not change.
6.2 The obscuration scenario and properties of the obscuring body.
Investigation of the transformation of the H line profiles revealed that the first obscuration scenario, where the vertical motion of the dust screen dominates, is able to explain well all the variations of the line parameters during eclipses, namely, the equivalent widths, the radiation fluxes in the line, and the ratio of the line peaks. The optimal size of the width of the screen has to be .
The reasons for the observed brightness minima are not established; they may have a different nature. The properties and geometry of the dust screen in the discs of young stars, and the behaviour of the linear polarization and brightness during eclipses with such a screen in UXORs, has been recently considered by Shulman & Grinin (2019a, b). They showed that the large scale perturbations in the discs can strongly influence the photometric and polarimetric variability of UXORs. Since the observed eclipses require large vertical matter perturbations, it was suggested that the latter may be connected with cyclonic vortices capable of lifting the dust above the disc surface (e.g. Godon & Livio, 2000; Barge & Viton, 2003), or with an azimuthally structured dusty disc wind (Tambovtseva & Grinin, 2008). Also the charged dust grains can rise high above the disc due to their interaction with the magnetic field (Turner et al., 2014). Giacalone et al. (2019) showed that the 0.1 - 1 m crystalline silicate dust in the outer layers of the protoplanetary discs of many objects (the Herbig stars are among them), may be carried away by the different types of disc winds. This dust is lifted above the disc surface and returns back at large distances from the star.
6.3 Variability of the other lines
6.3.1 The He I 5876 Å line
In the deep brightness minima, when the dust screen completely obscures the stellar disc, one can see a strong transformation of the spectral lines forming in the close vicinity of the star. One such line is the He I 5876 Å line. It is absent in the spectra of normal A stars on the Main Sequence. In the spectra of the young Herbig Ae stars this line forms in the magnetospheres of the stars in the infalling gas stream. Because of the rapid rotation of UXORs, their magnetosphere has a small size: 1.5 - 2.5 stellar radii. For this reason the dusty screen obscuring the star can also cover completely the region of formation of the helium absorption line. As a result, this line disappears. This is clearly observed when one compares the spectra of RR Tau obtained in a bright state versus in deep minimum, see Fig. 2, in the panel of the sodium lines, date 06.03.2019.
6.3.2 The sodium D Na I lines
These lines originate (at least partially) in the magnetosphere of the star. This is demonstrated by the red-shifted absorption components of the Na I D lines which are seen in the spectra obtained during the bright state of the star, and absent during brightness minima. The reasoning is the same as that in the case of the He lines: an obscuration of the stellar disc with the dusty screen. In the brightness minima the emission components of the lines are slightly shifted to the blue side. During the bright state they are faintly noticed. The source of the emission may be the peripheral regions of the disc wind. This is indicated by a weak emission asymmetry. The central narrow absorbtion in the sodium doublet lines is formed in the circumstellar and interstellar medium.
6.3.3 The Fe II 4924 Å line
In the bright state of RR Tau the Fe II 4924 Å line is observed as a pure photospheric line. The two other components of this triplet look analogously. With the brightness attenuation an emission appears from the blue side of the absorption line; it strengthens and gradually completely blends the absorption line. A similar transformation of the Fe II triplet lines with RR Tau fading was observed by Rodgers et al. (2002) in spectra with a lower resolution. The authors suggested that the emission components of the Fe II triplet have a wind origin.
Our observations confirm this result. The high resolution of our spectra permits us to determine the typical velocity of the gas motion in the region of the emission formation: it is 200 km s-1. Its significant part refers to the poloidal component; this results in an observed shift of the emission towards the blue side. During the bright state of the star this emission is weak, but present, and it influences the position of the measured line center by shifting it to the red. Hence an important conclusion: the radial velocities of young stars determined with the help of photospheric lines may have systematic errors because of the blending the photospheric lines with the emission lines of the disc winds.
6.3.4 The H line
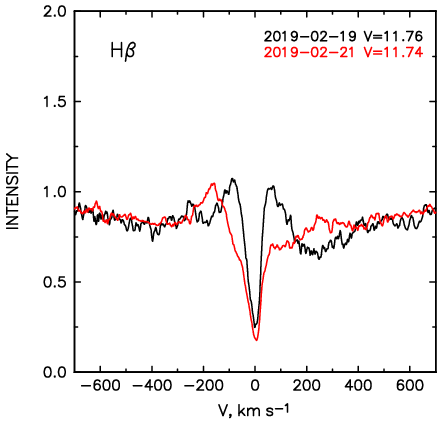
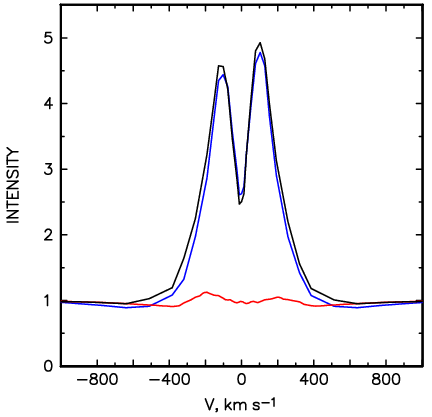
As shown in Fig. 2 this line demonstrates an inverse P Cygni line profile during the bright state, and a double peak profile during brightness minima. The peak ratio V/R can be slightly greater or less than one. Similarly to the H line profiles, the intensity of the H line increases during an eclipse. As mentioned above, the H line responds much stronger to the variable processes in the star’s vicinity, in particular to irregular and strong changes in the mass accretion rates, as shown in Fig. 16 and Fig. 17. For example, one can see from Fig. 16, that the line profile can radically change in one night although the brightness of the star did not change. Nevertheless, the red peak of the line profile (red line) practically disappears.
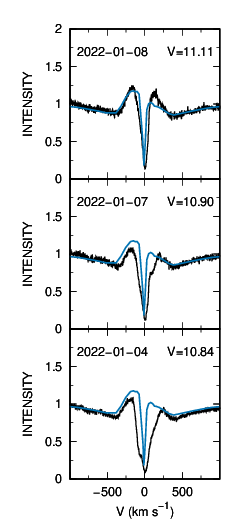
Another interesting example is shown in Fig. 17. Here one can see transformation of the shape of the observed line profile (black) over five nights. It is easy to notice by comparing it with the computed H line profile for one of the model (blue), that is the same at each plot. In spite of the fact that the brightness remained nearly the same (about V 11 mag), the observed profile modifies the shape and at last coincides with the computed one. Such a strong and rapid variability of this line makes its modelling more unpredictable than in the case of the H line.
6.3.5 [O I] 6300 Å line
This forbidden line (as well as the [O I] 6363 Å line) is observed in all spectra of RR Tau. Its equivalent width increases when the star fades, and this dependence is described well by the relation: . It means that the flux in this line did not change during our observations, in agreement with the variable CS extinction model. A similar relation for this line was obtained by Rodgers et al. (2002).
According to our measurements the fitted Gaussian FWHM of the line is around 1.1 0.1 Å or translating to line widths = 53 5 km s-1. We find that the heliocentric RV of the 6300 Å line is 6 3 km s-1 and that of the 6363 Å line is -2 2 km s-1. With the stellar RV of 11 km s-1 (Grinin et al., 2001), this means the [O I] lines are slightly blue-shifted. Both of these measurements suggest that the photoevaporated disc wind (Ercolano & Owen, 2010) is the most probable location of the [O I] line formation.
6.3.6 DIB 6283 Å
The diffuse interstellar band (DIB) 6283 Å was observed in all the spectra of RR Tau, and we did not find any changes in its parameters during the brightness minima. This means that the CS extinction does not add anything to the DIB and that it has a purely interstellar origin.
6.3.7 Comparison with the previous observations with NOT
Comparing the observational results of the seasons from 2019 - 2022 with previous ones from 1995 - 1996 obtained also with the NOT (Grinin et al., 2001), one can see that the H line always shows the double peak line profile but with the peak ratios blue-to-red (V/R) both less than one and greater than one. The H line profiles during the bright state has both the inverse P Cygni and double peak line profiles. It should be noted that in the above cited paper the spectra of RR Tau were obtained during the bright state except for one night when the star noticeably weakened. In all the spectra of RR Tau the central narrow absorption in the Na I D lines was slightly deeper in the 1995 - 1996 data compared to the recent observations presented in this paper. Since the spectral resolution in both programs was the same, this difference means that the conditions for propagation of the stellar radiation to an observer in the Na I D resonance line frequencies could slowly change with time.
7 Conclusion
Our main conclusions are as follows:
1. The results of our spectroscopic monitoring of RR Tau with FIES at the NOT confirm the results of the previous observations of this star by Rodgers et al. (2002) obtained with a low resolution spectrograph.
2. The higher spectral resolution (R = 25000) permitted us to investigate the spectral variability of RR Tau in more detail. Modelling the H line observed in the bright state and during the deep minima shows that the reason for the eclipses in this star is the vertical rise of the dust above the disc. The heterogeneous dusty disc wind can, in principle, provide such a scenario.
3. During the deep minima we observed the appearance of weak blue-shifted emission in some metallic lines (Fe II, Na I D and some others). Their radial velocities suggest the disc wind as the most probable source of this emission. These emission components are not observed during the bright state of the star, but their hidden existence will affect the photospheric line profiles and shift the measured stellar radial velocity towards the red. This effect has to be present in all young stars with intensive disc winds.
4. The constant luminosity of the forbidden lines [O I] 6300/6363 Å during the eclipses means that these lines originate beyond the screen. The link between the EWs of these lines with an amplitude of the stellar brightness definitely indicates that the circumstellar extinction is the main reason for the brightness variability of the star. These lines are narrow and slightly blue-shifted. The photoevaporated disc wind seems to be the best place of their formation.
It should be stressed that these conclusions are made for one UXOR star - RR Tau. In order to obtain a more general picture we need spectroscopy with high spectral resolution of other UXORs at their different brightness levels.
Acknowledgements
We thank the referee for his/her useful comments and suggestions which helped to improve the paper. V.P.G. and L.V.T. would like to acknowledge the support of the Ministry of Science and Higher Education of the Russian Federation under the grant 075-15-2020-780 (N13.1902.21.0039). A.A.D. thanks staff and students at the NOT for the continuous support, making the flexible scheduling possible and efficient.
Data availability
All the FIES data used in this paper is available in the online FITS archive777http://www.not.iac.es/observing/forms/fitsarchive/. of the Nordic Optical Telescope, raw data as well calibration data. The FIEStool pipeline reduced spectra are available by contacting staff at the NOT. Practically all the photometry observed by SAAF are available in AAVSO888https://www.aavso.org/, or otherwise on request to the authors.
References
- Ababakr et al. (2017) Ababakr K. M., Oudmaijer R. D., Vink J. S., 2017, MNRAS, 472, 854
- Alecian et al. (2013a) Alecian E., et al., 2013a, MNRAS, 429, 1001
- Alecian et al. (2013b) Alecian E., Wade G. A., Catala C., Grunhut J. H., Landstreet J. D., Böhm T., Folsom C. P., Marsden S., 2013b, MNRAS, 429, 1027
- Barge & Viton (2003) Barge P., Viton M., 2003, ApJ, 593, L117
- Blandford & Payne (1982) Blandford R. D., Payne D. G., 1982, MNRAS, 199, 883
- Brittain et al. (2023) Brittain S. D., Kamp I., Meeus G., Oudmaijer R. D., Waters L. B. F. M., 2023, Space Sci. Rev., 219, 7
- Caratti o Garatti et al. (2015) Caratti o Garatti A., et al., 2015, A&A, 582, A44
- Cauley & Johns-Krull (2014) Cauley P. W., Johns-Krull C. M., 2014, ApJ, 797, 112
- Cauley & Johns-Krull (2015) Cauley P. W., Johns-Krull C. M., 2015, ApJ, 810, 5
- Djupvik & Andersen (2010) Djupvik A. A., Andersen J., 2010, in Highlights of Spanish Astrophysics V. p. 211 (arXiv:0901.4015), doi:10.1007/978-3-642-11250-8_21
- Dullemond et al. (2001) Dullemond C. P., Dominik C., Natta A., 2001, ApJ, 560, 957
- Ercolano & Owen (2010) Ercolano B., Owen J. E., 2010, MNRAS, 406, 1553
- Flock et al. (2017) Flock M., Fromang S., Turner N. J., Benisty M., 2017, ApJ, 835, 230
- Garcia Lopez et al. (2015) Garcia Lopez R., Tambovtseva L. V., Schertl D., Grinin V. P., Hofmann K. H., Weigelt G., Caratti o Garatti A., 2015, A&A, 576, A84
- Garcia et al. (2001) Garcia P. J. V., Ferreira J., Cabrit S., Binette L., 2001, A&A, 377, 589
- Giacalone et al. (2019) Giacalone S., Teitler S., Königl A., Krijt S., Ciesla F. J., 2019, ApJ, 882, 33
- Godon & Livio (2000) Godon P., Livio M., 2000, ApJ, 537, 396
- Grinin (1988) Grinin V. P., 1988, Soviet Astronomy Letters, 14, 27
- Grinin & Tambovtseva (2011) Grinin V. P., Tambovtseva L. V., 2011, Astronomy Reports, 55, 704
- Grinin et al. (1991) Grinin V. P., Kiselev N. N., Minikulov N. K., Chernova G. P., Voshchinnikov N. V., 1991, Ap&SS, 186, 283
- Grinin et al. (1994) Grinin V. P., The P. S., de Winter D., Giampapa M., Rostopchina A. N., Tambovtseva L. V., van den Ancker M. E., 1994, A&A, 292, 165
- Grinin et al. (2001) Grinin V. P., Kozlova O. V., Natta A., Ilyin I., Tuominen I., Rostopchina A. N., Shakhovskoy D. N., 2001, A&A, 379, 482
- Guzmán-Díaz et al. (2021) Guzmán-Díaz J., et al., 2021, A&A, 650, A182
- Herbst et al. (1983) Herbst W., Holtzman J. A., Klasky R. S., 1983, AJ, 88, 1648
- Hubrig et al. (2015) Hubrig S., Carroll T. A., Scholler M., Ilyin I., 2015, MNRAS, 449, L118
- Järvinen et al. (2019) Järvinen S. P., Carroll T. A., Hubrig S., Ilyin I., Schöller M., Drake N. A., Pogodin M. A., 2019, MNRAS, 486, 5499
- Kolotilov (1977) Kolotilov E. A., 1977, Astrofizika, 13, 33
- Kozlova et al. (2000) Kozlova O. V., Grinin V. P., Rostopchina A. N., 2000, Astronomy Reports, 44, 36
- Kozlova et al. (2006) Kozlova O. V., Shakhovskoi D. N., Rostopchina A. N., Alekseev I. Y., 2006, Astrophysics, 49, 151
- Kreplin et al. (2013) Kreplin A., et al., 2013, A&A, 551, A21
- Kreplin et al. (2016) Kreplin A., Madlener D., Chen L., Weigelt G., Kraus S., Grinin V., Tambovtseva L., Kishimoto M., 2016, A&A, 590, A96
- Kreplin et al. (2018) Kreplin A., Tambovtseva L., Grinin V., Kraus S., Weigelt G., Wang Y., 2018, MNRAS, 476, 4520
- Kurosawa et al. (2006) Kurosawa R., Harries T. J., Symington N. H., 2006, MNRAS, 370, 580
- Kurucz (1979) Kurucz R. L., 1979, ApJS, 40, 1
- Mendigutía (2020) Mendigutía I., 2020, Galaxies, 8, 39
- Mora et al. (2001) Mora A., et al., 2001, A&A, 378, 116
- Mottram et al. (2007) Mottram J. C., Vink J. S., Oudmaijer R. D., Patel M., 2007, MNRAS, 377, 1363
- Natta et al. (2001) Natta A., Prusti T., Neri R., Wooden D., Grinin V. P., Mannings V., 2001, A&A, 371, 186
- Pudritz & Norman (1986) Pudritz R. E., Norman C. A., 1986, ApJ, 301, 571
- Rodgers et al. (2002) Rodgers B., Wooden D. H., Grinin V., Shakhovsky D., Natta A., 2002, ApJ, 564, 405
- Rostopchina (1999) Rostopchina A. N., 1999, Astronomy Reports, 43, 113
- Rostopchina et al. (1997) Rostopchina A. N., Grinin V. P., Okazaki A., The P. S., Kikuchi S., Shakhovskoy D. N., Minikhulov N. K., 1997, A&A, 327, 145
- Safier (1993) Safier P. N., 1993, ApJ, 408, 115
- Shulman & Grinin (2019a) Shulman S. G., Grinin V. P., 2019a, Astronomy Letters, 45, 384
- Shulman & Grinin (2019b) Shulman S. G., Grinin V. P., 2019b, Astronomy Letters, 45, 664
- Shulman & Grinin (2022) Shulman S. G., Grinin V. P., 2022, MNRAS, 512, 3098
- Sobolev (1960) Sobolev V. V., 1960, Moving Envelopes of Stars, doi:10.4159/harvard.9780674864658.
- Tambovtseva & Grinin (2008) Tambovtseva L. V., Grinin V. P., 2008, Astronomy Letters, 34, 231
- Tambovtseva et al. (2014) Tambovtseva L. V., Grinin V. P., Weigelt G., 2014, A&A, 562, A104
- Tambovtseva et al. (2016) Tambovtseva L. V., Grinin V. P., Weigelt G., 2016, A&A, 590, A97
- Tambovtseva et al. (2020) Tambovtseva L. V., Grinin V. P., Dmitriev D. V., 2020, Astronomy Reports, 64, 1026
- Tannirkulam et al. (2007) Tannirkulam A., Harries T. J., Monnier J. D., 2007, ApJ, 661, 374
- Telting et al. (2014) Telting J. H., et al., 2014, Astronomische Nachrichten, 335, 41
- Turner et al. (2014) Turner N. J., Benisty M., Dullemond C. P., Hirose S., 2014, ApJ, 780, 42
- Vink et al. (2002) Vink J. S., Drew J. E., Harries T. J., Oudmaijer R. D., 2002, MNRAS, 337, 356
- Vink et al. (2005) Vink J. S., Drew J. E., Harries T. J., Oudmaijer R. D., Unruh Y., 2005, MNRAS, 359, 1049
- Wade et al. (2007) Wade G. A., Bagnulo S., Drouin D., Landstreet J. D., Monin D., 2007, MNRAS, 376, 1145
- Wade et al. (2009) Wade G. A., et al., 2009, in Berdyugina S. V., Nagendra K. N., Ramelli R., eds, Astronomical Society of the Pacific Conference Series Vol. 405, Solar Polarization 5: In Honor of Jan Stenflo. p. 499
Appendix A Results of calculation of the hybrid model H2
Appendix B H line
