pagerefparensbackrefparens
A Potts model approach to unsupervised graph clustering with Graph Neural Networks
Abstract
Numerous approaches have been explored for graph clustering, including those which optimize a global criteria such as modularity. More recently, Graph Neural Networks (GNNs), which have produced state-of-the-art results in graph analysis tasks such as node classification and link prediction, have been applied for unsupervised graph clustering using these modularity-based metrics. Modularity, though robust for many practical applications, suffers from the resolution limit problem, in which optimization may fail to identify clusters smaller than a certain scale that is dependent on properties of the network. In this paper, we propose a new GNN framework which draws from the Potts model in physics to overcome this limitation. Experiments on a variety of real world datasets show that this model achieves state-of-the-art clustering results.
1 Introduction
Graph clustering, also referred to as community detection, has been utilized in a multitude of practical applications in biology [25], social networks [8], neuroscience [33]. According to [43], generally speaking, there are three identifiable themes to graph clustering, also sometimes referred to as community detection.
One approach utilizes classical, greedy algorithms, e.g. hierarchical clustering, see [17]. Second class of methods incorporates a properly selected global function or criteria, the communities are then identified via an optimization process of such function over the set of all possible partitions of the network graph, e.g. graph cuts [31], [39], spectral clustering [21], [2], modularity-based methods [19], [18], etc. The third approach makes use of probabilistic modeling of the network, where a probabilistic model is learned or approximated to maximize the likelihood for specific graph labeling configurations that yield the desirable clustering results. An example of the this would be stochastic block methods [22], along with the degree-corrected version [10], and random cluster models [9].
Modularity-based methods, e.g. Louvain, see [3], have gained popularity due to relative simplicity of the algorithm, ease of scalability for large graphs, and robustness of results. The Newman-Girvan modularity is easy to define for a given graph labeling, measuring how likely the labeling would have occurred by chance. Identifying an optimal labeling (node partition) that maximizes modularity typically yields good clustering results. Modularity approaches suffer from some drawbacks, most notably the resolution limit issue, see [6]. The resolution limit issue makes it harder harder to identify relatively small clusters in larger graphs.
In this paper, we present two main contributions. The first is achieving new SoTA results compared to [36]. Our approach utilizes a GNN network that is used to optimize a criteria derived from a Potts model of the given graph. Potts models have been already used as random graph models for graph clustering purposes, see [16]. Moreover, previous work, [27], shows that they are not prone to the resolution-limit issues that affect the traditional Girvan-Newman modularity-based approaches. The second contribution is a by-product of utilizing the Potts model approach in that it allows us to manipulate, and potentially optimize, certain model parameters, e.g. temperature as in [16] to control the level of granularity or resolution of the resulting clustering. Such parameters lend themselves in a natural way to the clustering problem enabling the researcher to identify "reasonable" values and thus allows a completely unsupervised solution to the clustering problem. This can be useful in many applications where knowing the number of clusters, a priori, is not feasible.
This paper is structured as follows, in section one …
2 Motivation
In recent years, graph neural networks have been utilized to perform various tasks on graph data structures, e.g. node classification, link/edge prediction. The Message passing framework for GNNs, see for example [1], has been successful in generalizing earlier architectures such as Convolutional and Attention GNNs. This message-passing paradigm allows the node and edge properties to be locally pooled within the localized node neighborhoods, thus enabling the GNN to learn representations of the local and higher-order structure of the graph. Intuitively, one would think that pooling could be enough to generate adequate representations to solve graph clustering problems, but that has been shown to be false in the recent paper [36], where the DMoN GNN was introduced as a (partially) unsupervised approach to solve graph clustering problems, where the number of total clusters is known. The DMoN approach has been shown to achieve SoTA results on standardized graph clustering datasets where the ground truth is known or easily inferred.
Our work in this paper has been motivated so as to contribute two improvements to the previous results achieved in [36]. More specifically:
-
•
The loss function utilized in [36] was derived from a Girvan-Newman modularity criteria. This could potentially result in issues regarding modularity maximization, e.g. resolution-limit problems (see [6]), where relatively smaller clusters could become harder to identify via a modularity-optimization approach.
-
•
The unsupervised approach proposed in [36] still requires the knowledge of the number of clusters a priori. This can prove to be a challenge in certain practical applications where there is lack of problem-intrinsic or heuristic knowledge to hint towards a reasonable level of cluster granularity.
Our research into other possible approaches led us to [26] where the Potts model was discussed. In [26] the authors show that the Girvan-Newman modularity occurs naturally as a global criteria corresponding to a particular intuitive choice of a Hamiltonian (energy) function of the system (node labels/configurations). It turns out that minimizing the Hamiltonian function (which is equivalent to maximizing the corresponding global criteria) over the set of all node labels (configurations) of the graph yields optimal clustering results.
The Potts model has been used in Physics (Statistical mechanics) for a while, see [24], [4]. It is a spin glass model that generalizes the Ising model which has been used to model ferromagnetic material, where molecules of the magnetic material are modeled as nodes with 2 possible spin values . The Potts model generalizes that to a finite number, , of spin states. The Potts model has been generalized further by K. Fortuin and P. Kasteleyn in 1969 when they introduced the random cluster model, see [9] for more history and details. The Potts model has been studied for its own peculiar and interesting dynamics, for instance the abrupt phase transitions that are observed for large values of , contrasting the smooth transitions exhibited by the Ising model.
The Potts model can be used, as other similar energy based approaches, to identify optimal graph clustering, see [16]. Furthermore, and what makes the Potts model more appealing, [27] shows that the absolute Potts model does not suffer from the dreaded resolution-limit issue that is associated with the Girvan-Newman modularity approaches.
Finally, and according to experiments conducted by the authors of [16], which showed that by tweaking the temperature parameter of the Potts model, one can control the level of granularity of the clustering results and achieve accurate approximations of the true labels. This provides the researcher with a natural/intrinsic tool to help identify the optimal number of cluster for a given application. Further work could explore potential avenues to identify optimal values for such parameters.
3 Preliminaries
First, we lay out the notation for the graph clustering problem. The graph is represented as a tuple of vertices and edges, and number of nodes, edges being respectively. The ajacency is a square matrix with if there is a link between node and otherwise. The node features matrix is described as with be the number of features.
4 Potts Model
Following the works of FK [ref], random cluster models were established as a generalization of percolation, Ising, and Potts models, all of which have been introduced earlier. The Ising model was introduced in statistical mechanics to model ferromagnetic materials, featuring two spin states per node. The Potts model generalizes that to a number of spin states per node. These models were utilized to model different materials, and studied further for their own interesting characteristics, e.g. the abrupt phase transitions exhibited by the Potts model for large values of contrasting the smooth transitions of the Ising model.
The Hamiltonian, to be minimized, for the Potts model is defined by penalizing two connected nodes if they do not belong to the same cluster. More precisely, see [ref]:
where the represents a given label assignment, if the -th node belongs to the -th cluster, and zero otherwise, . , a kernel function, and if and -th and -th nodes are connected, and zero, otherwise.
Equivalently, see [ref], let be an integer satisfying , and take as sample space the set of vectors , is the set of nodes of the graph . So, each vertex of may be in any of states. For an edge and a configuration , we write , where is the Kronecker delta. The relevant probability measure is given by:
for , where is the appropriate normalizing constant and the Hamiltonian is given by:
4.1 Adaptation as a graph clustering quality measuring function
Communities or clusters [5] generally accepted as groups of close distance or densely interconnected nodes and far distance or sparsely connected with other communities. Hence, as a quality measuring function, it should satisfy
-
•
reward internal links within the same community and non-links between different communities (in the same spin state)
-
•
vice versa, penalize non-links between nodes in the same community and links between communities
Connecting the analogy of spin state and cluster, with being the Kronecker delta, the Potts Model quality function is derived naturally as (negative sign was added for conventional minimizing loss function)
with denotes the spin state (or group index) of node in the graph .
With the general assumption that links and non-links are each weighted equally, regardless whether they are external or internal and , we can rewrite as the Hamiltonian
| (1) |
A choice of weights will make the adjustment of contribution of links and non-links easier by a change of parameter and help formulate the null model such that the partition is compared with. A common choice is a random null configuration model [9] with a non-negative resolution parameter by [26] and , where denotes the probability that a link exists between node i and j, normalized, such that . In the case of , which means the total amount of energy that can possibly be contributed by links and non-links is equal then the equation 1 can be reduced to
Rewrite the Hamiltonian given the expected number of edges and probability of the null configuration model [20] [23]
| (2) | ||||
| (3) |
Minimizing Hamiltonian corresponds to a partition of desirable characteristics. However, a minimum is not necessarily unique and better in general sense to a non minimum. Additionally, the choice of has definite impact on community structure in which has to be chosen carefully. The degree of node is the number of connections from to , the vector contains the degrees of all the nodes in the graph.
4.2 Spectral Form Optimization
In the discussion of complexity in the task of optimizing the spectral form of modularity in [18] and [36], the problem is proven to be NP-hard and a relaxation version is empirically shown to be solved efficiently with a soft cluster matrix be the cluster assignment matrix and be the degree vector. Then, with matrix defined as
| (4) | ||||
| (5) |
Then Hamiltonian can be reformulated in matrix form
| (6) |
5 GNNs for graph clustering
5.1 Previous work
Recently, several architecture settings have been proposed in the literature
- •
-
•
Deep Graph Infomax (DGI) [37]: learn the embedding by maximizing mutual information
-
•
Neural Overlapping Community Detection (NOCD) [29]: combine the power of GNNs and the Bernoulli–Poisson probabilistic model under reconstruction loss.
-
•
Differential Pooling (DiffPool) [41] : is one of the first attempts developing a pooling layer that use message passing to learn and end-end unsupervised cluster matrix that relies on minimizing the entropy of the assignment and link prediction loss.
-
•
MinCutPool[2]: utilizes K-way normalized min cut problem as a optimize measuring function to find the interest partitions
-
•
DMoN [36]: learns the cluster assignment by optimizing modularity function
-
•
Top-k [7]: learns an embedding vector to obtain a score from each node. The nodes with k highest scores are kept and the rest are dropped from the graph.
We can divide the recent GNN clustering algorithms into 2 classes. The first are algorithms that generate embeddings based on node feature and adjacency matrix. Afterwards, the embeddings are clustered
with k-means algorithm. The candidates for this class are AGC, DAEGC, DGI. The second learns the assignment matrix from end-end either by gate keeping strategy (Top-k) or optimizing for a global function (DMoN, MinCutPool, DiffPool).
Additionally, there have been efforts developing unsupervised algorithm for community detection that optimize Potts model loss function or modularity commonly, in a greedy fashion
-
•
Louvain [3]: optimizing modularity in theoretical sense will results in the best possible parition. But going through all the combination to find the best modularity is expensive and impractical. Louvain is a heuristic approach to solve that problem.
-
•
Leiden [35]: an recent attempt to solve the issue of finding disconnected community. Leiden introduces one more phase into the system, refinement of partition. Communities detected from the first modularity optimizing phase may split into smaller partitions in the second phase, inheritly solving the problem of finding small communities (resolution limit)
-
•
Constant Potts Model [34]: the layout of the algorithm is same as Louvain and optimizing constant Potts Model function instead of modularity. All the above methods are extremely efficient and well studied. However, they are limited only with the graph structured and do not take the node features into the account for partitioning.
5.2 Graph Neural Networks
The recent advance of adapting neural networks onto graph structured data is built on the message passing paradigm that extract the feature information of the local neighborhood. The feature aggregated is passed through a nonlinear transformation. In particular, the message passing architecture is described as
| (7) |
with being the output and input node features of message passing layer respectively.
There are several modification in the realm on GNN. A popular variant is Graph Convolutional Networks (GCN) [11] uses implements the message passing function with a combination of linear transformations and ReLU function for normalized adjacency matrix
| (8) |
In this work, we employ the GCN layer [11] as the setting for feature embedding encoder with skip layer going through selu [12] activation function for better convergent and identitical to DMoN settings
| (9) |
6 Potts Model Networks (PMN)
In this section, we discuss the Potts Model Networks (PMN) inspired by the modularity optimization from [36] and the analysis and effort to overcome resolution limit [34]. Moreover, the introduction of resolution parameter in the pooling layer and loss function provided a competitive advantage of flexibility in adapting the Potts Model loss function 6 onto the graph structure inherited by the training data.
Potts Model Networks (PMN) is a GNN layer that takes the normalized adjacency matrix and obtains the soft cluster matrix with being the max number of clusters
| (10) |
The choice of message passing paradigm can be any kind of differentiable suitable function, the use of GCN (possibly multi-layers) in this work is a set up to compare directly with DMoN to analyze the difference of optimizing Potts Model function versus modularity.
6.1 Loss function
The proposed loss function is an aggregation of the Hamiltonian 1 , the collapse regularization [36] , and the resolution parameter normalization
The introduction of as a trained parameter is to motivate the PMN to learn the best resolution given the null configuration model. As discussed in [35], the influence is interpreted as a threshold for detected communities. The inner-cluster density is filtered to be at least while intra-cluster density should be lower than . The higher the resolution parameter is, the larger number of communities would be detected [26]. The resolution parameter is first introduced in [13] to address a major problem with using Modularity as a global optimization function called resolution limit [6].
6.2 Resolution-limit
[6] shows that modularity as quality measuring function inheritly has a filter scale that depends on the size of the network. Communities that are smaller than this filter scale may not be detected even if they are complete and fully connected. The reason lies on the use of modularity as a sum of modules to be a global metric for optimization. Finding the best modularity is a trade-off between the number of communities and the modular value of each term. An increase in number of communities doesn’t necessarily yield an increase in the global modularity because modular value for each community will be smaller.
6.3 Optimizing resolution
A limit of the framework that coarsen node features and edge link into a cluster assignment matrix is the number of maximum clusters have to be defined before the training process. There is no indication information for the task of choosing the suitable number of clusters. Modularity, as described above, does suffer from resolution limit and not necessarily a good indication to tune the number of clusters. For Potts Model, the resolution parameter plays the role as an indication of granularity of communities in a heuristic greedy approach. Applying Potts Model as a loss function and involving as a training parameter provide two competitive edges:
-
•
Indication to tune parameter - number of clusters
-
•
Adaptation of the loss function onto the graph sparsity and structure
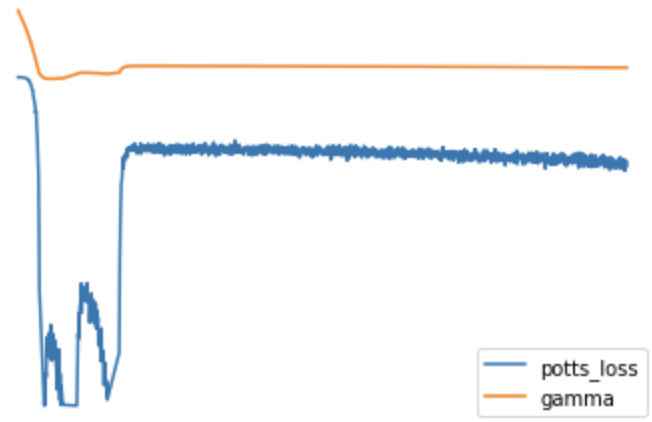
As shown in 1, the PMN variable stabilized its training process first leading the convergence of the optimal Potts loss convergence. This demonstrates the ability to adapt the loss function onto the graph structure of each dataset.
7 Experiments & results
Benchmark datasets: we borrow the benchmark results from [36] on 10 real-world datasets from citation networks Cora, CiteSeer, and PubMed [28], coauthors networks based on Microsoft Academic Graph (CS, Physics, Med, Chem, Engineering) [29, 30, 32], to Amazon co-purchase graph (Photo, Computers) [15]. The features of nodes are bag-of-word for abstract, paper keywords, or reviews. The corresponding labels shows topic of papers, fields of study, or product category.
Metrics: we use the standard metrics to measure quality of cluster. On the graph side, we employ conductance (C)[40] which measures the edge volume that points outside the cluster, and modularity (Q)[19] against existing benchmark. For the correlation with ground truth label, we use normalized mutual information score (NMI) and F1 score [14]. Conductance is ranked the lower the better, while the rest of the metrics, the higher the better. We will scale all metric to the range of for better aesthetic and comparison.
| Dataset | |V| | |E| | |X| | |Y| |
|---|---|---|---|---|
| Cora | 2708 | 5278 | 1433 | 7 |
| CiteSeer | 3327 | 4614 | 3703 | 6 |
| Pubmed | 19717 | 44325 | 500 | 3 |
| Amazon Computers | 13752 | 143604 | 767 | 10 |
| Amazon Photo | 7650 | 71831 | 745 | 8 |
| Coauthor Eng | 14927 | 49305 | 4839 | 16 |
| Coauthor CS | 18333 | 81894 | 6805 | 15 |
| Coauthor Phys | 34493 | 247962 | 8415 | 5 |
| Coauthor Chem | 35409 | 157358 | 4877 | 14 |
| Coauthor Med | 63282 | 810314 | 5538 | 17 |
Model configurations: in our experiments, the GNN model used for PMN is built on top of the DMoN architecture, and all parameters are kept the same for direct comparison.The baseline results that we compared with are from [36] results. The encoder includes layer with units and the max number of clusters equals to . Dropout is kept at and the maximum is fixed at . The initialization of weight matrices are and . The collapse and regularization are respectively. We run the experiments for 4 models MinCut, MinCut with Orthogonal loss [2], DMoN [36], and PMN. All the parameters of MinCut and DMoN are the same as described above, we also borrow the results from [36] to demonstrate the comprehensive comparison between all methods. The results are averaged over 10 runs of random seeds.
Results: the performance of Potts and our runs of DMoN, Ortho, MinCut are shown in table 4,2,3. The results display strong and consistent performance of PMN over 10 datasets. PMN consistently perform worse in Modularity (Q) while better in other metrics comparing to DMoN with same configuration. Notably, PMN performs extremely well on coauthorship dataset [30]. PMN achieves state-of-the-art conductance, F1, NMI on Cora, PubMed, and all Coauthor datasets. The lack of performance in modularity measure expected because PMN is not optimizing for modularity directly, it finds the best resolution for the graph data as well as minimizing the Potts loss function 6. Because of that, we achieve significantly better results in F1, NMI, conductance score in Coauthor Phys with a increasing from the second best of to respectively. In general, DMoN is better at maximizing modularity, better than PMN consistantly. In our runs, there is difficulty to reproduce all the results from DMoN [36] when following the configuration of parameter settings. Even so, PMN still show better result most of the time except for the citation datasets. Overall, PMN performs dominantly better than its counter part DMoN except modularity measurement.
| Coauthor Phys | Coauthor Chem | Coauthor Med | ||||||||||
| Graph | Labels | Graph | Labels | Graph | Labels | |||||||
| Methods | C | Q | NMI | F1 | C | Q | NMI | F1 | C | Q | NMI | F1 |
| k-m(feat) | 57.0 | 19.4 | 30.6 | 42.9 | 42.9 | 18.2 | 13.9 | 35.l | 54.7 | 19.3 | 11.8 | 31.7 |
| SBM | 25.9 | 66.9 | 45.4 | 30.4 | 18.4 | 74.6 | 25.4 | 25.0 | 21.1 | 72.0 | 36.l | 31.1 |
| DeepWalk | 44.7 | 47.0 | 43.5 | 24.3 | 14.0 | 74.8 | 36.5 | 33.8 | 16.6 | 72.1 | 43.l | 39.4 |
| SDCN | 32.l | 52.8 | 50.4 | 39.9 | 29.9 | 58.7 | 33.3 | 32.8 | 34.8 | 54.2 | 25.2 | 26.5 |
| DGI | 38.6 | 51.2 | 51.0 | 30.6 | 31.6 | 60.6 | 40.8 | 32.9 | 35.7 | 56.5 | 34.8 | 27.7 |
| NOCD | 25.7 | 65.5 | 51.9 | 28.7 | 19.2 | 73.l | 43.1 | 40.l | 22.0 | 69.7 | 42.5 | 37.6 |
| MinCut | 29.7 | 63.1 | 42.3 | 32.4 | 21.4 | 70.1 | 41.5 | 33.5 | 24.2 | 70.1 | 43.1 | 33.4 |
| Ortho | 31.1 | 63.5 | 46.4 | 35.8 | 21.6 | 69.2 | 39.1 | 29.3 | 21.5 | 68.3 | 39.5 | 31.5 |
| DMoN | 23.5 | 66.3 | 53.8 | 37.8 | 21.8 | 71.2 | 46.3 | 44.9 | 22.2 | 72.2 | 51.5 | 50.9 |
| Potts | 5.5 | 49.5 | 72.2 | 88.2 | 11.3 | 75.7 | 58.1 | 57.1 | 14.9 | 72.6 | 60.4 | 59.7 |
| Cora | Citeseer | Pubmed | ||||||||||
| Methods | graph | labels | graph | labels | graph | labels | ||||||
| Metrics | C | Q | NMI | F1 | C | Q | NMI | F1 | C | Q | NMI | F1 |
| k-m(feat) | 61.7 | 19.8 | 18.5 | 27.0 | 60.5 | 30.3 | 24.5 | 29.2 | 55.8 | 33.4 | 19.4 | 24.4 |
| SBM | 15.4 | 77.3 | 36.2 | 30.2 | 14.2 | 78.1 | 15.3 | 19.1 | 39.0 | 53.5 | 16.4 | 16.7 |
| DeepWalk | 62.1 | 30.7 | 24.3 | 24.8 | 68.1 | 24.3 | 27.6 | 24.8 | 16.6 | 75.3 | 22.9 | 17.2 |
| AGC | 48.9 | 43.2 | 34.1 | 28.9 | 41.9 | 50.0 | 25.5 | 27.5 | 44.9 | 46.8 | 18.2 | 18.4 |
| SDCN | 37.5 | 50.8 | 27.9 | 29.9 | 20.0 | 62.3 | 31.4 | 41.9 | 22.4 | 50.3 | 19.5 | 29.9 |
| DAEGC | 56.8 | 33.5 | 8.3 | 13.6 | 47.6 | 36.4 | 4.3 | 18.0 | 53.6 | 37.5 | 4.4 | 11.6 |
| DGI | 28.0 | 64.0 | 52.7 | 40.1 | 17.5 | 73.7 | 40.4 | 39.4 | 82.9 | 9.6 | 22.0 | 26.4 |
| NOCD | 14.7 | 78.3 | 46.3 | 36.7 | 6.8 | 84.4 | 20.0 | 24.1 | 21.7 | 69.6 | 25.5 | 20.8 |
| DiffPool | 26.1 | 66.3 | 32.9 | 34.4 | 26.0 | 63.4 | 20.0 | 23.5 | 32.9 | 56.8 | 20.2 | 26.3 |
| MinCut | 29.3 | 71.5 | 30.1 | 25.0 | 14.1 | 82.2 | 25.9 | 20.1 | 22.3 | 64.5 | 24.1 | 28.5 |
| Ortho | 19.2 | 65.6 | 29.4 | 26.6 | 15.4 | 79.2 | 30.1 | 19.2 | 47.7 | 38.2 | 21.0 | 18.4 |
| DMoN | 11.8 | 75.8 | 45.6 | 35.9 | 6.9 | 83.2 | 27.9 | 31.4 | 17.2 | 68.3 | 30.2 | 40.1 |
| Potts | 5.5 | 57.8 | 49.7 | 54.7 | 6.0 | 81.2 | 29.2 | 36.9 | 7.4 | 59.4 | 32.4 | 56.3 |
| Amazon PC | Amazon Photo | Coauthor CS | Coauthor Eng | |||||||||||||
| Methods | Graph | Label | Graph | Label | Graph | Label | Graph | Label | ||||||||
| C | Q | NMI | F1 | C | Q | NMI | F1 | C | Q | NMI | F1 | C | Q | NMI | F1 | |
| k-m (feat) | 84.5 | 5.4 | 21.1 | 19.2 | 79.6 | 10.5 | 28.8 | 19.5 | 49.1 | 23.1 | 35.7 | 39.4 | 42.7 | 27.1 | 24.5 | 32.5 |
| SBM | 31.0 | 60.8 | 48.4 | 34.6 | 18.6 | 72.7 | 59.3 | 47.4 | 20.3 | 72.7 | 58.0 | 47.7 | 15.8 | 77.0 | 33.3 | 27.5 |
| DeepWalk | 67.6 | 11.8 | 38.2 | 22.7 | 60.6 | 22.9 | 49.4 | 33.8 | 33.1 | 59.4 | 72.7 | 61.2 | 5.7 | 67.4 | 47.7 | 50.0 |
| AGC | 43.2 | 42.8 | 51.3 | 35.3 | 33.8 | 55.9 | 59.0 | 44.2 | 41.5 | 40.1 | 43.3 | 31.9 | 32.3 | 46.4 | 30.8 | 31.2 |
| DAEGC | 39.0 | 43.3 | 42.5 | 37.3 | 19.3 | 58.0 | 47.6 | 45.0 | 39.4 | 49.1 | 36.3 | 32.4 | 31.9 | 50.9 | 12.5 | 26.1 |
| SDCN | 25.1 | 45.6 | 24.9 | 45.2 | 19.7 | 53.3 | 41.7 | 45.1 | 33.0 | 55.7 | 59.3 | 54.7 | 21.8 | 64.6 | 45.3 | 45.9 |
| DGI | 61.9 | 22.8 | 22.6 | 15.0 | 51.5 | 35.1 | 33.4 | 23.6 | 35.1 | 57.8 | 64.6 | 51.9 | 29.3 | 60.4 | 49.7 | 37.2 |
| NOCD | 26.4 | 59.0 | 44.8 | 37.8 | 13.7 | 70.1 | 62.3 | 60.2 | 20.9 | 72.2 | 70.5 | 56.4 | 16.0 | 75.6 | 50.7 | 35.4 |
| DiffPool | 35.6 | 30.4 | 22.1 | 38.3 | 26.5 | 46.8 | 35.9 | 41.8 | 33.6 | 59.3 | 41.6 | 34.4 | 34.9 | 55.0 | 22.0 | 21.8 |
| MinCut | did not converge | 20.1 | 70.5 | 63.2 | 49.5 | 25.3 | 73.2 | 45.2 | 34.2 | |||||||
| Ortho | did not converge | 26.7 | 65.7 | 58.2 | 45.3 | 24.5 | 75.4 | 46.1 | 32.2 | |||||||
| DMoN | 18.0 | 59.0 | 49.3 | 45.4 | 21.1 | 68.7 | 58.9 | 47.8 | 17.9 | 73.3 | 69.5 | 59.2 | 14.4 | 77.2 | 57.8 | 48.3 |
| Potts | 15.4 | 53.8 | 44.4 | 49.8 | 6.5 | 59.0 | 62.6 | 59.2 | 12.6 | 72.9 | 75.2 | 78.7 | 5.2 | 72.2 | 63.1 | 69.5 |
8 Conclusions
In this paper, we introduced a generalized framework to address important limitations of modularity optimization and proposed a new trainable measurement of clustering quality. The Potts Model Network approach relies on the existing Potts model application in statistical mechanics for community detection. Moreover, we explore the performance of PMN model on 10 real life datasets and achieve desirable results comparing to existing pooling framework.
Future research direction could be developing an approach to utilize the trained to tune the number of clusters. Investigating on the effect of sparsity on the performance of Potts Model is promising based on the empirical results from our experiments.
9 Acknowledgement
We would like to thank the SailPoint Technologies for the computational support.
Appendix A Appendix
References
- [1] Peter W Battaglia et al. “Relational inductive biases, deep learning, and graph networks” In arXiv preprint arXiv:1806.01261, 2018
- [2] Filippo Maria Bianchi, Daniele Grattarola and Cesare Alippi “Spectral clustering with graph neural networks for graph pooling” In International Conference on Machine Learning, 2020, pp. 874–883 PMLR
- [3] Vincent D Blondel, Jean-Loup Guillaume, Renaud Lambiotte and Etienne Lefebvre “Fast unfolding of communities in large networks” In Journal of statistical mechanics: theory and experiment 2008.10 IOP Publishing, 2008, pp. P10008
- [4] Cyril Domb “On Hammersley’s method for one-dimensional covering problems” In Disorder in physical systems Citeseer, 1990, pp. 33
- [5] Santo Fortunato “Community detection in graphs” In Physics reports 486.3-5 Elsevier, 2010, pp. 75–174
- [6] Santo Fortunato and Marc Barthelemy “Resolution limit in community detection” In Proceedings of the national academy of sciences 104.1 National Acad Sciences, 2007, pp. 36–41
- [7] Hongyang Gao and Shuiwang Ji “Graph u-nets” In international conference on machine learning, 2019, pp. 2083–2092 PMLR
- [8] Mark S Granovetter “The strength of weak ties” In American journal of sociology 78.6 University of Chicago Press, 1973, pp. 1360–1380
- [9] Geoffrey R Grimmett “The random-cluster model” Springer Science & Business Media, 2006
- [10] Brian Karrer and Mark EJ Newman “Stochastic blockmodels and community structure in networks” In Physical review E 83.1 APS, 2011, pp. 016107
- [11] Thomas N. Kipf and Max Welling “Semi-Supervised Classification with Graph Convolutional Networks” In ICLR, 2017
- [12] Günter Klambauer, Thomas Unterthiner, Andreas Mayr and Sepp Hochreiter “Self-normalizing neural networks” In Advances in neural information processing systems 30, 2017
- [13] Renaud Lambiotte, J-C Delvenne and Mauricio Barahona “Laplacian dynamics and multiscale modular structure in networks” In arXiv preprint arXiv:0812.1770, 2008
- [14] Andrea Lancichinetti, Santo Fortunato and János Kertész “Detecting the overlapping and hierarchical community structure in complex networks” In New journal of physics 11.3 IOP Publishing, 2009, pp. 033015
- [15] Julian McAuley, Christopher Targett, Qinfeng Shi and Anton Van Den Hengel “Image-based recommendations on styles and substitutes” In Proceedings of the 38th international ACM SIGIR conference on research and development in information retrieval, 2015, pp. 43–52
- [16] Alejandro Murua, Larissa Stanberry and Werner Stuetzle “On potts model clustering, kernel k-means and density estimation” In Journal of Computational and Graphical Statistics 17.3 Taylor & Francis, 2008, pp. 629–658
- [17] Mark EJ Newman “Detecting community structure in networks” In The European physical journal B 38.2 Springer, 2004, pp. 321–330
- [18] Mark EJ Newman “Finding community structure in networks using the eigenvectors of matrices” In Physical review E 74.3 APS, 2006, pp. 036104
- [19] Mark EJ Newman “Modularity and community structure in networks” In Proceedings of the national academy of sciences 103.23 National Acad Sciences, 2006, pp. 8577–8582
- [20] Mark EJ Newman “The structure and function of complex networks” In SIAM review 45.2 SIAM, 2003, pp. 167–256
- [21] Andrew Ng, Michael Jordan and Yair Weiss “On spectral clustering: Analysis and an algorithm” In Advances in neural information processing systems 14, 2001
- [22] Krzysztof Nowicki and Tom A B Snijders “Estimation and prediction for stochastic blockstructures” In Journal of the American statistical association 96.455 Taylor & Francis, 2001, pp. 1077–1087
- [23] Patrick O Perry and Patrick J Wolfe “Null models for network data” In arXiv preprint arXiv:1201.5871, 2012
- [24] Renfrey Burnard Potts “Some generalized order-disorder transformations” In Mathematical proceedings of the cambridge philosophical society 48.1, 1952, pp. 106–109 Cambridge University Press
- [25] Nataša Pržulj “Biological network comparison using graphlet degree distribution” In Bioinformatics 23.2 Oxford University Press, 2007, pp. e177–e183
- [26] Jörg Reichardt and Stefan Bornholdt “Statistical mechanics of community detection” In Physical review E 74.1 APS, 2006, pp. 016110
- [27] Peter Ronhovde and Zohar Nussinov “Local resolution-limit-free Potts model for community detection” In Physical Review E 81.4 APS, 2010, pp. 046114
- [28] Prithviraj Sen et al. “Collective classification in network data” In AI magazine 29.3, 2008, pp. 93–93
- [29] Oleksandr Shchur and Stephan Günnemann “Overlapping community detection with graph neural networks” In arXiv preprint arXiv:1909.12201, 2019
- [30] Oleksandr Shchur, Maximilian Mumme, Aleksandar Bojchevski and Stephan Günnemann “Pitfalls of graph neural network evaluation” In arXiv preprint arXiv:1811.05868, 2018
- [31] Jianbo Shi and Jitendra Malik “Normalized cuts and image segmentation” In IEEE Transactions on pattern analysis and machine intelligence 22.8 Ieee, 2000, pp. 888–905
- [32] Arnab Sinha et al. “An overview of microsoft academic service (mas) and applications” In Proceedings of the 24th international conference on world wide web, 2015, pp. 243–246
- [33] Olaf Sporns, Rolf Kötter and Karl J Friston “Motifs in brain networks” In PLoS biology 2.11 Public Library of Science San Francisco, USA, 2004, pp. e369
- [34] Vincent A Traag, Paul Van Dooren and Yurii Nesterov “Narrow scope for resolution-limit-free community detection” In Physical Review E 84.1 APS, 2011, pp. 016114
- [35] Vincent A Traag, Ludo Waltman and Nees Jan Van Eck “From Louvain to Leiden: guaranteeing well-connected communities” In Scientific reports 9.1 Nature Publishing Group, 2019, pp. 1–12
- [36] Anton Tsitsulin, John Palowitch, Bryan Perozzi and Emmanuel Müller “Graph clustering with graph neural networks” In arXiv preprint arXiv:2006.16904, 2020
- [37] Petar Velickovic et al. “Deep Graph Infomax.” In ICLR (Poster) 2.3, 2019, pp. 4
- [38] Chun Wang et al. “Attributed graph clustering: A deep attentional embedding approach” In arXiv preprint arXiv:1906.06532, 2019
- [39] Yen-Chuen Wei and Chung-Kuan Cheng “Towards efficient hierarchical designs by ratio cut partitioning” In 1989 IEEE International Conference on Computer-Aided Design. Digest of Technical Papers, 1989, pp. 298–301 IEEE
- [40] Jaewon Yang and Jure Leskovec “Defining and evaluating network communities based on ground-truth” In Proceedings of the ACM SIGKDD Workshop on Mining Data Semantics, 2012, pp. 1–8
- [41] Zhitao Ying et al. “Hierarchical graph representation learning with differentiable pooling” In Advances in neural information processing systems 31, 2018
- [42] Xiaotong Zhang, Han Liu, Qimai Li and Xiao-Ming Wu “Attributed graph clustering via adaptive graph convolution” In arXiv preprint arXiv:1906.01210, 2019
- [43] Yunpeng Zhao, Elizaveta Levina and Ji Zhu “Consistency of community detection in networks under degree-corrected stochastic block models” In The Annals of Statistics 40.4 Institute of Mathematical Statistics, 2012, pp. 2266–2292