Understanding the Very High Energy -ray excess in nearby blazars using leptonic model
Abstract
The availability of simultaneous X-ray and Very High Energy (VHE) observations of blazars helps to identify the plausible radiative contributors to the VHE emission. Under leptonic scenario, the VHE emission from BL Lacs are attributed to the synchrotron self Compton (SSC) emission. However, many BL Lacerate (BL Lacs) have shown significant hardening at VHE after correction for the Extra Galactic Background Light (EBL) attenuation. We study the spectral hardening of two nearby BL Lac objects, Mkn 421 and Mkn 501 having most number of simultaneous X-ray and VHE observations available among all the blazars. These BL Lacs are relatively close and the effect of EBL attenuation is relatively minimal/negligible. We study the scatter plot between the X-ray spectral indices and intrinsic VHE indices to identify the plausible origin of the VHE emission. For Mkn 501, the VHE spectral indices are steeper than X-ray spectra, suggesting the scattering process happening at extreme Klein-Nishina regime. On the other hand, for Mkn 421, the VHE spectra is remarkably harder than the X-ray spectra, which suggests an additional emission mechanism other than the SSC process. We show this hard VHE spectrum of Mkn 421 can be explained by considering the inverse Compton (IC) emission from a broken power law electron distribution with Maxwellian pileup. The possibility of the hadronic contribution at VHE -rays is also explored by modeling the hard spectrum under photomeson process.
keywords:
galaxies:active – quasars: individual: Mkn 421,Mkn 501 – galaxies: jets – radiation mechanism: non-thermal – gamma-rays: galaxies1 Introduction
Blazars are subclass of active galactic nuclei (AGN) with powerful relativistic jet pointing close to the line of sight of observer (Urry & Padovani, 1995; Abdo et al., 2010; Acero et al., 2015). The jet emission is non-thermal in nature and dominates the overall spectrum of blazars. Further, the alignment of this relativistic jet results in significant enhancement of the flux due to Doppler effect, and extreme observational features like rapid variability down to time-scales of minutes and super-luminal motion in high resolution radio maps (Urry & Padovani, 1995). Blazars are broadly classified as flat-spectrum radio quasars (FSRQs) and BL Lacs based on the presence or absence of spectral line features in their optical spectra (Stickel et al., 1991; Urry & Padovani, 1995).
The broadband spectral energy distribution (SED) of blazars are characterized by a typical double hump feature with the low energy component peaking at optical/UV/X-ray band, while the high energy component at GeV/TeV energy. The low energy spectral component is well understood to be synchrotron emission arising from a non-thermal distribution of charged particles gyrating in the magnetic field of the jet. Based on the peak frequency of the synchrotron component, BL Lac objects are further classified into high energy peaked blazars (HBL) ( Hz), intermediate peaked blazars (IBL) ( Hz) and low energy peaked blazars (LBL) ( Hz) (Fossati et al., 1998).
The origin of the high energy component is still unclear with the inverse Compton up-scattering of low energy photons by a relativistic electron distribution being the most competitive model (leptonic model) (Ghisellini et al., 1985; Dermer & Schlickeiser, 1993a; Sikora et al., 1994; Costamante & Ghisellini, 2002; Costamante et al., 2018). If the synchrotron photons itself gets up-scattered to -ray energies then the scattering process is termed as synchrotron self Compton (SSC) emission (Ghisellini et al. (1998)). On the other hand, if the soft photons are of external origin then the emission process is termed as external Compton (EC). The plausible external photon field participating in the EC process can be the IR photons from the dusty torus (Błażejowski et al., 2000), broad emission lines from the hot gases (broad line region) (Dermer & Schlickeiser, 1993b) and the thermal photons from the accretion disk (Dermer & Schlickeiser, 1993a; Boettcher et al., 1997). In case of HBLs, the -ray emission can be understood within the framework of SSC emission models (Katarzyński et al., 2001; Abdo et al., 2011a; Aleksić et al., 2015; Dmytriiev et al., 2021), while the -ray emission from IBL/LBL/FSRQ support the EC process (Hayashida et al., 2012; Böttcher et al., 2013b; Hervet et al., 2015). High energy component of the SED can also be explained by the hadronic emission models considering proton synchrotron process and/or pion decay processes (Mannheim, 1993; Aharonian, 2000; Cerruti et al., 2015a). The leptonic models are mostly favoured over hadronic models due to large jet power required by the later (Böttcher et al., 2013a; Petropoulou & Dermer, 2016). Nevertheless, detection of neutrino from AGN and orphan VHE flares strongly favours the models involving hadronic interaction (Acciari et al., 2022).
Blazars comprise majority of the extragalactic -ray sources in the universe (Wakely & Horan, 2008). The VHE -ray emission from blazars en-route to the observer gets absorbed by EBL via pair production process, which causes the observed VHE spectrum to differ from the intrinsic VHE spectrum (Salamon & Stecker, 1998). For the sources at larger redshift, the VHE flux gets significantly attenuated by EBL and the resultant observed spectrum will be steeper than the intrinsic one. In order to obtain the physical parameters responsible for the VHE emission, one needs to obtain the underlying intrinsic spectrum. In most of VHE blazars, the EBL correction to the observed spectrum results in the harder intrinsic spectrum, which poses a challenge for the conventional emission models; nevertheless, attempts have been made to explain the hard VHE spectra. The hardening can be attributed to the internal absorption of -rays due to interactions with dense and narrow radiation fields located near the compact emission regions (Aharonian et al., 2008). Katarzyński et al. (2006) has shown that a harder -ray spectrum can be produced under SSC emission scenario when the underlying electron distribution is very hard with high minimum energy cut-off. A hard electron distribution with the index less than 2 (corresponding inverse Compton spectral index less than 1.5) can be attained if the electrons are accelerated at relativistic shock fronts (Stecker et al., 2007). Addition to this, during one of the major VHE flare of Mkn 501, the source also showed an unusual excess at 3 TeV which can be fitted by a combination of log-parabola and and exponential function (MAGIC Collaboration et al., 2020). Such a spectrum can be reproduced by considering an electron distribution which is a combination of a power-law function with a pile up (Hu & Yan, 2021a).
VHE hardening in blazars and the underlying physics can be best understood by studying the nearby bright blazars, as the effect of EBL on their spectrum will be minimum. Mkn 421 and Mkn 501 are the two brightest nearby BL Lac objects and are among few blazars with good quality data available for complete broadband SED modeling (Abdo et al., 2011b). Mkn 421 was also the first blazar discovered at TeV energy by Whipple telescope in 1992 (Punch et al., 1992; Fossati et al., 2008) and one of the closest BL Lac objects located at a redshift of 0.0308 (Ulrich et al., 1975). Mkn 501 at redshift 0.034 is another intensively monitored nearby BL Lac object (Abdo et al., 2011b; Ahnen et al., 2018) and the VHE emission from this source was first observed by the Whipple observatory in 1995 (Quinn et al., 1996). Among blazars, Mkn 421 and Mkn 501 also have maximum number of simultaneous X-ray and VHE observations available. Significant number of observations and being nearby blazars makes them the ideal laboratory for studying the VHE spectral properties. In this paper, we examine the VHE spectral hardening of Mkn 421 and Mkn 501 in comparison with their simultaneous X-ray spectrum using archival MAGIC and Swift-XRT observations. Further, we supplement the study with the broadband spectral modelling of the hard VHE spectrum considering different emission scenario. The paper is organised as follows: In section §2, we give the details of the observations and the data analysis procedure and in §3 the hard VHE spectra is studied. In §4, we perform the broadband spectral fitting of the source with relatively hard VHE spectrum and summarise the results in §5. Throughout the work we use a cosmology with , , and .
2 Observations and Data Reduction
The simultaneous broadband information of the Bl Lac objects Mkn 421 and Mkn 501 in Optical/UV, X-ray, -ray and VHE energy bands are obtained from Swift-UVOT/XRT, Fermi-LAT, and Major Atmospheric Gamma-ray Imaging Cherenkov Telescope (MAGIC) observations. For the VHE hardness study, we acquire the archival spectral information in the X-ray and VHE band from the literature (Aleksi´c, J. et al. (2012); Baloković et al. (2016); Ahnen et al. (2018);Acciari et al. (2020)) whereas, for the broadband spectral fitting we reduce the Optical/UV and X-ray data from Swift observations, and the -ray data from Fermi observations.
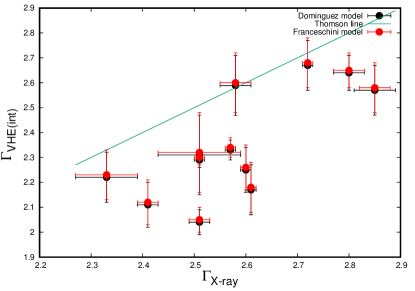
The blazar Mkn 421 was observed intensively during December, 2007 – June, 2008 by MAGIC telescope and Swift observatory in the optical/UV and X-ray bands. During this period, the source was in active state, and eight VHE observations have simultaneous data available in the X-ray band (Aleksi´c, J. et al., 2012). The VHE and X-ray spectral shape during these eight epochs were represented either by a log-parabola or a power-law functions. Unlike power-law, the spectral slope in case of log-parabola will be energy dependent and hence cannot be used readily for the hardness study. Therefore, we use only those simultaneous observations for which the X-ray and the VHE spectra can be well represented by a power-law function. Under this criteria, only three out of eight observations were selected during this observation window. The next multi-wavelength observation of Mkn 421 was performed in 2013 during which the source was in quiescent state. The detailed analysis of the data during this observation window was reported in Baloković et al. (2016) and with eleven simultaneous X-ray and VHE spectral fits. For nine epochs, the X-ray and VHE spectra were well represented by a power-law function and these observations are considered for the present study. The observed VHE spectrum is corrected for EBL induced absorption using the opacity estimates by Franceschini et al. (2008) and Domínguez et al. (2010). Since at low redshifts these EBL models are consistent, the predicted intrinsic source VHE spectra do not vary significantly (see Figure 2). In Table 1, we provide the details of the simultaneous X-ray and VHE observations of Mkn 421.
Mkn 501 is extremely high energy peaked blazar (EHBL) and has been the target of simultaneous observations during various flux states (Ahnen et al., 2018). The source was observed in 2012, and during this period eight simultaneous X-ray and VHE spectra were available (Ahnen et al., 2018). All the spectra can be well represented by a power-law function and are included for the present study. The source was again observed simultaneously at different energy bands for nearly two weeks of July, 2014. During this period, the enhanced X-ray flux let to have fourteen simultaneous X-ray and VHE observations (Acciari et al., 2020). However, only nine spectra followed a power-law function and are used for this study. The details of the selected epochs are given in Table 1. We have not performed EBL correction for these VHE observations instead use the EBL corrected VHE spectra reported in the original works (Ahnen et al., 2018; Acciari et al., 2020).
Among these two sources, Mkn 421 shows hard VHE spectra during different flux states (Aleksi´c, J. et al., 2012; Baloković et al., 2016). During the 2013 multi-wavelength campaign of Mkn 421, the maximum hardness in VHE spectrum was observed on MJD 56335 (Baloković et al., 2016). We construct simultaneous broadband SED of the source during this epoch to examine whether this hardness is consistent with the leptonic interpretation of the VHE spectrum (§4). The broadband SED is obtained by supplementing the VHE observation with the Swift-XRT/UVOT and Fermi-LAT -ray observations.
2.1 Data Reduction
2.1.1 Fermi-LAT
The Fermi Large Area Telescope (Fermi-LAT) is one of the two instruments onboard the Fermi Gamma Ray Space Telescope launched in 2008. Fermi-LAT operating in all-sky scanning mode observes the galactic and extra galactic sources in the energy range 20 MeV to 500 GeV (Atwood et al., 2009). Since 2008, the Fermi-LAT has been monitoring blazars continuously with a broad field of view (FoV) sr (Atwood et al., 2009). In this work, we select source class events in the energy range 0.1–300 GeV within 15 degree of the position of the source. We have used Pass 8 data with the photon-like events classified as ’evclass=128, evtype=3’. The data is converted to science products using the Fermitools (formally Science Tools) with the latest version v2.0.1 111https://fermi.gsfc.nasa.gov/ssc/data/analysis/documentation/. The recommended criteria was used for the good time interval selection. The contamination from the -rays of bright Earth limb is avoided by using a zenith angle cut of 90 deg. The Galactic diffuse and the isotropic emission components were modelled with the post-launch instrument response function P8R3-SOURCE-V2 and iso-P8R3-SOURCE-V2-v1.txt, respectively. In the XML model file, we included all the sources from the 4FGL catalogue which were within (15+10) deg ROI of the source location. In the generation of -ray spectrum, we considered the source to be detected if the test statistics (TS) is > 9 which corresponds to a 3-sigma detection (Mattox et al. (1996)).
2.1.2 Swift-XRT
Swift is a multi-wavelength telescope, specially designed to observe the transitory phenomena in the galactic and extra galactic sky. It is equipped with three instruments namely X-ray telescope (XRT), an ultraviolet and optical telescope (UVOT) and burst alert telescope (BAT). During the time MJD 56335, Swift-XRT observed the source in the Window Timing (WT) mode. We processed the WT data by following the standard data analysis procedure mentioned in the Swift analysis thread page 222https://www.swift.ac.uk/analysis/xrt/. The clean event file was produced by running XRTPIPELINE using the latest version of CALDB. In order to obtain the source spectra, we used the XSELECT tool available with HEASOFT-6.24. The source spectra is extracted from a circular region of radius pixels (47.2 arcsec) centered at the position of the source, while the background spectra is extracted from a circular region with the radius 100 arcsec but from a neighbouring region excluding the source pixels. We used the standard grade selection 0–12. XRTMKARF tool was used to produce the auxiliary response files (ARF). The 0.3–10 keV source spectrum was binned using the grppha tool prior to spectral fitting to ensure that each bin had at least 20 counts. The spectrum was fitted in XSPEC by power-law model and the absorption along the light path was adjusted by using the Galactic value for neutral hydrogen column density as (Kalberla et al., 2005).
2.1.3 Swift-UVOT
UVOT is a diffraction limited 30 cm optical–UV telescope co-aligned with the X-ray telescope. It is equipped with six distinct filters sensitive in the nanometer(nm) wavelength range with a field of view . The Swift-UVOT observations are available in UM2, UW1 and UW2 filters during the time MJD 56335. We checked these observations for aspect correction using ASPCORR, and subsequently made the correction by running uvotskycorr. Magnitudes were extracted from images using tool UVOTSOURCE with source and background regions of radii 5 and 10 arcsec respectively. We used the mag and the ratio to correct the observed magnitudes for Galactic extinction.
3 X-ray–VHE Spectral Hardeness
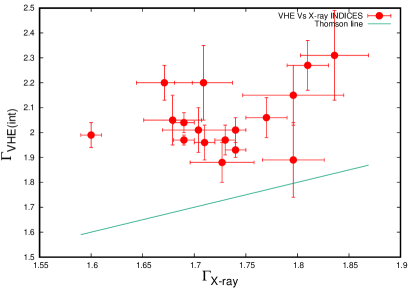
The correlated variability observed between the X-ray and the -ray energy bands of Mkn 421 and Mkn 501 suggests the same electron population is responsible for the emission at these energies. For these sources, the X-ray emission is attributed to the synchrotron emission process and the VHE emission to SSC process. If the Compton scattering process happens in the Thomson regime then the spectral indices at these energies will be equal; while, under Klein-Nishina regime then the VHE spectrum will be steeper than the X-ray spectrum. However, if the VHE index is harder than the X-ray spectrum then it indicates additional emission process may be contributing at VHE.
To examine this, we compare the X-ray and VHE intrinsic spectral indices of Mkn 421 and Mkn 501 during its simultaneous observation periods. The spectral information in the X-ray and VHE band has been acquired from the literature (See section §2). Blazar spectra in the VHE band are attenuated en route through pair production process with the EBL and hence the observed VHE spectrum should be corrected to obtain the intrinsic spectrum (Franceschini et al., 2008). For Mkn 501, we consider the intrinsic VHE spectra reported in the original literature (Ahnen et al., 2018; Acciari et al., 2020) while for Mkn 421, the observed VHE spectrum reported in the literature (Aleksi´c, J. et al., 2012; Baloković et al., 2016) are corrected for the EBL induced absorption considering the source spectrum to be a power law,
| (1) |
where, and are the intrinsic and observed VHE spectral indices, and is the EBL opacity for the -ray photon of energy emitted by the source located at redshift . We estimate considering two different EBL models, Franceschini et al. (2008) and Domínguez et al. (2010), and the differentiation is performed numerically. For the differentiation, we linearly interpolated the opacity estimates provided as two dimensional array in Franceschini et al. (2008) and Domínguez et al. (2010). The is evaluated at which is then compared with the X-ray spectral index. In Table 1, we provide the X-ray and the intrinsic VHE spectral indices for Mkn 421 and Mkn 501. We find that the choice of EBL models used do not vary the estimated significantly and this is consistent with our earlier study Malik et al. (2022) where different EBL models agree to each other at low redshifts.
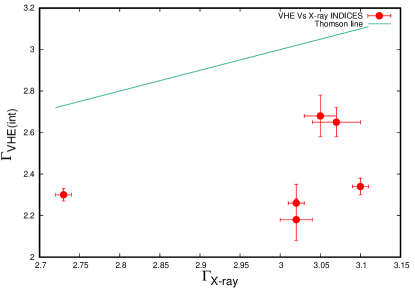
The scatter plot between the simultaneous X-ray spectral indices () and the intrinsic VHE spectral indices () for the case of Mkn 501, obtained from Swift-XRT and MAGIC observations is shown in Figure 1 along with the identity line. All the points fall above the identity line indicating the VHE spectral indices are steeper than the corresponding simultaneous X-ray spectral indices. If same electron population is responsible for the emission at these energies, then this result supports the SSC scattering process to happen at Klein-Nishina regime. In Figure 2, we show the similar plot obtained for the case of Mkn 421 along with the identity line. Interestingly, all the points fall below the identity line indicating a hard VHE spectra. We performed the study for the two EBL models mentioned earlier (black and red points) and the results are consistent with hard VHE spectra. This result cannot be perceived simply under SSC scenario if same electron distribution is responsible for the emission at these energies. We repeated this study by considering the hard X-ray spectral index obtained from Nu-STAR observations of the source (Baloković et al., 2016) and the obtained from MAGIC observations (Figure 3). Again, the data points show severe deviation from the identity line indicating a hard VHE spectra. Therefore, this study suggests that the VHE spectra of Mkn 421 may also involve different emission component probably in addition to the SSC emission.
| Source Name | X-Ray Observations | VHE observations | Refrences | ||
| Time (MJD) | Time (MJD) | ||||
| Mkn 421 | 56302.1557 | 2.80 0.03 | 56302.1365 | 2.65 0.07 | Baloković et al. (2016) |
| – | 56307.3519 | 2.60 0.01 | 56307.2556 | 2.60 0.09 | – |
| – | 56310.1675 | 2.85 0.03 | 56310.2441 | 2.58 0.1 | – |
| – | 56312.2388 | 2.72 0.01 | 56312.1718 | 2.68 0.1 | – |
| – | 56327.1409 | 2.51 0.02 | 56327.0731 | 2.05 0.05 | – |
| – | 56333.1279 | 2.41 0.02 | 56333.1147 | 2.12 0.09 | – |
| – | 56335.0700 | 2.51 0.01 | 56335.0795 | 2.30 0.03 | – |
| – | 56340.0047 | 2.61 0.01 | 56340.1722 | 2.18 0.1 | – |
| – | 56363.0045 | 2.57 0.01 | 56363.1066 | 2.34 0.04 | – |
| – | 54473 | 2.58 0.03 | 54473 | 2.50 0.12 | Aleksi´c, J. et al. (2012) |
| – | 54558 | 2.51 0.08 | 54558 | 2.22 0.16 | – |
| – | 54559 | 2.33 0.06 | 54559 | 2.13 0.10 | – |
| Mkn 501 | 56855.04 | 1.81 0.02 | 56855.91 | 2.27 0.10 | Acciari et al. (2020) |
| – | 56856.86 | 1.74 0.01 | 56856.91 | 2.01 0.05 | – |
| – | 56858.93 | 1.69 0.01 | 56858.98 | 2.04 0.04 | – |
| – | 56861.99 | 1.77 0.02 | 56861.01 | 2.06 0.08 | – |
| – | 56865.04 | 1.73 0.01 | 56865.00 | 1.97 0.06 | – |
| – | 56866.92 | 1.69 0.01 | 56866.00 | 1.97 0.02 | – |
| – | 56867.99 | 1.60 0.01 | 56867.00 | 1.99 0.05 | – |
| – | 56868.92 | 1.74 0.01 | 56868.01 | 1.93 0.03 | – |
| – | 56869.92 | 1.71 0.01 | 56869.92 | 1.96 0.07 | – |
| – | 56032.174 | 1.796 0.030 | 56032 | 1.85 0.025 | Ahnen et al. (2018) |
| – | 56036.043 | 1.727 0.031 | 56036 | 1.88 0.08 | – |
| – | 56040.123 | 1.836 0.033 | 56040 | 2.31 0.18 | – |
| – | 56073.333 | 1.671 0.027 | 56073 | 2.20 0.07 | – |
| – | 56074.059 | 1.704 0.035 | 56074 | 2.01 0.09 | – |
| – | 56076.021 | 1.709 0.028 | 56076 | 2.20 0.15 | – |
| – | 56093.988 | 1.796 0.049 | 56093 | 2.15 0.12 | – |
| – | 56095.050 | 1.679 0.028 | 56095 | 2.05 0.10 | – |
4 Broadband SED Modelling
In order to understand the VHE spectral hardening of Mkn 421, we selected the epoch MJD 56335 during which simultaneous observations were available in Optical/UV, X-ray, MeV-GeV -ray and VHE -ray. This epoch was selected since the VHE spectrum showed significant hardening. The data corresponding to these energy bands are acquired from Swift-UVOT/XRT and Fermi-LAT telescopes, while the VHE spectral information is obtained from Baloković et al. (2016). Due to low photon statistics at -ray energy, the Fermi-LAT data is integrated over a period of four days from MJD 56334 to 56337. The integrated -ray spectrum during this period is fitted by log-parabola function
| (2) |
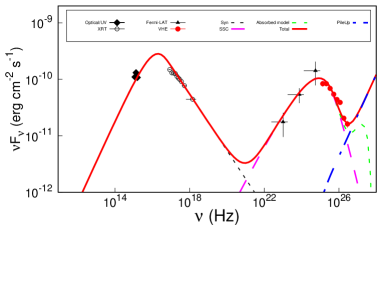
where is the normalization, is the spectral index at the photon energy and decides the curvature at SED peak. Our fitting resulted in and for the choice of = 1286.47 MeV. During the spectral fit, we assume the spectral parameters of sources other than Mkn 421 in the ROI do not change and hence, we froze the model parameters corresponding to these sources to the values given in the 4FGL catalog. To generate the broadband SED, we obtained the -ray fluxes at five energy bins within 0.1–300 GeV. The X-ray fluxes are obtained by fitting the source spectrum with absorbed power law model and following the standard data analysis procedure as discussed in section §2.1.2. In case of Swift-UVOT, magnitudes were extracted from images using tool UVOTSOURCE with source and background regions of radii 5 and 10 arcsec respectively. The observed fluxes were de-reddened for Galactic extinctions. The final broadband SED is shown in Figure 4.
4.1 Emission Model
The broadband SED is modelled considering synchrotron and SSC emission mechanism from a relativistic non-thermal electron distribution. The emission region is assumed to be a spherical region of size , moving down the blazar jet at relativistic speed. Due to the narrow inclination of the jet from the line of sight of the observer, the emission is significantly Doppler boosted and we denote this Doppler factor as . The emission region is permeated with a tangled magnetic field and the relativistic electron distribution loses its energy predominantly through synchrotron and SSC loss processes. Besides these emission processes, there can be also be substantial hadron content in the jet which may produce additional emission, particularly at very high energies. Hence, to model the broadband SED and the hard VHE spectrum of Mkn 421, we consider different scenarios of particle distribution involving only leptons and also in combination with the hadrons.
4.1.1 Broken Power-law Electron Distribution
We assume the non-thermal electron distribution responsible for the broadband emission to be a broken power-law, defined by
| (3) |
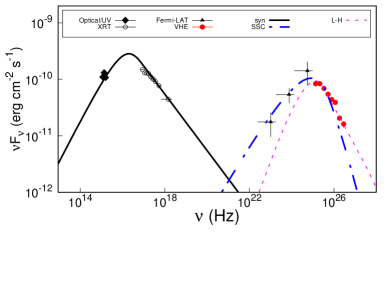
Here K is the particle normalization with units , is the Lorentz factor of the electron distribution, and are the low and high energy power-law indices of electron distribution with the break energy, and and representing the minimum and maximum available energy of the electron distribution. The synchrotron and SSC emissivity functions due to broken power-law electron distribution are solved numerically (Shah et al., 2017; Sahayanathan et al., 2018). Instead of broken power-law electron distribution, the observed SED can also be explained by the emission from a power-law electron distribution with an exponential cut-off (Sinha et al., 2015). However, in this work, we considered a broken power-law electron distribution which can plausibly originate from multiple acceleration process (Sahayanathan, 2008). The resultant flux at the observer is corrected for cosmological and relativistic effects (Begelman et al., 1980). The observed SED is reproduced using the synchrotron and SSC model flux with a proper choice of parameters. The source parameters chosen are , , , particle energy density , , , and . To extend the spectrum from radio and VHE band, we chose and . In Fig. 4, we show the spectra due to synchrotron and SSC along with the observed SED. The model is able to reproduce the optical/UV, X-ray, and low energy -ray flux; however, at VHE it fails to account for the observed flux (dashed line).
4.1.2 Broken Power-law Electron Distribution with high energy Pile-up
The hard VHE spectrum of Mkn 421 cannot be explained by the synchrotron and SSC emission from a broken power-law electron distribution. To resolve this, we introduce in the broken power-law electron distribution an additional quasi steady high energy pile-up at its maximum available electron energy (). Such an excess may be possible in the region of particle acceleration when the energy loss rate dominates the acceleration rate for electrons with Lorentz factor (Kirk et al., 1998; Stawarz & Ostrowski, 2002). We approximate this high energy pile-up as a -function given by
| (4) |
and deduce the inverse Compton emissivity due to up-scattering of the synchrotron photons as (Appendix A)
| (5) |
where, is the synchrotron photon energy density.
With this additional Compton spectral component and by setting , we were able to reproduce the hard VHE spectrum. However, the intrinsic VHE SED will be monotonically increasing until it reaches the Klein-Nishina scattering limit. Nevertheless, the observed VHE spectrum do not reflect this feature since it is significantly suppressed by the absorption due to EBL interaction. We also attempted to fit the broadband SED using different values of . However, we observed that lowering the value of causes the pileup emission component to shift to lower energies, resulting in a corresponding shift of the peak intensity towards lower energy regions. Consequently, this caused the model to deviate from the observed hard VHE data points. To ensure consistency with the observed data, we fixed at while reproducing the broadband SED points. The modified SED along with the observed VHE spectrum is shown in Figure 4.
The high energy pile-up in the particle spectrum will also cause excess in synchrotron emission. The synchrotron emissivity due to this pile up will be (in the rest frame of th emission region)
| (6) |
where,
| (7) |
and
| (8) |
For the chosen set of parameters, the observed synchrotron spectrum will peak at
| (9) | ||||
| (10) |
and the flux in representation at this frequency is found to be erg/cm2/s. This flux is sub-dominant to the contribution from the broken power-law electron distribution and hence will not deviate the low energy spectrum.
4.2 Lepto-hadronic model
The possible alternative considered here to explain the VHE excess is the contribution of energetic protons whose contributions remain sub-dominant in lower energies. To model this scenario, we consider the photomeson process where the relativistic protons interact with the synchrotron photons present in the relativistically moving emission region. Here we considered the production of neutral pions () in photomeson process and the decay of into two -photons. The production of charged pions () which subsequently produce electrons and positrons, is not considered here.
To estimate the -ray spectrum produced in the photomeson process through the decay of neutral pions we used the formalism developed by Kelner & Aharonian (2008). The energy distribution of -rays produced due to the decaying -meson is given by (Kelner & Aharonian, 2008)
| (11) |
where and are the number of proton and number of synchrotron photons densities in the energy ranges and respectively. is the angle averaged cross-section of the p-interaction. The dimensionless quantities and are given by (Kelner & Aharonian, 2008)
| (12) |
The details of the parametric form of the function is given in Kelner & Aharonian (2008). The estimated broadband SED using lepto-hadronic model along with the spectral data of Mrk 421 is shown in figure 5. As can be seen that it can also explain the VHE component of the the source. In earlier studies, the hard TeV spectrum has also been explained using hadronic and leptohadronic models. Aguilar-Ruiz et al. (2022) have explained the hard TeV spectra of six extreme BL Lacs using two zone leptohadronic model. The VHE -ray emission is well explained by the photo-hadronic processes in the spherical zone near the BL Lac core while as low energy spectra(X-rays) is due to synchrotron process in the far zone. The accelerated protons in the near zone interact with the photons from the sub-relativistic pair plasma. The 2018 TeV detection from EHBL 2WHSP J073326.7+515354 by MAGIC collaboration was better explained by hadronic model(MAGIC Collaboration et al., 2019). In such models -ray emission is due to protons in the jet or by the emission from particles formed during proton-photon interaction (Mannheim, 1993; Aharonian, 2000; Böttcher et al., 2013a)
5 Summary
We investigated the variation of intrinsic VHE spectral indices with X-ray indices of two nearby blazars viz. Mkn 421 and Mkn 501. The simultaneous X-ray and VHE observations of Mkn 501 show that the VHE spectrum is steeper than the X-ray spectrum. This may indicate that the SSC process, responsible for the -ray emission, fall in the Klein-Nishina scattering regime. If the scattering process happens at Thomson regime, one would expect the VHE index to be equal to the X-ray spectral index as the same electron population is responsible for the emission at these photon energies. The scatter plot of the simultaneous X-ray and VHE observations of Mkn 421, on the contrary, show a hard VHE spectra and this cannot be attributed purely due to SSC process happening neither under Thomson nor Klein-Nishina scattering regime. This hints that at the VHE energy of Mkn 421, additional emission process may be active. It is important to note that the effect of EBL can be significant at multi-TeV energies. If the VHE index strongly depends on the flux at multi-TeV, then it indicates that the observed VHE spectrum is steeper. Consequently, the effect of EBL would harden the intrinsic VHE spectrum further than the ones estimated in this work . As a result, our conclusion that the VHE spectrum in Mkn 421 is harder than the X-ray spectrum remains valid.
To account for the additional emission process at VHE, we explore two plausible scenarios in this work. First, we consider a quasi-steady high energy pile-up of electrons at the maximum energy of the broken power-law electron distribution (Hu & Yan, 2021b). Under Fermi acceleration, efficient radiative loss at high energy can lead to such quasi-steady pile-ups in the accelerated electron distribution (Stawarz & Ostrowski, 2002). Approximating this pile-up of electrons as -function, we reproduce the hard VHE spectra of Mkn 421 by considering the Compton up-scattering of the low energy synchrotron photons. In the second case, we consider the photo-meson process as the additional source of VHE emission. Along with the electrons, protons can also be accelerated to ultra-relativistic energies that can interact with the low energy synchrotron photons and produce pions. The emissivity due to the decay of this neutral pion into two -ray photons is used to account for the excess VHE emission. We find the observed hard VHE spectrum in Mkn 421 can be well explained under both these scenarios. Possible detection of neutrino emission from the source have the potential to scrutinize these models.
One can avoid the hard VHE spectrum of Mkn 421 by claiming that the EBL absorption is overestimated. Theoretically this is possible by incorporating the Lorentz invariance violation scenario (Kifune, 1999), which likely takes place above 2 TeV (Stecker & Glashow, 2001). However, the hard spectra problem in distant blazars occurs at sub-TeV energies. Other possibility to resolve the hard VHE spectra is by considering the VHE photons as secondary -rays produced by the interactions of cosmic ray protons with background photons (Essey et al., 2011). Alternatively, one can also argue that the -ray photons oscillates as light axion-like particle close to the source and finally converts back to photons before reaching the Earth (Essey et al., 2011). However, these scenario would be considerable if the source is located at a large distance and also demand the existence of exotic particles or very low magnetic fields (G). Therefore, in a more realistic astrophysical scenarios, the formation of the non-thermal particle distribution is more likely reason for the hard VHE spectra.
Besides the leptonic models, a number of alternate explanations to the hard -ray spectrum has also been explored in the literature. For instance Cerruti et al. (2015b) has explained the hard TeV spectra using lepto-hadronic modelling similar to the one considered in this work. They modelled the low energy component of blazar SED as the synchrotron emission from a relativistic electron distribution; while, the high energy component is the result of SSC and pion-induced cascade process. Particle acceleration due to magnetic re-connection has also been considered to explain the hard spectra. Such acceleration process is capable of producing a hard particle distribution with index 1.5 (Sironi & Spitkovsky, 2014). In spite of various explanations for the hard VHE spectrum from sources, the observational evidence to converge to the right model is currently unavailable. Probably, a detailed temporal modeling of the blazar light curves at different energy band along with VHE have the capability to eliminate the inconsistent models. With the advent of high sensitivity instruments, operating at VHE like Cherenkov Telescope Array (CTA), it is expected to provide a better understanding regarding the -ray emission from blazars.
6 Acknowledgements
AM, SS, NI and ZM are thankful to the Department of Atomic energy (DAE),Board of Research in Nuclear Sciences (BRNS), Govt of India via Sanction Ref No.: 58/14/21/2019-BRNS for the financial support. ZS is supported by the Department of Science and Technology, Govt. of India, under the INSPIRE Faculty grant(DST/INSPIRE/04/2020/002319).
7 DATA AVAILABILITY
The multi-wavelength data used in this work is publicly available at the data browse section of the respective observatories. Codes used in this work will be shared on request to the corresponding authors.
References
- Abdo et al. (2010) Abdo A. A., et al., 2010, ApJ, 715, 429
- Abdo et al. (2011a) Abdo A. A., et al., 2011a, ApJ, 736, 131
- Abdo et al. (2011b) Abdo A. A., et al., 2011b, ApJ, 736, 131
- Acciari et al. (2020) Acciari V. A., et al., 2020, Astronomy & Astrophysics, 637, A86
- Acciari et al. (2022) Acciari V. A., et al., 2022, ApJ, 927, 197
- Acero et al. (2015) Acero F., et al., 2015, ApJS, 218, 23
- Aguilar-Ruiz et al. (2022) Aguilar-Ruiz E., Fraija N., Galván-Gámez A., Benítez E., 2022, MNRAS, 512, 1557
- Aharonian (2000) Aharonian F., 2000, New Astronomy, 5, 377–395
- Aharonian et al. (2008) Aharonian F. A., Khangulyan D., Costamante L., 2008, Monthly Notices of the Royal Astronomical Society, 387, 1206–1214
- Ahnen et al. (2018) Ahnen M. L., et al., 2018, Astronomy & Astrophysics, 620, A181
- Aleksi´c, J. et al. (2012) Aleksi´c, J. et al., 2012, A&A, 542, A100
- Aleksić et al. (2015) Aleksić J., et al., 2015, Journal of High Energy Astrophysics, 5, 30
- Atwood et al. (2009) Atwood W. B., et al., 2009, ApJ, 697, 1071
- Baloković et al. (2016) Baloković M., et al., 2016, The Astrophysical Journal, 819, 156
- Begelman et al. (1980) Begelman M. C., Blandford R. D., Rees M. J., 1980, Nature, 287, 307
- Błażejowski et al. (2000) Błażejowski M., Sikora M., Moderski R., Madejski G. M., 2000, ApJ, 545, 107
- Boettcher et al. (1997) Boettcher M., Mause H., Schlickeiser R., 1997, A&A, 324, 395
- Böttcher et al. (2013a) Böttcher M., Reimer A., Zhang H., 2013a, in European Physical Journal Web of Conferences. p. 05003, doi:10.1051/epjconf/20136105003
- Böttcher et al. (2013b) Böttcher M., Reimer A., Sweeney K., Prakash A., 2013b, ApJ, 768, 54
- Cerruti et al. (2015a) Cerruti M., Zech A., Boisson C., Inoue S., 2015a, Monthly Notices of the Royal Astronomical Society, 448, 910
- Cerruti et al. (2015b) Cerruti M., Zech A., Boisson C., Inoue S., 2015b, Monthly Notices of the Royal Astronomical Society, 448, 910–927
- Coppi & Blandford (1990) Coppi P. S., Blandford R. D., 1990, MNRAS, 245, 453
- Costamante & Ghisellini (2002) Costamante L., Ghisellini G., 2002, A&A, 384, 56
- Costamante et al. (2018) Costamante L., Cutini S., Tosti G., Antolini E., Tramacere A., 2018, MNRAS, 477, 4749
- Dermer (1995) Dermer C. D., 1995, ApJ, 446, L63
- Dermer & Schlickeiser (1993a) Dermer C. D., Schlickeiser R., 1993a, ApJ, 416, 458
- Dermer & Schlickeiser (1993b) Dermer C. D., Schlickeiser R., 1993b, ApJ, 416, 458
- Dmytriiev et al. (2021) Dmytriiev A., Sol H., Zech A., 2021, MNRAS, 505, 2712
- Domínguez et al. (2010) Domínguez A., et al., 2010, Monthly Notices of the Royal Astronomical Society, 410, 2556–2578
- Essey et al. (2011) Essey W., Kalashev O., Kusenko A., Beacom J. F., 2011, ApJ, 731, 51
- Fossati et al. (1998) Fossati G., Maraschi L., Celotti A., Comastri A., Ghisellini G., 1998, MNRAS, 299, 433
- Fossati et al. (2008) Fossati G., et al., 2008, ApJ, 677, 906
- Franceschini et al. (2008) Franceschini A., Rodighiero G., Vaccari M., 2008, A&A, 487, 837
- Ghisellini et al. (1985) Ghisellini G., Maraschi L., Treves A., 1985, A&A, 146, 204
- Ghisellini et al. (1998) Ghisellini G., Celotti A., Fossati G., Maraschi L., Comastri A., 1998, Monthly Notices of the Royal Astronomical Society, 301, 451–468
- Hayashida et al. (2012) Hayashida M., et al., 2012, ApJ, 754, 114
- Hervet et al. (2015) Hervet O., Boisson C., Sol H., 2015, A&A, 578, A69
- Hu & Yan (2021a) Hu W., Yan D., 2021a, On the narrow spectral feature at 3 TeV in the MAGIC spectrum of Mrk 501 (arXiv:2108.10468)
- Hu & Yan (2021b) Hu W., Yan D., 2021b, MNRAS, 508, 4038
- Kalberla et al. (2005) Kalberla P. M. W., Burton W. B., Hartmann D., Arnal E. M., Bajaja E., Morras R., Pöppel W. G. L., 2005, A&A, 440, 775
- Katarzyński et al. (2001) Katarzyński K., Sol H., Kus A., 2001, A&A, 367, 809
- Katarzyński et al. (2006) Katarzyński K., Ghisellini G., Tavecchio F., Gracia J., Maraschi L., 2006, Monthly Notices of the Royal Astronomical Society: Letters, 368, L52
- Kelner & Aharonian (2008) Kelner S. R., Aharonian F. A., 2008, Physical Review D, 78
- Kifune (1999) Kifune T., 1999, ApJ, 518, L21
- Kirk et al. (1998) Kirk J. G., Rieger F. M., Mastichiadis A., 1998, A&A, 333, 452
- MAGIC Collaboration et al. (2019) MAGIC Collaboration et al., 2019, MNRAS, 490, 2284
- MAGIC Collaboration et al. (2020) MAGIC Collaboration et al., 2020, A&A, 637, A86
- Malik et al. (2022) Malik Z., Sahayanathan S., Shah Z., Iqbal N., Manzoor A., Bhatt N., 2022, MNRAS, 511, 994
- Mannheim (1993) Mannheim K., 1993, A&A, 269, 67
- Mattox et al. (1996) Mattox J. R., et al., 1996, Mem. Soc. Astron. Italiana, 67, 607
- Petropoulou & Dermer (2016) Petropoulou M., Dermer C. D., 2016, ApJ, 825, L11
- Punch et al. (1992) Punch M., et al., 1992, Nature, 358, 477
- Quinn et al. (1996) Quinn J., et al., 1996, The Astrophysical Journal, 456
- Sahayanathan (2008) Sahayanathan S., 2008, MNRAS, 388, L49
- Sahayanathan et al. (2018) Sahayanathan S., Sinha A., Misra R., 2018, Research in Astronomy and Astrophysics, 18, 035
- Salamon & Stecker (1998) Salamon M. H., Stecker F. W., 1998, The Astrophysical Journal, 493, 547
- Shah et al. (2017) Shah Z., Sahayanathan S., Mankuzhiyil N., Kushwaha P., Misra R., Iqbal N., 2017, Monthly Notices of the Royal Astronomical Society, 470, 3283
- Sikora et al. (1994) Sikora M., Begelman M. C., Rees M. J., 1994, ApJ, 421, 153
- Sinha et al. (2015) Sinha A., Shukla A., Misra R., Chitnis V. R., Rao A. R., Acharya B. S., 2015, A&A, 580, A100
- Sironi & Spitkovsky (2014) Sironi L., Spitkovsky A., 2014, ApJ, 783, L21
- Stawarz & Ostrowski (2002) Stawarz Ł., Ostrowski M., 2002, ApJ, 578, 763
- Stecker & Glashow (2001) Stecker F. W., Glashow S. L., 2001, Astroparticle Physics, 16, 97
- Stecker et al. (2007) Stecker F. W., Baring M. G., Summerlin E. J., 2007, The Astrophysical Journal, 667, L29–L32
- Stickel et al. (1991) Stickel M., Padovani P., Urry C. M., Fried J. W., Kuehr H., 1991, ApJ, 374, 431
- Tavecchio et al. (1998) Tavecchio F., Maraschi L., Ghisellini G., 1998, ApJ, 509, 608
- Ulrich et al. (1975) Ulrich M. H., Kinman T. D., Lynds C. R., Rieke G. H., Ekers R. D., 1975, ApJ, 198, 261
- Urry & Padovani (1995) Urry C. M., Padovani P., 1995, PASP, 107, 803
- Wakely & Horan (2008) Wakely S. P., Horan D., 2008, in International Cosmic Ray Conference. pp 1341–1344
Appendix A Inverse Compton emissivity due to mono energetic Electron Distribution
The inverse Compton emissivity in the rest frame of the emission region can be approximated as (Coppi & Blandford, 1990; Tavecchio et al., 1998)
| (13) |
Here, is the underlying electron distribution and is the target photon density which is being up scattered. The primed quantities are measured in the rest frame of the emission region. If we assume the electron distribution as a -function
| (14) |
In order to obtain the inverse Compton emissivity due to scattering of the synchrotron photons, we recast the -function over the . The final emissivity can be obtained from equation (13) as
| (15) |
The observed flux on earth can be obtained from this emissivity after accounting for the relativistic boosting and cosmological effects (Begelman et al., 1980; Dermer, 1995).