Single-shot X-ray Dark-field Tomography
Abstract
X-ray dark-field imaging creates a representation of the sample where contrast is generated by sub-resolution features within the volume under inspection. These are detected by a local measurement of the radiation field’s angular distribution, and how it is affected by the interaction with matter. X-ray dark-field imaging typically requires taking multiple exposures for separating the contributions to the detected X-ray intensity arising from scattering, refraction and attenuation; a procedure often called phase retrieval. We propose an approach to retrieve an X-ray dark-field image from a single X-ray shot. We demonstrate the method using a laboratory-based, rotating anode X-ray tube system without the need for coherent radiation or a high-resolution detector. This reduces the complexity of data acquisition, enabling faster scanning and increasing dose efficiency. Moreover, our approach reduces the problem dimensionality by one, with substantial implications for data-intensive applications like tomography. The model assumes a homogeneous material, and we show this is a valid hypothesis for soft biological tissues by reconstructing dark-field tomography images from data sets containing a single shot per view. We believe our method to be broadly applicable and relevant for many X-ray dark-field imaging implementations, including fast radiography, directional dark-field and for use with pulsed X-ray sources.
In X-ray dark-field and phase-contrast imaging, contrast is generated by the phase changes imparted to the radiation as it traverses the sample. Sensitivity to these contrast channels requires the use of specialised setups, often implemented with synchrotron radiation that offers high flux and coherence, but also adapted to laboratory-scale equipment. We focus here on edge illumination [1], for its applicability with rotating anode X-ray sources [2], robustness [3], negligible coherence condition (both spatial and temporal) [4] and because it is the only approach we know of that allows for uniform sampling of the illumination across a cm-sized field of view [5], which is important for single-shot imaging.
In phase-sensitive X-ray setups, the intensity reaching the detector is modulated by both attenuation and phase effects and separating these signals into attenuation, (differential) phase and dark-field images typically requires taking multiple exposures under different conditions, such as different propagation distances or positioning of optical elements or modulators [6, 7, 8, 9]. Alternatively, this can be done with a single exposure by finely sampling the illumination but comes at a cost of reducing the system resolution below that of the detector [10, 11, 12]. With single-shot imaging, we aim to extract the signal of a chosen contrast channel from only a single X-ray intensity projection. This necessarily requires assumption about the sample but potentially offers faster, more robust, more efficient and simpler acquisition protocols.
We introduce a homogeneous-object approximation for a solution that removes the need for multiple X-ray projection exposures or higher pixel density for a local analysis of the wavefront. This was inspired by the vastly applied Paganin retrieval [13] that allows for phase imaging from a single X-ray intensity projection, which was also recently translated to dark-field imaging in the context of synchrotron radiation [14]. We demonstrate our approach with a lab-based system, and we show the benefits on a data-intensive application such as tomography.
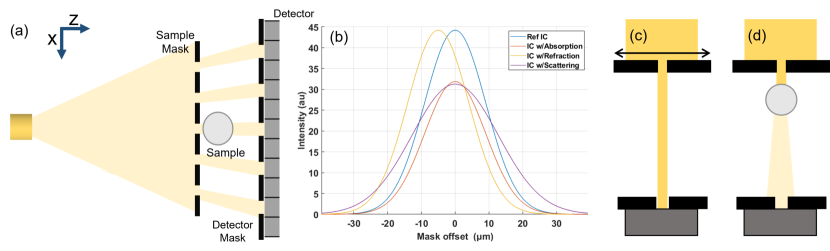
A schematic of an edge illumination system is shown in Fig. 1(a). The system uses an absorbing mask that has a one-dimensional periodic structure that modulates the beam into a series of beamlets. A second mask is placed just before the detector to analyse the profiles of these beamlets, with phase sensitivity along the direction between beamlets, and each beamlet associated with one detector pixel. The experiments in this work were performed with the prototype system developed at UCL, a full description of which can be found in Havariyoun et al. [15].
Imaging with the edge illumination system is through the acquisition and processing of each pixel’s illumination curve. This is the intensity measured by one pixel as the sample mask is translated in one period, and it is measured by taking a series of exposures at different offset positions between the sample mask and the detector mask along the -axis. A model illumination curve is shown in Fig. 1(b), for which a Gaussian function is a well-established approximation [9]. The dark-field image is retrieved through fitting Gaussian functions to the data acquired for each illumination curve [16], with the change in the area under the illumination curve corresponding to attenuation, the shift in centre position to refraction or differential phase, and the increase in width to scattering or dark-field contrast. In the case of tomography [17], the procedure needs to be repeated for each viewing angle, and thus the amount of images required is the number of sampling points along the illumination curve times the number of viewing angles, . In an edge illumination system, spatial resolution can be improved through a procedure known as dithering, where the sample is translated in small steps along the -axis, subsequently exposing parts of the sample that have not been illuminated, further increasing the acquisition dimensionality to three and the number of exposures to . The model and methodology presented here allows quantification of the dark-field signal with a stationary sample mask (i.e. no illumination curve scanning, ), reducing the acquisition dimensionality by one for all dark-field acquisitions. The proposed method additionally does not require curve fitting and hence it also substantially speeds up an otherwise computationally intensive data processing.
Single-Shot Dark-Field Model
The basis for single-shot dark-field imaging with edge illumination is a convolution model of the illumination curve. The illumination curve without the sample is denoted as the reference :
| (1) |
where indicates the displacement of the sample mask along the -axis, is a constant determining the amplitude of the curve, is the variance, and is the position of alignment between the sample and the detector apertures. Note that these parameters are all pixel-wise and vary between illumination curves across the detector. Variations in can originate from mask imperfections or misalignment. Single-shot dark-field retrieval requires imaging at the same point on each illumination curve across the detector, meaning variations in should be minimised but these can be reduced to well below a micron across the whole field of view [5, 18]. We will assume to be constant for all pixels. Variations in are less critical and can be accounted for by pixelwise correction, but we can assume this parameter to be constant without a significant performance loss.
When a sample is in the beam, the illumination curve is denoted as the sample illumination curve and includes three additional terms:
| (2) |
with quantifying the change in area from attenuation, quantifying the lateral shift from refraction, and quantifying the broadening in angular distribution from scattering (dark-field). Calculating these three parameters on a pixel-by-pixel basis yields attenuation, refraction and dark-field contrast images.
The effects of the attenuation and refraction signals must be isolated or excluded for retrieving from a single measurement. Sensitivity to refraction is linked to the gradient of the illumination curve [19], and hence it is minimised at the peak and tails, which is also where sensitivity to the dark-field broadening is highest. Sensitivity to attenuation signal is highest at the peak (See Fig. 1(d)). For single-shot dark-field imaging, we chose to expose at the peak of the illumination curves, where refraction effects can be neglected and sensitivity to scattering is retained, reducing the number of unknowns to two ( and ). We also note that this illumination is the most dose efficient with little X-ray intensity lost in the analyser.
At the peak of the illumination curve, i.e. when , the measured signal for the reference and sample illumination curves are as follows:
| (3) |
| (4) |
The assumption for single-shot dark-field imaging is that the shift in the centre position is small compared to the width of the curve, i.e. , which is generally valid away from material boundaries where the refraction is strongest. The above conditions allows for a simplification in Eq. 4 where . The following step involves taking the ratio between Eq. 3 and Eq. 4 and squaring the result to obtain:
| (5) |
Rearranging this to solve the dark-field signal gives the equation for dark-field retrieval:
| (6) |
and defining this can be written in more compact form as
| (7) |
with the dark-field signal expressed as a function of the width of the reference illumination curves, , the transmission signal, , and the change in peak illumination curve measurement, quantified as .
Solving Eq. 7 to obtain a dark-field image with a single exposure of the sample still requires knowledge of . An initial approach is that of a phase object, where transmission can be assumed to be unity. For samples showing non-negligible attenuation, simply substituting Eq. 7 results in a signal that is unsuitable for tomography because it cannot be expressed as integral as the X-ray path through the sample. By imposing a homogeneous-material approximation it is however possible to establish a relationship between and and constrain the solution of Eq. 7. In the following we show how this provides a signal proportional to the projected sample thickness and is thus compatible with tomographic imaging [20, 17] through standard algorithms such as filtered back projection.
The relationship between the dark field and attenuation signal is established by defining a new parameter:
| (8) |
which is a constant for a given sample, with units of µm-2, or the inverse of dark-field imaging units. This equation effectively assumes a homogeneous sample i.e. single material. We note that this does not imply a homogeneous microstructure i.e. one without density variations, which would result in a sample with weak scattering. A similar approach was successfully implemented in single-shot phase contrast imaging, where a homogeneous sample allows a linear relationship between the real and imaginary parts of the refractive index, most commonly used with Paganin retrieval [13] [21] in free-space propagation, and later translated to other phase-contrast imaging set-ups [22] [19] [23].
The second assumption underlying the proposed approach is that transmission is relatively high. This allows for the second-order Taylor expansion in Eq. 8 to be a good approximation. Replacing with above gives the following expression after the Taylor expansion around
| (9) |
where is the fraction of the beam absorbed by the sample. Note that through the homogeneous material approximation, this is also related to the dark-field signal. Substituting this into Eq. 8 and rearranging gives the following:
| (10) |
Substituting this and into Eq. 7 gives the following polynomial
| (11) |
which is a quadratic whose roots can be found as
| (12) |
where it was the solution with the negative square root which was found to give the solution that best matched the expected dark-field signal due to the performance in the limit of µm-2 . Eq. 10 can be applied pixel-wise and used to solve for a single-shot dark-field image. It will approximate the true dark-field signal if (i) transmission is high, (ii) a homogeneous object can be assumed, and (iii) is correctly estimated. The first point holds up to roughly 50% transmission (See Supplemental Material), which is a substantial extension (i.e. higher attenuation) if compared to the requirement for a pure phase object, needed if Eq. 7 is used to retrieve from a single exposure. The second and third requirements are more difficult to achieve with non-trivial samples. In practice, the single-shot retrieval is unlikely to yield a quantitative dark-field retrieval across the full image, but a qualitative tomographic reconstruction from a linear single-shot signal showing mixed attenuation and dark-field contrast is achievable with this approach.
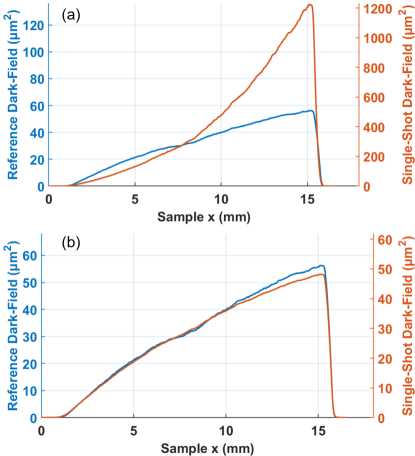
We first tested this approach on wedges of uniform material, for which a signal that grows linearly with sample thickness is expected. This was found to be the case when using a correct estimate for , in Fig. 2 we show results for a paper wedge. We refer the reader to the Supplemental Material for extended results including both weakly and strongly absorbing materials.
Single-Shot Dark-Field Tomography
We demonstrate the application of single-shot dark-field imaging to tomography on examples of biological tissues: a rat heart, a chicken bone, and vascularised endocrine pancreatic tissue. Datasets were acquired with 8 dithering steps, and 1200 angular views through 360∘, with each frame taken with 1.2 seconds exposure at the top of the illumination curves. The heart was obtained from the UCL Biological Services Unit, from rats euthanised for organ harvesting via Schedule 1 methods, and critically point dried as per Savvidis et al. [24]. The vascularized endocrine pancreas tissue constructs were generated as per the protocol described by Citro et al. [25] [26], with pancreatic islets embedded in the alveoli of the decellularized lung tissue. The bone was acquired through commercially available chicken legs and air-dried. The single-shot dark-field projections were retrieved from this data using Eq. 10 and reconstructed with the standard filtered-back projection algorithm. Estimates for for each sample were acquired from separate fully sampled datasets, which provided averages of and .
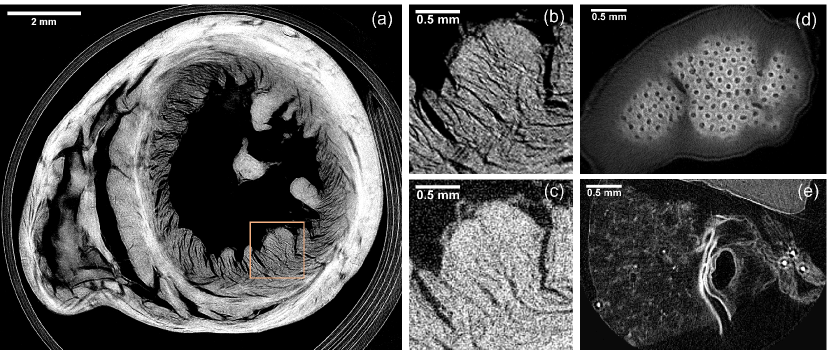
All samples were successfully reconstructed with no obvious cupping artefacts are seen from poor signal linearity (see Fig. 3). Fig. 3(a) shows an axial slice through the middle of the rat heart sample. Dark-field contrast highlights the different orientations of muscle fibre in different layers within the heart wall. The region highlighted in orange is expanded in Fig. 3(b) and the corresponding area with attenuation contrast in shown in panel (c). The single-shot dark-field tomography image (Fig. 3(b)) appears sharper and richer in detail. Further comparison between single-shot dark-field and attenuation contrast tomography for this sample is given in the Supplemental Material. The chicken bone sample is shown in Fig. 3(d), with a highlighted porous structure thanks to dark-field contrast sensitivity. The pancreatic construct is shown in Fig. 3(e) where a bright layer on the inner surface due to a strong scattering originating there. The bright spots are round-shaped pancreatic islets, and from a full illumination curve planar image, were found to show high attenuation signal. Simultaneous sensitivity to both contrast channels enables concurrent visualisation of the islet and the subtle changes in porosity throughout the decellularised scaffold. We found the tomographic images to have high signal-to-noise ratios with features visible from both contrast channels, although distinguishing the origin of the intensity (i.e. whether it comes from high attenuation or dark field) might not always be possible, it can often be estimated with some sample prior knowledge.
Conclusions
We presented a method to obtain X-ray dark-field images with a single exposure, without the need for a high spatial or temporal coherence or a high-resolution detector. We experimentally demonstrated the approach on a laboratory-based edge illumination imaging system, where the use of two absorbing masks allows sensitivity to dark-field contrast in a single shot through the removal of scattered X-rays. We derived an equation to retrieve the dark-field signal, which can be found in a single measurement on pure-phase objects. This was then extended to work with more attenuating samples, down to approximately 50% transmission. Our approach relies on a homogeneous material approximation, that enables linking the attenuation and dark-field signals within a sample and thus solving for two unknowns with only one measurement. In practice this results in an image with mixed dark-field and attenuation contrast, with features from both channels being retained. We demonstrated the methodology using edge illumination, however, with some modifications to the model, a similar approach could be applied to other dark-field imaging techniques. One key benefit is the reduction of the problem dimensionality by one, which becomes practically relevant for data-intensive applications such as tomographic imaging. We have shown results for single-shot X-ray dark-field tomography on three biological tissue samples, where the power of dark-field imaging to highlight sub-resolution features was retained with fast and dose-efficient data acquisition. We believe this is a powerful method for obtaining high-quality images whilst, at the same time, it removes the necessity of acquiring multi-dimensional datasets for the extraction of dark-field contrast.
Acknowledgements.
AO is supported by the Royal Academy of Engineering under their Chairs in Emerging Technologies scheme (CiET1819/2/78). This work was supported by the National Research Facility for Lab X-ray CT (NXCT) through EPSRC grants EP/T02593X/1 and EP/V035932/1. This work was supported by the Wellcome Trust 221367/Z/20/Z. This work was supported by EPSRC grant EP/T005408/1 and the Royal Society through IEC\R2\192116.References
- Olivo [2021] A. Olivo, Edge-illumination x-ray phase-contrast imaging, Journal of Physics: Condensed Matter 33, 363002 (2021).
- Olivo and Speller [2007] A. Olivo and R. Speller, A coded-aperture technique allowing x-ray phase contrast imaging with conventional sources, Applied Physics Letters 91 (2007).
- Zamir et al. [2016] A. Zamir, M. Endrizzi, C. K. Hagen, F. A. Vittoria, L. Urbani, P. De Coppi, and A. Olivo, Robust phase retrieval for high resolution edge illumination x-ray phase-contrast computed tomography in non-ideal environments, Scientific Reports 6, 31197 (2016).
- Munro et al. [2010] P. R. Munro, K. Ignatyev, R. D. Speller, and A. Olivo, Source size and temporal coherence requirements of coded aperture type x-ray phase contrast imaging systems., Optics Express 18, 19681 (2010).
- Doherty et al. [2020] A. Doherty, L. Massimi, A. Olivo, and M. Endrizzi, Optimal and automated mask alignment for use in edge illumination x-ray differential-phase and dark-field imaging techniques, Nuclear Instruments and Methods in Physics Research Section A: Accelerators, Spectrometers, Detectors and Associated Equipment 984, 164602 (2020).
- Langer et al. [2008] M. Langer, P. Cloetens, J.-P. Guigay, and F. Peyrin, Quantitative comparison of direct phase retrieval algorithms in in-line phase tomography, Medical Physics 35, 4556 (2008).
- Rigon et al. [2007] L. Rigon, F. Arfelli, and R.-H. Menk, Generalized diffraction enhanced imaging to retrieve absorption, refraction and scattering effects, Journal of Physics D: Applied Physics 40, 3077 (2007).
- Pfeiffer et al. [2008] F. Pfeiffer, M. Bech, O. Bunk, P. Kraft, E. F. Eikenberry, C. Brönnimann, C. Grünzweig, and C. David, Hard-x-ray dark-field imaging using a grating interferometer, Nature Materials 7, 134 (2008).
- Endrizzi et al. [2014] M. Endrizzi, P. C. Diemoz, T. P. Millard, J. Louise Jones, R. D. Speller, I. K. Robinson, and A. Olivo, Hard x-ray dark-field imaging with incoherent sample illumination, Applied Physics Letters 104, 024106 (2014).
- Vittoria et al. [2015] F. A. Vittoria, G. K. Kallon, D. Basta, P. C. Diemoz, I. K. Robinson, A. Olivo, and M. Endrizzi, Beam tracking approach for single–shot retrieval of absorption, refraction, and dark–field signals with laboratory x–ray sources, Applied Physics Letters 106, 224102 (2015).
- Kagias et al. [2016] M. Kagias, Z. Wang, P. Villanueva-Perez, K. Jefimovs, and M. Stampanoni, 2d-omnidirectional hard-x-ray scattering sensitivity in a single shot, Physical Review Letters 116, 093902 (2016).
- Zhou et al. [2018] T. Zhou, H. Wang, and K. Sawhney, Single-shot x-ray dark-field imaging with omnidirectional sensitivity using random-pattern wavefront modulator, Applied Physics Letters 113, 091102 (2018).
- Paganin et al. [2002] D. Paganin, S. C. Mayo, T. E. Gureyev, P. R. Miller, and S. W. Wilkins, Simultaneous phase and amplitude extraction from a single defocused image of a homogeneous object, Journal of microscopy 206, 33 (2002).
- Beltran et al. [2023] M. A. Beltran, D. M. Paganin, M. K. Croughan, and K. S. Morgan, Fast implicit diffusive dark-field retrieval for single-exposure, single-mask x-ray imaging, Optica 10, 422 (2023).
- Havariyoun et al. [2019] G. Havariyoun, F. A. Vittoria, C. K. Hagen, D. Basta, G. K. Kallon, M. Endrizzi, L. Massimi, P. Munro, S. Hawker, B. Smit, et al., A compact system for intraoperative specimen imaging based on edge illumination x-ray phase contrast, Physics in Medicine & Biology 64, 235005 (2019).
- Astolfo et al. [2016] A. Astolfo, M. Endrizzi, G. Kallon, T. P. Millard, F. A. Vittoria, and A. Olivo, A first investigation of accuracy, precision and sensitivity of phase-based x-ray dark-field imaging, Journal of Physics D: Applied Physics 49, 485501 (2016).
- Doherty et al. [2023] A. Doherty, S. Savvidis, C. Navarrete-León, M. F. Gerli, A. Olivo, and M. Endrizzi, Edge-illumination x-ray dark-field tomography, Physical Review Applied 19, 054042 (2023).
- Brombal et al. [2023] L. Brombal, F. Arfelli, R. H. Menk, L. Rigon, and F. Brun, Pepi lab: a flexible compact multi-modal setup for x-ray phase-contrast and spectral imaging, Scientific Reports 13, 4206 (2023).
- Diemoz et al. [2015] P. C. Diemoz, F. A. Vittoria, C. K. Hagen, M. Endrizzi, P. Coan, E. Brun, U. H. Wagner, C. Rau, I. K. Robinson, A. Bravin, et al., Single-image phase retrieval using an edge illumination x-ray phase-contrast imaging setup, Journal of Synchrotron Radiation 22, 1072 (2015).
- Endrizzi et al. [2017] M. Endrizzi, F. Vittoria, L. Rigon, D. Dreossi, F. Iacoviello, P. Shearing, and A. Olivo, X-ray phase-contrast radiography and tomography with a multiaperture analyzer, Physical Review Letters 118, 243902 (2017).
- Beltran et al. [2010] M. A. Beltran, D. Paganin, K. Uesugi, and M. J. Kitchen, 2d and 3d x-ray phase retrieval of multi-material objects using a single defocus distance, Optics Express 18, 6423 (2010).
- Burvall et al. [2011] A. Burvall, U. Lundström, P. A. Takman, D. H. Larsson, and H. M. Hertz, Phase retrieval in x-ray phase-contrast imaging suitable for tomography, Optics Express 19, 10359 (2011).
- Zamir et al. [2017] A. Zamir, P. C. Diemoz, F. A. Vittoria, C. K. Hagen, M. Endrizzi, and A. Olivo, Edge illumination x-ray phase tomography of multi-material samples using a single-image phase retrieval algorithm, Optics Express 25, 11984 (2017).
- Savvidis et al. [2022] S. Savvidis, M. F. Gerli, M. Pellegrini, L. Massimi, C. K. Hagen, M. Endrizzi, A. Atzeni, O. K. Ogunbiyi, M. Turmaine, E. S. Smith, et al., Monitoring tissue engineered constructs and protocols with laboratory-based x-ray phase contrast tomography, Acta Biomaterialia 141, 290 (2022).
- Citro et al. [2019] A. Citro, P. T. Moser, E. Dugnani, T. K. Rajab, X. Ren, D. Evangelista-Leite, J. M. Charest, A. Peloso, B. K. Podesser, F. Manenti, et al., Biofabrication of a vascularized islet organ for type 1 diabetes, Biomaterials 199, 40 (2019).
- Citro et al. [2023] A. Citro, A. Neroni, C. Pignatelli, F. Campo, M. Policardi, M. Monieri, S. Pellegrini, E. Dugnani, F. Manenti, M. C. Maffia, et al., Directed self-assembly of a xenogeneic vascularized endocrine pancreas for type 1 diabetes, Nature Communications 14, 878 (2023).