Profile Update: The Effects of Identity Disclosure on Network Connections and Language
Abstract
Our social identities determine how we interact and engage with the world surrounding us. In online settings, individuals can make these identities explicit by including them in their public biography, possibly signaling a change to what is important to them and how they should be viewed. Here, we perform the first large-scale study on Twitter that examines behavioral changes following identity signal addition on Twitter profiles. Combining social networks with NLP and quasi-experimental analyses, we discover that after disclosing an identity on their profiles, users (1) generate more tweets containing language that aligns with their identity and (2) connect more to same-identity users. We also examine whether adding an identity signal increases the number of offensive replies and find that (3) the combined effect of disclosing identity via both tweets and profiles is associated with a reduced number of offensive replies from others.
1 Introduction
Our social identities such as age, gender, or occupation play a crucial role in shaping how we express thoughts and opinions through language, and in turn, how others interact with us. In social media platforms such as Twitter, the identity that one chooses to associate oneself with can influence behaviors such as the topics one engages with or the ties one forms. One can choose to explicitly disclose their identity through various means, but the effects and consequences of such actions are largely unknown. In this paper, we perform a large-scale study to understand how explicitly disclosing social identities leads to changes in the interactions of one’s social network.
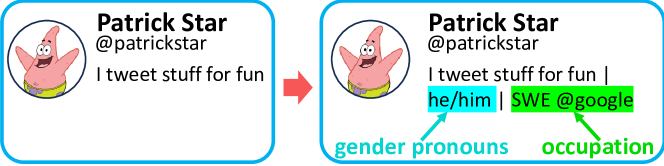
Identity disclosure and management is an essential part of online behavior (Joinson et al., 2010; Pavalanathan and De Choudhury, 2015), as individuals navigate what aspects of themselves are salient to others. In more public platforms like Twitter, individuals must weight how to present themselves based on the mix of audiences who may find them (Marwick and boyd, 2011; Bazarova and Choi, 2014; Duguay, 2016). People may explicitly express social identities in social media by including phrases related to the identity in profile descriptions, as shown in Figure 1. Profile descriptions, similar to posts, also contain rich textual features associated with the user’s social identity (Li et al., 2014; Priante et al., 2016; Wilson and Wun, 2020; Wang et al., 2019). Crucially, these profiles are not static: Individuals add and remove identity markers from their bios to emphasize new or specific aspects of themselves, such as political affiliations (Jones, 2021) or gender pronouns (Tucker and Jones, 2023; Jiang et al., 2022).
Disclosed social identities can affect how they are perceived and targeted by other users. Prior studies have drawn connections between the disclosure of identities—especially marginalized or minority identities—and identity-based hate or cyberbullying, therefore hindering people from fully expressing themselves and sometimes even forcing them to hide identities online (Haimson et al., 2015; Jhaver et al., 2018). However, not all identities are marginalized and the potential varied outcomes for identity disclosure are yet to be quantified.
To understand the effects of identity disclosure, we conduct a large-scale quasi-experimental study on hundreds of thousands of users who updated their profiles to disclose a particular social identity. We observe that while overall tweet activity levels remain stable post-disclosure, their tweets contain significantly higher volumes of identity-relevant language, which we further dissect into topic and style properties. We demonstrate that this disclosure is also associated with social network changes: users actively engage more with similar-identity individuals following disclosure. Finally, we examine the number of offensive replies received from others during pre- and post-disclosure periods, where we show that contrary to existing studies (Chan, 2022; Meyer, 2003), the addition of identity signals in profiles did not lead to increased levels of received offensiveness, even for identity categories known to be prone to targeted offensiveness such as sexual and gender minorities. Overall, our findings suggest profile-based identity disclosure is an active process signaling future behavior changes in the priorities of a user.
2 Social Identities and Self-disclosure
Prior work has examined identity disclosure from the perspectives of language, networks, and social interactions, particularly in online spaces. We build on the previous studies to formulate hypotheses that examine whether disclosure of social identities leads to changes in behaviors of both the user themself and how they are perceived by others.
2.1 Social Identities and Language
Sociolinguistics has long associated language with social identities of the speaker (Labov, 1966; Eckert, 2000; Pomerantz, 2007). Specifically, Bucholtz and Hall (2005) propose a framework for understanding identity through linguistic interaction, where they suggest that identities can be indexed through linguistic aspects such as style, stances, and labels (Schilling-Estes, 2004). This framework also posits that the display of identity through language can be an intentional form of agency to meet social goals (Duranti, 2008). From this perspective, we can assert that the intention to disclose one’s social identity can be reflected through their language, which may be indicative of the identity.
Our first hypothesis examines the relationship between identity disclosed through language and through profile updates. We hypothesize that the modification of one’s profile to disclose a particular social identity will motivate the user to tune their linguistic style to accommodate their presented identity.
H1 The addition of a social identity on a Twitter profile will lead to posting more identity-aligned tweets compared to a reference group.
2.2 Networked Effects of Identity Disclosure
People present themselves to others by controlling the amount of information available to maintain a publicly desirable image, a concept known as impression management (Goffman, 1959). This management helps achieve socially desirable goals such as maintaining reputation (Schlenker and Britt, 1999; Zivnuska et al., 2004). In social networking platforms such as Twitter or Instagram, the downstream effects of impression management can be translated into measurable outcomes such as maintaining connections with “friends” in the platform who can provide desirable effects such as social support or access to information (Lampe et al., 2007; Yan et al., 2022). We thus expect that the addition of social identity in one’s profile reflects a desire to connect with like-minded others, which results in an increased effort to forge connections with people of the same identity.
H2 The addition of a social identity on a Twitter profile will directly lead to establishing more network connections with users of the same identity compared to a reference group.
2.3 Consequences of Identity Disclosure
Identity disclosure can lead to undesirable consequences. Privacy is a major risk of disclosure in online spaces (Ampong et al., 2018). Also, the disclosure of minority or marginalized identities can lead to being targeted for online harassment. For example, nonbinary users consider disclosing their identity on social media a stressful event (Haimson et al., 2015; Haimson and Veinot, 2020).
As our final hypothesis, we test whether disclosure of one’s identity can lead to increased hostility directed at the user. Specifically, we measure if a user becomes a target of offensive content following the addition of their identity on the profile.
H3 The addition of a social identity on a Twitter profile will result in receiving more offensive replies compared to a reference group.
3 Identifying Identity Change in Profiles
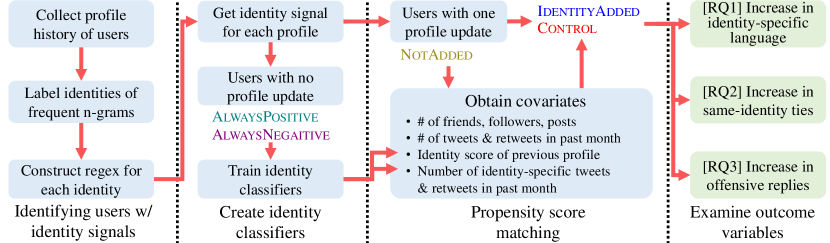
Here, we describe our pipeline for identifying instances of Twitter users disclosing social identities on their profiles. An overview of the data collection and processing is shown in Figure 2.
3.1 Identifying Twitter Profile Changes
We first identify a set of users who have added signals of their social identity to their Twitter profiles. This information is unobtainable using just the Twitter API as it only returns a user’s profile information at the time of the API call and does not provide a chronological timeline of profile changes. We instead use the Twitter Decahose dataset which contains a 10% sample of the entire Twitter activities over a period of over 12 months. We identify all activities of every user between April 2020 and April 2021. Each tweet or retweet object includes various metadata, one of which is the user’s profile description at the time of the tweet. We collect all instances of user profiles for our Twitter users and sort them in chronological order, enabling us to identify when a user changed their profile. We remove verified accounts and users whose language is set to a language other than English, resulting in 15,215,776 users and 73,048,466 unique profiles.
3.2 Categorizing Social Identities
Deciding what counts as a social identity can be challenging. Here, we start from an initial set of social categories based on two relevant studies. Priante et al. (2016) categorized social identities into five groups: personal relationships, vocations/avocations, political affiliations, ethnic/religious groups, and stigmatized groups. Meanwhile, Yoder et al. (2020) used 11 identity categories: age, ethnicity/nationality, fandoms, gender, interests, location, personality type, pronouns, relationship status, sexual orientation, and zodiac. Using this list of categories as a starting point, one author manually inspected each n-gram and assigned it to a category when applicable. The n-grams within each category were additionally grouped into subcategory levels, e.g., the gender category consists of three subcategories: men, women, and nonbinary. A total of 221 n-grams were assigned to a category and subcategory.
We also create subcategory-level identities within each category, which is the basic unit of social identity in this study. This process results in a total of ten categories (Table 1) and 44 subcategories of identities (Appendix Table 2). Further details on the subcategories are in Appendix Section A.
After categorizing n-grams into identity categories and subcategories, we follow the approach from prior work (Yoder et al., 2020; Pathak et al., 2021) and construct regular expressions for each category and subcategory based on the n-grams to improve precision. For example, when constructing regular expressions for age, we ensure that the corresponding phrases include identifiers such as ‘years old’ or ‘y/o’.
| Category | # users |
|---|---|
| Age | 12,737 |
| Education | 23,201 |
| Ethnicity | 16,507 |
| Gender pronouns | 59,893 |
| Occupation | 68,694 |
| Personal | 41,107 |
| Political | 26,609 |
| Relationship | 20,167 |
| Religion | 11,169 |
| Sexuality (LGBTQ+) | 3,772 |
| Total | 283,793 |
Next, we identify a set of users who have changed their profiles to disclose their social identity. We run our regular expressions on every unique profile to determine whether a profile is associated with a particular identity. We assign multiple labels if a user’s profile is associated with multiple identity categories (e.g. “18yo — he/him — father of two wonderful children”), but leave out profiles that our method labels as belonging to multiple subcategories within the same category when they are meant to be mutually exclusive (e.g. age - “18yo — 30y/o”, political affiliation - “devout democrat — conservative”). Based on the mapped identities per profile, we can identify all users who satisfy the following two conditions: (1) each user has made only one change in their profile during the 1 year observation period, and (2) the only change is the addition of a new social identity—i.e., the phrase indicating identity should only exist in the changed profile and not the previous version. This filtering results in a set of 283,793 users who added a single new social identity through Twitter profiles, which we refer to as IdentityAdded. Tables 1 and 2 contain category- and subcategory-level counts.
We validate the quality of our pipeline for capturing instances of identity disclosure through an annotation task. For each subcategory, three annotators are provided twenty samples which each consist of two subsequent profiles, one pre- and one post-change. The twenty samples include ten positive samples from IdentityAdded as well as ten negative samples, which vary from (1) no disclosure in either, (2) disclosure in both, and (3) disclosure only in pre-change. The resulting Krippendorff’s was 0.74, indicating a high level of agreement that the changes detected by our approach do constitute meaningful self-disclosure of identity. We then evaluate our pipeline by evaluating it on the majority vote from the annotations, from which we saw that 41/44 identities achieved an F1 score higher than 0.5 (Appendix Tables 3 and 4). We therefore removed the three identities with low performance: education:student, ethnicity:korean, and occupation:art.
3.3 Propensity Score Matching
Since our research questions center around behavioral changes following social identity disclosure through profiles, a meaningful measurement can be made by comparing against a control group that displays similar behaviors but does not disclose social identities through profile updates. We adopt propensity score matching (PSM), a quasi-experimental method widely adopted in observational studies involving observational social media data (Yuan et al., 2023; Choi et al., 2023).
Apart from the IdentityAdded users we also identify 849,901 users who (1) made one profile update during the 1-year observation period but (2) did not include any phrases of social identity in their profiles before or after the update, which we refer to as NotAdded users. For each user in IdentityAdded and NotAdded, we identify the following covariates obtained at the date of the profile change: number of days since account creation, number of friends, number of followers, number of total posts, number of tweets and retweets posted during one month prior to the time of profile update. Further details of the matching can be found in Appendix Section C.
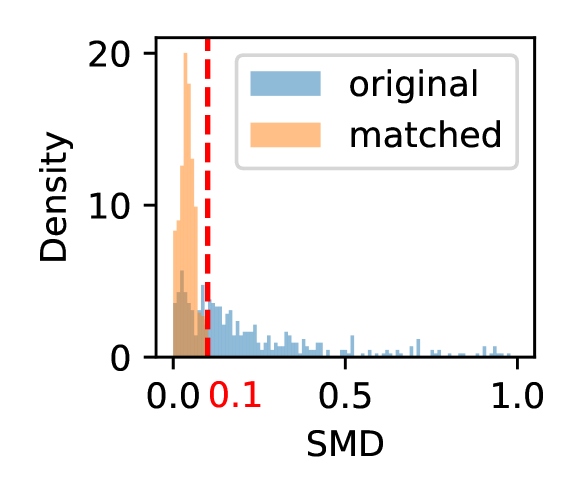
As a result of the matching process, we are left with 283,566 treated users and 1,228,945 matched users. We refer to the resulting matched set as Control users. Figure 9 in the Appendix shows that the distribution containing the standardized mean difference of every covariate reduces sharply after matching, demonstrating the diminished effect caused by confounding covariates.
3.4 Estimating Treatment Effects
Our setting of treated and control variables allows us to perform a widely used causal inference method known as difference-in-differences (DiD; Abadie, 2005). Though DiD is most commonly used when the outcome variable is a continuous variable, it can be applied to different types of outcomes such as count variables (Cameron and Trivedi, 2013; Mark et al., 2013). Accordingly, we use the following equation:
where is the outcome variable at time for user , is a binary assignment status to treatment group, and is whether time is beyond treatment period. is the time-invariant covariates of , which consist of the number of friends, followers, and total posts. All experiments are modeled as a negative binomial regression using generalized estimating equations (GEE) in statsmodels. Because our hypothesis testing are done on multiple identities, we apply the Bonferroni-Holm correction (Holm, 1979) to account for false positives when reporting significance test results from the regressions.
4 How does Identity Disclosure affect Language?
To understanding behavioral changes following identity disclosure, we first study whether users change their language following profile updates to include a social identity. We hypothesize that the addition of an identity signal provides a certain level of boost to represent their identity more through the content they produce and engage with.
Measuring Identity-specific Language
We first construct classifiers to measure the amount of identity alignment from a tweet. Based on existing findings that posts and profile descriptions in online platforms are reflective of one’s social identity (e.g., Priante et al., 2016; Preoţiuc-Pietro and Ungar, 2018), we assume that if a user has disclosed a social identity on their profile description for a sufficiently long time, then the text created by the user contains topical and stylistic features indicative of the disclosed identity. Accordingly, we first identify users who did not update their profile during our observation period, and identify cases where their profile did (AlwaysPositive) or did not (AlwaysNegative) include an identity (refer to Figure 2). We then aggregate the tweets created by each user and assign positive or negative labels to the tweets based on the user’s identity existence. Each classifier is a RoBERTa (Liu et al., 2019) model pretrained from tweets and further finetuned on the labeled tweet dataset. Further training details and examinations on classifier performances can be found in Appendix Section B.
Experiment Setting
We use the scores from the classifiers to measure levels of identity-specific language from both the content that users post (tweets) and engage with through sharing (retweets). Using the identity classifiers, we obtain scores for every tweet and retweet generated by each IdentityAdded and Control user between one month before and after the profile update. We then count the number of tweets with an inferred identity score higher than 0.5 and aggregate them into two periods, before and after the profile update. We consider these as the total number of identity-relevant tweets the user tweeted or retweeted before or after treatment. We also count the number of total tweets regardless of identity score, which captures overall activity levels. We run separate regressions with the number of total tweets/retweets and identity-specific tweets/retweets as outcome variables, and include the number of total activities as a control variable when modeling identity-specific activities.
Results
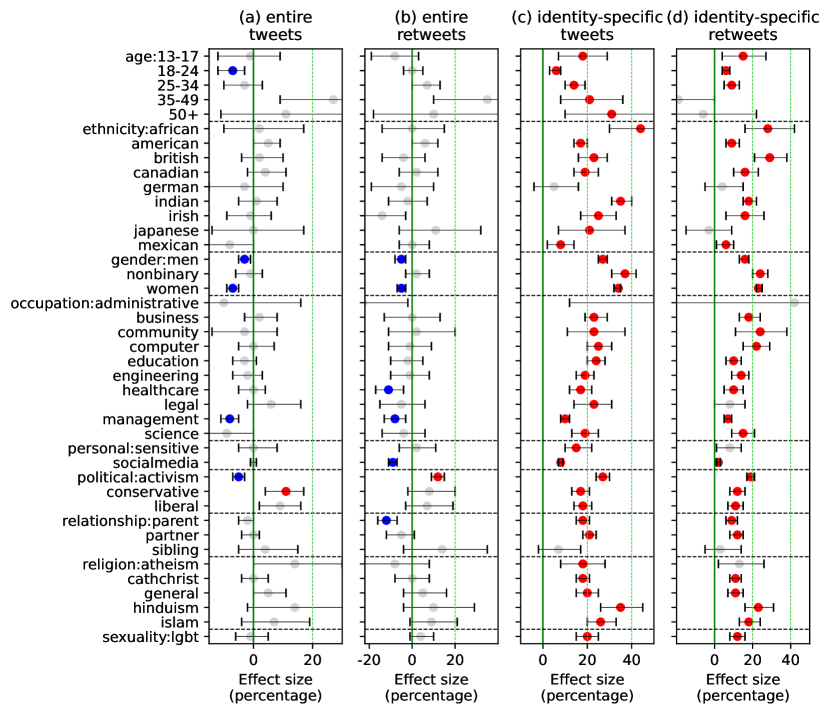
Figure 3 shows the effects of adding profiles on four different types of tweet activity counts: the number of total tweets (Figure 3(a)) and retweets (Figure 3(b)) versus identity-aligning tweets (Figure 3(c)) and retweets (Figure 3(d)). We can first observe that, contrary to prior work Lampe et al. (2007), the additional disclosure of social identity via profiles does not lead to greater overall activity levels compared to profile updates without such disclosure (Figures 3(a) and 3(b)). In fact, we observe the opposite for several types of identities, most notably drops of both tweet and retweet levels in binary gender pronouns and student status. The only statistically significant increases we observe arise from disclosing political statuses.
On the other hand, we observe statistically significant increases in the number of tweets posted and retweeted which contain identity-specific language, across almost every category (Figures 3(c) and 3(d)). Though there exists variance among categories, in general, we observe that identity-specific tweets increased by around 20-40% and identity-specific retweets increased by around 10-30%, indicating that though the content volume does not change, the percent of identity-related content within that volume increases substantially. Further comparisons within identity categories reveal interesting findings. For instance, we observe that for both tweets and retweets, the increase following identity disclosure of men is lower than that of women and nonbinary genders. One possible reason is women and nonbinary gender users may undergo harder decisions to disclose their identity, which results in a greater change in their behavior following disclosure. Similarly, our results on ethnicity disclosures show larger identity-specific activities for African identities compared to the American identity, suggesting the level of language change may differ by identity types.
Identity-specific language: topic or style?
To further understand which aspects of language change following identity disclosure, we compare the tweets through two components of language: topic and style. We examine whether having a IdentityAdded user disclose their identity results in their language becoming more similar to that of a AlwaysPositive user regarding each component. Further details for computing the distances can be found in Appendix Section D.
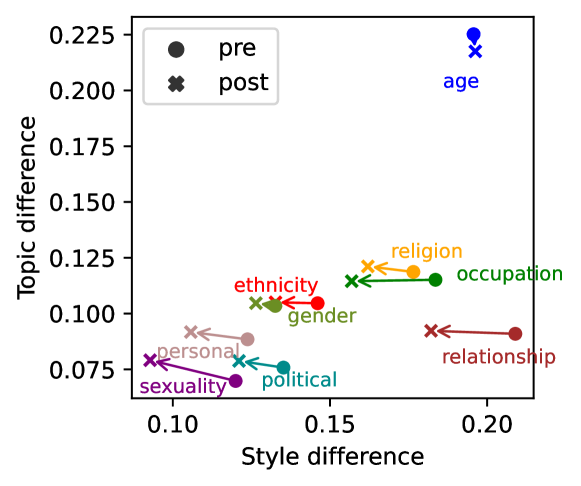
Figure 4 shows changes in the distance between the language of users who change towards disclosing their identity to those who always have had the identity visible. While topic differences remain relatively unchanged, the difference in style between the two user groups are reduced following identity disclosure for all categories apart from age. Though users do not significantly shift their topics of interest, they tune their language to appear more similar to the style associated with the identity that they choose to disclose.
5 Does identity disclosure in profiles lead to network rewiring towards same-identity connections?
In our next analysis, we investigate whether the addition of identities leads to bridging more connections with like-minded others. To do so, we collect the ego networks of every IdentityAdded and Control user where an edge between two users and is defined when replies to or retweets a tweet posted by . We divide a user’s network activities by pre- and post-treatment where we look at a timespan of 12 weeks. We use the same set of regular expressions from the profiles of all users included in the networks and extract any social identities from their profiles during the 12-week period. The subset of connected users who have adopted the same identity as the ego user at any point will be considered same-identity nodes. Thus, in our subsequent diff-in-diff analysis, the outcome variable is the number of same-identity nodes before and after the identity disclosure.
Results
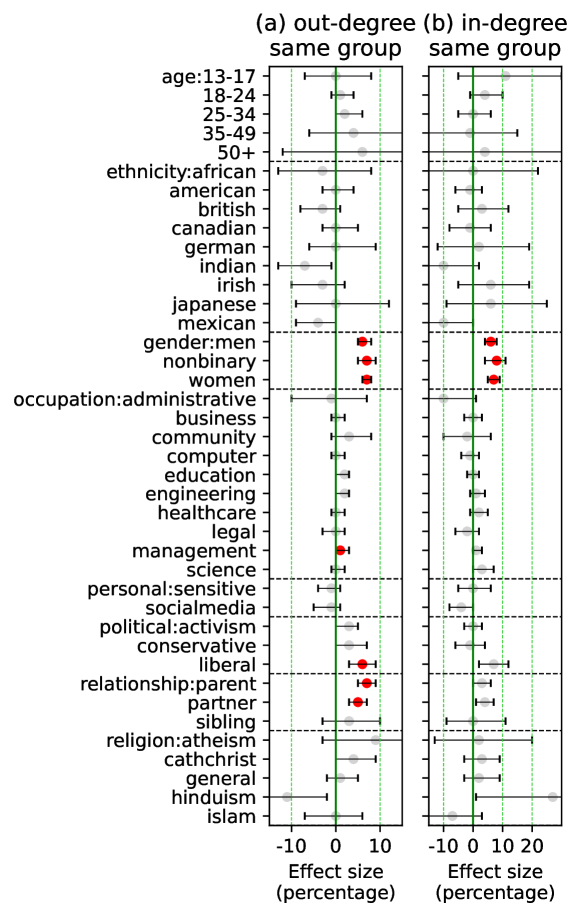
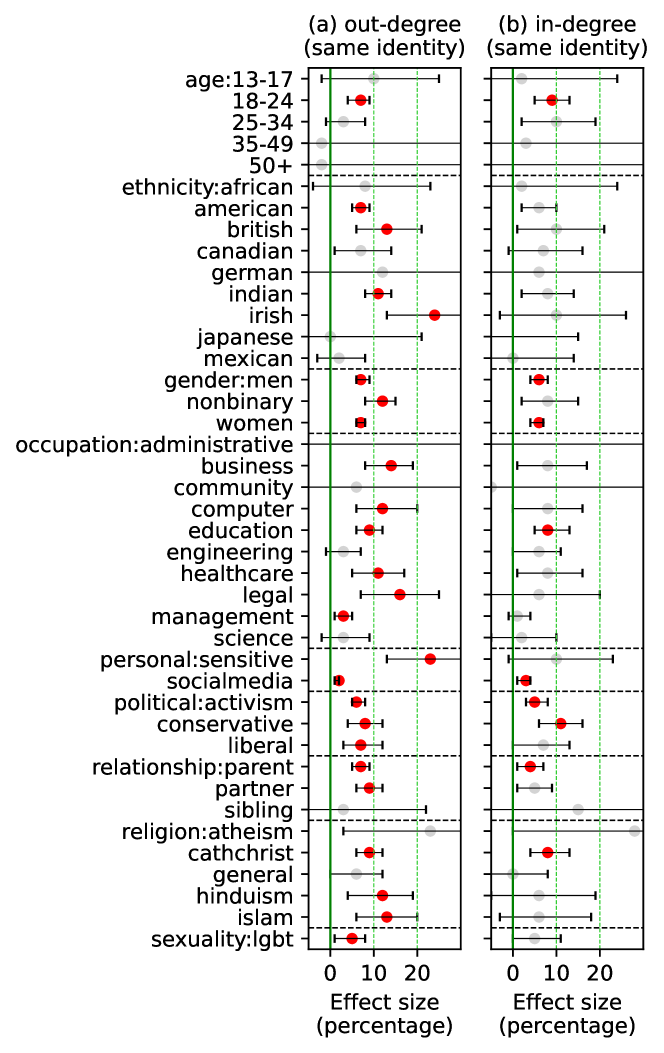
Figure 5 displays the treatment effect on the out- and in-degree of the network when restricted to users of the same identity. We can observe that across most categories, the out-degree of same-identity neighbors significantly increases after identity disclosure in profiles (Figure 5(a)). This indicates that the users who choose to disclose their identities also choose to connect to more people that share the same identity.
We next look at the in-degree level changes, which is a stronger indicator of how the addition of identity is viewed by others (Figure 5(b)). We observe that the in-degree of same-identity groups is less likely to increase compared to the out-degree, which indicates that inbound connections are less likely to be made compared to outbound connections, as the former requires others to actually be motivated to establish new connections with the user who has made a profile change.
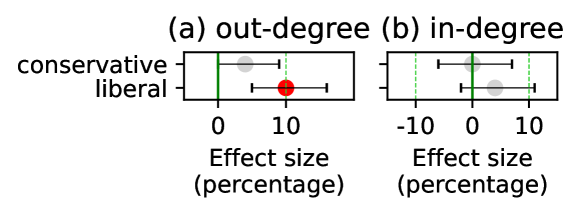
Additional results, shown in the Appendix, highlight identity-specific changes. Figure 12 contains the effect sizes of the total out- and in-degree network sizes following disclosure, revealing that the overall network size only increases for political identities. These results support our claim that users choose to strategically rewire their connections more towards those of the same identity while keeping overall network sizes stable instead of merely being more open in general. Figure 13 shows changes in connection levels towards different identities in the same category. We find that gender pronouns is the only category to increase in both in-degree and out-degree for all identities, which is in line with existing work that showed tie clustering among such pronouns (Tucker and Jones, 2023). Last of all, we compare changes in cross-partisan connections for conservative and liberal users, where we observe significant increases of outbound connections from those who disclose their liberal identity to conservative users, but not the other way round.
6 Does identity disclosure lead to receiving more offensive content?
In our final research question, we investigate possible negative consequences of disclosing one’s identity, namely whether identity disclosure leads to increased targeted offensive content.
Experiment Setting
For each IdentityAdded and Control user, we use the 10% sample dataset to collect a history of the tweets posted by the user during one month before and after the time of their profile update, as well as all replies received from other users during this period. Next, we use a publicly available classifier for detecting offensiveness from Hugging Face (Barbieri et al., 2020)111https://huggingface.co/cardiffnlp/twitter-roberta-base-offensive to obtain offensiveness scores of both the tweets posted and the replies from others. We then formulate an equation to model the expected number of offensive replies
.
The added term indicates the log-normalized number of identity-specific tweets posted by the user and is the interaction effect between identity disclosure via profile and identity-specific tweets.
Results
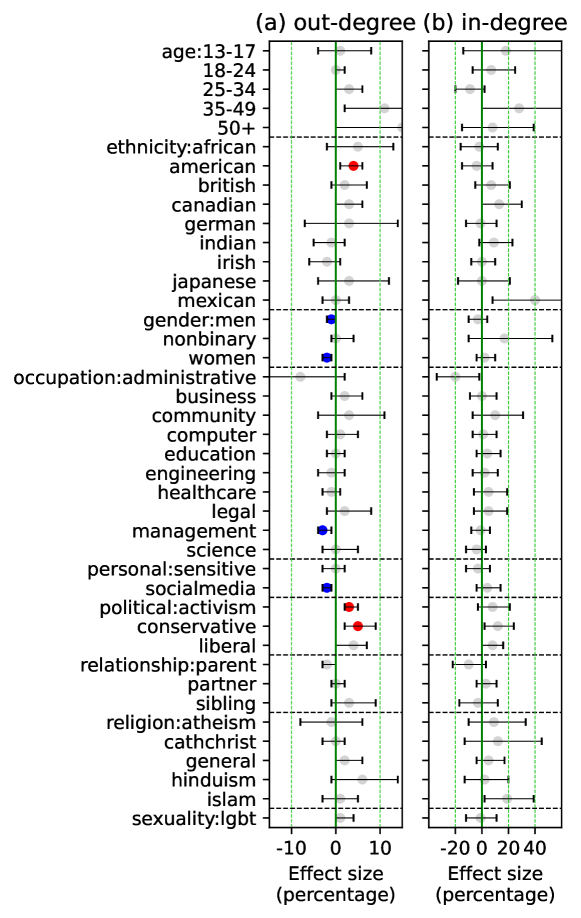
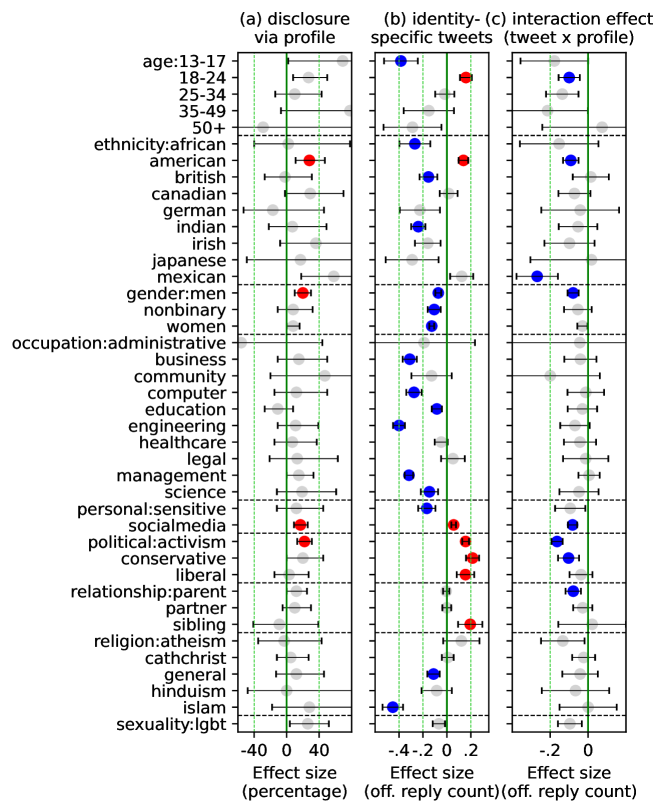
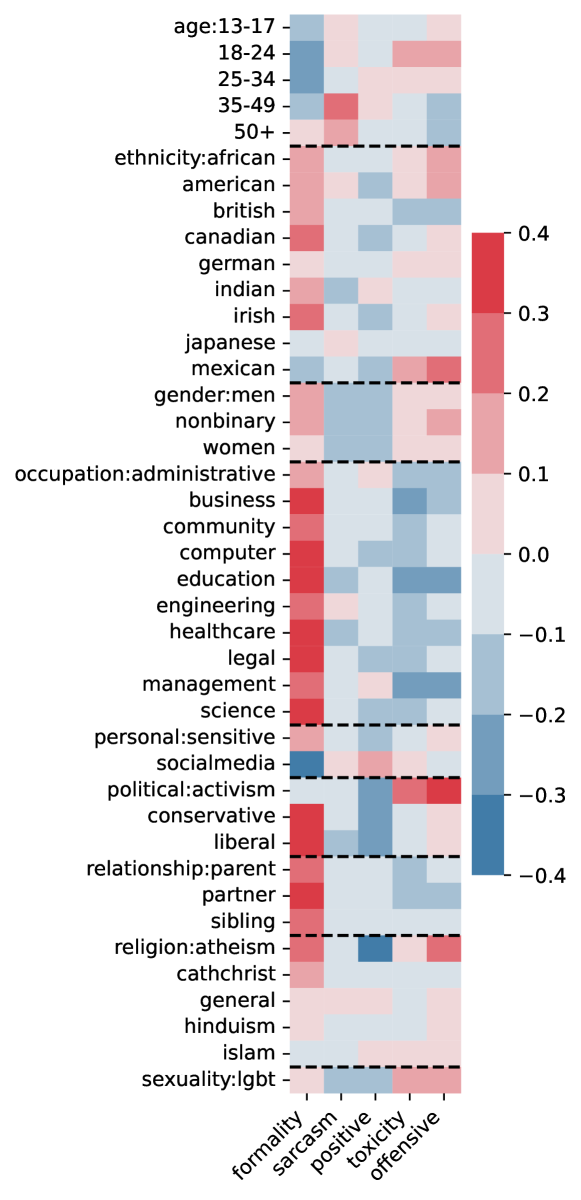
Figure 6(a) () first shows that identity disclosure through profiles increases offensiveness for only a handful of categories - ethnicity:American, gender:men, personal:socialmedia, and political:activism. However, when we observe changes in offensiveness levels caused by increased identity of tweets (Figure 6(b) ()), we can see that significant effects can be seen from several categories. Interestingly, the disclosure of identity through tweets leads to reduced levels of offensiveness from others for the three studied gender types, as well as for occupations and religion types. Meanwhile, we observe increased levels of offensive replies from all three types within the political category, hinting that this may be due to heated political conversations that often correlate with offensiveness. Lastly, the interaction effect of identity disclosure via both tweet and profile (Figure 6(c)) () suggests that the combined effect from disclosure through both channels reduces levels of offensiveness for every category where increased identity disclosure through tweets was associated with increased offensiveness. One potential explanation is that disclosing identity through both profile and tweet could create a sense of consistency, which helps reduce levels of hostility towards that identity group.
7 Discussion
Our findings indicate that disclosing social identities, regardless of category, follows similar behaviors in that both the content produced and connections made by the user become more aligned with the announced identity. We can assume that at the heart of such disclosure lies the innate desire to express oneself and find comfort among like-minded peers. It is also notable that instead of just becoming more active overall, users maintain similar levels of activity and connectivity while channeling their effort towards more identity-aligned decisions. This comes at the expense of interactions with those unassociated with the identity, and coupled with existing findings that more people are disclosing their identity on Twitter (Pathak et al., 2021; Jones, 2021), could even signal that our Twitter networks might become more homogeneous over time.
Another interesting finding regarding the effects of disclosure was that identity disclosure via profiles did not result in significant increases in offensive replies targeted to the user for marginalized categories such as nonbinary gender, LGBTQ+ sexualities or minority ethnicities. While our results do not and are not meant to deny the existence of identity-targeted hate in social media platforms that is a major source of harm, we take a more positive view suggesting that the consequences of disclosing identity through profiles may not be as severe as anticipated, and that disclosure should be promoted and more widely accepted.
8 Conclusion
We conduct a case study for identifying whether added disclosure of one’s social identity through profile updates leads to subsequent changes in linguistic style and network connections, and whether the disclosure leads to increased offensiveness from others. We propose methods for measuring identity disclosure through both profile- and tweet-level language and apply them to quasi-experimental difference-in-differences methods to show that identity disclosure through labels leads to increased disclosure in subsequent language. Furthermore, we also observe that identity disclosure can lead to increased connections with like-minded identities, which is much more prevalent from the outward versus inward ties. Finally, we observe that, contrary to existing concerns, the negative effect of increased offensiveness from disclosing a social identity via profiles does not exist for most identities, and that the combined disclosure from both profile- and tweet-levels led to reduced targeted offensiveness levels. Overall, our results suggest that the decision to disclose one’s social identity can be encouraged, with negative effects appearing less than is concerned. The code and annotated data for the study will be available at https://github.com/minjechoi/twitter_identity.
9 Limitations and Ethical Considerations
One limitation that our analysis is focuses only on Twitter. The amount of disclosure may differ by type of platform depending on why people use it (Jaidka et al., 2018; van Dijck, 2013). Identity may be visible through means other than the profile text. One example would be a profile image, which can indicate demographic features such as age, gender, and ethnicity (Yoder et al., 2020).
Identity-unaware offensiveness classifiers
To conduct the experiment on offensiveness levels after identity disclosure, we use finetuned classifiers trained on an external Twitter corpus (Barbieri et al., 2020). The black-box nature of these classifiers and datasets contain the risk of predicting text features of some identities as more offensive than others without sufficient understanding of contexts surrounding the identity, such as African-American English (Sap et al., 2019; Harris et al., 2022). In fact, our correlation results between the scores of the offensive classifier and identity-specific classifiers on a large corpus (Figure 10 in the Appendix) may lead to conclusions such as identity-specific language from nonbinary genders being more likely to be offensive than men or women, or the identity-specific language of Mexicans being the most offensive compared to other ethnicities.
Purpose of identity classifier
It is possible that one may associate the regular expression-based pipelines for identifying profile disclosures and the identity classifier models with purposes such as detecting whether a user possesses a hidden identity trait based on their prior Twitter history. We argue that our models are not served for that purpose. Rather, our categorization of users is entirely based on self-declared phrases indicative of social identities, which we examine through a meticulous verification process. Our results are driven from purely observational data aggregated at a scale of hundreds or thousands of users, which removes the possibility of identification.
Results on the disclosure of marginalized identities
One of the findings of our study is that the disclosure of social identities via profile changes did not result in increased levels of targeted offensiveness, even for marginalized identity groups such as specific gender or ethnicity groups. One possible limitation is that our study is based on users who have willingly made the decision at some point to update their profile and make their identity visible to their friends and to the public, and those who did update may have been in a situation where they felt more comfortable to disclose in the first place. This creates a selection bias that might interfere with the generalizability of our findings to the general population of Twitter users, and thus further caution should be made when estimating the reactions following disclosure in online spaces. Nevertheless, we conclude from our findings that identity disclosure through profiles can be an effective means of expressing oneself and connecting with like-minded others, and would encourage users to do so if seeking such outcomes.
References
- Abadie (2005) Alberto Abadie. 2005. Semiparametric difference-in-differences estimators. The review of economic studies, 72(1):1–19.
- Ampong et al. (2018) George Oppong Appiagyei Ampong, Aseda Mensah, Adolph Sedem Yaw Adu, John Agyekum Addae, Osaretin Kayode Omoregie, and Kwame Simpe Ofori. 2018. Examining self-disclosure on social networking sites: A flow theory and privacy perspective. Behavioral Sciences, 8(6):58.
- Barbieri et al. (2020) Francesco Barbieri, Jose Camacho-Collados, Luis Espinosa Anke, and Leonardo Neves. 2020. Tweeteval: Unified benchmark and comparative evaluation for tweet classification. In Findings of the Association for Computational Linguistics: EMNLP 2020, pages 1644–1650, Online. Association for Computational Linguistics.
- Bazarova and Choi (2014) Natalya N Bazarova and Yoon Hyung Choi. 2014. Self-disclosure in social media: Extending the functional approach to disclosure motivations and characteristics on social network sites. Journal of Communication, 64(4):635–657.
- Bianchi et al. (2021a) Federico Bianchi, Silvia Terragni, and Dirk Hovy. 2021a. Pre-training is a hot topic: Contextualized document embeddings improve topic coherence. In Proceedings of the 59th Annual Meeting of the Association for Computational Linguistics and the 11th International Joint Conference on Natural Language Processing (Volume 2: Short Papers), pages 759–766, Online. Association for Computational Linguistics.
- Bianchi et al. (2021b) Federico Bianchi, Silvia Terragni, Dirk Hovy, Debora Nozza, and Elisabetta Fersini. 2021b. Cross-lingual contextualized topic models with zero-shot learning. In Proceedings of the 16th Conference of the European Chapter of the Association for Computational Linguistics: Main Volume, pages 1676–1683, Online. Association for Computational Linguistics.
- Bucholtz and Hall (2005) Mary Bucholtz and Kira Hall. 2005. Identity and interaction: a sociocultural linguistic approach. Discourse Studies, 7(4-5):585–614.
- Cameron and Trivedi (2013) A Colin Cameron and Pravin K Trivedi. 2013. Regression analysis of count data, volume 53. Cambridge university press.
- Chan (2022) Randolph CH Chan. 2022. Gender nonconformity, peer victimization, and internalizing problems among youth: Differential moderating effects of school climate by sex assigned at birth. Psychology of violence.
- Choi et al. (2023) Minje Choi, David Jurgens, and Daniel M. Romero. 2023. Analyzing the engagement of social relationships during life event shocks in social media. Proceedings of the International AAAI Conference on Web and Social Media, 17(1):149–160.
- cjadams et al. (2019) cjadams, Daniel Borkan, inversion, Jeffrey Sorensen, Lucas Dixon, Lucy Vasserman, and nithum. 2019. Jigsaw unintended bias in toxicity classification.
- cjadams et al. (2017) cjadams, Jeffrey Sorensen, Julia Elliott, Lucas Dixon, Mark McDonald, nithum, and Will Cukierski. 2017. Toxic comment classification challenge.
- Cohen (2013) Jacob Cohen. 2013. Statistical power analysis for the behavioral sciences. Academic press.
- Deaux et al. (1995) Kay Deaux, Anne Reid, Kim Mizrahi, and Kathleen A Ethier. 1995. Parameters of social identity. Journal of personality and social psychology, 68(2):280.
- Duguay (2016) Stefanie Duguay. 2016. “he has a way gayer facebook than i do”: Investigating sexual identity disclosure and context collapse on a social networking site. New media & society, 18(6):891–907.
- Duranti (2008) Alessandro Duranti. 2008. A companion to linguistic anthropology. John Wiley & Sons.
- Eckert (2000) P. Eckert. 2000. Language Variation as Social Practice: The Linguistic Construction of Identity in Belten High. Language in Society. Wiley.
- Goffman (1959) Erving Goffman. 1959. The presentation of self in everyday life. Doubleday.
- Haimson et al. (2015) Oliver L Haimson, Jed R Brubaker, Lynn Dombrowski, and Gillian R Hayes. 2015. Disclosure, stress, and support during gender transition on facebook. In Proceedings of the 18th ACM conference on computer supported cooperative work & social computing, pages 1176–1190.
- Haimson and Veinot (2020) Oliver L Haimson and Tiffany C Veinot. 2020. Coming out to doctors, coming out to “everyone”: Understanding the average sequence of transgender identity disclosures using social media data. Transgender Health, 5(3):158–165.
- Harris et al. (2022) Camille Harris, Matan Halevy, Ayanna Howard, Amy Bruckman, and Diyi Yang. 2022. Exploring the role of grammar and word choice in bias toward african american english (aae) in hate speech classification. In 2022 ACM Conference on Fairness, Accountability, and Transparency, pages 789–798.
- Hartmann et al. (2023) Jochen Hartmann, Mark Heitmann, Christian Siebert, and Christina Schamp. 2023. More than a feeling: Accuracy and application of sentiment analysis. International Journal of Research in Marketing, 40(1):75–87.
- Holm (1979) Sture Holm. 1979. A simple sequentially rejective multiple test procedure. Scandinavian journal of statistics, pages 65–70.
- Jaidka et al. (2018) Kokil Jaidka, Sharath Guntuku, and Lyle Ungar. 2018. Facebook versus twitter: Differences in self-disclosure and trait prediction. Proceedings of the International AAAI Conference on Web and Social Media, 12(1).
- Jenks (1967) George F Jenks. 1967. The data model concept in statistical mapping. International yearbook of cartography, 7:186–190.
- Jhaver et al. (2018) Shagun Jhaver, Sucheta Ghoshal, Amy Bruckman, and Eric Gilbert. 2018. Online harassment and content moderation: The case of blocklists. ACM Transactions on Computer-Human Interaction (TOCHI), 25(2):1–33.
- Jiang et al. (2022) Julie Jiang, Emily Chen, Luca Luceri, Goran Murić, Francesco Pierri, Ho-Chun Herbert Chang, and Emilio Ferrara. 2022. What are your pronouns? examining gender pronoun usage on twitter.
- Joinson et al. (2010) Adam N Joinson, Ulf-Dietrich Reips, Tom Buchanan, and Carina B Paine Schofield. 2010. Privacy, trust, and self-disclosure online. Human–Computer Interaction, 25(1):1–24.
- Jones (2021) Jason Jeffrey Jones. 2021. A dataset for the study of identity at scale: Annual prevalence of american twitter users with specified token in their profile bio 2015–2020. PLOS ONE, 16(11):1–17.
- Kang and Hovy (2021) Dongyeop Kang and Eduard Hovy. 2021. Style is NOT a single variable: Case studies for cross-stylistic language understanding. In Proceedings of the 59th Annual Meeting of the Association for Computational Linguistics and the 11th International Joint Conference on Natural Language Processing (Volume 1: Long Papers), pages 2376–2387, Online. Association for Computational Linguistics.
- Labov (1966) William Labov. 1966. The social stratification of english in new york city.
- Lampe et al. (2007) Cliff AC Lampe, Nicole Ellison, and Charles Steinfield. 2007. A familiar face (book) profile elements as signals in an online social network. In Proceedings of the SIGCHI conference on Human factors in computing systems, pages 435–444.
- Li et al. (2014) Jiwei Li, Alan Ritter, and Eduard Hovy. 2014. Weakly supervised user profile extraction from Twitter. In Proceedings of the 52nd Annual Meeting of the Association for Computational Linguistics (Volume 1: Long Papers), pages 165–174, Baltimore, Maryland. Association for Computational Linguistics.
- Liu et al. (2019) Yinhan Liu, Myle Ott, Naman Goyal, Jingfei Du, Mandar Joshi, Danqi Chen, Omer Levy, Mike Lewis, Luke Zettlemoyer, and Veselin Stoyanov. 2019. Roberta: A robustly optimized bert pretraining approach. arXiv preprint arXiv:1907.11692.
- Mark et al. (2013) Barbara A Mark, David W Harless, Joanne Spetz, Kristin L Reiter, and George H Pink. 2013. California’s minimum nurse staffing legislation: results from a natural experiment. Health services research, 48(2pt1):435–454.
- Marwick and boyd (2011) Alice E Marwick and danah boyd. 2011. I tweet honestly, i tweet passionately: Twitter users, context collapse, and the imagined audience. New media & society, 13(1):114–133.
- Meyer (2003) Ilan H Meyer. 2003. Prejudice, social stress, and mental health in lesbian, gay, and bisexual populations: conceptual issues and research evidence. Psychological bulletin, 129(5):674.
- Misra and Arora (2023) Rishabh Misra and Prahal Arora. 2023. Sarcasm detection using news headlines dataset. AI Open, 4:13–18.
- Pathak et al. (2021) Arjunil Pathak, Navid Madani, and Kenneth Joseph. 2021. A method to analyze multiple social identities in twitter bios. Proceedings of the ACM on Human-Computer Interaction, 5(CSCW2):1–35.
- Pavalanathan and De Choudhury (2015) Umashanthi Pavalanathan and Munmun De Choudhury. 2015. Identity management and mental health discourse in social media. In Proceedings of the 24th international conference on world wide web, pages 315–321.
- Pavlick and Tetreault (2016) Ellie Pavlick and Joel Tetreault. 2016. An empirical analysis of formality in online communication. Transactions of the Association for Computational Linguistics, 4:61–74.
- Pomerantz (2007) Anne Pomerantz. 2007. Language and social identity. Journal of Linguistic Anthropology, 17(1):146–148.
- Preoţiuc-Pietro and Ungar (2018) Daniel Preoţiuc-Pietro and Lyle Ungar. 2018. User-level race and ethnicity predictors from Twitter text. In Proceedings of the 27th International Conference on Computational Linguistics, pages 1534–1545, Santa Fe, New Mexico, USA. Association for Computational Linguistics.
- Priante et al. (2016) Anna Priante, Djoerd Hiemstra, Tijs Van Den Broek, Aaqib Saeed, Michel Ehrenhard, and Ariana Need. 2016. # whoami in 160 characters? classifying social identities based on twitter profile descriptions. In Proceedings of the first workshop on NLP and computational social science, pages 55–65.
- Rao and Tetreault (2018) Sudha Rao and Joel Tetreault. 2018. Dear sir or madam, may I introduce the GYAFC dataset: Corpus, benchmarks and metrics for formality style transfer. In Proceedings of the 2018 Conference of the North American Chapter of the Association for Computational Linguistics: Human Language Technologies, Volume 1 (Long Papers), pages 129–140, New Orleans, Louisiana. Association for Computational Linguistics.
- Sap et al. (2019) Maarten Sap, Dallas Card, Saadia Gabriel, Yejin Choi, and Noah A Smith. 2019. The risk of racial bias in hate speech detection. In Proceedings of the 57th annual meeting of the association for computational linguistics, pages 1668–1678.
- Schilling-Estes (2004) Natalie Schilling-Estes. 2004. Constructing ethnicity in interaction. Journal of Sociolinguistics, 8(2):163–195.
- Schlenker and Britt (1999) Barry R Schlenker and Thomas W Britt. 1999. Beneficial impression management: Strategically controlling information to help friends. Journal of Personality and Social Psychology, 76(4):559.
- Tucker and Jones (2023) Liam Tucker and Jason Jones. 2023. Pronoun lists in profile bios display increased prevalence, systematic co-presence with other keywords and network tie clustering among us twitter users 2015-2022. Journal of Quantitative Description: Digital Media, 3.
- van Dijck (2013) José van Dijck. 2013. ‘you have one identity’: performing the self on facebook and linkedin. Media, Culture & Society, 35(2):199–215.
- Wang et al. (2019) Zijian Wang, Scott Hale, David Ifeoluwa Adelani, Przemyslaw Grabowicz, Timo Hartman, Fabian Flöck, and David Jurgens. 2019. Demographic inference and representative population estimates from multilingual social media data. In The World Wide Web Conference, WWW ’19, page 2056–2067, New York, NY, USA. Association for Computing Machinery.
- Wilson and Wun (2020) Lili-Michal Wilson and Christopher Wun. 2020. Automatic classification of students on Twitter using simple profile information. In Proceedings of the 1st Conference of the Asia-Pacific Chapter of the Association for Computational Linguistics and the 10th International Joint Conference on Natural Language Processing: Student Research Workshop, pages 30–36, Suzhou, China. Association for Computational Linguistics.
- Yan et al. (2022) Shen Yan, Kristen M. Altenburger, Yi-Chia Wang, and Justin Cheng. 2022. What does perception bias on social networks tell us about friend count satisfaction? In Proceedings of the ACM Web Conference 2022, WWW ’22, page 2687–2695, New York, NY, USA. Association for Computing Machinery.
- Yoder et al. (2020) Michael Miller Yoder, Qinlan Shen, Yansen Wang, Alex Coda, Yunseok Jang, Yale Song, Kapil Thadani, and Carolyn P. Rosé. 2020. Phans, stans and cishets: Self-presentation effects on content propagation in tumblr. In 12th ACM Conference on Web Science, WebSci ’20, page 39–48, New York, NY, USA. Association for Computing Machinery.
- Yuan et al. (2023) Yunhao Yuan, Koustuv Saha, Barbara Keller, Erkki Tapio Isometsä, and Talayeh Aledavood. 2023. Mental health coping stories on social media: A causal-inference study of papageno effect. In Proceedings of the ACM Web Conference 2023, WWW ’23, page 2677–2685, New York, NY, USA. Association for Computing Machinery.
- Zivnuska et al. (2004) Suzanne Zivnuska, K. Michele Kacmar, L. A. Witt, Dawn S. Carlson, and Virginia K. Bratton. 2004. Interactive effects of impression management and organizational politics on job performance. Journal of Organizational Behavior, 25(5):627–640.
| Category | Subcategory | # users |
| Age | 13-17 | 871 |
| 18-24 | 8,872 | |
| 25-34 | 2,449 | |
| 35-49 | 381 | |
| 50+ | 164 | |
| Education | Student | 23,201 |
| Ethnicity | African | 575 |
| American | 5,397 | |
| British | 1,487 | |
| Canadian | 2,050 | |
| German | 636 | |
| Indian | 3,045 | |
| Irish | 1,023 | |
| Japanese | 349 | |
| Korean | 259 | |
| Mexican | 1,686 | |
| Gender pronouns | Men | 19,115 |
| Women | 36,708 | |
| Non-binary | 4,070 | |
| Occupation | Administrative | 160 |
| Art | 28,746 | |
| Business | 3,284 | |
| Community | 635 | |
| Computer | 3,031 | |
| Education | 6,556 | |
| Engineering | 4,765 | |
| Healthcare | 4,109 | |
| Legal | 1,117 | |
| Management | 13,646 | |
| Science | 2,645 | |
| Personal | Social Media | 39,310 |
| Sensitive | 1,797 | |
| Political | Conservative | 2,059 |
| Liberal | 2,347 | |
| Activism | 22,203 | |
| Relationship | Partner | 6,966 |
| Parent | 12,233 | |
| Sibling | 968 | |
| Religion | Catholic / Christian | 5,954 |
| Islam | 1,255 | |
| Hinduism | 544 | |
| Atheism | 387 | |
| General | 3,029 | |
| Sexuality | LGBTQ+ | 3,772 |
| Total | 283,793 |
Appendix A Details on Category- and Subcategory-level Identity Categorization
We start from an initial set of social categories based on two relevant studies. Priante et al. (2016) categorize social identities into five groups based on the findings of Deaux et al. (1995): personal relationships, vocations/avocations, political affiliations, ethnic/religious groups, and stigmatized groups. Meanwhile, Yoder et al. (2020) constructed identity categories based on Bucholtz and Hall (2005): age, ethnicity/nationality, fandoms, gender, interests, location, personality type, pronouns, relationship status, sexual orientation, and zodiac. Using this list of categories as a starting point, one of the authors manually inspected each n-gram and assigned it to a category when applicable. Furthermore, the n-grams within each category were additionally grouped into subcategory levels. For instance, the gender category consists of three subcategories: men, women, and nonbinary. A total of 221 n-grams were assigned to a category and subcategory. A list of the categories and subcategories can be found in Table 2. Descriptions of the final categories are as follows:
-
•
Age This category contains the disclosed age of the user. We grouped age into five bins to represent teenagers (13-17), college students (18-24), young adults at early stages of their careers (24-35), adults at the age of parenthood and advanced careers (35-49), and senior adults (50+). We aknowledge different categorizations of age could be used in this study, such as that of Wang et al. (2019).
-
•
Education We constructed a single-identity category Education to collect instances of students disclosing their education status, such as degree name, current university, or school year.
-
•
Ethnicity This category contains the self-declared ethnicity of the user. We included words or phrases describing the user’s ethnicity as well as nationality flag emojis which can be used to describe one’s nationality. Our subcategories are limited to countries where there was at least one corresponding n-gram.
-
•
Gender pronouns Following the work of Jiang et al. (2022), we use three subcategories of gender pronouns: men, women, and nonbinary.
-
•
Occupation Occupation categories were obtained from the International Standard Classifications of Occupations (ISCO-08) list, where we selected all sub-major group categories which corresponded to any of the top n-grams we examined.
-
•
Political This category corresponds to the disclosed political leaning of the user. Along with subcategories for conservative and liberal, we include another category related to activism, which in this case corresponds to phrases related to the Black Lives Matter movement.
-
•
Relationship Based on the frequent n-grams, we identify three types of family relationship types mentioned in profiles: partner, parent, and sibling.
-
•
Religion We identify n-grams containing religious terms, and create subcategories for each different religion that was mentioned. For Christianity and Catholism we discover that it is difficult to split out the two and thus combine them into a single category. Finally, n-grams genuinely mentioning ‘God’ are mapped to the General subcategory
-
•
Sexuality We identified n-grams corresponding to LGBTQ+ identities and map them into a single subcategory. We remove phrases that signal only indirect membership (e.g. LGBT-ally)
-
•
Personal We define a category for two additional types of self-disclosure. One is the disclosure of additional social media accounts, and the other is that of stigmatized identities such as joblessness, health issues, and trauma.
| Category | F1 score |
|---|---|
| Age | 0.81 |
| Education | 0.46 |
| Ethnicity | 0.78 |
| Gender pronouns | 0.98 |
| Occupation | 0.76 |
| Personal | 0.71 |
| Political | 0.85 |
| Relationship | 0.82 |
| Religion | 0.86 |
| Sexuality (LGBTQ+) | 0.82 |
| Category | Identity | Kripp. | F1 score |
|---|---|---|---|
| Age | 13-17 | 0.68 | 0.67 |
| Age | 18-24 | 0.71 | 0.82 |
| Age | 25-34 | 0.87 | 0.95 |
| Age | 35-49 | 0.79 | 0.78 |
| Age | 50+ | 0.85 | 0.82 |
| Education | student | 0.17 | 0.46 |
| Ethnicity | African | 1.0 | 0.57 |
| Ethnicity | American | 0.57 | 0.75 |
| Ethnicity | British | 0.81 | 1.0 |
| Ethnicity | Canadian | 1.0 | 0.89 |
| Ethnicity | German | 0.53 | 0.89 |
| Ethnicity | Indian | 0.83 | 1.0 |
| Ethnicity | Irish | 0.65 | 0.75 |
| Ethnicity | Japanese | 0.36 | 0.57 |
| Ethnicity | Korean | -0.02 | 0.0 |
| Ethnicity | Mexican | 0.67 | 0.89 |
| Gender | men | 0.93 | 1.0 |
| Gender | nonbinary | 0.73 | 0.95 |
| Gender | women | 0.87 | 1.0 |
| Occupation | administrative | 0.73 | 0.89 |
| Occupation | art | 0.41 | 0.31 |
| Occupation | business | 0.66 | 0.75 |
| Occupation | community | 0.55 | 0.82 |
| Occupation | computer | 1.0 | 0.75 |
| Occupation | education | 0.55 | 0.82 |
| Occupation | engineering | 0.72 | 0.95 |
| Occupation | healthcare | 0.71 | 0.82 |
| Occupation | legal | 0.62 | 0.75 |
| Occupation | management | 0.84 | 0.75 |
| Occupation | science | 0.8 | 0.57 |
| Personal | sensitive | 0.61 | 0.82 |
| Personal | social media | 0.21 | 0.57 |
| Political | activism | 0.51 | 0.95 |
| Political | conservative | 0.93 | 0.82 |
| Political | liberal | 0.58 | 0.75 |
| Relationship | parent | 0.84 | 0.75 |
| Relationship | partner | 0.93 | 0.95 |
| Relationship | sibling | 0.78 | 0.75 |
| Religion | atheism | 0.8 | 1.0 |
| Religion | Catholic / Christian | 0.45 | 0.67 |
| Religion | general | 0.8 | 0.95 |
| Religion | Hinduism | 0.93 | 0.89 |
| Religion | Islam | 0.85 | 0.75 |
| Sexuality | LGBTQ+ | 0.78 | 0.82 |
Appendix B Identifying Identity-specific Language on Twitter
Our analyses require models to quantify language that aligns with a particular social identity. We aim to achieve this by formulating classification tasks to distinguish the language patterns between two types of users.
B.1 Experiment setting
For each identity subcategory, we define AlwaysPositive users as those who (1) did not make any changes to their profiles during our observation period, and (2) contained phrases of a specific identity type in their profile. Similarly, we define AlwaysNegative users as those who (1) did not make any changes, and (2) did not include any identity-specific phrases in their profile. Here we assume that the tweets posted by a user with an identity-specific phrase in their profile are more likely to align with the listed identity, and so use the labels of the user as proxies for the tweets. However, it would be unrealistic to assume that all tweets contain such alignment. Therefore, for each user, we assign positive/negative labels at corpus level instead of the individual tweet-level, where each sample consists of a corpus of five randomly sampled tweets posted by a user. We restrict our tweets to those that have user-generated text other than URLs, which we replace with a [URL] token. To distinguish the different texts, a </s> separation token is inserted between each tweet.
For each identity subcategory, we sample up to 50K positive and 50K negative users, which we split into train/test/validation sets on an 8:1:1 ratio with balanced positive/negative samples. For identity classes with insufficient positive samples, we allow each user to be represented in up to ten different samples provided they have enough unique tweets. We allow for upsampling on identities with small sample sizes on the training set. We finetune each identity separately using a RoBERTa model pretrained on a Twitter corpus (Barbieri et al., 2020) provided via the Hugging Face API. The training is done on Pytorch 1.13 and Pytorch Lightning 1.8.6 on an NVidia A5000 machine. We use a learning rate of 1e-6 after 100 initial warmup steps followed by linear decay and run for a maximum of 10 epochs where we stop if the validation performance measured in AUC does not increase after two consecutive epochs.
B.2 Model performances
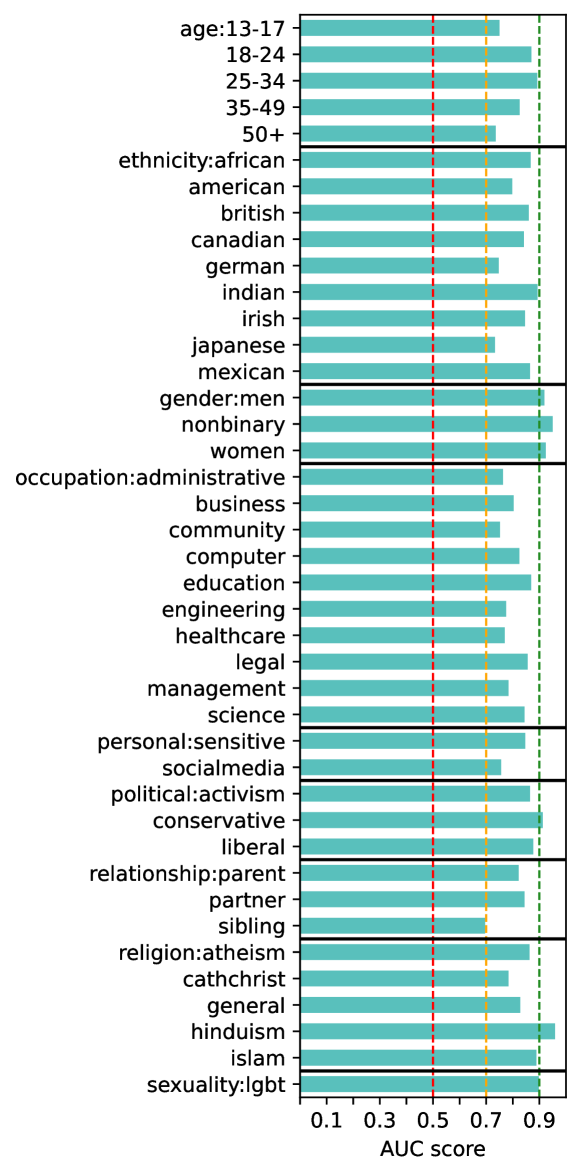
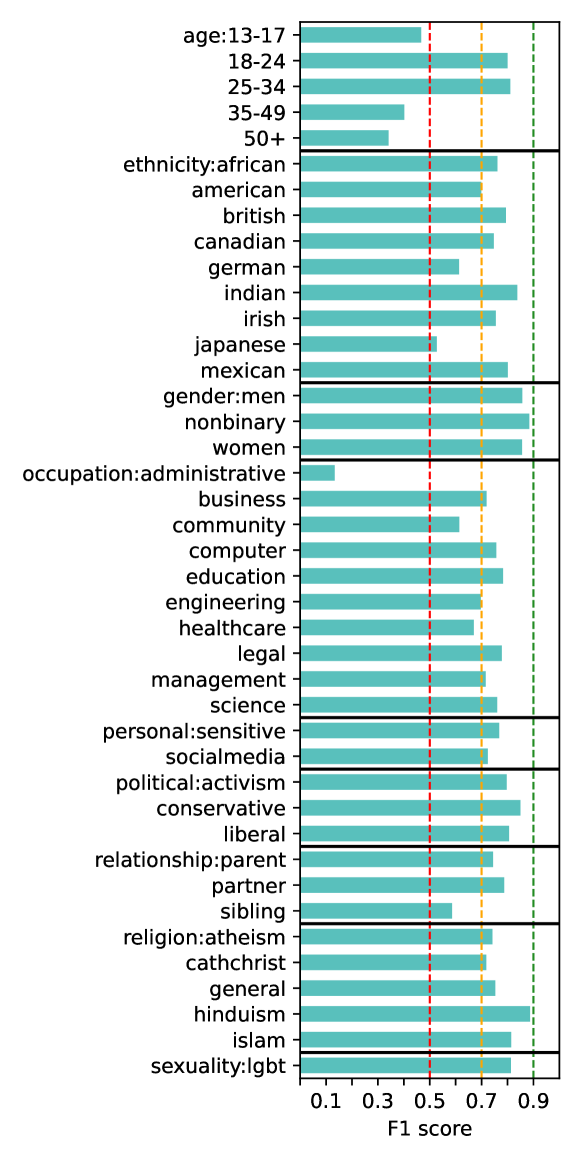
We evaluate the performances of all models using two metrics: AUC and F1 score. AUC scores are generally high, with all models exceeding a performance of 0.7 (Figure 7). This indicates that the models are doing a good job at assigning higher scores to tweets that contain more signals of identity and vice versa. F1 scores are lower in general, with a few identities such as age:35-49 and occupation:administrative performing worse than random 8. The results from these two figures combined together indicate that while the model sometimes struggles predicting the correct label (positive/negative) for some identities, overall it does a decent job in producing continuous scores which we can use for measuring strong and weak associations of certain identities from texts. Therefore, we proceed with using all of the classifiers for subsequent experiments.
B.3 Cross-identity similarities in language
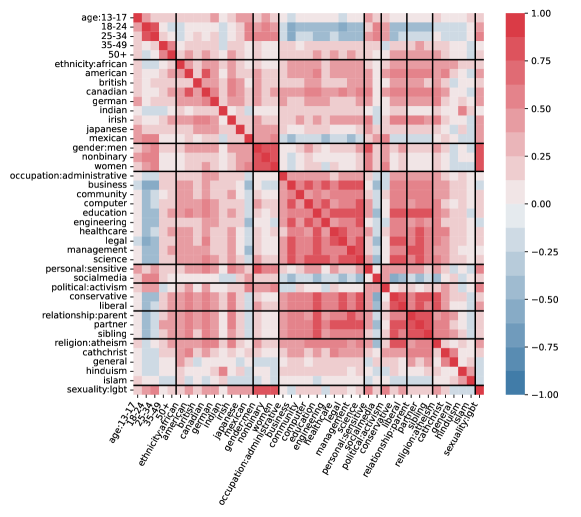
We compare the pairwise similarities between the identity-specific languages across different identities. We first sample a large corpus of one million random tweets from the history of tweets by AlwaysNegative users, so that we avoid biasing our tweets towards any particular identity. Next, we obtain the identity scores for each identity by running every classifier on the same corpus. We compute Spearman rank pairwise similarity between all identity pairs. Figure 11 contains the pairwise scores for all pairs. We can observe stronger similarity scores for within-category comparisons. This suggests that the language of users who disclose identity have some level of similarity regardless of identity type.
Appendix C Further details on propensity score matching
For each separate identity within the subcategory level, we use all covariates to train a logistic regression model using scikit-learn, which we use for assigning propensity scores to each sample. We stratify the scores into strata where equals the root number of positive samples. We use the Fisher Jenks natural break algorithm (Jenks, 1967) to obtain the strata bins, which we use for binning both IdentityAdded and NotAdded users according to propensity scores. Within each strata, we assign matched pairs for each IdentityAdded user from the pool of NotAdded users with the following steps. We first limit to NotAdded users who changed their profiles in the same week as the IdentityAdded user. Next, we computed the Euclidean distance between the z-score normalized covariates to select up to 5 users with the shortest distance to the IdentityAdded user.
Appendix D Measuring topic and stylistic distances between IdentityAdded and AlwaysPositive users
To measure topic distributions, for each identity we run zero-shot contextualized topic models (Bianchi et al., 2021a, b) on the tweets of AlwaysPositive users with 50 topics for 20 epochs, then obtain a 50-dimensional distribution which represents their topics . We then infer the topic distributions of the pre- and post-treatment tweets from IdentityAdded as and , which we use to measure the Jensen-Shannon distances of each distribution to . For style, we select five style variables from Kang and Hovy (2021) as well as classifier models from the Hugging Face API trained on public datasets: offensiveness (Barbieri et al., 2020), formality (Rao and Tetreault, 2018; Pavlick and Tetreault, 2016), sarcasm (Misra and Arora, 2023), toxicity (cjadams et al., 2017, 2019), and positive sentiment (Hartmann et al., 2023). For each identity, we computed the binary style scores for every tweet of the AlwaysPositive users to obtain a dimension matrix of style scores with as the number of tweets. We fitted PCA on the matrix to obtain the projection of its principal component, , which we use to represent the stylistic distribution of AlwaysPositive users. Likewise, we obtained the same matrices for tweets from pre- and post-treatment periods of IdentityAdded users, and transformed these matrices into a single dimension using the principal component from fitted PCA of AlwaysPositive, resulting in and . We then used cohen’s d (Cohen, 2013) to compute the difference between each of the style distributions to .