The Lyman Continuum Escape Fraction of Star-forming Galaxies at from \uvc
Abstract
The UltraViolet Imaging of the Cosmic Assembly Near-infrared Deep Extragalactic Legacy Survey Fields (\uvc) survey is a Hubble Space Telescope (HST) Cycle-26 Treasury Program, allocated in total 164 orbits of primary Wide-Field Camera 3 (WFC3) Ultraviolet and VISible light (UVIS) F275W imaging with coordinated parallel Advanced Camera for Surveys (ACS) F435W imaging, on four of the five premier extragalactic survey fields: GOODS-N, GOODS-S, EGS, and COSMOS. We introduce this survey by presenting a thorough search for galaxies at that leak significant Lyman continuum (LyC) radiation, as well as a stringent constraint on the LyC escape fraction (\fesc) from stacking the UV images of a population of star-forming galaxies with secure redshifts. Our extensive search for LyC emission and stacking analysis benefit from the catalogs of high-quality spectroscopic redshifts compiled from archival ground-based data and HST slitless spectroscopy, carefully vetted by dedicated visual inspection efforts. We report a sample of five galaxies as individual LyC leaker candidates, showing estimated using detailed Monte Carlo (MC) analysis of intergalactic medium (IGM) attenuation. We develop a robust stacking method to apply to five samples of in total 85 non-detection galaxies in the redshift range of . Most stacks give tight 2- upper limits below . A stack for a subset of 32 emission-line galaxies shows tentative LyC leakage detected at 2.9-, indicating at , supporting the key role of such galaxies in contributing to the cosmic reionization and maintaining the UV ionization background. These new F275W and F435W imaging mosaics from \uvchave been made publicly available on the Barbara A. Mikulski Archive for Space Telescopes (MAST).
1 Introduction
Cosmic reionization is the last major phase transition of the Universe when its bulk properties are altered by galaxies (see e.g., Fan et al., 2006; Stark, 2016). There has been increasing evidence that young massive stars collectively dominate over supermassive black holes in the early Universe in producing the LyC photons (with rest-frame wavelength <912Å) that reionize the neutral IGM at 6-9 (Dayal et al., 2020). However the exact fraction of these LyC photons that evade photoelectric and dust absorption from their origin galaxy and escape into the IGM to ionize it — \fesc— remains elusive and controversial (Finkelstein et al., 2019; Naidu et al., 2020), making \fescone of the greatest unknowns in reionization studies. Furthermore, the intervening IGM transmission drops precipitously at , due to the steeply rising IGM opacity, (Inoue et al., 2014). As a result, it is basically impractical to directly measure any LyC leakage in the epoch of reionization (EoR).
A more feasible way forward is thus to find low-redshift galaxies that are analogous to those 13 Gyrs ago, which are thought to drive the reionization process. The constraints and measurements of their LyC \fescand its correlation with their physical properties can help shed light upon the detailed physical mechanism conducive to the escape of the ionizing radiation into the IGM, surviving the absorption by the intervening Hi gas and dust in the interstellar medium (ISM) or circumgalactic medium (CGM) (Steidel et al., 2018).
Due to the intrinsic faintness of LyC flux, the searches for LyC leakage at any cosmological distances have been very challenging. Generally speaking, currently available ultraviolet (UV) instrumentation leads to fruitful detection of LyC leakage at primarily two redshift windows. One is at , where LyC can be captured by the space-based far-UV spectroscopy (see e.g., Leitherer et al., 1995; Bergvall et al., 2006; Borthakur et al., 2014; Izotov et al., 2016, 2018). The recent HST Cosmic Origin Spectrograph (COS) campaigns have led to the detection of LyC signals in several dozen targets at , which are usually compact isolated galaxies with high ionization and extreme star formation, a.k.a. Green Peas (GPs) (see e.g., Izotov et al., 2021; Flury et al., 2022). Yet the complex selection function and dissimilar environments of these GPs make it difficult to generalize these findings to the EoR (Naidu et al., 2021).
The other major redshift range, much closer to the EoR in time, is at 2-3 where LyC flux is accessible to ground-based blue-sensitive instruments (see e.g., Marchi et al., 2018; Steidel et al., 2018; Pahl et al., 2021; Saxena et al., 2021) or HST WFC3 UVIS imaging (see e.g., Vanzella et al., 2016; Bian et al., 2017; Naidu et al., 2017; Fletcher et al., 2019; Rivera-Thorsen et al., 2019; Yuan et al., 2021; Prichard et al., 2022). These studies are progressively reaching a consensus in support of an intriguing bimodality of \fesc.
On one hand, there exists a population of sources with super- UV luminosities that leak surprisingly large amount of ionizing radiation with , e.g., Ion1 at (Vanzella et al., 2012; Ji et al., 2020), Ion2 at (Barros et al., 2016; Vanzella et al., 2016), Ion3 at (Vanzella et al., 2018), the Sunburst arc at (Rivera-Thorsen et al., 2019), Q1549-C25 at (Shapley et al., 2016), etc.. On the other hand, there are far more galaxies on which only upper limits can be derived, despite deep imaging and spectroscopy (tens of hours of integration on a 8/10-m diameter ground-based telescope or HST) (Malkan et al., 2003; Siana et al., 2007, 2010, 2015; Vasei et al., 2016; Alavi et al., 2020). Stacking these non-detections produces population-averaged \fescwith tight upper limits of 5-10% for 0.5 galaxies at (Rutkowski et al., 2017; Steidel et al., 2018; Begley et al., 2022).
At face value, this tight upper limit does not bode well for the completion of reionization by , which requires \fesc10-20% under the canonical reionization picture (Robertson et al., 2013, 2015). This crisis can be largely alleviated though, if one or several of the following conditions are met. 1) Galaxies produce and leak ionzing photons more efficiently at higher redshifts and lower stellar mass (Finkelstein et al., 2019). 2) Reionization is instead driven by a much rarer class of massive, bright galaxies ( and ) with much higher \fescand ionizing photon production efficiency (the oligarch scenario, Naidu et al., 2020, 2021). 3) The completion of reionization is delayed to redshift of (Kulkarni et al., 2019). Furthermore, \fescis closely tied to other galaxy properties (stellar mass, star formation rate, stellar initial mass function, metallicity, etc.), while the overall emissivity caused by the entire galaxy population also depends on the shape and cutoff of the luminosity function.
The Ultraviolet Imaging of the Cosmic Assembly Near-infrared Deep Extragalactic Legacy Survey Fields (\uvc) survey is a HST Cycle-26 Treasury Program (HST-GO-15647, PI: Teplitz), awarded a sum of 164 orbits of primary Wide Field Camera 3 (WFC3) UVIS/F275W imaging with coordinated parallel Advanced Camera for Survey (ACS) F435W imaging, on four of the five premier extragalactic survey fields: GOODS-N, GOODS-S, EGS, and COSMOS. The \uvcdataset is unique in further testing the LyC leakage bimodality mentioned above, since it is the uniform UV dataset surveying the largest area with UVIS, amounting to 426 arcmin2, with extensive spectroscopic redshift measurements. The UV images across the entire fields, reaching a 5- sensitivity of magF275W=27 for compact sources, are taken at Hubble’s angular resolution. This is critical, since a key necessity in LyC searches is to confirm the origin of these faint signals with high spatial resolution imaging/spectroscopy, in order to exclude the possibility of foreground contamination from low- interlopers along the line of sight (see e.g., Steidel et al., 2001; Iwata et al., 2009; Vanzella et al., 2010, 2012; Nestor et al., 2011, 2013; Mostardi et al., 2013).
This paper is organized as follows. In Sect. 2, we first present a comprehensive overview of the key science drivers of the \uvcTreasury Program. In Sect. 3, we present the observing strategy and data reduction details. We then explain the selection of our galaxy sample with spectroscopic redshifts in Sect. 4. In Sect. 5, we describe our image stacking techniques and show the results. The inference of the LyC \fescis given in Sect. 6. Finally, we conclude in Sect. 7. Throughout this paper, the standard AB magnitude system is used (Oke & Gunn, 1983).
2 Science overview of \uvc
provides extensive UVIS imaging in four of the five premier HST deep-wide survey fields: GOODS-N, GOODS-S, EGS, and COSMOS, targeted by the Cosmic Assembly Near-infrared Deep Extragalactic Legacy Survey (CANDELS, Grogin et al., 2011; Koekemoer et al., 2011). \uvctakes primary WFC3 F275W exposures at a uniform 3-orbit depth and coordinated parallel Advanced Camera for Survey (ACS) F435W exposures at slightly varying depth resulting from the roll angle constraints and the overlap from the increased FoV of the ACS camera. In total, the UV coverage secured by \uvcreaches 426 arcmin2 111The number of pointings in each \uvcfields are 16 in GOODS-N, 8 in GOODS-S, 20 in EGS, and 16 in COSMOS., a factor of 2.7 larger than all previous data combined, including the WFC3 ERS UVIS imaging in GOODS-South (Windhorst et al., 2011), the CANDELS F275W Continuous Viewing Zone (CVZ) imaging in GOODS-North (Grogin et al., 2011), the UVUDF imaging in the Hubble Ultradeep Field within GOODS-South (Teplitz et al., 2013; Rafelski et al., 2015), and the HDUV covering portions of both GOODS fields (Oesch et al., 2018). This unique data set enables a wide range of scientific explorations as follows (Wang et al., 2020):
-
•
Using the high spatial resolution UV and Blue data (700 pc at ) to study the structural evolution of galaxies and create 2D maps of their star-formation history;
-
•
Combining \uvcwith the valuable Herschel legacy far-infrared data to trace the evolution of the star-formation, gas and dust content of moderate redshift () galaxies;
-
•
Probing the role of environment in the evolution of low-mass () star-forming galaxies at ;
-
•
Investigating the decay of star-formation in massive early type galaxies and the role of minor mergers since ;
-
•
Constraining the escape fraction of ionizing radiation (with Å) from galaxies at to better understand how star-forming galaxies reionized the Universe at .
In addition, this unique \uvcdata set has additional treasury value: UV data break the degeneracy between the Balmer break and Lyman break spectral features (Rafelski et al., 2015) to improve the photo-z accuracy. HST UV data complement the existing and newly obtained ground-based U-band surveys in the CANDELS fields (Ashcraft et al., 2018; Redshaw et al., 2022).
3 Observations and data reduction
3.1 \uvcobservations
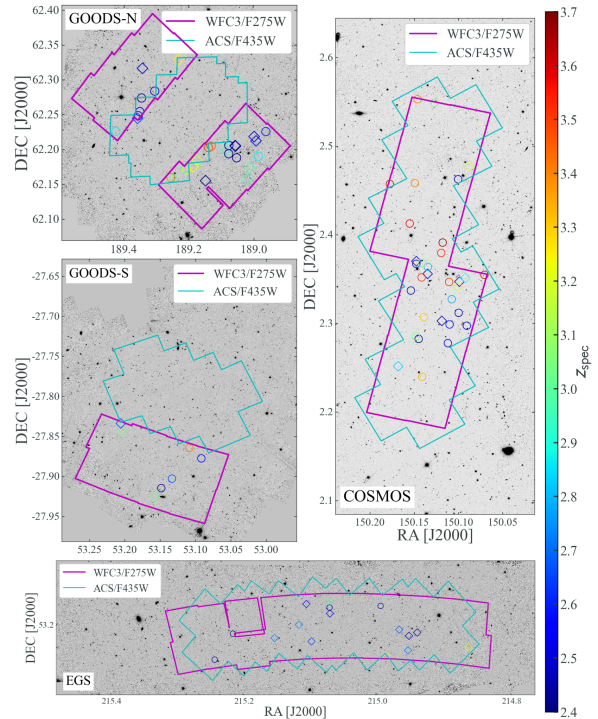
The \uvcprogram (HST-GO-15647, PI: Teplitz) obtained F275W and F435W (coordinated parallel) imaging of four of the CANDELS fields (see Fig. 1, providing new UV (F275W) and wide-area blue optical (F435W) coverage in the COSMOS and EGS fields, and doubling the UV area in GOODS.
The survey was designed to reach a 5- limiting magnitude of magF275W=27 for compact galaxies (with radius), which corresponds to an unobscured star-formation rate (SFR) limit of 0.2 /yr at . This goal required about 8100 seconds per pointing in F275W (3 orbits of two sec exposures each). A minimum of 6 exposures were required for good rejection of cosmic rays (CR), which was determined using the archival UVUDF Teplitz et al. (2013) dataset. As a result, \uvcdid not choose the full-orbit exposures that are optimized for deep surveys with greater on-sky redundancy. In GOODS-N, CVZ increased the efficiency of the observations.
Following the Space Telescope Science Institute’s best practices, exposures included post-flash to mitigate the effects of UVIS charge transfer efficiency (CTE) degradation (Mackenty & Smith, 2012). Post-flash protects against the loss of the faintest objects by filling “traps” on the charge-coupled devices (CCDs) before readout. The selected post-flash level brings the on-chip background up to 12 e- per pixel on average.
The F435W parallels have varying depth due to the overlap from the increased field of view (FOV) of the ACS camera. In COSMOS and EGS, most of the area has 3 orbit depth with 5 sensitivity of magF435W=28, while the overlap region have 6 orbit depth and a sensitivity of magF435W=28.4. The GOODS fields already have B-band coverage of sufficient coverage (mag28), so the additional F435W data were placed in the central CANDELS-Deep region, where deep archival UV and near-infrared (NIR) data are available.
comprised 164 orbits of primary UVIS/F275W with ACS/F435W in parallel. Figure 1 show the \uvcF275W and F435W footprints overlaid on the CANDELS optical imaging mosaics. Small gaps between individual exposures in the F435W coverage are not shown in the figures. The COSMOS and EGS were targeted for 16 and 20 pointings, respectively (approximately 28 and 210, adjusted for scheduling flexibility), enabling F435W coverage in parallel over most of the UV area. In GOODS-S, \uvcobtained 8 pointings, to complete coverage of the field. In GOODS-N, \uvcobserved two groups of 8 pointings (), partially during CVZ and near-CVZ opportunities. The survey design employed a standard dithering pattern of WFC3-UVIS-DITHER-LINE to enable recovery of spatial resolution using AstroDrizzle to create mosaics (see Sect. 3.2 for more details).
In most cases, each pointing was observed in a single visit to enable robust CR rejection. In a few cases, guide star limitations required splitting observations into 2-orbit and 1-orbit visits. In 3 visits, initial observations failed and re-observations were obtained. 1 visit in the EGS fields failed after more than 90% of the program had been completed, and so were not reobserved.
3.2 HST data reduction
The WFC3/UVIS and ACS/WFC images were calibrated using custom routines developed in Rafelski et al. (2015); Prichard et al. (2022), and specifically for the \uvcdata. In order to correct for radiation damage of the WFC3/UVIS detector over time, the F275W data were corrected with the updated charge transfer efficiency (CTE) correction algorithm (Anderson et al., 2021) which includes reduced noise amplification over previous efforts. These F275W images also include the official improved calibrations after 2021 that include concurrent dark subtraction to reduce the blotchy pattern otherwise observed in WFC3/UVIS images and updated flux calibration to match the latest CALSPEC models, which is especially important in the UV (Calamida et al., 2021). We generate custom hot pixel masks using co-temporal darks and a variable threshold as a function of the distance to the readout to ensure a uniform number of hot pixels across the CCDs222https://github.com/lprichard/HST_FLC_corrections.
In addition, we flag readout cosmic rays (ROCRs) in the F275W data by identifying cosmic rays that fall on the detector after the readout of the amplifiers has begun, which are more apparent with the improved CTE correction code. The ROCRs appear as negative divots in the images due to over-correction by the CTE code, as the ROCRs land closer to the amplifiers than is recorded. The ROCRs are identified as 3 sigma negative outliers within 5 pixels of the readout direction of cosmic ray hits identified with AstroDrizzle. These negative pixels have the data quality flags set as bad pixels. Finally, we equalize the background levels on the four amplifiers as their bias level is likely affected by CTE degradation of the overscan regions. This results in clean images with constant background levels333https://github.com/bsunnquist/uvis-skydarks.
We also correct for scattered light in the WFC/ACS F435W images likely caused by earth limb light reflected off the telescope structure (Biretta et al., 2003; Dulude et al., 2010). Each exposure is checked for the existence of a gradient by comparing the left quarter to the right quarter of the image, and a difference threshold of 5e- is applied to a 3 sigma clipped median. If over the threshold, sources are masked in the image and the gradient is modeled with the Photutils Background2D module. Afterwards, the background level of the two chips is equalized to the mean level determined from a 3- clipped mean after source masking444https://github.com/bsunnquist/uvis-skydarks/blob/master/remove_gradients.ipynb.
3.3 Image mosaicing
The image registration and stacking pipeline was adapted from the one used in Alavi et al. (2014). Briefly, the calibrated, flat fielded WFC3/UVIS and ACS/WFC images were combined with the AstroDrizzle software package (Gonzaga, 2012). To this end, first, we use the Tweakreg task in the PYRAF/DrizzlePac package to align the individual calibrated images within every single visit to ensure relative astrometric alignment. We then run the AstroDrizzle pipeline on each visit and align the drizzled output image to the CANDELS astrometric reference grid to correct for the small offset in pointing and rotation from different visits with different guide stars. We performed the alignment on the 30 mas/pix images, with a precision of 0.15 pixel, using unsaturated stars and compact sources. These astrometric solutions are then transferred back to the header of the original calibrated flat fielded data using the Tweakback task in the PYRAF/DrizzlePac package. In the end, all of these aligned calibrated images are drizzled to the same pixel scale of 60 (30) milliarcsec matched to the CANDELS reference images for the various fields555https://archive.stsci.edu/hlsp/candels. Table 1 provides the drizzle parameters that were used. The overall image footprints are shown in Fig. 1.
| Parameter | Value |
|---|---|
| driz_cr_corr | True |
| driz_combine | True |
| clean | True |
| final_wcs | True |
| final_scale | 0.06 (0.03) |
| final_pixfrac | 0.8 |
| final_kernel | square |
| skymethod | globalmin+match |
| skysub | True |
| combine_type | imedian |
AstroDrizzle removes the background, rejects cosmic rays, and corrects input images for geometric distortion. In addition to the science images, AstroDrizzle generates an inverse variance map (IVM), which we use later to make weight images and to calculate photometry uncertainties. We apply the additional correction to the weight images to account for the correlated noise following Casertano et al. (2000). We make publicly available these image mosaics on MAST666https://archive.stsci.edu/hlsp/uvcandels.
4 Sample selections and spectroscopic redshifts
The focus of our LyC investigation is to measure or set strict limits on the escape fractions of LyC photons from galaxies at redshifts . When the red end of the filter response is below the rest-frame Lyman limit, then detected signal can be interpreted as LyC emission (see e.g. Smith et al., 2018, 2020). For this technique to succeed, it is important that the study relies on secure galaxy redshifts. In this section, we discuss the sample selection that enables our search for LyC escape.
4.1 Redshift catalogs
To achieve precise, uncontaminated LyC flux measurements, we chose galaxies with high quality and accurate spectroscopic redshifts. To accomplish this, we vetted each spectrum in our spectroscopic sample by eye, then selected only the spectra with the highest score ranks by multiple spectroscopy experts on our team.
Our initial compilation of archival spectral dataset comprises the Keck observations conducted by Barger et al. (2008); Jones et al. (2018, 2021), the C3R2 survey (Masters et al., 2019), the COSMOS-Magellan active galactic nucleus (AGN) survey (Trump et al., 2009), the DEEP2 survey (Newman et al., 2013), the DEIMOS 10K survey (Hasinger et al., 2018), the GOODS VLT/FORS2 survey (Vanzella et al., 2007), the GOODS VLT/VIMOS survey (Popesso et al., 2009; Balestra et al., 2010), GMASS (Kurk et al., 2013), the MOSDEF survey (Kriek et al., 2015), the MUSE-Wide survey (Herenz et al., 2017), Reddy et al. (2006), Szokoly et al. (2004), TKRS/TKRS2 (Wirth et al., 2004, 2015), VANDELS (Pentericci et al., 2018), VIPERS (Garilli et al., 2014), VUDS (Le Fèvre et al., 2015), VVDS (Le Fèvre et al., 2005), and zCOSMOS (Lilly et al., 2007).
We also supplement this extensive redshift catalog with additional sources identified in a reanalysis of archival HST near-infrared grism spectroscopy in the CANDELS fields, acquired by primarily the 3D-HST survey (Brammer et al., 2012; Momcheva et al., 2016). This reanalysis is part of a novel initiative dubbed the Complete Hubble Archive for Galaxy Evolution (CHArGE, see e.g., Kokorev et al., 2022). The state-of-the-art Grizli software777https://github.com/gbrammer/grizli (Brammer & Matharu, 2021) is utilized to conduct uniform reprocessing of all archival HST imaging and slitless spectroscopy in the areas of CANDELS fields contained within our \uvcfootprints.
Briefly, Grizli reduces the paired pre-imaging and grism exposures in five steps. A) Pre-processing the raw WFC3 imaging and grism exposures. This step includes flat fielding, relative/absolute astrometric alignment, variable/master sky background removal, satellite trail masking, etc. B) Iterative forward-modeling the full field-of-view (FoV) grism exposures at visit level. C) Obtaining best-fit grism redshift of sources through spectral template synthesis. D) Refining the full FoV grism models. E) Extracting the science-enabling products (e.g. 1D/2D grism spectra, emission line maps, etc.) for sources of interest. During step C), Grizli calculates a number of goodness-of-fit statistics for the redshift fitting procedure. As in Wang et al. (2022a, b), we compiled a list of galaxies with secure grism redshifts at , when all of the following goodness-of-fit criteria are satisfied: . Here is the reduced , represents the 1- width of redshift posteriors, and BIC stands for the Bayesian information criterion estimated from the template fitting procedure. This provides us additional high-quality grism redshifts that we combine with the previous redshift compilations for the subsequent visual inspection, to select the highest fidelity sample for our stacking analysis. In addition, this coherent reanalysis of all the available archival grism exposures covering the entire \uvcfields provides comprehensive measurements of the nebular emission line properties of our sample galaxies, which help divide the full sample into subgroups (see Sect. 4.2).
4.2 Visual inspection and sample selection
For our visual inspection, we assigned each spectrum to be visually vetted by at least four reviewers randomly chosen from a group of 13 spectroscopy experts. Each reviewer gave a score to the claimed redshift from the survey catalog, with the following rubric, i.e., 0: reliable, 1: possibly correct, or 2: incorrect. This ranking takes into account the alignment of the observed spectral features to their expected position given the reported redshift in the spectrum, the amount of visible noise, the shape of each line or other spectral feature, the presence of unknown/unexpected spectral lines, the presence of neighbors in the corresponding multiband HST images, and the drop-out band from the HST images. After ranking was completed, we separated each spectrum into five redshift quality quintiles, based on their median and average scores, where the first quintile has median<1 and average<0.5, the second quintile has median<1 and average<1, the third quintile has median<2 and average<1.5, the fourth quintile has average<2 and median<2, and the last quintile has median=2 and average=2. As a consequence, our first redshift quality quintile has 39 galaxies, second has 59, third has 202, fourth has 19, and fifth has 271. Example figures of galaxies in each quintile are shown in the Appendix §A.
In our analysis, we will rely on the most secure redshifts, referring to those in the first, second and third redshift quality quintiles identified by our reviewers. We base our decision to include the third quintile on experience with the overall high quality of the spectra in CANDELS. In this paper, we focus on the search of the LyC signals from individual leakers and/or stacking analysis using the \uvcWFC3/F275W imaging data. So we trim the high-quality redshift catalog by filtering out all spectra taken outside of the \uvcfootprints (we defer the analysis outside the \uvcfootprints but within other archival UV imaging to a later work). We identify and exclude potential AGN candidates from the deep Chandra X-ray observations in these CANDELS fields (Hsu et al., 2014; Nandra et al., 2015; Xue et al., 2016, , and D. Kocevski priv. comm.), as we present the stacking analysis of the escaping LyC signals from AGNs in a companion work (Smith et al., 2023, in prep.). We also exclude sources that lie in close proximity to detector chip gaps of the \uvcF275W imaging, for complex noise properties due to insufficient dithering.
In the end, we compiled a list of 90 galaxies with high-quality spectroscopic redshifts in the range of , based on our dedicated visual inspections of these publicly available spectra. Among these 90 galaxies, 5 show significant detection of their F275W fluxes with signal-to-noise ratio (SNR) 3, which, combined with their secure redshift information, classify them as candidates of individual LyC leaking galaxies. We present the measurements of their detailed properties in Sect. 5.1. Aside from the 5 F275W detections, all the rest of 85 galaxies in our high-quality spectroscopic redshift sample show non-detections in F275W, and are analyzed in our stacking analysis elaborated in Sect. 5.2.
We define five sub-groups on which the stacking analysis is performed separately, for the purpose of testing the possible correlation between LyC leakage and galaxy global properties. To take into account the rapidly evolving IGM opacity with respect to redshift, we divide the entire 85 galaxies into three redshift samples: low- bin (), intermediate- bin (), and high- bin (). Galaxies in the low- bin have their Lyman limit lying closer to the red edge of F275W than sources in the other two redshift bins. Then we classify all the galaxies in the first and second redshift quality quintiles with median score <1 and average score <1 (i.e. at least 3 out of 5 inspectors deem this redshift measurement secure) as the gold- subsample. Last but not the least, we refer to the galaxies showing significant detection of [O ii] 3727,3730 (hereafter referred to as [O ii]) emission in their WFC3/G141 grism spectra as the strong line emitter subsample, denoted by strong-[O ii]. The total and break-down of the number counts for these stacking samples in individual fields are presented in Table 2.
| individual | stacking sample | |||||
|---|---|---|---|---|---|---|
| leaker candidate | ||||||
| low- aaThe low-, intermediate-, and high- samples refer to galaxies in the redshift range of [2.4,2.5], [2.5,3.0], and [3.0,3.7], with a median redshift of , , and , respectively. | intermediate- aaThe low-, intermediate-, and high- samples refer to galaxies in the redshift range of [2.4,2.5], [2.5,3.0], and [3.0,3.7], with a median redshift of , , and , respectively. | high- aaThe low-, intermediate-, and high- samples refer to galaxies in the redshift range of [2.4,2.5], [2.5,3.0], and [3.0,3.7], with a median redshift of , , and , respectively. | gold- bbThe gold- sample includes galaxies with the most secure spectroscopic redshifts, compiled from our visual inspection efforts. | strong-[O ii] ccThe strong-[O ii] sample showing significant [O ii] emission with SNR 3, measured from their archival G141 spectra. These galaxies are considered to be prominent line emitters, highly likely those leaking copious amount of LyC flux. | ||
| GOODS-N | 4 | 12 | 10 | 7 | 10 | 13 |
| GOODS-S | 0 | 1 | 3 | 3 | 0 | 3 |
| EGS | 1 | 6 | 8 | 2 | 8 | 10 |
| COSMOS | 0 | 9 | 7 | 17 | 8 | 6 |
| Combined | 5 | 28 | 28 | 29 | 26 | 32 |
5 Image stacking and photometry
In this section, we first introduce some tentative detections of individual LyC leaker candidates probed by our modestly deep F275W imaging (in Sect. 5.1). Then we describe in detail our methodology of image stacking in Sect. 5.2, and aperture photometry of the stacked images in Sect. 5.3.
5.1 Potential individual LyC leaker candidates
Here, we identify 5 LyC leaker candidates, whose coordinates, redshifts, and photometry are presented in Table 3. These candidates all have secure spectroscopic redshifts vetted by our visual inspection efforts, and show significant F275W flux detected at SNR3.
Here we conduct UV-optimized aperture photometry on the new WFC3/F275W and ACS/F435W \uvcdata, following the methodology developed as part of the Hubble Ultra-Deep Field UV analysis (Teplitz et al., 2013; Rafelski et al., 2015). This method regards the object optical isophotes as more appropriate apertures for counting UV photons than the isophotes defined in near-infrared wavelengths. The PSF and aperture corrections are then performed to make sure the UV and B-band fluxes are consistent with the previous measurements at other wavelengths. The detailed description of our UV-optimized aperture photometry method is described in Sun et al. in prep.
We perform detailed Bayesian inference of their stellar population properties, using the CIGALE software (Boquien et al., 2019) to fit their multi-wavelength photometric measurements, the majority of which are taken from the public CANDELS photometric catalogs, as published in Barro et al. (2019) and (Stefanon et al., 2017a) for GOODS-N and EGS, respectively.
We model the galaxy star-formation history (SFH) using the delayed model via the sfhdelayed module, since the sudden onset of star formation and burst episodes in a, e.g., double-exponential parameterization (i.e. the sfh2exp module) may be too abrupt when the variation of the SFH may be smoother (Boquien et al., 2019; Carnall et al., 2019). We also verify that the different choices of SFH models have a marginal effect on the estimated \fescvalues, on average by 4%. We rely on the BC03 stellar population synthesis models (the bc03 module, Bruzual & Charlot, 2003), the infrared dust models of Dale et al. (2014), and the Calzetti et al. (2000) dust extinction law, during the spectral energy distribution (SED) fitting with CIGALE. The resulting constraints of their SED properties are given in Table 3. In particular, we utilize the nebular module and keep the parameter nebular.f_esc freely varying to allow for emission lines in the SED which were observed in their spectra.
To compute “intrinsic” LyC model flux for these sources (see Table 3), we calculate the inner product of the F275W filter throuput and the CIGALE SED using only the stellar (old and young), nebular lines and continuum (old and young), and dust emission components. The value of \fescis simply the ratio of the observed flux in the \uvcWFC3/UVIS F275W image to this modeled LyC flux in F275W, corrected for IGM attenuation. To perform this correction to the modeled LyC flux, we use the MC line-of-sight IGM attenuation code of (Inoue et al., 2014). Each \fesc value uses 10,000 simulated sight lines at the redshift of each galaxy. The particular line-of-sight IGM attenuation towards each galaxy is unknown, though it is constrained by the observed LyC flux in F275W and the modeled intrinsic F275W flux. For realizations of sight lines that resulted in \fesc 100%, we redraw a new IGM attenuation line-of-sight since these can not be in the set of possible attenuation sight lines based on the spatial and density distributions of IGM absorbers used in the Inoue et al. (2014) code. Galaxies IDs 6226, 20748, and 22588 have approximately 11%, 29%, and 1% of the total IGM transmission sight-lines result in physical \fesc values, respectively. We tabulate the results of the MC \fescanalysis in Table 3 with 1- uncertainties.
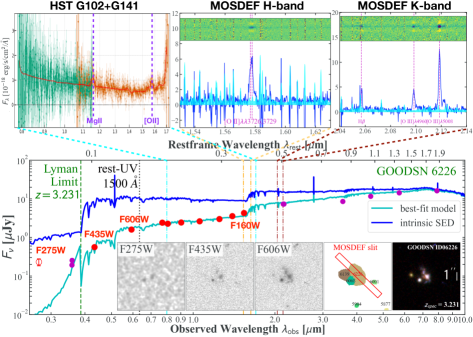
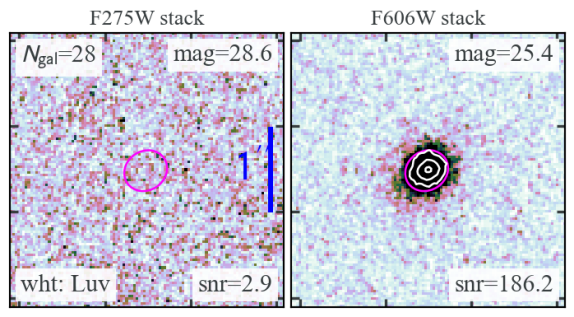
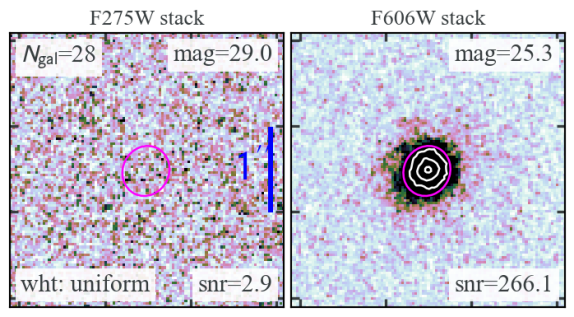
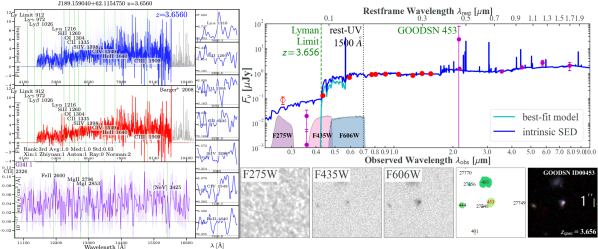
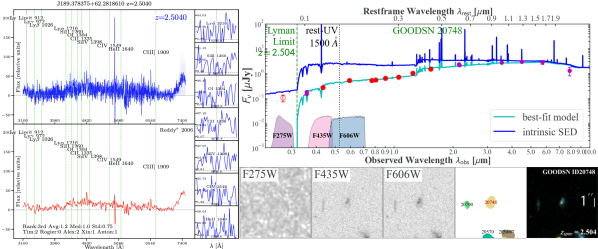
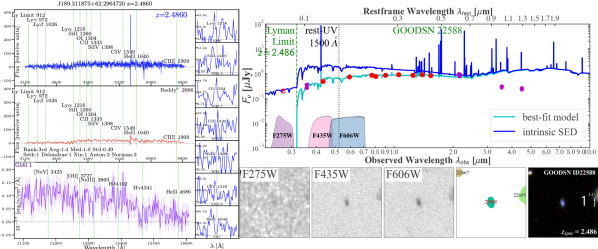
Among these five likely candidates of LyC leaking galaxies, the most promising source is ID 6226 at in the GOODS-N field, as shown in Fig. 2. Since GOODS-N is one of the most extensively studied extragalactic fields, there exists a wealth of imaging and spectroscopic data. In particular, the entire field is covered by the deep Keck/MOSFIRE infrared spectroscopy (2 hrs each in H and K bands) acquired by the MOSDEF program (Kriek et al., 2015). Furthermore, in the whole field these also exists HST grism spectroscopy of both G102 (2 orbits by HST-GO-13420, PI: Barro) and G141 (2 orbits by HST-GO-11600, PI: Weiner). From these existing deep MOSFIRE H- and K-band spectroscopy, we see pronounced nebular emission features of [O iii], H, and [O ii] lines, with fluxes being , , and in units of , respectively. The [O ii] and Mg II lines are also clearly detected in HST grism spectroscopy. The wide wavelength coverage (0.8-1.7m) of this joint G102-G141 spectroscopy at Hubble’s angular resolution basically rules out any possibilities of foreground contamination, since only the spectral features at are seen. ID06226’s F275W magnitude is 25.5 ABmag detected at a 5- significance, indicating \fesc60% from our SED fitting analysis combined with our MC IGM attenuation corrections. In addition, the ground-based U-band imaging from both KPNO and LBC also independently confirm its LyC leakage (Ashcraft et al., 2018). The spectra, HST image stamps, and SED fitting results of the rest four LyC leaker candiates are shown in the Appendix §B.
| Field | ID | R.A. | Decl. | Ref.aaThe references where these spectroscopic redshifts are sourced from. 1: Barger et al. (2008). 2: CHArGE (Kokorev et al., 2022). 3: MOSDEF (Kriek et al., 2015). 4: Reddy et al. (2006). | HST photometry [ABmag] | Best-fit properties from CIGALE | |||||||||||
|---|---|---|---|---|---|---|---|---|---|---|---|---|---|---|---|---|---|
| [deg.] | [deg.] | ||||||||||||||||
| F275W | SNRF275W | F435W | F606W | F814W | F125W | F160W | SFR [/yr] | E(B-V) | F275WintbbWe perform detailed Bayesian inference of stellar population parameters via the CIGALE software (Boquien et al., 2019), using galaxies’ multi-band photometry excluding their F275W flux, to produce the model-independent intrinsic F275W flux (F275Wint) used in the LyC escape fraction calculation. Here is the LyC relative escape fraction calculated from F275Wint corrected for the IGM absorption using the Inoue et al. (2014) Monte Carlo IGM transmission code. Object ID = 22588 had a so we only show the 1- lower limit. Two of our sources (ID = 453 and 21708) show unphysical values (>100%), and are still included here nonetheless for a complete analysis. | bbWe perform detailed Bayesian inference of stellar population parameters via the CIGALE software (Boquien et al., 2019), using galaxies’ multi-band photometry excluding their F275W flux, to produce the model-independent intrinsic F275W flux (F275Wint) used in the LyC escape fraction calculation. Here is the LyC relative escape fraction calculated from F275Wint corrected for the IGM absorption using the Inoue et al. (2014) Monte Carlo IGM transmission code. Object ID = 22588 had a so we only show the 1- lower limit. Two of our sources (ID = 453 and 21708) show unphysical values (>100%), and are still included here nonetheless for a complete analysis. | |||||||
| GOODS-N | 00453 | 189.159046 | 62.115474 | 3.656 | 1 | 26.58 | 3.0 | 26.13 | 24.28 | 23.98 | 24.09 | 23.92 | 10.40 | 24.29 | 0.09 | 27.1 | |
| GOODS-N | 06226 | 189.179527 | 62.185702 | 3.231 | 1,2,3 | 25.49 | 5.0 | 24.52 | 23.38 | 23.00 | 22.70 | 22.32 | 11.21 | 279.37 | 0.18 | 27.1 | |
| GOODS-N | 20748 | 189.378395 | 62.281930 | 2.504 | 3,4 | 26.35 | 3.4 | 25.30 | 24.61 | 24.53 | 23.88 | 23.44 | 10.14 | 24.37 | 0.18 | 24.1 | |
| GOODS-N | 22588 | 189.311919 | 62.296512 | 2.486 | 1,4 | 25.63 | 7.2 | 24.70 | 24.23 | 24.17 | 24.08 | 24.10 | 9.09 | 37.22 | 0.09 | 25.7 | |
| EGS | 21708 | 215.040642 | 52.995283 | 2.408 | 3 | 26.51 | 3.1 | 25.60 | 24.97 | 24.82 | 24.31 | 24.05 | 9.82 | 9.30 | 0.09 | 25.6 | |
5.2 Stacking methodology
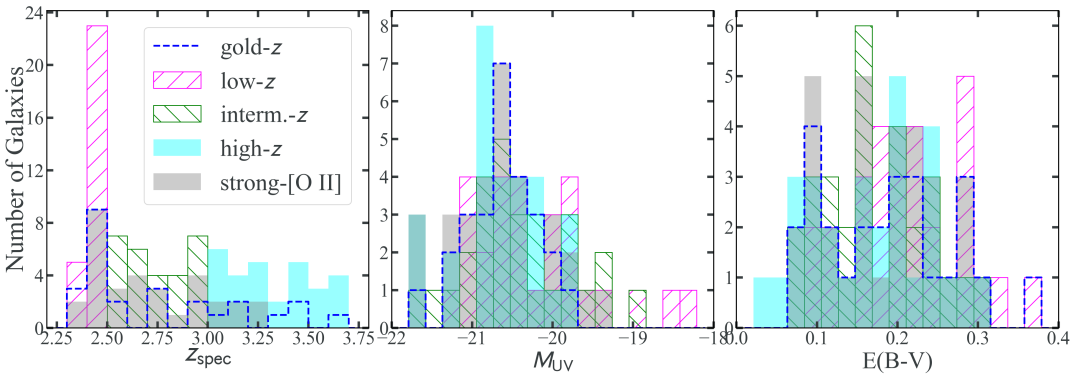
Unlike the 5 galaxies presented above, the vast majority of our sample galaxies with secure spectroscopic redshifts only show non-detections (i.e. SNR<3) in \uvcF275W imaging data, with . Following similar SED fitting analyses outlined in Sect. 5.1, we derive the estimates of their absolute UV magnitudes () and dust attenuation values (E(B-V)) shown as the histograms in Fig. 3.
As shown in Table 2, we further separate these 85 galaxies into five individual samples, to constrain the LyC escape fraction on a population level, taking into account the rapidly evolving LyC opacity in the IGM (Steidel et al., 2018; Bassett et al., 2021). We do not opt to include the 5 detections to avoid stacks dominated and biased by a few sources which can likely be extreme outliers. We adopt the following image stacking procedures, similar to those utilized in Smith et al. (2018); Alavi et al. (2020); Smith et al. (2020).
Consistent with the previous studies of LyC leakage that employ stacking procedures, we assume the galaxies selected in our sample to be self-similar, thus allowing us to stack them to make a more accurate measurement of the faint LyC flux.
-
1.
We first make large cutout image stamps in multiple filters (F275W and F435W from our work described in Sect. 3.3, F606W and F814W from CANDELS) with size on 003 plate scale, centered on each galaxy with secure spectroscopic redshift that passes our visual vetting described in 4.2. We choose the coadded mosaics on 003 plate scale to take full advantage of the high resolution of HST imaging. Yet note that at this stage the object coordinates (RA and Dec) are taken from the CANDELS/UVCANDELS multi-wavelength photometric catalogs that use -band mosaics as the detection image (Guo et al., 2013; Nayyeri et al., 2017; Stefanon et al., 2017b; Barro et al., 2019). The light centroids measured in F160W and optical/UV filters often do not align, as they probe the rest-frame optical and UV wavelength ranges of our sources of interest.
-
2.
To properly re-centroid the optical/UV image cutouts before stacking and at the same time mask possible neighboring contaminants, we utilize the Photutils software to perform photometry on these cutout images. We produce the white light image from the image cutouts in all available filters weighted by filter mean flux density (i.e. , the PHOTFNU keyword), which is taken as the detection image. We mask regions of pixels in the image cutouts according to existing object isophotes already defined in the -band segmentation maps from the CANDELS photometry.
-
3.
After obtaining the segmentation map from the detection white light image cutout, we measure the isophotal fluxes associated with each of the segmentation regions in the individual filter image cutouts using Photutils, and select the region that has the brightest F606W flux, under the assumption that the ionizing radiation emerges from the areas dominated by the emission from young massive stars. This is critical in pinpointing the centroid of our galaxies’ rest-frame UV light, where the LyC signal most likely originates.
-
4.
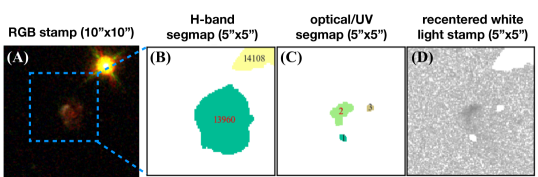
We then make small cutout image stamps with , appropriately centered on the object’s peak -band flux (corresponding to object’s UV-light-weighted centroid), with all contaminants masked. Fig. 4 demonstrates the entire procedures for our re-centroiding and masking strategy. We also estimate the local sky background and remove that from the SCI extension before stacking. We exclude all surrounding objects outside a certain circular aperture of 0.5 arcsec.
-
5.
We adopt two numerical recipes to combine the surface brightness signals from small cutout image stamps of individual objects in terms of different weighting schemes: uniform weighting and UV luminosity weighting. The uniform weighting scheme can be described by
(1) where and stand for the flux and uncertainty of the source among the entire number of that contribute to the stacks. and thus denote the stacked flux and uncertainty.
The UV luminosity () weighting scheme is instead depicted by
(2) where represents the galaxy rest-frame UV luminosity converted from shown in Fig. 3. The uniform weighting equalizes contribution from every line of sight to the stack, such that a mean IGM correction is applicable. The weighting normalizes galaxy multi-band photometry before stacking as the LyC escape fraction is a relative quantity (Marchi et al., 2017; Steidel et al., 2018). In Sect. 6, we show results obtained from both stacking methods.
-
6.
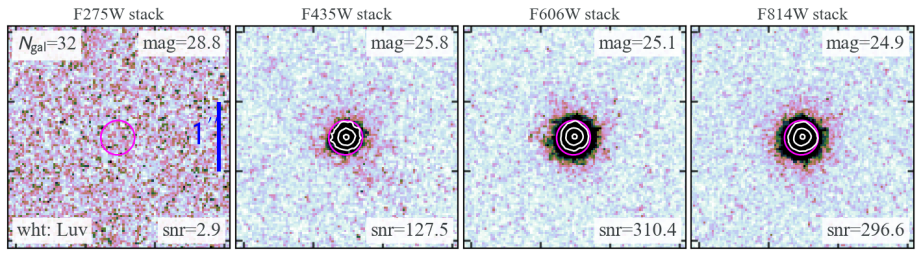
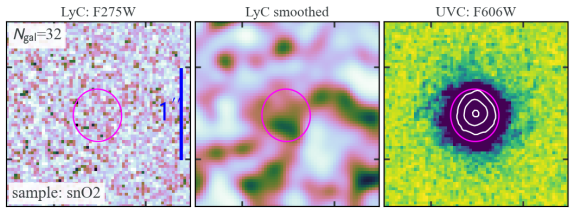
Finally, we apply both weighting methods to the all galaxy samples listed in Table 2. The large spatial coverage of the \uvcsurvey presents us an ideal opportunity of testing the strengths of escaping LyC signals as a function of galaxy global properties with sufficient sample statistics. The stacked images in multiple filters for the strong-[O ii] galaxy sample consisting of 32 sources are presented in Fig. 5.
5.3 Photometry on image stacks
Before image stacking detailed in Sect. 5.2, we have already subtracted a constant from each cutout image stamp in each filter (F275W, F435W, F606W, and F814W) of each galaxy selected for stacking, to ensure that the mode of the local sky background of each galaxy is achromatically as close to zero as possible. Just in case there still remains some residual sky background signals that survive our stacking procedures, we perform another round of background estimation and removal before the photometry of stacked images. We apply a circular mask with a radius of 45 pixels (i.e. 135) to the central regions of the stacked images in each filter, and bin the unmasked background pixels according to the Freedman-Diaconis rule, following Smith et al. (2018, 2020). Then we derive the mode value of the resultant count-rate histogram of these surrounding pixels outside the central masked regions, as the remaining sky background in the stacked images. After subtracting off this remaining background, we make sure that the empty regions of our stacked images only contain random noise.
The sample median redshifts are given in Table 4. At these redshifts, the broad-band filters F435W and F606W probe the blue and red side of the rest-frame 1500 Å wavelength regime of source spectrum, conventionally regarded as the UV continuum (UVC).
The escaping LyC signals are believed to originate from young star clusters comprising hot, massive O-type stars, which also dominate the blue-UV wavelength range of the host galaxy’s SED (see e.g., Vanzella et al., 2022).
We therefore take the stacked F606W image as the detection image to derive the Kron elliptical aperture for flux measurements as shown in Fig. 5, to avoid diluting the SNRs of potential LyC signals inside unnecessarily large apertures enclosing mostly noise.
Following the practice presented in Sect. 5.2, we utilize the Photutils software to measure the Kron auto fluxes in the stacked images in all four filters: F275W, F435W, F606W, and F814W.
We adopt the following parameters for Photutils:
detect_thresh=5, analysis_thresh=5, detect_minarea=8,
deblend_nthresh=32,
deblend_mincont=0.001.
Finally, using the up-to-date zero points of all four filters, we convert these measured fluxes into total magnitudes given in Table 4.
After averaging the best-fit CIGALE SEDs as discussed above, we find an insignificant red-leak of flux into the F275W filter redward of the 912Å Lyman break of 0.8%.
| sample | aaSample median redshift. | Aperture photometry on the stacked imagesbbTotal magnitude and significance measured from the aperture photometry performed on stacked image stamps. For measurements under 2- significance, we provide their 2- limits. | Measured physical properties | |||||||||||
|---|---|---|---|---|---|---|---|---|---|---|---|---|---|---|
| magF275W | SNRF275W | magF435W | magF606W | magF814W | E(B-V) | c,dc,dfootnotemark: | eeThe intrinsic ratio of the UVC and LyC flux. We compute this ratio for each galaxy within the stacking samples based on their best-fit intrinsic SED and take the median of the distribution as the intrinsic ratio for stacks, listed here. | ffThe average IGM transmission for each stack, estimated using galaxies’ best-fit intrinsic SED and the Inoue et al. (2014) Monte Carlo line-of-sight IGM code. | ccFor tentative detections with SNR2, the values reported here correspond to the direct measurements obtained from the respective stacks, followed by the bootstrapped 1- uncertainty ranges. For non-detections, we show the inferred 2- limits of these physical quantities. [%] | c,gc,gfootnotemark: [%] | ||||
| low- | 28 | 2.45 | 29.38 | <2.0 | 25.64 | 25.07 | 24.86 | -20.41 | 0.21 | >53.30 | 8.56 | 0.38 | <6.1 | <0.8 |
| intermediate- | 28 | 2.75 | 28.96 | 2.9 | 26.05 | 25.31 | 25.11 | -20.52 | 0.15 | 28.78 [26.21, 32.13] | 14.36 | 0.21 | 10.4 [9.2, 11.3] | 2.4 [2.1, 2.6] |
| high- | 29 | 3.30 | 29.52 | <2.0 | 27.03 | 25.96 | 25.50 | -20.68 | 0.17 | >26.51 | 11.57 | 0.06 | <2.6 | <0.5 |
| gold- | 26 | 2.57 | 29.35 | <2.0 | 25.68 | 25.01 | 24.84 | -20.60 | 0.18 | >54.15 | 10.75 | 0.25 | <4.9 | <0.9 |
| strong-[O ii] | 32 | 2.65 | 29.07 | 2.9 | 25.69 | 25.00 | 24.82 | -20.65 | 0.18 | 42.57 [39.21, 47.62] | 10.18 | 0.24 | 5.7 [5.1, 6.2] | 1.0 [0.9, 1.1] |
| sample | aaSample median redshift. | Aperture photometry on the stacked imagesbbTotal magnitude and significance measured from the aperture photometry performed on stacked image stamps. For measurements under 2- significance, we provide their 2- limits. | Measured physical properties | |||||||||||
|---|---|---|---|---|---|---|---|---|---|---|---|---|---|---|
| magF275W | SNRF275W | magF435W | magF606W | magF814W | E(B-V) | c,dc,dfootnotemark: | eeThe intrinsic ratio of the UVC and LyC flux. We compute this ratio for each galaxy within the stacking samples based on their best-fit intrinsic SED and take the median of the distribution as the intrinsic ratio for stacks, listed here. | ffThe average IGM transmission for each stack, estimated using galaxies’ best-fit intrinsic SED and the Inoue et al. (2014) Monte Carlo line-of-sight IGM code. | ccFor tentative detections with SNR2, the values reported here correspond to the direct measurements obtained from the respective stacks, followed by the bootstrapped 1- uncertainty ranges. For non-detections, we show the inferred 2- limits of these physical quantities. [%] | c,gc,gfootnotemark: [%] | ||||
| low- | 28 | 2.45 | 28.64 | <2.0 | 25.83 | 25.10 | 24.81 | -20.41 | 0.21 | >26.07 | 8.56 | 0.38 | <12.4 | <1.7 |
| intermediate- | 28 | 2.75 | 28.60 | 2.9 | 26.18 | 25.41 | 25.15 | -20.52 | 0.15 | 18.73 [17.10, 21.00] | 14.36 | 0.21 | 15.9 [14.2, 17.4] | 3.7 [3.2, 4.0] |
| high- | 29 | 3.30 | 29.36 | <2.0 | 27.03 | 26.08 | 25.60 | -20.68 | 0.17 | >20.52 | 11.57 | 0.06 | <3.3 | <0.6 |
| gold- | 26 | 2.57 | 29.25 | <2.0 | 25.81 | 25.16 | 24.94 | -20.60 | 0.18 | >43.35 | 10.75 | 0.25 | <6.1 | <1.1 |
| strong-[O ii] | 32 | 2.65 | 28.82 | 2.9 | 25.80 | 25.10 | 24.93 | -20.65 | 0.18 | 30.77 [28.87, 33.74] | 10.18 | 0.24 | 8.0 [7.2, 8.4] | 1.4 [1.3, 1.5] |
6 Inference of the LyC escape fraction
In this section, we present the main results from our detailed stacking analysis. Following the standard nomenclature (e.g., Steidel et al., 2001; Siana et al., 2010, 2015; Steidel et al., 2018), we define the relative escape fraction of LyC as
| (3) |
where and represent the intrinsic and the observed ratios of the UVC and LyC fluxes, respectively, and is the IGM opacity. The transmission of the ionizing flux through the intervening IGM (i.e. ) is a highly stochastic process, ascribed to its bimodal probability distribution function (PDF). Bassett et al. (2021) showed that the PDF of can be depicted by a sudden rise towards and a much less prominent second peak at higher values. Due to the strong degeneracy between \fescand , the inferred values of \fescare often overestimated from the observations of galaxies leaking strong LyC flux under the assumption of a mean , a.k.a. the IGM transmission bias. Fortunately, Bassett et al. (2021) verified that this bias is less fatal for large galaxy ensembles including LyC non-detections.
To determine the appropriate average IGM transmission value for each stack, we use the Inoue et al. (2014) MC code to generate 10,000 realizations of the line-of-sight IGM transmission models as a function of observed wavelength per galaxy at its known redshift. We then calculate the filter throughput weighted average of these transmission models for each line-of-sight using
| (4) |
with representing the F275W filter throughput. This ensures that only the observed wavelengths within the F275W filter are considered in the IGM transmission calculations, and any wavelengths outside of the filter would not be used to calculate the average \fesc of the stack. The result is 85 sets of distributions of 10,000 IGM transmission values through the F275W filter, for the 85 galaxies in the entire redshift range. To estimate the appropriate IGM transmission values for the five stacks, we take the arithmetic mean of the IGM transmission distributions for galaxies that reside in the stacking samples, hereafter denoted as . We rely on to break the degeneracy between and \fesc, since is based on the MC approach, adequate for our large galaxy samples selected from a wide sky coverage of 426 arcmin2 in total. The values of are given in Tables 4 and 5.
To obtain the appropriate values of the intrinsic flux ratio of UVC to LyC, we run extensive sets of CIGALE SED fitting analysis of all galaxies within the entire stacking samples, following the numerical setup described in Sect. 5.1. We again do not use the observed F275W flux to retrieve model independent intrinsic SED at the LyC wavelengths of all galaxies, adding together the various components (i.e. stellar, nebular lines and continuum, and dust) without IGM and ISM absorption. We then compute the inner products of this intrinsic SED and the filter throughput of F275W and F606W, covering the rest-frame LyC and 1,500 Å UVC, respectively, to estimate the intrinsic flux of LyC and UVC for each galaxy in the stacking samples. Finally, we take a median of all the intrinsic UVC to LyC flux ratios of galaxies that reside in each one of the stacks as the sample average , shown in Tables 4 and 5. We note that these intrinsic ratios are consistent with the conventional values quoted in the literature, (e.g. Guaita et al., 2017; Rutkowski et al., 2017; Smith et al., 2018; Alavi et al., 2020).
Then the relative and absolute LyC escape fractions are connected via
| (5) |
where following the Calzetti dust attenuation law (Calzetti et al., 2000) appropriate for high- star-forming galaxies. We take the sample median value of E(B-V) as the default dust extinction estimates when computing . We adopt two stacking methodologies, i.e., the uniform and weighting schemes, and summarize all the measured physical properties for our stacking galaxy samples in Table 4 and 5, for the uniform and stacking, respectively.
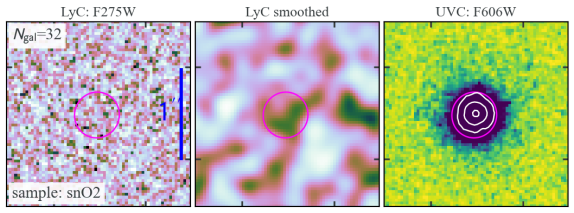
We first show the stacked image stamps of the strong-[O ii] sample — our largest sample consisting of 32 galaxies — as an example of the end products from our stacking analyses elaborated in Sect. 5. The combined images stacked using the weighting of all four filters (F275W, F435W, F606W, and F814W) on the entire spatial extent with plate scale are shown in Fig. 5. The Kron elliptical aperture defined via our Photutils photometry with the default parameters is shown as the magenta ellipse in each panel in the top row. The 15, 40, and 90 percentiles of the peak flux in each ACS filter are also marked as white contours. We see that our rigorous stacking methodology ensures a centrally concentrated light profile in the three ACS filters that probe the rest-frame UV spectra of the sample galaxy population. The source number counts as shown in the far right panel of Fig. 5 implies a good re-centroiding process during stacking. Similar features of the stacked count map and UV light profiles are seen using the uniform weighting and for other galaxy samples as well.
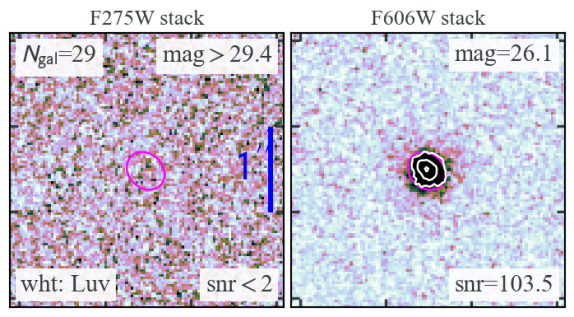
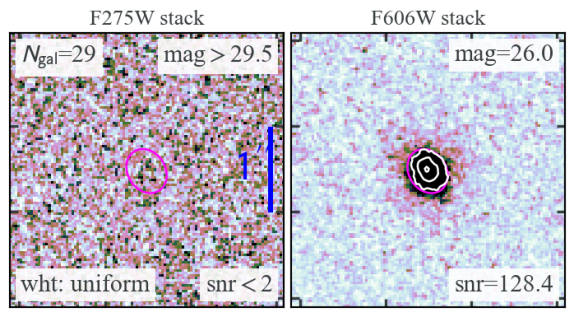
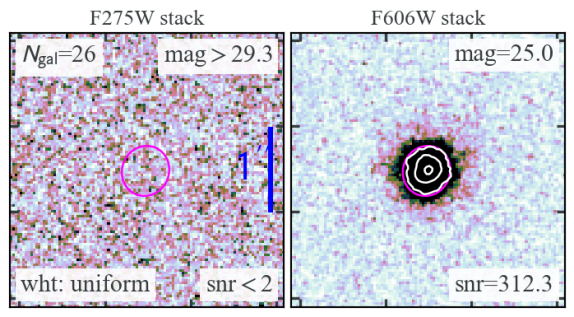
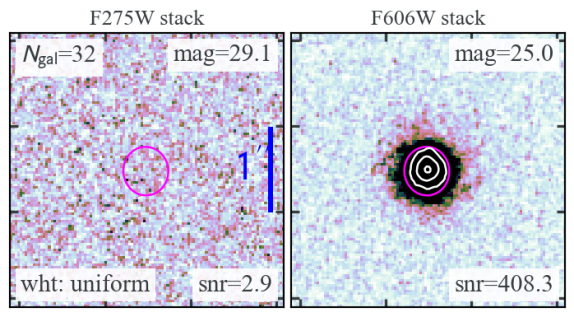
Our large parent sample size allows us to constrain \fescin three separate redshift bins: the low- sample of with , the intermediate- sample of with , and the high- sample of with , to account for the rapidly evolving IGM opacity across redshifts. The very similar sample sizes (28, 28, and 29 sources for the low-, intermediate-, and high- samples, respectively) facilitate a more convenient comparison of the measured UVC to LyC flux ratio and \fesc. The stacked image stamps of F275W (covering LyC) and F606W (covering the rest-frame 1500 Å flux as UVC) produced by both stacking methods for the low-, intermediate-, and high- samples are shown in Figs. 6, 7, and 8, respectively. We obtain 2- limits of mag ABmag and for the low- sample stacked using the uniform weighting. On average, the low- sample shows slightly higher dust attenuation of E(B-V)=0.21 than that of the other samples. After correcting for dust, we get a 2- upper limit of . We achieve tighter upper limits of and for the high- sample due to the precipitously dropping average IGM transmission at high redshifts, i.e., . The stacking results from the weighting are similar.
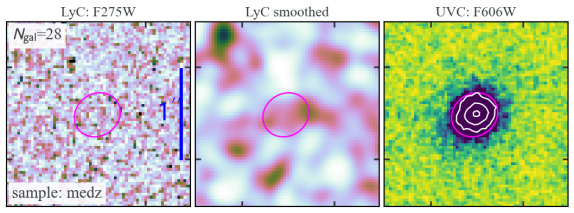
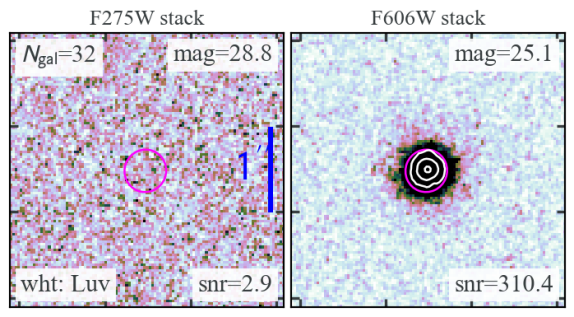
From the intermediate- bin, we detect tentative LyC signals with . It is encouraging to see that both stacking methodologies converge to the same SNR of a 2.9- significance. In the bottom panels of Fig. 7, we show the zoom-in views of central regions of the F275W and F606W stacks probing the potential LyC signals and the rest-frame 1,500 Å UVC flux. In the middle panel of both stacking methods, we show the F275W stack smoothed using a boxcar kernel with a width of 3 pixels, to highlight the potential escaping LyC flux.
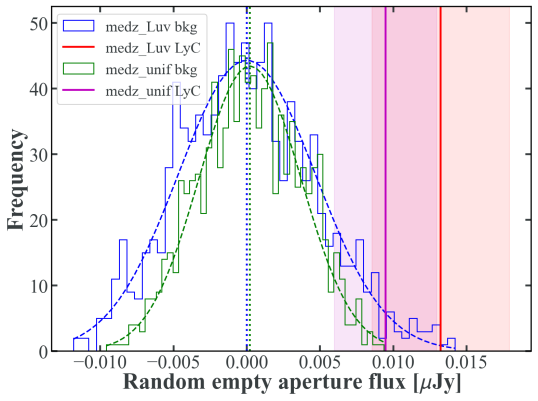
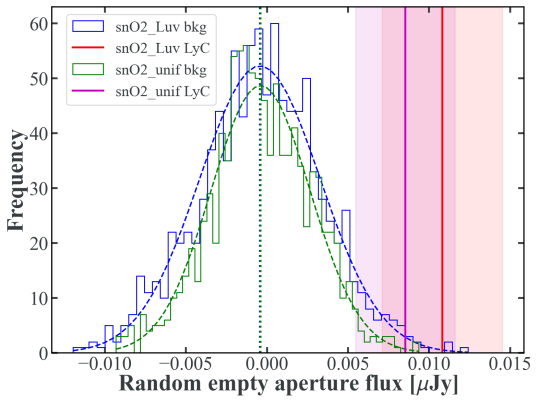
To verify the significance of this tentative detection, we conduct random empty aperture analyses as in Prichard et al. (2022). We randomly draw 1,000 circular apertures with a radius of 9 pixels (i.e., , similar to the size of the the Kron aperture employed in stacked image photometry) in empty regions of the F275W stack, with the central region properly masked. As shown in Fig. 9, the distribution of the total fluxes measured within these apertures can be well represented by a Gaussian with a mean of Jy and a standard deviation of Jy for the uniform () stacking method. The vertical lines mark the measured fluxes of the tentative LyC signals of =0.0095 and 0.0132 Jy from the uniform and weighting, respectively, both compatible with the significance reported in Tables 4 and 5. We also find out that the uniform stacking gives slightly smaller noise fluctuations than that by the stacking, and hereafter we refer to the results given by the uniform weighting as our default set of results.
To estimate the sample variance and thus the statistical uncertainty of the inferred escape fractions from our tentative detections, we rely on the bootstrapping technique (as frequently used in cluster lens modeling practices, see e.g., Wang et al., 2015). We randomly drop one galaxy from the stacking sample and re-stack the rest of the sample following the entire procedures outlined in Sect. 5.2. This practice is repeated in a large number of times to provide a range of estimates of the observed UVC/LyC flux ratios and the escape fractions. We take the 16 and 84 percentiles of this range as the 1- statistical uncertainty reported in Tables 4 and 5. As a result, we obtain a relative LyC escape fraction of for the intermediate- sample at the median redshift of , with a bootstrapped 1- uncertainty range of [9.2, 11.3]%. We notice that the intermediate- sample has the smallest sample median dust extinction value (E(B-V)=0.15) among the five stacking sub-groups, more favorable to the escape of the ionizing radiation. Assuming E(B-V)=0.15, we convert to , with a 1- uncertainty range of [2.1, 2.6]% for the intermediate- sample.
Our large sample size enables us to test the strengths of escaping LyC flux as a function of galaxy global properties. We repeat our stacking analysis on the gold- sample, comprising galaxies in the first and second redshift quality quintiles ranked by our dedicated visual inspection efforts, considered to have the most secure spectroscopic redshifts. There are 26 galaxies in the gold- sample, with a median redshift of . The presence of escaping LyC in this sample is not detected in the F275W stacks (see Fig. 10). We obtain 2- lower limits of mag ABmag and . This is equivalent to 2- upper limits of and assuming the sample median E(B-V)=0.18.
These non-detections of F275W flux might stem from the small number of galaxies included in stacking for the above three samples, or the CTE degradation effect. Yet the latter seems unlikely since the LyC stacks from Smith et al. (2020) show no evidence of CTE effects when comparing the pristine WFC3/UVIS ERS data (Windhorst et al., 2011) to the later observed HDUV data (Oesch et al., 2018), which is more prone to CTE degradation. These stringent upper limits from stacking non-detections and the high lower limits of LyC escape fractions estimated for the three tentative individual LyC leakers presented in Table 3 confirm the intriguing bimodality of \fescat high redshifts (see also similar conclusion found by the LACES program, HST-GO-14747; P.I. Robertson, Fletcher et al., 2019).
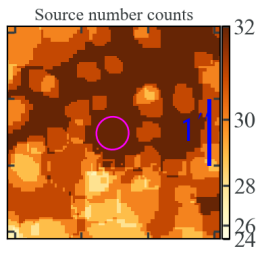
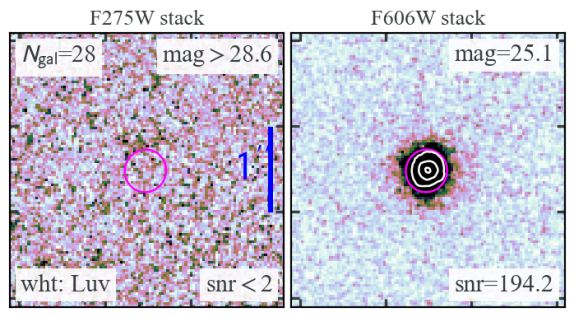
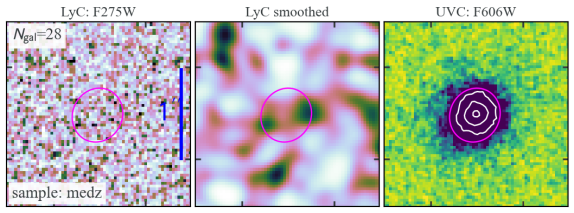
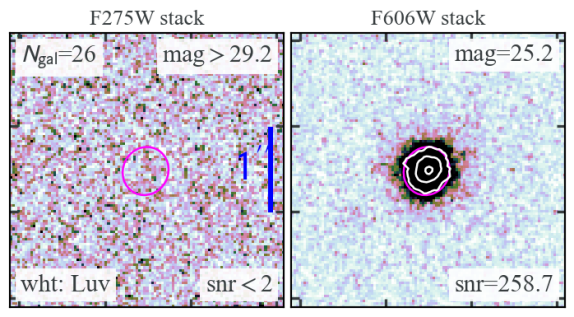
Finally we perform stacking and photometry on the strong-[O ii] sample. Thanks to the wide coverage of the HST WFC3/G141 slitless spectroscopy in the \uvcfields, the vast majority of our galaxies have rest-frame near-UV and optical SED measured by G141. The redshift cut imposed by our original sample selection (i.e. ) precludes our access to some frequently used strong rest-frame optical nebular emission lines, e.g., H, [O iii]. The only strong line covered by G141 at this redshift range is [O ii]. As such, we take advantage of the CHArGE initiative that reanalyzes all the existing HST NIR imaging and slitless spectroscopy in our fields, to obtain the flux, 1- uncertainty, equivalent width of [O ii] for our galaxies, as briefly mentioned in Sect. 4.2. This strong-[O ii] subsample consists of 32 strong emission-line galaxies at a median redshift of . As in the intermediate- sample, we also tentatively detect the LyC signals in the F275W stacks (see Fig. 11): at 2.9-, equivalent to a relative (absolute) LyC escape fraction of 5.7 (1.0)%. This significance is verified in our random empty aperture analysis shown in Fig. 12. From the bootstrapping procedure described above, we estimate the following 1- uncertainty ranges: and . The constraints on from both the intermediate- and the strong-[O ii] samples (i.e. on the level of 5-10%) are generally compatible with some recent findings by Saxena et al. (2021); Begley et al. (2022); Griffiths et al. (2022), as well as the the result found by the KLCS program, which measures , from a sample of 106 Lyman-break selected galaxies showing non-detections in Keck/LRIS U-band spectroscopy (Steidel et al., 2018). This supports that galaxies with strong nebular emission in addition to those showing Lyman-break are good candidates to leak ionizing radiation, as they experience prodigious instantaneous star-forming activities, and therefore excellent analogs of the first galaxies that drive cosmic reionization (Tang et al., 2019; Endsley et al., 2021).
The bottom panels of Fig. 11 shows the zoom-in views of central regions of the F275W stacks, where this tentative escaping LyC signals are seen. Intriguingly, we see that the morphology of this tentative LyC signal does not resemble that of the population-averaged UVC light. Similar phenomena have been reported in individual prodigious LyC leakers (see e.g., Vanzella et al., 2016; Ji et al., 2020; Vanzella et al., 2022). Because dust and neutral hydrogen in the ISM are highly efficient in absorbing the LyC radiation, the escape of the ionizing radiation benefits from the low covering fraction of the ISM (Jaskot & Oey, 2013). Indeed, cosmological hydrodynamic simulations predict that the LyC radiation has better chances to escape from their host galaxies via low column density paths pre-cleared by feedback and fully ionized by young O-type stars recently formed in this region (Ma et al., 2020). Our careful recentroiding methodology before stacking entails centering of the Hii regions with high ISM covering faction and the bulk UVC flux emitted by massive stars; this naturally suppresses the emergence of LyC flux from the center of the stacks. Our finding, in accord with the conclusion drawn from the observations of individual LyC leakers and numerical simulations, strongly suggests that the clumpy ISM geometry with non-uniform covering fraction is highly conducive to the escape of LyC flux.
7 Conclusions
In this paper, we introduce the \uvcHST Cycle-26 Treasury Program (HST-GO-15647, PI: Teplitz), awarded in total 164 orbits of primary WFC3/F275W and coordinated parallel ACS/F435W imaging observations. Its wide sky coverage of 426 arcmin2, a factor of 2.7 larger than all previous HST UV data combined, makes it the largest space-based UV sky survey of distant galaxies with high angular resolution. We present its first set of science-enabling data products — the coadded imaging mosaics publicly released at https://archive.stsci.edu/hlsp/uvcandels — togther with an in-depth description of the data reduction procedures. These mosaics are astrometrically aligned to the CANDELS world-coordinate system. The data processing is designed to overcome the issues affecting the quality of UVIS imaging: the CTE degradation, readout cosmic ray corrections, epoch-varying scattered light during the CVZ observations, etc. As a highlight of the research potential of the UVCANDELS dataset, we focus on one particular application of these imaging mosaics, i.e., searching for strong individual star-forming galaxies that leak LyC radiation and constraining the LyC escape fraction through stacking non-detections.
Our main conclusion is summarized as follows.
-
•
We build a large compilation of currently existing spectroscopic data sets in the CANDELS fields and organize dedicated visual inspection efforts to vet the quality of the rest-frame UV/optical spectra for sources at , to exclude spurious spectroscopic redshift measurements. We identify a sample of five galaxies as likely individual LyC leaker candidates, as they show tentative detections (SNF275W 3) in the \uvcF275W imaging. Deeper UV imaging and spectroscopic observations at high angular resolution can be helpful in characterize the detailed properties (e.g. morphology) of these escaping LyC signals.
-
•
We design a rigorous and efficient image stacking methodology using two weighting schemes: the uniform and weighting. Our stacking method is capable of properly recentroiding cutout stamps in terms of source optical/UV isophotes, masking any possible neighboring contaminants, and subtracting local residual sky backgrounds to the level of .
-
•
We apply our stacking method to three separate redshift bins: the low-, intermediate-, and high- samples, consisting of 28, 28, and 29 galaxies, respectively. All these galaxies show non-detections in F275W by themselves but have secure spectroscopic redshifts. We also perform stacking of the gold- sample with the best quality of spectroscopic redshifts from our dedicated visual inspection. We measure a tentative stacked LyC signal of in the intermediate- bin at a 2.9- confidence level. This is equivalent to at the sample median redshift of , with a 1- uncertainty range of [9.2, 11.3]%. The non-detections in the other samples, combined with the high escape fractions for the individual leaker candidates, confirm the strong bimodality seen in high- LyC escape fraction estimates.
-
•
The stacks of the strong emission-line galaxies also show tentative LyC detection of at 2.9-. This translates into with a 1- uncertainty range of [5.1,6.2]%, at the sample median redshift of . This advocates for the prevalent role of strong line emitters in causing the cosmic reionization and maintaining the UV ionization background. We find that the morphology of the tentative LyC signals in F275W stacks is different from the highly concentrated UVC light profile in the F606W stacks. This is consistent with the observations of currently known individual prodigious LyC leakers and numerical simulations, in support of the argument that the non-uniform ISM covering faction is conducive to the escape of LyC flux.
As summarized in Sect. 2, constraining the escape fraction of the ionizing radiation from galaxies and AGNs at (see our companion work of Smith et al., 2023, in prep., for the stacking analysis of AGNs using similar methodology) is merely one of the five major science goals of the \uvcprogram. The unique UV/optical dataset produced and publicly released by the \uvcteam will offer tremendous opportunities of scientific explorations on various aspects of galaxy formation and evolution. The science-enabling data products will also support the near and mid infrared observations from the JWST in these legacy extragalactic survey fields.
Appendix A Example figures used for visual confirmation of spectroscopic redshift
As discussed in Sect. 4.2, we visually confirmed the spectroscopic redshift of the galaxies in our sample since some ground based spectra are prone to noise and limited by seeing conditions. Here, we show an example figure of a galaxy that was ranked into each quintile. The blue curve is the spectrum obtained directly from the archive of the referenced literature source, and the red curve is the same curve convolved with a = 3 Å wide Gaussian. Several regions of the spectra where emission/absorption lines are expected are shown in greater detail for inspection of the line profiles. The shown is taken from Skelton et al. (2014). HST image cutouts filter bands are indicated in their own panels, with the LyC filter distinguished. The original HST mosaics where the image cutouts were extracted from is indicated in blue text below all the image cutouts displayed. The image refers to images constructed as described in Szalay et al. (1999). Individual ranks are shown for several co-authors, as well as the average, median, and standard deviation of these values.
A.1 1st quintile
![[Uncaptioned image]](/html/2308.09064/assets/x23.png)
A.2 2nd quintile
![[Uncaptioned image]](/html/2308.09064/assets/x24.png)
A.3 3rd quintile
![[Uncaptioned image]](/html/2308.09064/assets/x25.png)
A.4 4th quintile
![[Uncaptioned image]](/html/2308.09064/assets/x26.png)
A.5 5th quintile
![[Uncaptioned image]](/html/2308.09064/assets/x27.png)
Appendix B Spectra, HST image cutouts, and SEDs of additional LyC leaker candidates
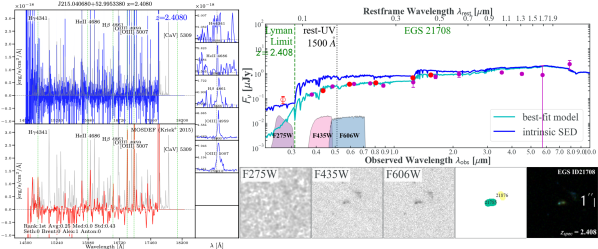
In total, five galaxies are identified from the catalog of high-quality spectroscopic redshifts within the \uvcsurvey footprints, which show relatively strong detection in F275W (e.g. SNR3) and in the redshift range of , where F275W probes their escaping LyC flux. The archival spectra, taken from ground-based and/or HST grism instruments (Reddy et al., 2006; Barger et al., 2008; Kriek et al., 2015; Kokorev et al., 2022), for four of the five sources are shown in the left panels of Figs. 13-16, with the remaining one already shown in Fig. 2. For high-resolution spectroscopy taken with Keck, we show both the original (blue) and the smoothed version using a 3- Gaussian kernel (red). The image stamps of filters F275W (smoothed with a 3- Gaussian kernel), F435W, and F606W, the F160W segmentation maps, and the color composite images of these galaxies are displayed in the lower right panels of each figure.
We conduct detailed SED fitting using the CIGALE software to obtain the intrinsic SED of these galaxies before IGM and ISM absorption, with results shown in the upper right panels of each figure. Following the presentation of Fig. 2, the multi-band photometry includes those secured by HST (red dots) and other channels (e.g., Spitzer IRAC and ground-based imaging, shown in magenta dots. The F275W imaging (hollow red dots) is not used in our CIGALE fitting analysis, since we do not apply the average IGM correction to fit galaxy’s SED. The cyan curves correspond to the best-fit SEDs that accurately reproduce the observed photometric data points, whereas the blue curves show the intrinsic SED without Lyman series absorption from the galaxy ISM and the IGM. We then perform MC simulations using the Inoue et al. (2014) prescription to apply line-of-sight IGM attenuation to the intrinsic SED of our galaxies, to compute \fescgiven in Table 3.
References
- Alavi et al. (2014) Alavi, A., Siana, B. D., Richard, J., et al. 2014, ApJ, 780, 143, doi: 10.1088/0004-637x/780/2/143
- Alavi et al. (2020) Alavi, A., Colbert, J. W., Teplitz, H. I., et al. 2020, The Astrophysical Journal Letters, 904, 59, doi: 10.3847/1538-4357/abbd43
- Anderson et al. (2021) Anderson, J., Baggett, S., & Kuhn, B. 2021, Updating the WFC3/UVIS CTE model and Mitigation Strategies, Instrument Science Report 2021-9, 44 pages
- Ashcraft et al. (2018) Ashcraft, T. A., Windhorst, R. A., Jansen, R. A., et al. 2018, PASP, 130, 064102, doi: 10.1088/1538-3873/aab542
- Balestra et al. (2010) Balestra, I., Mainieri, V., Popesso, P., et al. 2010, A&A, 512, A12, doi: 10.1051/0004-6361/200913626
- Barger et al. (2008) Barger, A. J., Cowie, L. L., & Wang, W.-H. 2008, ApJ, 689, 687 , doi: 10.1086/592735
- Barro et al. (2019) Barro, G., Pérez-González, P. G., Cava, A., et al. 2019, ApJS, 243, 22, doi: 10.3847/1538-4365/ab23f2
- Barros et al. (2016) Barros, S. d., Vanzella, E., Amorín, R., et al. 2016, A&A, 585, A51, doi: 10.1051/0004-6361/201527046
- Bassett et al. (2021) Bassett, R., Ryan-Weber, E. V., Cooke, J., et al. 2021
- Begley et al. (2022) Begley, R., Cullen, F., McLure, R. J., et al. 2022, arXiv
- Bergvall et al. (2006) Bergvall, N., Zackrisson, E., Andersson, B.-G., et al. 2006, Astronomy & Astrophysics, 448, 513, doi: 10.1051/0004-6361:20053788
- Bertin & Arnouts (1996) Bertin, E., & Arnouts, S. 1996, Astronomy and Astrophysics Supplement Series, 117, 393 , doi: 10.1051/aas:1996164
- Bian et al. (2017) Bian, F.-Y., Fan, X., McGreer, I. D., Cai, Z., & Jiang, L.-H. 2017, ApJ, 837, L12, doi: 10.3847/2041-8213/aa5ff7
- Biretta et al. (2003) Biretta, J., van Orsow, D., Sparks, W., Reinhart, M., & Vick, A. 2003, ACS Background Light vs. Bright Earth Limb Angle, Instrument Science Report ACS 2003-05, 13 pages
- Boquien et al. (2019) Boquien, M., Burgarella, D., Roehlly, Y., et al. 2019, A&A, 622, A103, doi: 10.1051/0004-6361/201834156
- Borthakur et al. (2014) Borthakur, S., Heckman, T., Leitherer, C., & Overzier, R. A. 2014, Science, 346, 216 , doi: 10.1126/science.1254214
- Bradley et al. (2022) Bradley, L., Sip ocz, B., Robitaille, T., et al. 2022, astropy/photutils: 1.5.0, 1.5.0, Zenodo, doi: 10.5281/zenodo.6825092
- Brammer & Matharu (2021) Brammer, G. B., & Matharu, J. 2021, doi: 10.5281/zenodo.5012699
- Brammer et al. (2012) Brammer, G. B., Dokkum, P. G. v., Franx, M., et al. 2012, ApJS, 200, 13, doi: 10.1088/0067-0049/200/2/13
- Bruzual & Charlot (2003) Bruzual, G., & Charlot, S. 2003, MNRAS, 344, 1000 , doi: 10.1046/j.1365-8711.2003.06897.x
- Calamida et al. (2021) Calamida, A., Mack, J., Medina, J., et al. 2021, New time-dependent WFC3 UVIS inverse sensitivities, Instrument Science Report WFC3 2021-4, 33 pages
- Calzetti et al. (2000) Calzetti, D., Armus, L., Bohlin, R. C., et al. 2000, The Astrophysical Journal, 533, 682, doi: 10.1086/308692
- Carnall et al. (2019) Carnall, A. C., McLure, R. J., Dunlop, J. S., et al. 2019, eprint arXiv:1903.11082
- Casertano et al. (2000) Casertano, S., Mello, D. F. d., Dickinson, M. E., et al. 2000, AJ, 120, 2747 , doi: 10.1086/316851
- Dale et al. (2014) Dale, D. A., Helou, G., Magdis, G. E., et al. 2014, ApJ, 784, 83, doi: 10.1088/0004-637X/784/1/83
- Dayal et al. (2020) Dayal, P., Volonteri, M., Schneider, R., et al. 2020, MNRAS, 495, 3065 , doi: 10.1093/mnras/staa1138
- Dulude et al. (2010) Dulude, M. J., Rajan, A., Viana, A., Baggett, S., & Petro, L. 2010, in Hubble after SM4. Preparing JWST, 62
- Endsley et al. (2021) Endsley, R., Stark, D. P., Chevallard, J., & Charlot, S. 2021, MNRAS, 500, 5229 , doi: 10.1093/mnras/staa3370
- Fan et al. (2006) Fan, X., Carilli, C. L., & Keating, B. 2006, ARA&A, 44, 415 , doi: 10.1146/annurev.astro.44.051905.092514
- Finkelstein et al. (2019) Finkelstein, S. L., D’Aloisio, A., Paardekooper, J.-P., et al. 2019, ApJ, 879, 36, doi: 10.3847/1538-4357/ab1ea8
- Fletcher et al. (2019) Fletcher, T. J., Tang, M., Robertson, B. E., et al. 2019, ApJ, 878, 87, doi: 10.3847/1538-4357/ab2045
- Flury et al. (2022) Flury, S. R., Jaskot, A. E., Ferguson, H. C., et al. 2022, arXiv
- Garilli et al. (2014) Garilli, B., Guzzo, L., Scodeggio, M., et al. 2014, Astronomy & Astrophysics, 562, A23, doi: 10.1051/0004-6361/201322790
- Gonzaga (2012) Gonzaga, S. 2012, The DrizzlePac Handbook, HST Data Handbook. http://adsabs.harvard.edu/abs/2012drzp.book.....G
- Griffiths et al. (2022) Griffiths, A., Conselice, C. J., Ferreira, L., et al. 2022, arXiv, doi: 10.48550/arxiv.2211.06162
- Grogin et al. (2011) Grogin, N. A., Kocevski, D. D., Faber, S. M., et al. 2011, ApJS, 197, 35, doi: 10.1088/0067-0049/197/2/35
- Guaita et al. (2017) Guaita, L., Talia, M., Pentericci, L., et al. 2017, Astronomy & Astrophysics, 606, A19, doi: 10.1051/0004-6361/201730603
- Guo et al. (2013) Guo, Y., Ferguson, H. C., Giavalisco, M., et al. 2013, ApJS, 207, 24, doi: 10.1088/0067-0049/207/2/24
- Hack et al. (2021) Hack, W. J., Cara, M., Sosey, M., et al. 2021, doi: 10.5281/zenodo.5534751
- Hasinger et al. (2018) Hasinger, G., Capak, P. L., Salvato, M., et al. 2018, ApJ, 858, 77, doi: 10.3847/1538-4357/aabacf
- Herenz et al. (2017) Herenz, E. C., Urrutia, T., Wisotzki, L., et al. 2017, Astronomy & Astrophysics, 606, A12, doi: 10.1051/0004-6361/201731055
- Hsu et al. (2014) Hsu, L.-T., Salvato, M., Nandra, K., et al. 2014, ApJ, 796, 60, doi: 10.1088/0004-637x/796/1/60
- Inoue et al. (2014) Inoue, A. K., Shimizu, I., Iwata, I., & Tanaka, M. 2014, MNRAS, 442, 1805 , doi: 10.1093/mnras/stu936
- Iwata et al. (2009) Iwata, I., Inoue, A. K., Matsuda, Y., et al. 2009, ApJ, 692, 1287 , doi: 10.1088/0004-637x/692/2/1287
- Izotov et al. (2016) Izotov, Y. I., Orlitová, I., Schaerer, D., et al. 2016, Nature, 529, 178 , doi: 10.1038/nature16456
- Izotov et al. (2021) Izotov, Y. I., Worseck, G., Schaerer, D., et al. 2021, Monthly Notices of the Royal Astronomical Society, 503, 1734, doi: 10.1093/mnras/stab612
- Izotov et al. (2018) —. 2018, MNRAS, 478, 4851 , doi: 10.1093/mnras/sty1378
- Jaskot & Oey (2013) Jaskot, A. E., & Oey, M. S. 2013, The Astrophysical Journal, 766, 91, doi: 10.1088/0004-637x/766/2/91
- Ji et al. (2020) Ji, Z., Giavalisco, M., Vanzella, E., et al. 2020, The Astrophysical Journal, 888, 109, doi: 10.3847/1538-4357/ab5fdc
- Jones et al. (2021) Jones, L. H., Barger, A. J., & Cowie, L. L. 2021, ApJ, 908, 222, doi: 10.3847/1538-4357/abd5b8
- Jones et al. (2018) Jones, L. H., Barger, A. J., Cowie, L. L., et al. 2018, ApJ, 862, 142, doi: 10.3847/1538-4357/aacef8
- Koekemoer et al. (2011) Koekemoer, A. M., Faber, S. M., Ferguson, H. C., et al. 2011, ApJS, 197, 36, doi: 10.1088/0067-0049/197/2/36
- Kokorev et al. (2022) Kokorev, V., Brammer, G., Fujimoto, S., et al. 2022, arXiv
- Kriek et al. (2015) Kriek, M. T., Shapley, A. E., Reddy, N. A., et al. 2015, ApJS, 218, 15, doi: 10.1088/0067-0049/218/2/15
- Kulkarni et al. (2019) Kulkarni, G., Keating, L. C., Haehnelt, M. G., et al. 2019, MNRAS, 485, L24 , doi: 10.1093/mnrasl/slz025
- Kurk et al. (2013) Kurk, J., Cimatti, A., Daddi, E., et al. 2013, Astronomy & Astrophysics, 549, A63, doi: 10.1051/0004-6361/201117847
- Le Fèvre et al. (2005) Le Fèvre, O., Vettolani, G., Garilli, B., et al. 2005, A&A, 439, 845, doi: 10.1051/0004-6361:20041960
- Le Fèvre et al. (2015) Le Fèvre, O., Tasca, L. A. M., Cassata, P., et al. 2015, A&A, 576, A79, doi: 10.1051/0004-6361/201423829
- Leitherer et al. (1995) Leitherer, C., Ferguson, H. C., Heckman, T. M., & Lowenthal, J. D. 1995, ApJ, 454, L19, doi: 10.1086/309760
- Lilly et al. (2007) Lilly, S. J., Fèvre, O. L., Renzini, A., et al. 2007, ApJS, 172, 70 , doi: 10.1086/516589
- Ma et al. (2020) Ma, X., Quataert, E., Wetzel, A. R., et al. 2020, MNRAS, 498, 2001 , doi: 10.1093/mnras/staa2404
- Mackenty & Smith (2012) Mackenty, J. W., & Smith, L. 2012, CTE White Paper, Tech. Rep., STScI
- Malkan et al. (2003) Malkan, M. A., Webb, W., & Konopacky, Q. 2003, ApJ, 598, 878 , doi: 10.1086/379117
- Marchi et al. (2017) Marchi, F., Pentericci, L., Guaita, L., et al. 2017, Astronomy & Astrophysics, 601, A73, doi: 10.1051/0004-6361/201630054
- Marchi et al. (2018) —. 2018, A&A, 614, A11, doi: 10.1051/0004-6361/201732133
- Masters et al. (2019) Masters, D. C., Stern, D. K., Cohen, J. G., et al. 2019, ApJ, 877, 81, doi: 10.3847/1538-4357/ab184d
- Momcheva et al. (2016) Momcheva, I. G., Brammer, G. B., Dokkum, P. G. v., et al. 2016, ApJS, 225, 27, doi: 10.3847/0067-0049/225/2/27
- Mostardi et al. (2013) Mostardi, R. E., Shapley, A. E., Nestor, D. B., et al. 2013, ApJ, 779, 65, doi: 10.1088/0004-637x/779/1/65
- Naidu et al. (2020) Naidu, R. P., Tacchella, S., Mason, C. A., et al. 2020, ApJ, 892, 109, doi: 10.3847/1538-4357/ab7cc9
- Naidu et al. (2017) Naidu, R. P., Oesch, P. A., Reddy, N. A., et al. 2017, ApJ, 847, 12, doi: 10.3847/1538-4357/aa8863
- Naidu et al. (2021) Naidu, R. P., Matthee, J., Oesch, P. A., et al. 2021, Monthly Notices of the Royal Astronomical Society, 510, 4582, doi: 10.1093/mnras/stab3601
- Nandra et al. (2015) Nandra, K., Laird, E. S., Aird, J. A., et al. 2015, ApJS, 220, 10, doi: 10.1088/0067-0049/220/1/10
- Nayyeri et al. (2017) Nayyeri, H., Hemmati, S., Mobasher, B., et al. 2017, ApJS, 228, 7, doi: 10.3847/1538-4365/228/1/7
- Nestor et al. (2013) Nestor, D. B., Shapley, A. E., Kornei, K. A., Steidel, C. C., & Siana, B. D. 2013, ApJ, 765, 47, doi: 10.1088/0004-637x/765/1/47
- Nestor et al. (2011) Nestor, D. B., Shapley, A. E., Steidel, C. C., & Siana, B. D. 2011, ApJ, 736, 18, doi: 10.1088/0004-637x/736/1/18
- Newman et al. (2013) Newman, J. A., Cooper, M. C., Davis, M., et al. 2013, ApJS, 208, 5, doi: 10.1088/0067-0049/208/1/5
- Oesch et al. (2018) Oesch, P. A., Montes, M., Reddy, N., et al. 2018, The Astrophysical Journal Supplement Series, 237, 12, doi: 10.3847/1538-4365/aacb30
- Oke & Gunn (1983) Oke, J. B., & Gunn, J. E. 1983, Astrophysical Journal, 266, 713 , doi: 10.1086/160817
- Pahl et al. (2021) Pahl, A. J., Shapley, A. E., Steidel, C. C., Chen, Y., & Reddy, N. A. 2021, MNRAS, 505, 2447 , doi: 10.1093/mnras/stab1374
- Pentericci et al. (2018) Pentericci, L., Garilli, R. J. M. B., Cucciati, O., et al. 2018, Astronomy & Astrophysics, 616, A174, doi: 10.1051/0004-6361/201833047
- Popesso et al. (2009) Popesso, P., Dickinson, M., Nonino, M., et al. 2009, A&A, 494, 443, doi: 10.1051/0004-6361:200809617
- Prichard et al. (2022) Prichard, L. J., Rafelski, M., Cooke, J., et al. 2022, The Astrophysical Journal, 924, 14, doi: 10.3847/1538-4357/ac3004
- Rafelski et al. (2015) Rafelski, M. A., Teplitz, H. I., Gardner, J. P., et al. 2015, AJ, 150, 31, doi: 10.1088/0004-6256/150/1/31
- Reddy et al. (2006) Reddy, N. A., Steidel, C. C., Erb, D. K., Shapley, A. E., & Pettini, M. 2006, ApJ, 653, 1004 , doi: 10.1086/508851
- Redshaw et al. (2022) Redshaw, C., McCabe, T., Otteson, L., et al. 2022, Research Notes of the American Astronomical Society, 6, 63, doi: 10.3847/2515-5172/ac6189
- Rivera-Thorsen et al. (2019) Rivera-Thorsen, T. E., Dahle, H., Chisholm, J., et al. 2019, eprint arXiv:1904.08186
- Robertson et al. (2015) Robertson, B. E., Ellis, R. S., Furlanetto, S. R., & Dunlop, J. S. 2015, The Astrophysical Journal Letters, 802, L19, doi: 10.1088/2041-8205/802/2/l19
- Robertson et al. (2013) Robertson, B. E., Furlanetto, S. R., Schneider, E. E., et al. 2013, ApJ, 768, 71, doi: 10.1088/0004-637x/768/1/71
- Rutkowski et al. (2017) Rutkowski, M. J., Scarlata, C., Henry, A. L., et al. 2017, ApJ, 841, L27, doi: 10.3847/2041-8213/aa733b
- Saxena et al. (2021) Saxena, A., Pentericci, L., Ellis, R. S., et al. 2021
- Shapley et al. (2016) Shapley, A. E., Steidel, C. C., Strom, A. L., et al. 2016
- Siana et al. (2015) Siana, B., Shapley, A. E., Kulas, K. R., et al. 2015, The Astrophysical Journal, 804, 17, doi: 10.1088/0004-637x/804/1/17
- Siana et al. (2007) Siana, B. D., Teplitz, H. I., Colbert, J. W., et al. 2007, ApJ, 668, 62 , doi: 10.1086/521185
- Siana et al. (2010) Siana, B. D., Teplitz, H. I., Ferguson, H. C., et al. 2010, ApJ, 723, 241 , doi: 10.1088/0004-637x/723/1/241
- Skelton et al. (2014) Skelton, R. E., Whitaker, K. E., Momcheva, I. G., et al. 2014, ApJS, 214, 24, doi: 10.1088/0067-0049/214/2/24
- Smith et al. (2018) Smith, B. M., Windhorst, R. A., Jansen, R. A., et al. 2018, ApJ, 853, 191, doi: 10.3847/1538-4357/aaa3dc
- Smith et al. (2020) Smith, B. M., Windhorst, R. A., Cohen, S. H., et al. 2020, ApJ, 897, 41, doi: 10.3847/1538-4357/ab8811
- Smith et al. (2023, in prep.) Smith et al. 2023, in prep., ApJ
- Stark (2016) Stark, D. P. 2016, ARA&A, 54, 761 , doi: 10.1146/annurev-astro-081915-023417
- Stefanon et al. (2017a) Stefanon, M., Labbé, I., Bouwens, R. J., et al. 2017a, eprint arXiv:1706.04613
- Stefanon et al. (2017b) Stefanon, M., Yan, H.-J., Mobasher, B., et al. 2017b, ApJS, 229, 32, doi: 10.3847/1538-4365/aa66cb
- Steidel et al. (2018) Steidel, C. C., Bogosavljević, M., Shapley, A. E., et al. 2018, ApJ, 869, 123, doi: 10.3847/1538-4357/aaed28
- Steidel et al. (2001) Steidel, C. C., Pettini, M., & Adelberger, K. L. 2001, The Astrophysical Journal, 546, 665, doi: 10.1086/318323
- Szalay et al. (1999) Szalay, A. S., Connolly, A. J., & Szokoly, G. P. 1999, AJ, 117, 68 , doi: 10.1086/300689
- Szokoly et al. (2004) Szokoly, G. P., Bergeron, J., Hasinger, G., et al. 2004, ApJS, 155, 271 , doi: 10.1086/424707
- Tang et al. (2019) Tang, M., Stark, D. P., Chevallard, J., & Charlot, S. 2019, Monthly Notices of the Royal Astronomical Society, 489, 2572, doi: 10.1093/mnras/stz2236
- Teplitz et al. (2013) Teplitz, H. I., Rafelski, M. A., Kurczynski, P., et al. 2013, AJ, 146, 159, doi: 10.1088/0004-6256/146/6/159
- Trump et al. (2009) Trump, J. R., Impey, C. D., Elvis, M., et al. 2009, ApJ, 696, 1195 , doi: 10.1088/0004-637x/696/2/1195
- Vanzella et al. (2007) Vanzella, E., Cristiani, S., Dickinson, M. E., et al. 2007, A&A, 478, 83 , doi: 10.1051/0004-6361:20078332
- Vanzella et al. (2010) Vanzella, E., Giavalisco, M., Inoue, A. K., et al. 2010, The Astrophysical Journal, 725, 1011, doi: 10.1088/0004-637x/725/1/1011
- Vanzella et al. (2012) Vanzella, E., Guo, Y., Giavalisco, M., et al. 2012, ApJ, 751, 70, doi: 10.1088/0004-637x/751/1/70
- Vanzella et al. (2016) Vanzella, E., Balestra, I., Gronke, M., et al. 2016, eprint arXiv:1607.03112, 465, 3803 , doi: 10.1093/mnras/stw2442
- Vanzella et al. (2018) Vanzella, E., Calura, F., Meneghetti, M., et al. 2018, eprint arXiv:1809.02617
- Vanzella et al. (2022) Vanzella, E., Castellano, M., Bergamini, P., et al. 2022, Astronomy & Astrophysics, 659, A2, doi: 10.1051/0004-6361/202141590
- Vasei et al. (2016) Vasei, K., Siana, B. D., Shapley, A. E., et al. 2016, ApJ, 831, 38, doi: 10.3847/0004-637x/831/1/38
- Wang et al. (2015) Wang, X., Hoag, A. T., Huang, K.-H., et al. 2015, ApJ, 811, 29, doi: 10.1088/0004-637x/811/1/29
- Wang et al. (2020) Wang, X., Teplitz, H., Alavi, A., et al. 2020, in American Astronomical Society Meeting Abstracts, Vol. 235, American Astronomical Society Meeting Abstracts #235, 426.03
- Wang et al. (2022a) Wang, X., Li, Z., Cai, Z., et al. 2022a, The Astrophysical Journal, 926, 70, doi: 10.3847/1538-4357/ac3974
- Wang et al. (2022b) Wang, X., Jones, T., Vulcani, B., et al. 2022b, The Astrophysical Journal Letters, 938, L16, doi: 10.3847/2041-8213/ac959e
- Windhorst et al. (2011) Windhorst, R. A., Cohen, S. H., Hathi, N. P., et al. 2011, ApJS, 193, 27, doi: 10.1088/0067-0049/193/2/27
- Wirth et al. (2004) Wirth, G. D., Willmer, C. N. A., Amico, P., et al. 2004, AJ, 127, 3121 , doi: 10.1086/420999
- Wirth et al. (2015) Wirth, G. D., Trump, J. R., Barro, G., et al. 2015, AJ, 150, 153, doi: 10.1088/0004-6256/150/5/153
- Xue et al. (2016) Xue, Y., Luo, B., Brandt, W. N., et al. 2016, ApJS, 224, 15, doi: 10.3847/0067-0049/224/2/15
- Yuan et al. (2021) Yuan, F.-T., Zheng, Z.-Y., Lin, R., Zhu, S., & Rahna, P. T. 2021, The Astrophysical Journal Letters, 923, L28, doi: 10.3847/2041-8213/ac4170