Sudarsana Reddy Kadiri, Manila Kodali, Paavo Alku
Severity Classification of Parkinson's Disease from Speech using
Single Frequency Filtering-based Features
Abstract
Developing objective methods for assessing the severity of Parkinson's disease (PD) is crucial for improving the diagnosis and treatment. This study proposes two sets of novel features derived from the single frequency filtering (SFF) method: (1) SFF cepstral coefficients (SFFCC) and (2) MFCCs from the SFF (MFCC-SFF) for the severity classification of PD. Prior studies have demonstrated that SFF offers greater spectro-temporal resolution compared to the short-time Fourier transform. The study uses the PC-GITA database, which includes speech of PD patients and healthy controls produced in three speaking tasks (vowels, sentences, text reading). Experiments using the SVM classifier revealed that the proposed features outperformed the conventional MFCCs in all three speaking tasks. The proposed SFFCC and MFCC-SFF features gave a relative improvement of 5.8% & 2.3% for the vowel task, 7.0% & 1.8% for the sentence task, and 2.4% & 1.1% for the read text task, in comparison to MFCC features.
Index Terms: Parkinson's disease, severity classification, biomarking, support vector machine.
1 Introduction
Parkinson's disease (PD) is the second most common neurodegenerative disease after Alzheimer’s disease, and it is characterized by the progressive degeneration of dopaminergic neurons in the brain, resulting in motor and non-motor symptoms. Speech impairment is a common non-motor symptom of PD, and this impairment can significantly impact the patient's quality of life. Presence of PD and its progression is typically evaluated by a neurologist or a movement disorder specialist who assess the patient's symptoms, and overall condition over time. Regular clinical evaluations, imaging studies (such as magnetic resonance imaging or positron emission tomography scans), and other tests are utilized to monitor the progression of the disease and track the effectiveness of treatment [1, 2, 3]. However, these assessments are costly, laborious and prone to bias due to the neurologist's/specialist's familiarity and experience with the patients. Therefore, developing objective methods for detecting and assessing the severity of PD is crucial for improving the diagnosis, monitoring, and treatment of the disease. Speech-based severity assessment methods can be more accessible and cost-effective than traditional clinical evaluations, making them useful tools for both healthcare professionals and patients [3, 4].
Automatic detection and severity level classification of PD from speech is facilitated by data-driven approaches based on supervised learning. This involves constructing machine learning models that are trained using speech data collected from patients and labeled by neurologists. The detection of PD (i.e., healthy parkinsonian) from speech has been investigated in many studies [5, 6, 7, 8, 9, 10, 11, 12, 13]. More details about the various types of features and approaches used in the literature can be found in [14, 15, 16, 17, 18]. The present study focuses on speech-based severity level classification of PD (i.e., healthy mild severe).
Compared to the detection task, much less research has been conducted in the severity level classification of PD [19, 20, 21, 22]. In [19], the severity level (mild moderate severe) was classified using spectral, prosody, and glottal features from speech signals produced in various speaking tasks (syllable repetition tasks, read sentences, and paragraphs, as well as monologues) with the support vector machine (SVM) classifier. In [20], the severity level of PD was studied by grouping patients and healthy talkers into a 3-class classification problem (healthy mild affected) using perturbation, spectral, cepstral, and complexity features with deep neural network (DNN) and convolutional neural network (CNN) as classifiers. In [21], automatic multi-class assessment was studied using a multi-class SVM following a one all strategy using prosody features and the monologue speaking task. In [22], authors used onset and offset transitions from various speech sounds in continuous speech with CNNs as classifiers.
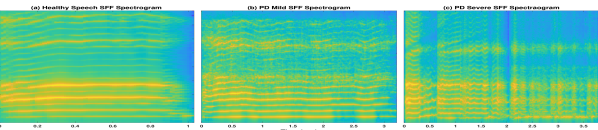
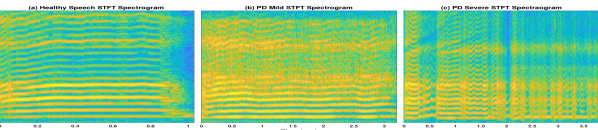
The results of [15, 23, 19, 20] suggest that spectral features such as MFCCs perform better than conventional features such as phonatory/glottal and prosodic features in detection and severity classification of PD. Motivated by this, the current study investigates cepstral coefficients derived using a recently proposed signal processing method, single frequency filtering (SFF) [24, 25]. Two feature sets are derived: (1) single frequency filtering cepstral coefficients (denoted as SFFCC) and (2) MFCCs computed from the SFF spectrum (denoted as MFCC-SFF). The SFF method was shown in [25, 26, 27] to provide higher spectral and temporal resolution for deriving speech features compared to the short-time Fourier transform (STFT), which is used in the computation of conventional MFCCs. Illustrations of spectrograms obtained with SFF and STFT are shown in Figs. 1 and 2, respectively, for healthy speech and for PD speech of mild and severe levels. From the figures, it can be clearly seen that the SFF spectrogram highlights spectral information clearly (with sharper harmonics) compared to the STFT spectrogram.
The major contributions of this study are:
-
•
The effectiveness of the cepstral coefficients derived from the SFF spectrum (SFFCC and MFCC-SFF) is studied for severity level classification of PD from speech.
-
•
A systematic comparison is conducted in severity level classification of PD between three speaking tasks (production of vowels, production of sentences as well as a text reading task).
The paper is organized as follows. Section 2 describes the SFF method and feature extraction from SFF method. Section 3 describes the experimental protocol including the database, baseline features and prior studies for comparison, classifier and evaluation metrics. Results and discussion on classification experiments are presented in Section 4. A summary of the paper is given in Section 5.
2 Single Frequency Filtering (SFF)-based Features
SFF is a time-frequency analysis technique, which provides an amplitude envelope of the speech signal as a function of time for a selected frequency [24, 25]. In this method, the speech signal is first frequency-shifted (i.e., modulated) by multiplying it with an exponential function:
| (1) |
where is the sampling frequency, , and is the desired frequency. Then the frequency-shifted signal is filtered through a single-pole filter, whose root () is located on the negative real axis. The transfer function of the filter is given by:
| (2) |
The output of the filter can be expressed as:
| (3) |
The magnitude or amplitude envelope and the phase of the signal at frequency can be written as:
| (4) |
and
| (5) |
Here and are the real and imaginary parts of , respectively. The amplitude envelope of the signal can be computed for several frequencies at intervals of by defining as follows:
| (6) |
where The SFF magnitude spectrum can be obtained for each instant of time from .
2.1 Extraction of the SFFCC features
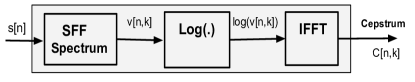
SFFCCs are extracted by computing the cepstrum (). Cepstrum is derived from the SFF spectrum () as follows:
| (7) |
where IFFT is the inverse Fourier transform. From cepstrum , the first 13 cepstral coefficients (including ) are considered and they are referred to as SFFCC. Apart from the static coefficients, the delta () and double-delta () coefficients are also computed, which results in a 39-dimensional feature vector. A schematic block diagram describing the steps involved in the extraction of SFFCC is shown in Fig. 3.
2.2 Extraction of the MFCC-SFF features
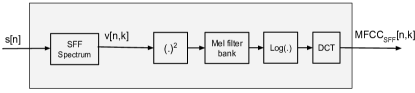
A schematic block diagram describing the steps involved in the extraction of MFCCs from the SFF spectrum is shown in Fig. 4. The MFCC extraction consists of mel filterbank analysis on the SFF spectrum followed by logarithm and discrete cosine transform (DCT) operations. This is expressed as follows:
| (8) |
where denotes the mel-cepstrum. The resulting cepstral coefficients are referred as MFCCSFF, and they represent compactly the spectral characteristics of speech. From the mel-cepstrum, the first 13 cepstral coefficients (including the ) are considered. Apart from the static coefficients, the and coefficients are also computed, which results in a 39-dimensional feature vector.
3 Experimental Protocol
This section describes the speech database used in the experiments, the reference features that were selected for comparison and the classifier.
3.1 Database
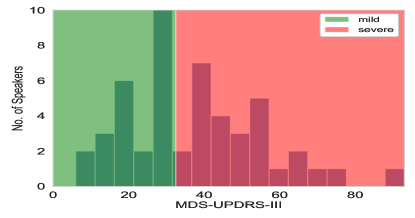
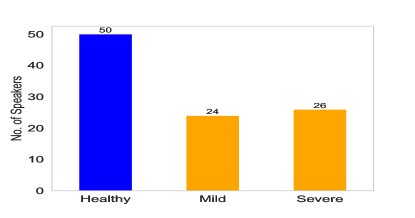
This study uses publicly available PC-GITA, a repository of Spanish parkinsonian speech [29]. The database is balanced with respect to gender and age, and it consists of speech recordings from 50 PD patients (25 female and 25 male) and 50 healthy control speakers (HCs) (25 female and 25 male). For the male PD patients, the age range is between 33 and 77 years (mean 62.3 years), for the female PD patients, the age range is between 44 and 75 years (mean 60.2 years). For the male HCs, the age range is between 31 and 86 years (mean 61.3 years), and for the female HCs, the age range is between 43 and 76 years (mean 60.8 years). The database consists of different speaking tasks including productions of vowels, sentences, diadochokinetic words, as well as text reading and a monologue task. In this study, we considered the vowel task, the sentence task and the read text task. The vowel task includes three repetitions of five Spanish vowels. The sentence task includes productions of six different sentences. The read text task consists of a dialog between a doctor and a speaker, and this task is phonetically balanced (36 words). All the patients were diagonsed by neurologists, and their disease severity was labeled according to the modified H & Y scale and the MDS-UPDRS-III. The MDS-UPDRS-III scale is based on the motor examination and it consists of 33 items, where each of the item ranges from 0 (normal) to 4 (severe). The database was partitioned into three severity classes (healthy, mild, and severe) according to the MDS-UPDRS-III scores. Figure 5 shows the distribution of the MDS-UPDRS-III and the number of speakers per each class. This study uses the balanced number of speakers for each class. Further details of the database can be found in [29, 30].
 |
 |
3.2 Baseline features and reference classifiers of a prior study
The most popular speech features, namely MFCCs [31, 32, 15, 19], are used as the baseline features. The first 13 MFCCs (including ) are extracted using a Hamming window size of ms and a shift of ms. Apart from the above static coefficients, the and coefficients are also computed resulting in a 39-dimensional feature vector. In addition to the baseline MFCCs, we compared the results of the current study also with the results reported in [20], where a protocol similar to this study was utilized using only the vowel task. In [20], perturbation, spectral, cepstral and complexity features were used together with a DNN, and the modulation spectrum was used with a CNN and multi-modal architectures.
3.3 Parameters used for the SFF-based features
For the SFF spectrum estimation, and Hz (resulting in 512 amplitude envelopes) are used. SFFCC and MFCC-SFF are extracted with an interval of ms rather than considering every time instant. The number of mel-filters used is 80, and the first 39 cepstral coefficients are extracted for both of the features. Frame-wise features (for baseline and proposed) are merged into a 1-dimensional feature vector by taking the mean.
3.4 Classifier and evaluation metrics
Severity classification experiments were carried out using the SVM classifier (linear kernel in the one-vs-one architecture, with c and gamma parameters in the range of to ), which is known to be an effective classifier when the amount of training data is limited. The experiments were conducted with leave-one-speaker-out (LOSO) cross-validation, where one speaker's data was considered as a test set and the remaining speakers' data was used for training the classifier. In each fold, the evaluation metrics were saved, and the procedure was repeated for all the speakers, and finally the evaluation metrics were averaged.
The metrics chosen are the balanced classification accuracy (also known as unweighted average recall (UAR)), class-wise precision, class-wise recall, and class-wise F1 score. We also used confusion matrices for assessing the performance of the classification systems.
4 Results and Discussion
| Vowel task | ||||||||||
| Feature | Accuracy | Precision-0 | Recall-0 | F1 score-0 | Precision-1 | Recall-1 | F1 score-1 | Precision-2 | Recall-2 | F1 score-2 |
| MFCC | 48.7 ± 7 | 0.53 | 0.57 | 0.55 | 0.40 | 0.38 | 0.39 | 0.45 | 0.45 | 0.45 |
| SFFCC | 51.5 ± 4 | 0.50 | 0.56 | 0.52 | 0.43 | 0.40 | 0.42 | 0.49 | 0.46 | 0.47 |
| MFCC-SFF | 49.8 ± 5 | 0.49 | 0.54 | 0.52 | 0.42 | 0.42 | 0.42 | 0.45 | 0.42 | 0.44 |
| Sentence task | ||||||||||
| MFCC | 54.5 ± 8 | 0.53 | 0.61 | 0.57 | 0.52 | 0.45 | 0.48 | 0.63 | 0.62 | 0.62 |
| SFFCC | 58.3 ± 7.8 | 0.60 | 0.63 | 0.62 | 0.53 | 0.51 | 0.52 | 0.62 | 0.61 | 0.62 |
| MFCC-SFF | 55.5 ± 8 | 0.58 | 0.60 | 0.59 | 0.54 | 0.53 | 0.54 | 0.62 | 0.61 | 0.61 |
| Read text task | ||||||||||
| MFCC | 61.5 ± 10 | 0.59 | 0.79 | 0.68 | 0.45 | 0.42 | 0.43 | 0.50 | 0.38 | 0.43 |
| SFFCC | 63.0 ± 12 | 0.55 | 0.75 | 0.63 | 0.44 | 0.33 | 0.38 | 0.62 | 0.54 | 0.58 |
| MFCC-SFF | 62.2 ± 13 | 0.58 | 0.62 | 0.60 | 0.46 | 0.46 | 0.46 | 0.50 | 0.46 | 0.48 |
| MFCC | SFFCC | MFCC-SFF |
|---|---|---|
|
Actual class 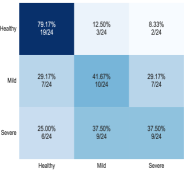
|
 |
 |
Predicted class
| Class-wise accuracies | ||||
| Accuracy | Healthy | Mild | Severe | |
| Current study | ||||
| SFFCC (SVM) | 51.5 4 | 55.9 | 40.4 | 45.6 |
| MFCC-SFF (SVM) | 49.8 5 | 54.2 | 40.9 | 42.5 |
| Previous study [20] | ||||
| DNN | 50.0 9 | 30.9 | 43.6 | 70.0 |
| CNN | 41.0 5 | 68.0 | 21.8 | 33.3 |
| Multi-modal | 52.0 7 | 63.9 | 40.0 | 46.7 |
This section reports the results of the experiments for the three speaking tasks (vowels, sentences and read text) by first describing the classification accuracies obtained and then describing the confusion matrices. Table 1 shows the results in terms of the mean and standard deviation of accuracy along with class-wise precision, recall and F1-score. From the results in the table, it can be observed that the performance of both of the proposed features (SFFCC and MFCC-SFF) is clearly better than the baseline MFCCs features for all the three speaking tasks. From the speaking tasks, the performance of the read text task is better that of the sentence and vowel tasks. Between the sentence and vowel tasks, the former task gave better results. Taken together, the order of preference for the speaking tasks is:
.
This trend was expected as the read text task included richer articulation information (due to phonetically balanced sounds) which is helpful for severity classification. From the metrics based on precision, recall and F1 score, it is evident that the MFCC features are more biased towards the healthy class (specifically in the vowel and read text tasks) compared to the proposed features. Overall, the proposed SFFCC and MFCC-SFF features gave an absolute improvement of 2.8% and 1.1% (relative improvement of 5.8% and 2.3%) for the vowel task, 3.8% and 1.0% (relative improvement of 7.0% and 1.8%) for the sentence task, and 1.5% and 0.7% (relative improvement of 2.4% and 1.1%) for the read text task, in comparison to the baseline MFCC features. Between the two proposed features, SFFCC performed better than MFCC-SFF.
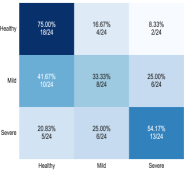
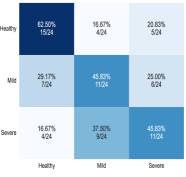
Figure 6 shows the confusion matrices for the MFCC (left), SFFCC (middle) and MFCC-SFF (right) features in the read text task. This figure shows clearly that all the features are biased towards healthy class. Among the features, the proposed features are, however, less biased towards health class compared to the MFCC features. This is also in conformity with the performances reported in Table 1.
Table 2 reports the performance of the proposed SFFCC and MFCC-SFF features for the vowel task by showing the results of the previous reference study [20]. It can be seen that the performance of the proposed features is better than in the reference study (except for the multi-modal system). In addition, we would like to note that the standard deviations in accuracy are lower for the proposed features in comparison to the prior study. The results of the experiments indicate that the proposed features effectively capture speech articulation variations which reflect changes in the disease severity.
5 Summary
In this study, we proposed two sets of features derived from the SFF spectrum (SFFCC and MFCC-SFF) for the severity classification of PD from speech. The classification experiments were carried out with three speaking tasks (sustained vowels, sentences and read text) of the well-known PC-GITA database. The experiments with the SVM classifier revealed that the proposed SFFCC and MFCC-SFF features outperformed the conventional MFCCs features in all three speaking tasks. Among the speaking tasks, the classification performance was highest for the text reading task and lowest for the vowel production task. This trend is due to the larger diversity of articulation information in speech signals produced in the text reading task (due to phonetically balanced sounds), which is helpful for severity classification.
6 Acknowledgements
This study was funded by the Academy of Finland (project no. 330139).
References
- [1] S. Shinde, S. Prasad, Y. Saboo, R. Kaushick, J. Saini, P. K. Pal, and M. Ingalhalikar, ``Predictive markers for Parkinson's disease using deep neural nets on neuromelanin sensitive MRI,'' NeuroImage: Clinical, vol. 22, p. 101748, 2019.
- [2] L. V. Kalia and A. E. Lang, ``Parkinson's disease.'' Current neurology and neuroscience reports., Aug 2015.
- [3] J. Rusz, Detecting speech disorders in early Parkinson's disease by acoustic analysis. Habilitation thesis, Czech Technical University in Prague, 2018.
- [4] S. Arora, L. Baghai-Ravary, and A. Tsanas, ``Developing a large scale population screening tool for the assessment of Parkinson's disease using telephone-quality voice,'' The Journal of the Acoustical Society of America, vol. 145, no. 5, pp. 2871–2884, 2019.
- [5] M. Cernak et al., ``Characterisation of voice quality of Parkinson's disease using differential phonological posterior features,'' Computer Speech & Language, vol. 46, pp. 196 – 208, 2017.
- [6] A. Tsanas, M. A. Little, P. E. McSharry, and L. O. Ramig, ``Nonlinear speech analysis algorithms mapped to a standard metric achieve clinically useful quantification of average Parkinson's disease symptom severity,'' Journal of the Royal Society Interface, vol. 8, no. 59, pp. 842–855, 2011.
- [7] J. R. Orozco-Arroyave, E. A. Belalcazar-Bolanos, J. D. Arias-Londoño, J. F. Vargas-Bonilla, S. Skodda, J. Rusz, K. Daqrouq, F. Hönig, and E. Nöth, ``Characterization methods for the detection of multiple voice disorders: neurological, functional, and laryngeal diseases,'' IEEE Jour. of Biomed. and Health Infor., vol. 19, no. 6, pp. 1820–1828, 2015.
- [8] M. Little, P. McSharry, E. Hunter, J. Spielman, and L. Ramig, ``Suitability of dysphonia measurements for telemonitoring of Parkinson's disease,'' IEEE Trans. Biomed. Eng., vol. 56, p. 1015, 2009.
- [9] J. C. Vásquez-Correa, J. R. Orozco-Arroyave, and E. Nöth, ``Convolutional neural network to model articulation impairments in patients with Parkinson's disease.'' in Proceedings of the Eighteenth Annual Conference of the International Speech Communication Association, 2017, pp. 314–318.
- [10] P. A. Pérez-Toro, J. C. Vásquez-Correa, M. Strauss, J. R. Orozco-Arroyave, and E. Nöth, ``Natural language analysis to detect Parkinson's disease,'' in International Conference on Text, Speech, and Dialogue, 2019, pp. 82–90.
- [11] B. Erdogdu Sakar, G. Serbes, and C. O. Sakar, ``Analyzing the effectiveness of vocal features in early telediagnosis of Parkinson's disease,'' PloS One, vol. 12, no. 8, p. e0182428, 2017.
- [12] L. Parisi, N. RaviChandran, and M. L. Manaog, ``Feature-driven machine learning to improve early diagnosis of Parkinson's disease,'' Expert Systems with Applications, vol. 110, pp. 182–190, 2018.
- [13] L. Moro-Velazquez, J. A. Gomez-Garcia, J. I. Godino-Llorente, J. Villalba, J. Rusz, S. Shattuck-Hufnagel, and N. Dehak, ``A forced gaussians based methodology for the differential evaluation of Parkinson's disease by means of speech processing,'' Biomed. Signal Process. and Contr., vol. 48, pp. 205–220, 2019.
- [14] A. Tsanas, M. A. Little, P. E. McSharry, J. L. Spielman, and L. O. Ramig, ``Novel speech signal processing algorithms for high-accuracy classification of Parkinson's disease,'' IEEE Trans. Biomed. Engineering, vol. 59, no. 5, pp. 1264–1271, 2012.
- [15] J. R. Orozco-Arroyave, F. Hönig, J. Arias-Londoño, J. Vargas-Bonilla, K. Daqrouq, S. Skodda, J. Rusz, and E. Nöth, ``Automatic detection of Parkinson's disease in running speech spoken in three different languages,'' The Journal of the Acoustical Society of America, vol. 139, no. 1, pp. 481–500, 2016.
- [16] J. Mekyska, E. Janousova, P. Gomez-Vilda, Z. Smekal, I. Rektorova, I. Eliasova, M. Kostalova, M. Mrackova, J. B. Alonso-Hernandez, M. Faundez-Zanuy, and K. L. de Ipiña, ``Robust and complex approach of pathological speech signal analysis,'' Neurocomputing, vol. 167, pp. 94 – 111, 2015.
- [17] N. Cummins, A. Baird, and B. Schuller, ``Speech analysis for health: Current state-of-the-art and the increasing impact of deep learning,'' Methods, vol. 151, pp. 41–54, 2018.
- [18] J. Hlavnička, R. Čmejla, T. Tykalová, K. Šonka, E. Rŭžička, and J. Rusz, ``Automated analysis of connected speech reveals early biomarkers of Parkinson's disease in patients with rapid eye movement sleep behaviour disorder,'' Scientific Reports, vol. 7, no. 1, pp. 1–13, 2017.
- [19] T. Bocklet, S. Steidl, E. Nöth, and S. Skodda, ``Automatic evaluation of Parkinson's speech-acoustic, prosodic and voice related cues.'' in Interspeech, 2013, pp. 1149–1153.
- [20] J. D. Arias-Londoño and J. A. Gómez-García, ``Predicting UPDRS scores in Parkinson’s disease using voice signals: A deep learning/transfer-learning-based approach,'' in Automatic Assessment of Parkinsonian Speech Workshop, 2019, pp. 100–123.
- [21] T. Arias-Vergara, J. C. Vasquez-Correa, J. R. Orozco-Arroyave, P. Klumpp, and E. Nöth, ``Unobtrusive monitoring of speech impairments of Parkinson's disease patients through mobile devices,'' in International Conference on Acoustics, Speech and Signal Processing, 2018, pp. 6004–6008.
- [22] J. C. Vásquez-Correa, T. Arias-Vergara, J. R. Orozco-Arroyave, B. Eskofier, J. Klucken, and E. Nöth, ``Multimodal assessment of parkinson's disease: A deep learning approach,'' IEEE Journal of Biomed. and Health Inf., vol. 23, no. 4, pp. 1618–1630, 2019.
- [23] A. Benba, A. Jilbab, and A. Hammouch, ``Discriminating between patients with Parkinson’s and neurological diseases using cepstral analysis,'' IEEE Transactions on Neural Systems and Rehabilitation Engineering, vol. 24, no. 10, pp. 1100–1108, Oct 2016.
- [24] G. Aneeja and B. Yegnanarayana., ``Single frequency filtering approach for discriminating speech and nonspeech,'' IEEE/ACM Trans. on Audio, Speech, and Lang. Process., vol. 23, no. 4, pp. 705–717, Apr. 2015.
- [25] S. R. Kadiri and B. Yegnanarayana, ``Epoch extraction from emotional speech using single frequency filtering approach,'' Speech Communication, vol. 86, pp. 52 – 63, 2017.
- [26] ——, ``Analysis and detection of phonation modes in singing voice using excitation source features and single frequency filtering cepstral coefficients (SFFCC),'' in Proc. INTERSPEECH, 2018, pp. 441–445.
- [27] S. R. Kadiri, R. Kethireddy, and P. Alku, ``Parkinson's disease detection from speech using single frequency filtering cepstral coefficients.'' in Interspeech, 2020, pp. 4971–4975.
- [28] R. Kethireddy, S. R. Kadiri, and S. V. Gangashetty, ``Deep neural architectures for dialect classification with single frequency filtering and zero-time windowing feature representations,'' The Journal of the Acoustical Society of America, vol. 151, no. 2, pp. 1077–1092, 2022.
- [29] J. R. Orozco-Arroyave, J. D. Arias-Londoño, J. F. Vargas-Bonilla, M. C. Gonzalez-Rátiva, and E. Nöth, ``New Spanish Speech Corpus Database for the Analysis of People Suffering from Parkinson's Disease.'' in LREC, 2014, pp. 342–347.
- [30] J. Rusz, R. Cmejla, T. Tykalova, H. Ruzickova, J. Klempir, V. Majerova, J. Picmausova, J. Roth, and E. Ruzicka, ``Imprecise vowel articulation as a potential early marker of Parkinson's disease: Effect of speaking task,'' The Journal of the Acoustical Society of America, vol. 134, no. 3, pp. 2171–2181, 2013.
- [31] J. I. Godino-Llorente, S. Aguilera-Navarro, and P. G. Vilda, ``Lpc, LPCC and MFCC parameterisation applied to the detection of voice impairments,'' in INTERSPEECH, 2000, pp. 965–968.
- [32] P. Henríquez, J. B. Alonso, M. A. Ferrer, C. M. Travieso, J. I. Godino-Llorente, and F. Díaz-de-María, ``Characterization of healthy and pathological voice through measures based on nonlinear dynamics,'' IEEE Transactions on Audio, Speech, and Language Processing, vol. 17, no. 6, pp. 1186–1195, 2009.