Who is the Real Hero? Measuring Developer Contribution via Multi-dimensional Data Integration
Abstract
Proper incentives are important for motivating developers in open-source communities, which is crucial for maintaining the development of open-source software healthy. To provide such incentives, an accurate and objective developer contribution measurement method is needed. However, existing methods rely heavily on manual peer review, lacking objectivity and transparency. The metrics of some automated works about effort estimation use only syntax-level or even text-level information, such as changed lines of code, which lack robustness. Furthermore, some works about identifying core developers provide only a qualitative understanding without a quantitative score or have some project-specific parameters, which makes them not practical in real-world projects.
To this end, we propose CValue, a multidimensional information fusion-based approach to measure developer contributions. CValue extracts both syntax and semantic information from the source code changes in four dimensions: modification amount, understandability, inter-function and intra-function impact of modification. It fuses the information to produce the contribution score for each of the commits in the projects. Experimental results show that CValue outperforms other approaches by 19.59% on 10 real-world projects with manually labeled ground truth. We validated and proved that the performance of CValue, which takes 83.39 seconds per commit, is acceptable to be applied in real-world projects. Furthermore, we performed a large-scale experiment on 174 projects and detected 2,282 developers having inflated commits. Of these, 2,050 developers did not make any syntax contribution; and 103 were identified as bots.
Index Terms:
Open-Source Incentive, Mining Software Repositories, Program Analysis.I Introduction
The Internet is dominated by open-source software, from end-user to server-side [1]. These open-source projects, have become the foundation of widely used modern software, and are developed and maintained by passionate, yet often unpaid, developers. Effective open-source development requires cooperation and recognition of the contribution of each developer [2, 3]. Web3 projects, such as TEA [4] and GitCoin [5], started to realize the importance of motivating developers in open-source communities. However, they lack proper methods to measure the contribution of each collaborator. Existing measurement methods mainly rely on peer review, and lack objectivity and transparency, contravening the principles of Web3 projects. An unfair allocation may significantly decrease efficiency and harm developer morale. Therefore, an objective method to measure the value of each developer who contributed to the project is necessary [6, 7].
No existing study focuses on measuring the value provided by developers in software, but there are some similar topics. Several studies about developing effort estimation methods, such as COCOMA [8, 9] and its variants, estimate the effort needed to implement specific functionality. However, these methods only consider code at the syntax or text level, lacking a deeper understanding of the semantics of modified code segments, and failing to pay attention to the difference between different types of modifications. There are other studies that focus on identifying core developers within a team. For example, studies such as Mockus et al. [10] and Bella et al. [11] focus on identifying core developers based on metrics like lines of code, commits, complexity, and comment modifications. Joblin et al. [12] and Cheng et al. [13] propose network-based and activity-based approaches, respectively. These studies focus on classifying developers into different categories rather than quantifying their contribution, which could not be applied to solve the measurement problem. A study by Tasy et al. [14] calculates the effort in pull requests from GitHub, considering the communication between developers in open-source communities. Some of the data used in these researches do not commonly exist in open-source projects or require domain knowledge to understand and analyze, such as pull requests from GitHub, file modification other than the code, etc.
Considering the previously mentioned issues, developing a robust code-based developer contribution metric algorithm for benefit allocation faces several challenges. First, the analysis should base on code changes that exist in all kinds of projects. Second, the analysis approach should focus on the changes made at the syntax level, where the quantity of modifications directly reflects the contribution of developers. Third, the analysis should also consider the semantic level, since syntax-level changes alone are not enough to accurately reflect the value a developer adds to the project. For instance, formatting and moving code provide few semantic changes, which contribute little to the project, but adding features or fixing bugs may cause semantic breaking [15, 16]. Fourth, the analysis method must take into account the interaction of the changed part and the whole program, which is important for developers to understand the project and make proper modifications.
To address these challenges, we propose ContributionValue, a method that integrates code-based multi-dimensional features. CValue leverages four types of information to assess code changes from different perspectives and produce a comprehensive score to measure the extent to which the developer contributes valuable code to the project. For the first and second challenges, CValue uses AST differences to measure syntax-level changes in code, and exclude some non-semantic change patterns, such as changing the name of variables. For the third challenge, CValue takes into account complexity metrics, including cyclomatic complexity, lines of code, Halstead volume [17], and percentage of comments, to measure the effort required to understand the existing code. For the fourth challenge, a call graph is built, and the position of the changed code segment in the call graph is used to represent its interaction with the whole project, and furthering measure the inter-function consideration of the developer when modifying the code. CValue also traces the data flow and control flow of the variables involved in the change, evaluating the range of context that should be considered by developers when making modifications to the code segment. In the end, CValue integrates information from these four aspects and provides a more comprehensive view of the change from the code level.
To evaluate the effectiveness of CValue, we manually labeled 1,398 commits on 10 popular projects under the Google OSS-Fuzz project [18] to construct the ground truth. The experimental results indicated that CValue outperformed the baseline methods, with a Spearman correlation of 19.59%. On the given project, the average time spent on each commit during the CValue analysis was 83.39 seconds, with a maximum of 121.04 seconds.
In summary, the main contributions of this paper are:
-
1.
We proposed CValue, a framework for quantifying the contribution made by developers in code commits.
-
2.
We built an incremental dependency extraction tool, which optimized the time cost for analysis on git repositories.
-
3.
We conducted an empirical study with CValue on 174 open source projects and found 2,282 developers with significant gaps in their number of commits and CValue to the project.
-
4.
Our data and artifact are published on the website111https://sites.google.com/view/ase23contributionmeasurement.
II Related Works
Previous research primarily focused on estimating the effort required for the completion of development tasks or identifying the key or valuable developers within a project, which cannot be applied to contribution measurement and motivating developers. There was a lack of studies specifically measuring the overall value that developers contribute to a project.
One similar topic, effort estimation, has been widely researched. One commonly used method for effort estimation is the COCOMO model [8, 9], which is based on a regression analysis of lines of code. Several studies have attempted to improve the accuracy of the COCOMO model by incorporating additional information, such as neural networks [19, 20, 21]. However, they are not suitable for large-scale analysis as the parameters of the model need to be determined by the project manager of each project. Furthermore, it has been established that the number of lines of code modified alone is not a reliable indicator of developer contributions [22, 23].
Recently, Yin et al. [24] and Ren et al. [25] proposed an approach to measure developer contributions using a call-graph-based DevRank algorithm. This approach uses not only the number of lines of code modified but also the position of the code in the call graph and the type of modification. Natural Language Processing (NLP) techniques were applied to process commit messages in order to distinguish different types of commits and assign different weights to different types of modifications. The final contribution value was obtained by combining these two metrics using a Learning to Rank (L2R) [26] method. However, the authors did not address the issue of determining the weights for different types of modifications and whether the parameters of the L2R method are shared across projects.
Previous research on identifying core developers in software development projects has employed a variety of methods. Mockus et al. [10] used the number of lines of code committed by each developer as the sole criterion for classification. Bella et al. [11] employed a multivariate analysis that considered lines of code, number of commits, complexity, comment modifications, structural changes, and non-structural changes. Jergensen et al. [27] only considered the activities of developers, such as the number of lines of code added, which may not accurately reflect their role in the project. Joblin et al. [12] proposed a network-based approach that took into account cooperation in version control systems and email networks. Cheng et al. [13] and Izquierdo et al. [28] used activity-based role detection methods, by considering code contribution, opinion contribution, network interactions, and administration roles. Çetin et al. [29] used the change history of each file to determine the corresponding developer and divided the developers in the community into three roles, including Jacks, Mavens, and Connectors. Robles et al. [30] used the frequency of committing code in a certain period, Bella et al. [11] used the number of lines of code, the number of files, complexity (McCabe cyclomatic complexity [31]), and structure/non-structure modifications, etc. to classify developers into different roles. However, these methods treat identifying core developers as a classification problem rather than quantifying the contribution of each individual and are therefore not suitable for this allocation problem.
III Methodology
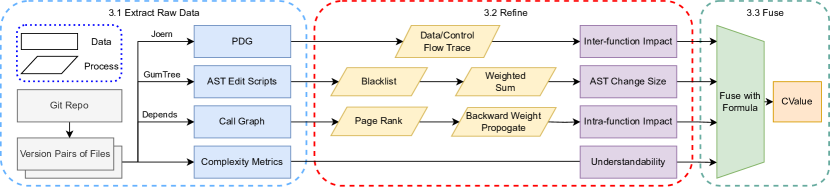
Figure 1 illustrates the overview of CValue, which have three steps. In the first step, four kinds of information are extracted from the files, which are program dependence graph (PDG), abstract syntax tree (AST) edit scripts, call graph, and complexity metrics. In the second step, we process the extracted raw data, converting them into a series of values that reflect the considerations of developers from four perspectives when modifying the code, which are the AST change size, understandability, inter-function, and intra-function impact of the changed code segment. Finally, we fuse the values from the four perspectives into a single value, used to measure the contribution of developers.
III-A Data Extraction
CValue involves extracting four dimensions of raw information from the code to accurately measure the value contributed by programmers. These dimensions include AST difference, complexity metrics, call graph, and program dependence graph. The procedures for extracting these dimensions will be discussed in detail in the following section of the paper.
III-A1 AST Difference - Syntax Level Change
One of the dimensions used in CValue is the AST difference, which quantifies the amount of code that has been changed. This is achieved by comparing the tree of files from two versions. The use of AST (Abstract Syntax Tree) provides a syntax-level view of the code. This metric allows us to effectively filter out changes that do not produce syntax changes, such as adjustments of code format, modifications to comments, and changes of variable names. Additionally, it allows us to distinguish different types of modifications, such as additions and deletions of AST nodes.
To extract the AST difference, we use the mapping policy of GumTree [32]. GumTree generates the difference and edit scripts between two source code files, which describe how to change from one version to another. After the extraction, we obtain the edit script, which provides us with the exact content of each change. We count the different types of modification operations grouped by each method for subsequent analysis.
III-A2 Complexity - Readability
To reflect the effort required to read and understand a specific code segment, we use method-level complexity metrics. A more complex code is harder to understand and maintain, and thus, developers should put more effort into making changes to such code, and CValue will give a higher weight to code with higher complexity. The complexity metrics include four parts: 1) Lines of Code of a function. A function with a larger number of code lines is often harder to comprehend. 2) Halstead Volume [33]. Line of Code does not consider the length of each line. Halstead Volume is based on the number of operators and operands, which prevents the calculation method from being attacked simply by increasing the number of lines of code. 3) Percentage of comments. Comments help developers understand the logic of the source code. 4) Cyclomatic Complexity [31]. Cyclomatic Complexity (CC) is a measure of the possible execution paths of a function. A larger CC means that the function has more possible execution paths, and thus, the function is more complex and difficult to understand.
III-A3 Call Graph - Inter-function impact of changes
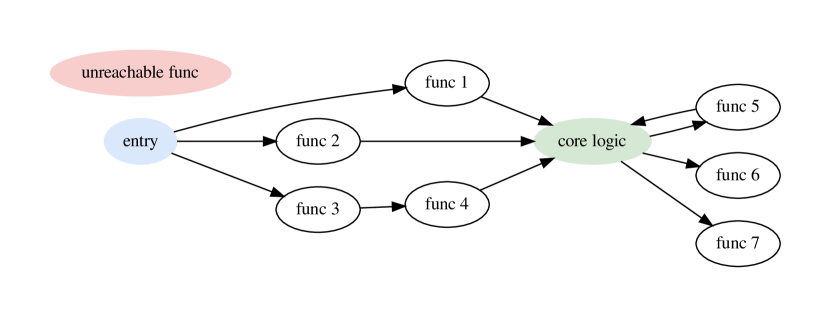
Considering the cohesion among various components is crucial for programmers when making modifications, as software is an integrated entity composed of different parts. Developers need to exercise greater caution when editing code at core positions, thus CValue assigns a higher weight to such modifications. For example, as shown in Figure 2, CValue assigns a higher weight to developers who make modifications to the core logic. Conversely, developers who make modifications to less important code segments or even unreachable code will be assigned a lower weight by CValue.
To do this, we use the call graph, which presents a kind of dependency in the given program. The call graph is extracted using Depends [34], a tool for extracting dependencies in multiple languages based on source code. We will further describe how to calculate the call graph into the inter-function interaction of the modified code segment in the next section.
However, since extracting the call graph could be a time-consuming task, we used an incremental dependency extraction tool based on Depends to obtain the call graph for each version. This incremental analysis approach builds the call graph sequentially based on the software version tree in the Git repository using a depth-first traversal method. When the software version changes, only the dependencies involved in the modified file are updated, while other dependencies related to unmodified files are not updated. Additionally, when there is a fork in the software version tree, the dependency extraction tool caches the version before the fork. Once the analysis of one branch is finished, it restores the cached results and begins the analysis of another branch.
III-A4 PDG - Intra-function impact of changes
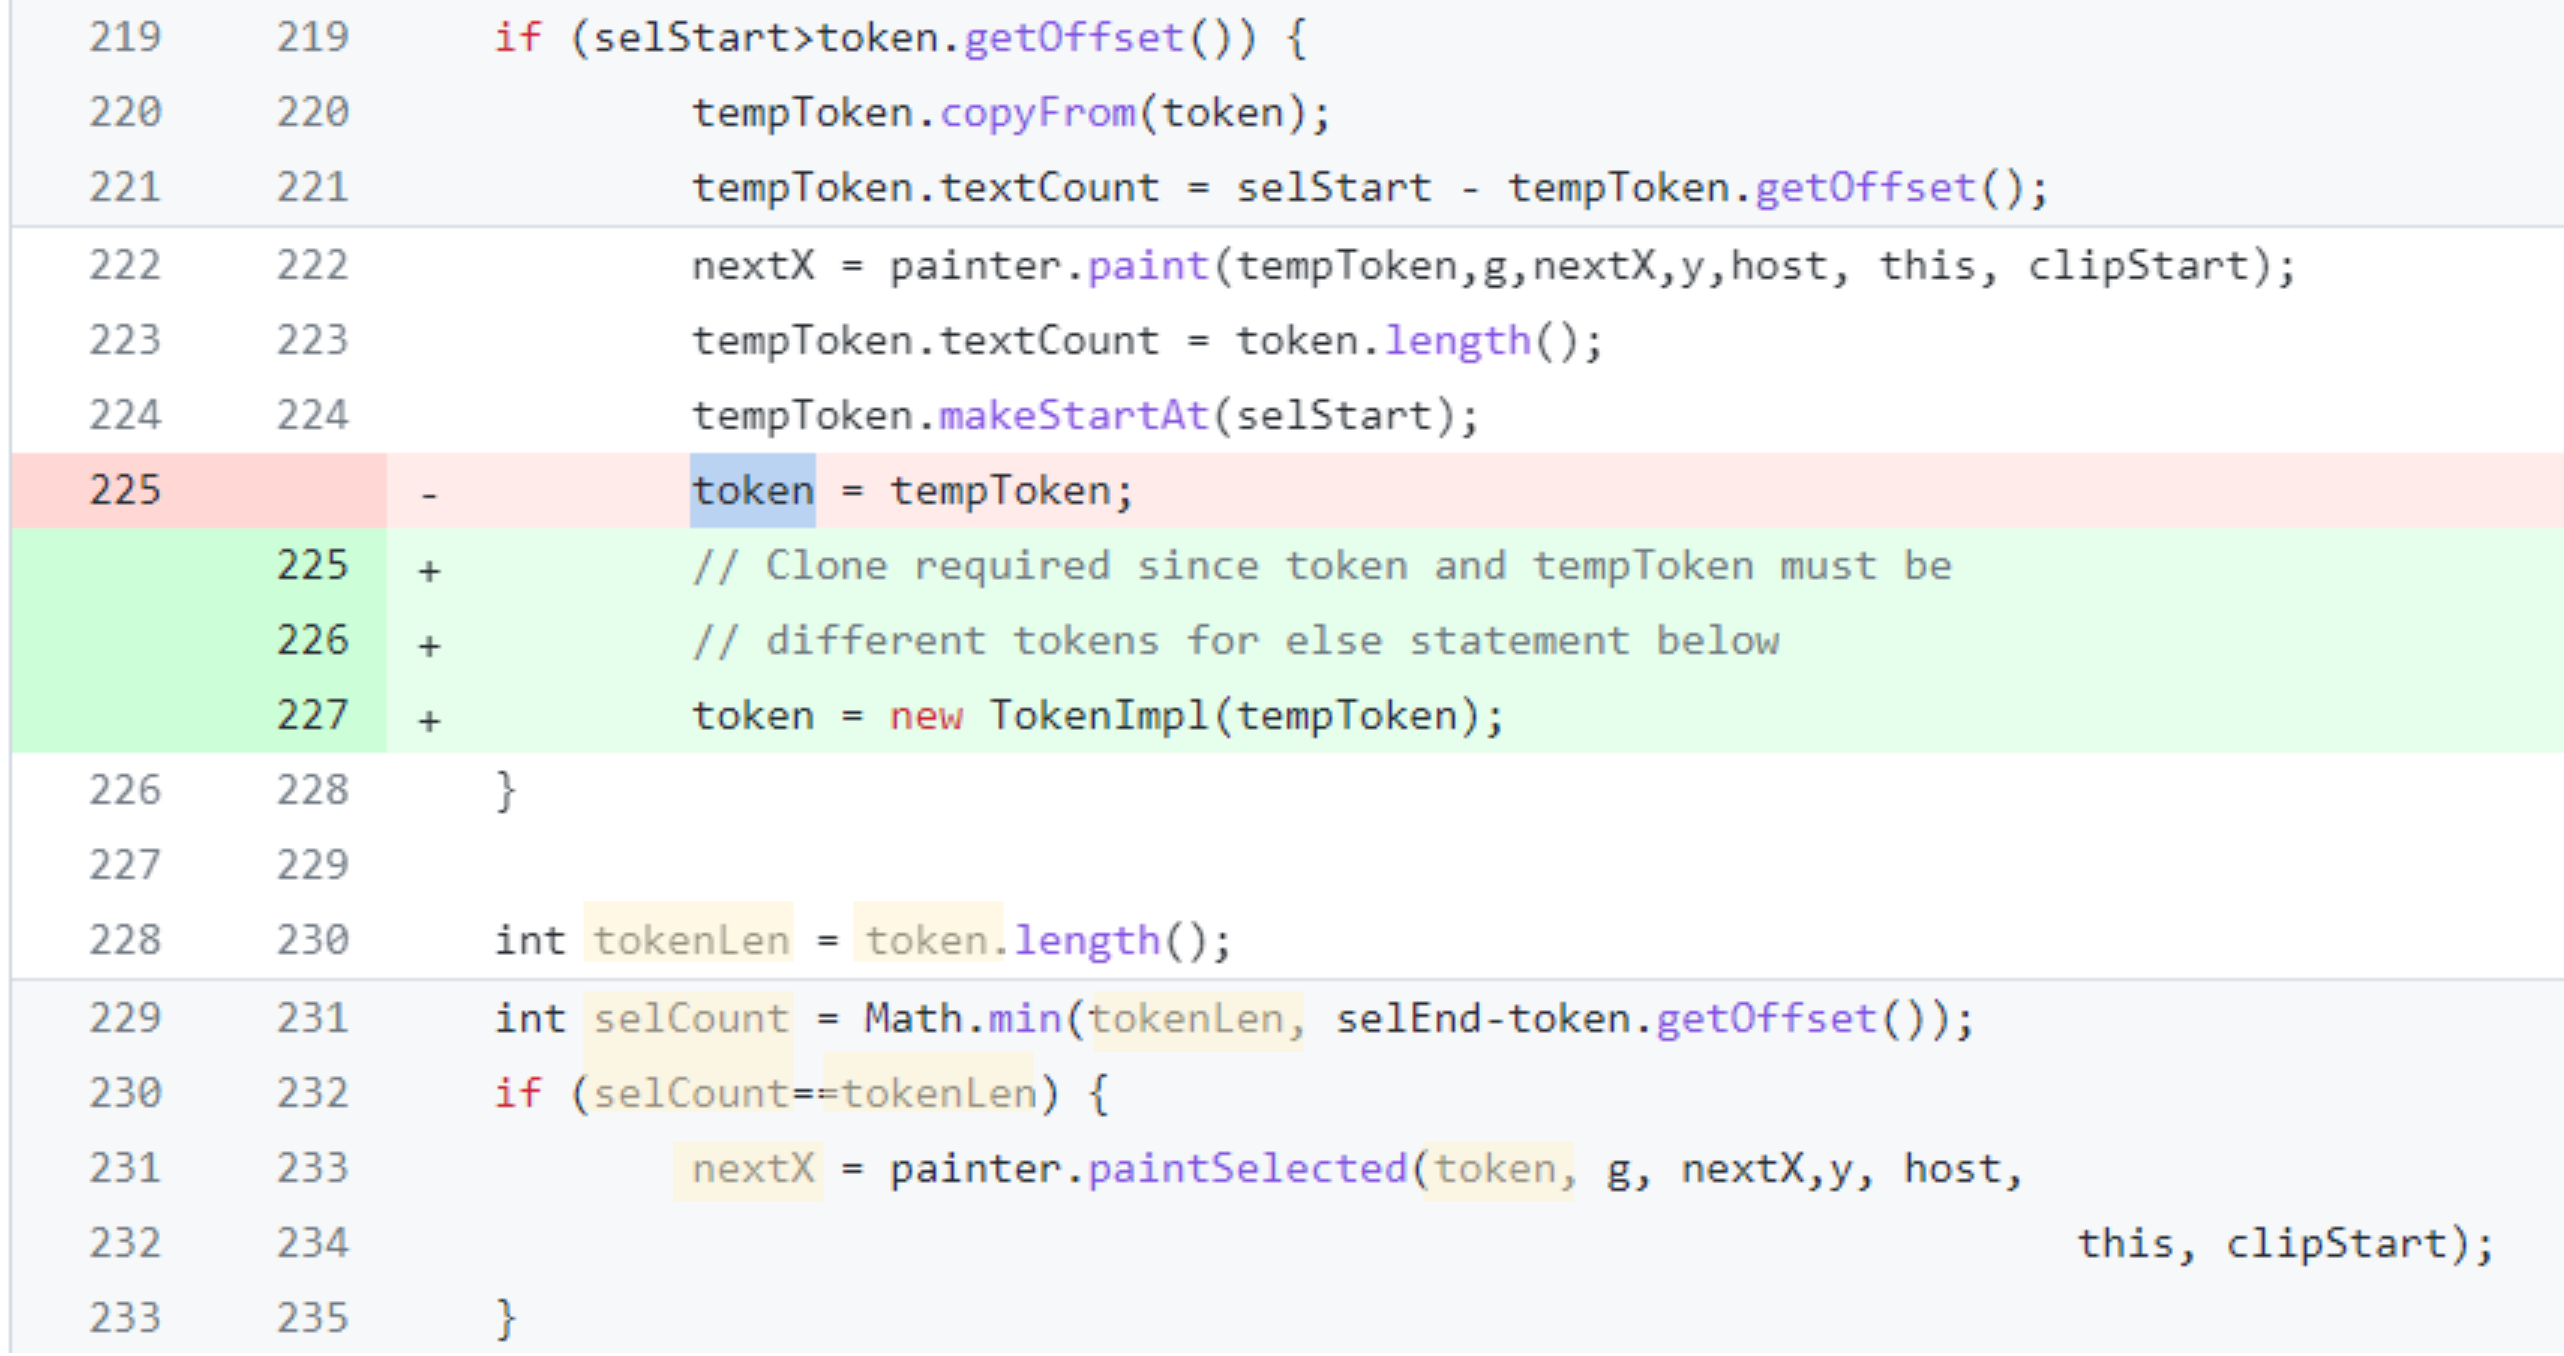
In addition to analyzing the connection among methods in the project, it is also important to consider how the contribution value of different changes varies even within the same method. Different variables or conditional statements have different scopes of influence within the same method, and thus, CValue will give higher weights for changes to those variables and statements that have a more significant impact on existing code. As shown in Figure 3, the change modified line 225 to 227, and variable token is influenced, which may have an impact on a series of variables after the changed lines (marked yellow in the figure).
To capture these intra-function influences of the changes, our tool uses the program dependence graph (PDG), which contains the data flow dependencies and control flow dependencies of program fragments. For example, the contribution of modifying an expression in a complex conditional statement should be different from modifying a variable initialization statement. We extracted the PDG from the project source code using Joern [35, 36], a source code static analysis tool.
It is important to note that our tool, CValue, is designed specifically to measure the contribution of the programmer reflected in the submitted code. Therefore, all types of information used in this method are derived from the code and its changes. Contributions beyond the code, such as communication with other developers, and discussing the requirements and design of the program in Pull Requests, are not considered in the proposed method since such contributions cannot be measured appropriately and are often reflected by code changes to some extent.
III-B Information Refinement
After extracting the raw data from the Git repositories, it needs to be refined before being fused together. Among the four types of information extracted, the complexity metrics do not need to be refined before normalization.
III-B1 AST Difference
The difference in AST is used to quantify the amount of changed code. Compared to using the number of lines of code being modified, using AST difference allows us to filter out operations that do not affect the syntax of the code, such as modifying comments and adjusting format. However, if we only consider the number of modified AST nodes, the following problems arise: 1) Different modification types produce completely different contributions. The same code added to the project, removed from the project, or replaced in a different location, produces entirely different contributions. 2) There are different types of nodes in the AST, and not all have the same meaning. For example, simply changing the variable name does not produce functional changes in the program but has a significant impact on AST. 3) The number of AST nodes grows quickly with the number of operations involved in the statement, which would affect subsequent calculations. To overcome these problems, we need to refine the amount of AST difference by considering the type of modification and the type of the AST node.
To differentiate the contribution for different AST changes, CValue assigns different weights to different types of modifications. First, we assumed that there is no difference between adding and updating AST nodes. They both modify the function for the function, so we gave them the same weight. Second, we believe that deleting existing code requires less thought to make the decision. Even when old features are replaced with new ones, the contribution value is already counted when the new features are added. Therefore, we assigned a low weight to the deletion operation, which is 1% of adding nodes. There is more to consider when moving code than when deleting code. Not all code could be moved from one place to another and keep the program running stably. However, moving code does not change the semantics of programs. Therefore, we assign a weight between add and delete to the move operation, which is 10% of adding nodes.
To solve the second problem, we assign weights to different AST nodes. The first type of node is the node that holds the name of the variables. The second type of node is modifiers, including access control modifiers (such as public and private) and annotations (such as @Override). Changing the variable name or modifiers alone does not influence the functionality of the project. Therefore, these operations are considered a small amount of contribution.
To address the issue of rapidly increasing numbers of Abstract Syntax Tree (AST) nodes with increasing statement complexity, CValue utilizes the depth of the modified AST subtree as a metric instead of the number of modified AST nodes. This counting method not only helps to mitigate the problem but also serves as a deterrent for developers to avoid writing overly complex code. We calculate the difference by the following formula:
| (1) |
where is a changed AST subtree, is the weight of a specific change type, is the depth of the changed AST subtree, is when the changed node is not only modifier or variable name, otherwise is .
III-B2 Inter-Function Impact of Changes
To determine the consideration of the inter-function interaction of the modified code segment from the call graph, CValue is inspired by DevRank [25, 24] algorithm, which is an improved version of the PageRank algorithm [37] applied to the function call graph. DevRank uses the volume of the function as a replacement for the transition probability used in PageRank. However, this algorithm has certain limitations. In PageRank, pages that are pointed to by more pages receive a higher score, but this is not always the case in the function call graph. Functions at the end of the call chain are often utilities, simple calculations, or judgments, while the critical core logic does not always appear at the end or the beginning of the call chain. When modifying these utilities, developers do not need to consider as much, but when modifying the core logic, it is important to take into account the stability, efficiency, and usability of functionalities.
Our proposed calculation method improves upon the DevRank algorithm by incorporating backward weight propagation with decay in the process. This allows for functions located in the middle of the call chain to receive higher scores. Our method is detailed in Algorithm 1. The call graph is represented as a directed graph. When a cycle is encountered, the weights passed in are distributed among all nodes on the cycle. By implementing this algorithm, the highest scoring part will not be the function at the end of the call chain, but instead will be located in the middle of the call chain.
III-B3 Intra-Function Impact of Changes
When making modifications to a function that involves variables, it can potentially affect statements that utilize those variables in the context, making it important for developers to consider the impact range of their changes, as part of the intra-function concern. To determine the range of impact, our proposed method compares the program dependence graphs (PDGs) before and after revision to identify which nodes in the PDG have been changed. The range of the effects is calculated based on the data and control flow dependencies of those changed nodes.
To calculate the affected range in the data dependency graph (DDG), we perform both forward and backward traces from the changed node in the DDG. The impact range of DDG is determined by counting the number of nodes involved in the forward and backward tracing and taking the ratio of the number of tracked nodes to the total number of nodes.
Additionally, we assign a higher weight to logical modifications, which involve changes to conditional statements. Some types of modifications take more effort to make, even if they are similar in size, as changes to conditional statements can significantly impact the execution of programs. These modifications are commonly made when fixing bugs in source code. To determine whether a conditional statement has been modified, we count the number of successor nodes in the control dependency graph (CDG) of the changed node. If the changed node has more than one successor, they are considered to be inside a conditional statement. We calculate the ratio of the affected nodes to the total number of nodes as the impact range of CDG.
The value of the affected range is calculated as the following formula, which merges the impact of CFG and DDG into a single value for further calculation.
| (2) |
where and are affected range from DDG and CFG respectfully. Since and are values between 0 and 1. And is later calculated in the multiplicative form together with the other components. In order to avoid the case of , we make sure that this item is not less than 1. Moreover, to make the variation of and more significant, we calculated the square root of these two items.
III-B4 Normalization
After the refinement process, the values of each dimension may have different value domains, which can make it difficult to combine the data for subsequent analysis. For example, in the project alibaba/fastjson, the cyclomatic complexity has a mean of , median value of , standard deviation of , and maximum value of , which is from a function with thousands of lines of code. On the contrary, in the same project, the consideration of the inter-function interaction of some functions is below 1, which is extremely small compared to the value of CC. These two types of data are not directly comparable and require pre-processing before they can be meaningfully combined.
To address this issue, we apply the Box-Cox transformation [38] on the refined data to convert the final data distribution into a curve that approximates a normal distribution. We then adjust this distribution to have a mean of 1 and a standard deviation of . Under this distribution, the probability of each value being negative is less than , and a value of 0 is used instead of negative values. The data that is normalized includes cyclomatic complexity, Halstead Volume, percentage of comments, lines of code, the inter-function interaction of modified code segment, DDG impact, and CDG impact.
III-C Data Fusion
After refining each metric, we need to aggregate them into a single score. To do this, we first integrate the complexity metrics into a single value. Among the complexity metrics, there is a positive correlation between complexity and the number of lines of code, Halstead volume, cyclomatic complexity, and a negative correlation with the percentage of comments. Therefore, complexity is defined as:
| (3) |
where is line of code of changed function, is cyclomatic complexity, is Halstead volume and is percentage of comments. After integration, has a distribution that has a mean of , and a minimum of .
Next, we combine the complexity metric with other metrics. The final score should have the following characteristics: when a developer makes modifications, the contribution value should have a positive relationship with the amount of code being modified, the complexity, and the inter-function and intra-function impact of the changed code segment. Therefore, we use the following formula to define the contribution value for modifying a function in a commit:
| (4) |
where is AST Difference, is the complexity, is the inter-function impact of the code segment from the call graph and is the intra-function impact. We add to and make sure that it is not smaller than 1. And the total contribution of a commit is the sum of all the contribution of modified functions:
| (5) |
IV Evaluation
The evaluation section of our paper aims to assess the effectiveness of CValue, in measuring the contribution of open-source developers. Specifically, we will address the following three research questions:
-
1.
How is the accuracy of CValue compared to the existing methods of measuring developer contribution on real-world projects?
-
2.
How is the performance of CValue?
-
3.
What are the potential applications of CValue?
IV-A Experiment Setup
CValue is not an effort estimation method but a contribution measurement method. We will not use the same accuracy metrics as effort estimation and compare to state-of-the-art methods of effort estimation.
IV-A1 Baseline Selection
Our tool, CValue, assesses developer contributions at the semantic level by analyzing code changes. As a result, the tools we compare in this study also use code changes from the software version control system as input for measuring developer contributions. We have chosen the following two methods for comparison in our study:
Changed line of code (by git diff [39]). This method is used in Github, which only count the number of changed line of code, including addition and deletion.
ELOC of Merico [40]. This method is proposed by Merico, a startup company by Yin et al. [24, 25], who proposed a method to quantify the contribution made by developers, to measure the efficiency of developers. This method considers the number of changed AST nodes, the weight of each kind of node and edit type, and intra-function deduplication.
We also considered COCOMO, a widely-used model for estimating development effort, as represented by the following formula, which value is only related to the lines of code.
| (6) |
In this formula, and are coefficients greater than zero, represents the estimated number of thousands of delivered lines of code for the project, and is the effort adjustment factor, which is also greater than zero. As we use Spearman correlation as an evaluation metric in Section IV-A3, which only considers the correlation of the rankings of several evaluation methods and does not take into account the error, the result of COCOMO aligns with the method that counts only changed lines of code.
There are other similar methods, but they are difficult to reproduce since some parameters are not publicly available. Yin et al. [24, 25] employed DevRank and impact coding to quantify developer contributions. However, the weights assigned to different types of impact coding and the parameters used in the Learning to Rank [26] model were not disclosed, which prevented us from reproducing the results accurately in this study. Bassi et al. [41] and Chen et al. [42] used quality-based contribution metrics. However, the weights assigned to different types of quality metrics in their method are not publicly disclosed.
IV-A2 Data Collection
We conducted our evaluation on 1398 commits from 10 open-source projects. The ground truth for these commits was labeled by 10 skillful programmers. The first six projects were selected from OSS-Fuzz [18], which is a list of projects that are being fuzz-tested. These projects have both behaviors including adding features and maintaining existing code in their modification history. The last four projects are smaller projects with relatively simple functionality, and there are almost no new feature additions in their modification history. To ensure that the contribution scores are not biased towards the preferences of a single programmer, each project was labeled by at least two programmers. Each programmer was asked to label the data based on their intuition, by evaluating the contribution of the modified code to the project. Modifications that did not change the semantics (e.g., formatting code only) received low scores. The details of these projects are shown in Table I. The data for the number of changed lines of code was calculated using git diff [39] and the data for the estimated lines of code was obtained from the Playground [43] provided by Merico.
| Project Name | Labelled | LoC | File |
|---|---|---|---|
| alibaba/fastjson | 154 | 187k | 3,119 |
| google/gson | 84 | 27k | 219 |
| google/guice | 124 | 72k | 613 |
| apache/httpcomponents-client | 158 | 72k | 710 |
| apache/httpcomponents-core | 145 | 80k | 919 |
| apache/rocketmq | 135 | 169k | 1,552 |
| apache/commons-cli | 150 | 6,237 | 52 |
| apache/commons-release-plugin | 148 | 1,429 | 18 |
| apache/commons-exec | 150 | 3,581 | 52 |
| apache/commons-ognl | 150 | 20k | 305 |
Since we are using Spearman correlation as an evaluation metric, each annotated data must be labeled by only one programmer. This means that we cannot divide the labeling task among multiple programmers. However, since the task of labeling data is time-consuming, taking about 80 commits per hour, the ground truth of each item we compared experimentally was labeled by only two programmers. In cases where there was disagreement among the programmers, a third developer will involve in the discussion and reach to an agreement. To ensure that the results marked by different people were similar, we had all programmers annotate 148 commits on apache/common-release-plugin and calculated the Spearman correlation between the annotated results of different programmers to check for consistency.
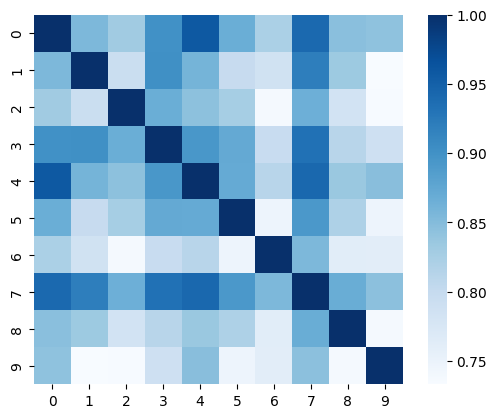
The result is shown in Figure 4. As can be seen, the labeled data from all 10 developers have a strong correlation with each other (). This indicates that even though only 2 developers labeled the data used in the experiment, it will not have a significant impact on the accuracy of the experiment.
IV-A3 Accuracy Metrics
To assess the similarity between the results obtained by the contribution measurement methods and the manually labeled results, we need a metric to measure the similarity or divergence. Studies about effort estimation, which is similar to our topic, used metrics such as Mean Absolute Error (MAE) or Mean Square Error (MSE) to quantify the difference between the two sets of results.
As an example, MSE calculates the mean value of the square of each error, as shown in the following formula:
| (7) |
where is the number of samples, is the true value, and is the predicted value. From the formula, we can find three features of MSE. 1) The minimum value of MSE is 0, but there is no upper bound. 2) Assuming a fixed value of ground truth, the size and range of observations will significantly affect the value of MSE. 3) MSE is not intuitive enough, and it is difficult to understand whether a value is a good enough result.
Additionally, it is challenging for developers to interpret the differences in contribution scores [24, 25], such as the difference between scores of 5 and 1. The difference in scores can only reflect the relative contribution size of the two modifications. Therefore, we use the Spearman correlation as a measure. Spearman correlation measures the monotonicity between two data distributions. It is calculated using the following formula:
| (8) |
where is the rank variables of , is the covariance of the rank variables, is the standard deviation of the rank variables, is the Pearson correlation coefficient of the rank variables. This metric can address the three shortcomings of MSE mentioned above. 1) spearman correlation has defined upper and lower bounds. 2) The value of Spearman correlation is independent of the size and range of observations. 3) The results of the Spearman correlation are intuitive. When , it means that the ranking of the two data is completely positively correlated; when , it means that the ranking of the two data is completely unrelated; when , it means that the ranking of the two data is completely negatively correlated.
IV-A4 Experiement Environment
In all the experiments, we used the same experimental environment. We used a server with dual Intel(R) Xeon(R) 6248 CPUs and 188GB of RAM.
IV-B Accuracy Evaluation (RQ1)
In RQ1, our objective is to assess the accuracy of CValue in quantifying the contribution of each commit. In this experiment, we evaluated the accuracy of our method and compare it with the baseline method. Since the ELOC Playground of Merico has errors in parsing some code, only commits without any file errors were considered when calculating the score corresponding to ELOC. From Table II, it can be seen that, with the exception of google/gson, CValue performs better than the other two methods. On these 10 projects, our method outperforms the LoC-based methods, including COCOMO, by an average of and exceeds the ELOC method from Merico by an average of .
| Project | LoC | ELOC | CValue |
|---|---|---|---|
| alibaba/fastjson | 0.5319 | 0.5490 | 0.6210 |
| google/gson | 0.5778 | 0.8223 | 0.7783 |
| google/guice | 0.5841 | 0.5480 | 0.6935 |
| apache/httpcomponents-client | 0.4741 | 0.5161 | 0.5351 |
| apache/httpcomponents-core | 0.7525 | 0.7158 | 0.7935 |
| apache/rocketmq | 0.8649 | 0.7549 | 0.9009 |
| apache/commons-cli | 0.3685 | 0.5718 | 0.5736 |
| apache/commons-release-plugin | 0.7062 | 0.5337 | 0.7084 |
| apache/commons-exec | 0.4947 | 0.6018 | 0.6458 |
| apache/commons-ognl | 0.5319 | 0.5490 | 0.6210 |
Compared to the LoC-based approach, the most significant improvement of was achieved on the project apache/commons-cli. This is because there are a large number of operations on this project that cannot be accurately identified by the LoC-based method, such as variable name modification. On http-components-core, rocketmq, and commons-release-plugin of Apache, the improvement is relatively small due to less worthless maintenance behavior and the already high LoC-based accuracy (). Apart from the proportion of worthless change in the evolution history, other reasons would be discussed later.
As ELOC has errors in some modifications, we only used the part of the labeled data that had correct results from ELOC to calculate the correlation value. This means that the sample size of ELOC is smaller than the other methods. On the project google/gson, our method was less accurate than ELOC. However, on this project, only 22 commits had correct ELOC results out of 84 commits, which does not provide a significant statistical value. Furthermore, since the computational logic of ELOC is not fully open-sourced, we cannot analyze the reasons for its accuracy in detail.
In order to understand which types of modifications would result in significant differences in results when compared with the previous methods, we analyzed commits whose difference in ranking between the results of LoC, ELOC, and CValue is greater than . We found the following change types:
The first type contains some simple refactoring operations222https://github.com/alibaba/fastjson/commit/8d4ac6. These operations include changing variable names or method names, modifying the properties or methods modifiers, moving methods, and extracting methods. Commits of moving methods and extracting methods often move code from one place to another without producing much semantic modification. They are recognized as move operations in the AST mapping algorithm. Modifying modifiers only causes a few AST nodes to be changed. Commits that only modify variable names are blocked or given low weight when calculating AST changes. All of these types of refactoring operations result in a large number of lines of code being modified. However, such changes produce little semantic change and do not affect the operation of the program if not causing syntax errors.
The second type is the modification of comments333https://github.com/alibaba/fastjson/commit/1c087e. Comments help developers understand the program quickly, but they do not make any semantic changes to the program. When calculating AST changes, comments are not counted into the AST. Therefore, changing comments in the source code will not be counted as contributing to our approach.
The third category is for modifications of lengthy conditional statements444https://github.com/alibaba/fastjson/commit/3f28f5. Modifications in conditional statements affect the logic of the program, so we use the impact range to increase the contribution value of such modifications. Also, the number of AST nodes in a lengthy conditional statement is large and may even be higher than in a regular statement. Such modifications would receive a relatively high score in our method, but they would be no different from modifying just one line of code in an LoC-based method.
The last type is caused by the inherent defects of the AST mapping algorithm. Sometimes the AST mapping algorithm treats a minor modification as a significant one. Fan et al.[44] found that all existing AST mapping algorithms have limitations and do not accomplish accurate mapping in all situations. The problems of AST mapping algorithms affect the robustness of the current method to some extent.
IV-C Performance Evaluation (RQ2)
Our proposed method uses call graphs and other high-time-cost analyses, resulting in increased accuracy. While existing methods, such as those based solely on changes in lines of code or AST differences, have faster execution times, our method aims to strike a balance between analysis accuracy and time consumption to ensure its practical in real-world projects. In practice, our method need not necessarily match the execution time of line-of-code-based approaches, but rather maintain an acceptable time consumption according to the frequency of code updates.
In this research question, we will evaluate whether the time cost of CValue is acceptable in real-world projects. 1) How much performance improvement has our incremental dependency extraction tool had compared to running a dependency extraction tool on each version? 2) How much time is needed on average when analyzing a commit? 3) How often code is updated in popular projects?
Time Cost. In this experiment, we aimed to evaluate the time consumption of our tool, CValue, on real-world open-source projects of varying sizes. Extracting the dependencies of a project is a time-consuming task, but it is also necessary for CValue. We have optimized Depends to allow incremental analysis to improve efficiency. In this experiment, we first compare the performance improvement of dependency extraction. IncrementalDepend was limited to using only 2 CPU cores, while Depends was run with its default configuration. We ran IncrementalDepends on several projects and compared the execution time with that of Depends on the last version of each project. In this experiment, we also analyze the overall time cost of CValue on the same projects. Since the first five projects are too large and may take several days to complete the entire analysis, we have only selected the most recent 200 commits for analysis.
The results are shown in Table III. In the table, IDepends is the time of IncrementalDepends, and D Time Per Commmit is the time cost of IncrementalDepends per commit. From the table, we can find that our tool IncrementalDepends only toke about 1.06 seconds on average which is time of Depends per commit. Being able to do incremental analysis, especially on large projects, is a great improvement of CValue. Our analysis tool, CValue, had an average execution time of 83.39 seconds per commit across different projects. However, it should be noted that the project apache/commons-pool had a higher execution time compared to other projects due to the higher number of modified files per commit.
| Project | LoC (Java) | Commit Number | Depends | IDepends Time Per Commits∗ | Total Time | Time Per Commit |
|---|---|---|---|---|---|---|
| alibaba/fastjson | 186,876 | 3,970 (200) | 48.35 seconds | 4.31 seconds | 0 day(s) 05:52:08 | 104.20 seconds |
| google/gson | 27,498 | 1,706 (200) | 6.11 seconds | 1.04 seconds | 0 day(s) 04:59:21 | 89.81 seconds |
| google/guice | 72,154 | 2,017 (200) | 12.49 seconds | 1.85 seconds | 0 day(s) 05:52:08 | 105.64 seconds |
| apache/httpcomponents-client | 72,304 | 3,376 (200) | 12.85 seconds | 0.65 seconds | 0 day(s) 05:15:44 | 93.82 seconds |
| apache/httpcomponents-core | 80,065 | 3,674 (200) | 13.59 seconds | 0.70 seconds | 0 day(s) 05:30:33 | 99.17 seconds |
| apache/commons-cli | 6,237 | 1,176 | 6.84 seconds | 0.17 seconds | 1 day(s) 05:48:10 | 91.23 seconds |
| apache/commons-release-plugin | 1,429 | 653 | 6.53 seconds | 0.12 seconds | 0 day(s) 03:14:54 | 17.91 seconds |
| apache/commons-exec | 3,581 | 755 | 1.66 seconds | 0.14 seconds | 0 day(s) 08:00:51 | 38.21 seconds |
| apache/commons-ognl | 20,422 | 809 | 18.73 seconds | 0.50 seconds | 0 day(s) 16:22:03 | 72.83 seconds |
| apache/commons-pool | 15,405 | 2,526 | 5.17 seconds | 1.08 seconds | 3 day(s) 12:55:53 | 121.04 seconds |
∗ Time for IncrementalDepends per Commit.
A study of maintenance frequency of open-source software. In this experiment, we aimed to evaluate the feasibility of our tool, CValue, in practice by analyzing the frequency of commits on popular open-source projects. Only the days on which changes were committed were taken into account, and the average number of commits per day was calculated. By combining this data with the results from Experiment 1, we can determine the practicality of using the CValue.
We randomly selected 3,108 popular Java projects from GitHub and Maven Central [45], grouped by size (number of lines of Java code). The distribution of daily commit numbers was analyzed, and the results are presented in Table IV. In this table, the first column of the table represents different project sizes, measured by the number of lines of code. From the results, it can be observed that even among projects of varying sizes, in more than of cases, the number of commits per day does not exceed 20. This is a relatively low number of commits that need to be analyzed, and even when considering the project with the highest execution time, the performance of CValue is practical for a maintenance frequency of up to 20 commits per day.
| LoC (Java) | 1-5 | 5-10 | 10-20 | 20+ |
|---|---|---|---|---|
| 0-1k | 88.96% | 8.75% | 1.97% | 0.31% |
| 1-5k | 85.11% | 11.46% | 2.88% | 0.54% |
| 5-10k | 83.72% | 12.38% | 3.33% | 0.57% |
| 10-50k | 80.91% | 13.96% | 4.24% | 0.89% |
| 50k+ | 76.57% | 16.44% | 5.54% | 1.45% |
IV-D Application (RQ3)
In RQ3, we investigate potential applications in real-world open-source projects for CValue. Leaderboards, which are commonly used to show the developers with more frequent activities, and even used to rank the contribution of developers. In this RQ, we want to verify whether the position of developers on the contribution leaderboard of GitHub is reasonable. We analyzed the percentage of commits by each developer, and their percentage of CValue. For those whose CValue and number of commit have a significant gap, i.e. a reasonable threshold of the ratio of the percentage of commit number and CValue is used to find the gap, we labeled the change types in these commit and compare the proportion of each type of change between these two groups of developers.
We conducted an analysis of 174 open-source Java projects from GitHub. We identified developers based on the emails associated with commit operations in the Git repository and calculated the contribution proportion for each developer in a project. Furthermore, we calculated the proportion of commits per developer, which we used to determine the contributor ranking of the project on GitHub. By comparing these two proportions, we were able to filter out developers who had an inflated number of commits, i.e. commit number proportion greater than and contribution value proportion less than of the commit number proportion.
We identified 2,282 developers with inflated commit numbers across 174 projects. Of these, 2,050 did not make any syntax contributions to the Java code. These changes were primarily related to editing build scripts, version numbers, comments and documentation, code style, etc. The remaining 232 developers made significantly less contribution value than their proportion of commits suggested. Additionally, we identified 103 bots, most of which were Github Dependabot, which were mainly used to update dependent package versions.
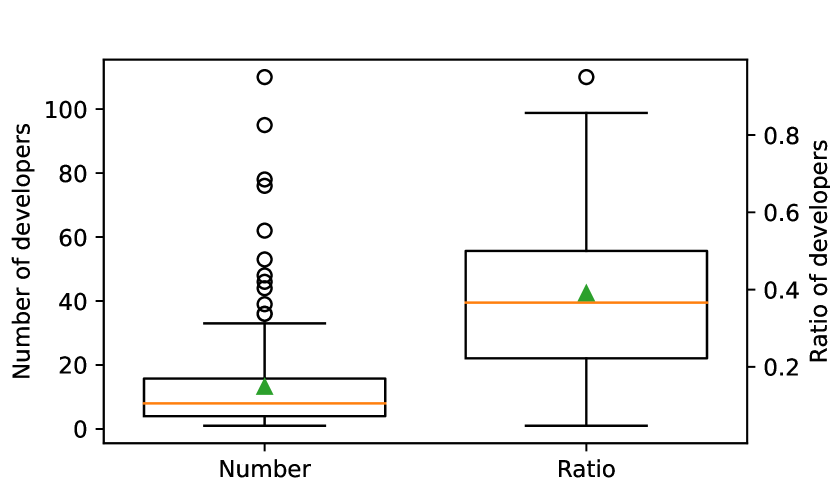
Our analysis of 174 open-source projects from GitHub is shown in Figure 5. The left boxplot illustrates the number of developers with an abnormal number of commits across different projects, while the right boxplot shows the proportion of these developers among all contributors. The figure demonstrates that in these open-source projects, the average number of developers who did not provide sufficient contribution per project is 13, with a median of 8. The average proportion of these contributors is , with a median of .
For the two categories of developers with a normal and inflated number of commit levels, we randomly sampled 200 commits submitted from each category and manually analyzed the modification content. As shown in Table V, developers with an inflated number of commits rarely proposed modifications that affected the semantics of the code. They focused more on improving documentation and resource files, modifying CI/CD scripts, and updating software dependencies. In contrast, developers with a higher ratio of contributions to commit numbers focused more on modifications to the code itself, including implementing new features, fixing errors, and updating versions. They paid less attention to resource files, dependency versions, etc. The latter were more likely to be core contributors to open-source projects.
| Change Type | Inflated | Normal |
|---|---|---|
| Add Empty Files | 2 | 0 |
| Semantic Changes | 7 | 50 |
| Rename Variables or Methods | 3 | 5 |
| Minor Semantic Changes | 20 | 49 |
| Change Build Scripts | 29 | 22 |
| Update Documentation | 27 | 19 |
| Change Dependency Version | 58 | 10 |
| Change Resource Files | 19 | 5 |
| Delete Files | 3 | 4 |
| Empty Commit | 5 | 0 |
| Non-Java Code | 2 | 0 |
| Format Code | 8 | 5 |
| Change Comments | 6 | 11 |
| Remove Redundant Code | 1 | 1 |
| Update CI/CD Scripts | 18 | 5 |
| Update Version | 16 | 31 |
| Move Files | 0 | 2 |
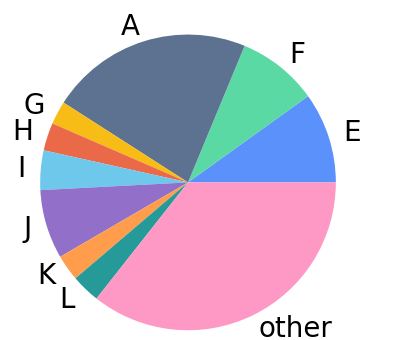
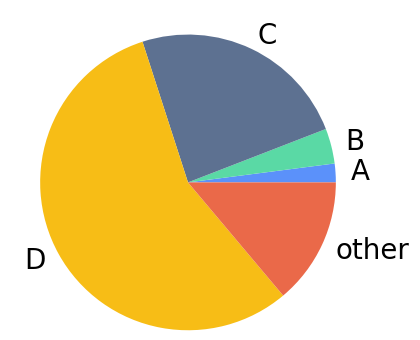
The following case is from the open-source project LibrePDF of OpenPDF on GitHub. As shown in Figure 6, developer A appears to be the core developer according to the number of commits, occupying of the pie chart in the first figure. However, in the second figure, its contribution share is only . When looking at the commits by A on GitHub, many of them are related to updating version numbers, merging reviewed pull requests, and updating dependencies, even though it has the highest number of commits in the project, it does not contribute as much as other developers. Developer E in the figure is a bot, identified as GitHub Dependabot, which has also submitted a large number of commits, but these commits are all related to modifying the dependencies of the project. Therefore, as shown in the second figure, it makes almost no contributions. Developers B, C, and D are all project developers, and developer D produced the most contribution. In the first figure, they do not appear because their number of commits is too small. However, Developer B submits fewer lines of code and fewer commits than A, but as seen in the second figure, B has a more significant contribution than A.
V Threats to Validity
In RQ1, where we compare the accuracy of several schemes to manually labeled data, the manually labeled data may be not accurate enough, which has two reasons. First, the individuals who annotated the data were not involved in the development of the projects they were annotating, which eliminates potential bias but may also lead to a lack of understanding of the content and the difficulty of the modifications. Second, developers do not always have the same focus when writing code and reviewing code. The views of reviewers of the revisions do not always accurately reflect what the developers were thinking. These two factors could potentially compromise the accuracy of RQ1.
VI Conclusion
In conclusion, our research proposed CValue, a method for accurately measuring the contributions of open-source software developers. By combining data from four aspects of the software repository, our method was able to outperform previous methods by an average of when evaluated on 10 projects containing 1,398 commits. By evaluating the time cost of CValue on 10 popular open-source projects, CValue takes 83.39 seconds per commit on average and it is practical in the real world. Through our analysis of 174 open-source projects, we also discovered 2,282 developers who were not making enough contributions. On all 174 projects, developers who did not contribute enough had an average of 13 people per project and a proportion of . Overall, our research provides a valuable tool for measuring the contributions of open-source developers and identifying those who may need additional attention.
Acknowledgement
This research/project is supported by the National Research Foundation Singapore and DSO National Laboratories under the AI Singapore Programme (AISG Award No: AISG2-RP-2020-019), the National Research Foundation, Singapore, and the Cyber Security Agency under its National Cybersecurity R&D Programme (NCRP25-P04-TAICeN). Any opinions, findings and conclusions or recommendations expressed in this material are those of the author(s) and do not reflect the views of National Research Foundation, Singapore and Cyber Security Agency of Singapore.
References
- [1] M. Howell, T. Lewis, and T. Borrel, “A Decentralized Protocol for Remunerating the Open‑Source Ecosystem,” 2022.
- [2] L. Zhang, C. Liu, Z. Xu, S. Chen, L. Fan, L. Zhao, J. Wu, and Y. Liu, “Compatible remediation on vulnerabilities from third-party libraries for java projects,” in 2023 IEEE/ACM 45th International Conference on Software Engineering (ICSE). Melbourne, Australia: IEEE, May 2023, p. 2540–2552. [Online]. Available: https://ieeexplore.ieee.org/document/10172542/
- [3] Y. Zhang, Z. Xu, C. Liu, H. Chen, J. Sun, D. Qiu, and Y. Liu, “Software architecture recovery with information fusion,” in Proceedings of the 31st ACM Joint European Software Engineering Conference and Symposium on the Foundations of Software Engineering, 2023.
- [4] “tea.xyz,” November 2022. [Online]. Available: http://tea.xyz
- [5] GitCoin, “Gitcoin - Build and Fund the Open Web Together,” November 2022. [Online]. Available: https://gitcoin.co/
- [6] F. Shull, J. Singer, and D. I. Sjøberg, Guide to advanced empirical software engineering. Springer, 2007.
- [7] J. D. Herbsleb and A. Mockus, “Formulation and preliminary test of an empirical theory of coordination in software engineering,” ACM SIGSOFT Software Engineering Notes, vol. 28, no. 5, pp. 138–137, 2003.
- [8] B. Boehm, B. Clark, E. Horowitz, C. Westland, R. Madachy, and R. Selby, “Cost models for future software life cycle processes: Cocomo 2.0,” Annals of software engineering, vol. 1, no. 1, pp. 57–94, 1995.
- [9] B. W. Boehm and R. Valerdi, “Achievements and challenges in cocomo-based software resource estimation,” IEEE software, vol. 25, no. 5, pp. 74–83, 2008.
- [10] A. Mockus, R. T. Fielding, and J. D. Herbsleb, “Two case studies of open source software development: Apache and mozilla,” ACM Transactions on Software Engineering and Methodology (TOSEM), vol. 11, no. 3, pp. 309–346, 2002.
- [11] E. Di Bella, A. Sillitti, and G. Succi, “A multivariate classification of open source developers,” Information Sciences, vol. 221, pp. 72–83, 2013.
- [12] M. Joblin, S. Apel, C. Hunsen, and W. Mauerer, “Classifying Developers into Core and Peripheral: An Empirical Study on Count and Network Metrics,” in 2017 IEEE/ACM 39th International Conference on Software Engineering (ICSE). Buenos Aires: IEEE, May 2017, pp. 164–174. [Online]. Available: http://ieeexplore.ieee.org/document/7985659/
- [13] J. Cheng and J. L. Guo, “Activity-based analysis of open source software contributors: Roles and dynamics,” in 2019 IEEE/ACM 12th International Workshop on Cooperative and Human Aspects of Software Engineering (CHASE). IEEE, 2019, pp. 11–18.
- [14] J. Tsay, L. Dabbish, and J. Herbsleb, “Influence of social and technical factors for evaluating contribution in GitHub,” in Proceedings of the 36th International Conference on Software Engineering. Hyderabad India: ACM, May 2014, pp. 356–366. [Online]. Available: https://dl.acm.org/doi/10.1145/2568225.2568315
- [15] L. Zhang, C. Liu, Z. Xu, S. Chen, L. Fan, B. Chen, and Y. Liu, “Has my release disobeyed semantic versioning? static detection based on semantic differencing,” in Proceedings of the 37th IEEE/ACM International Conference on Automated Software Engineering. Rochester MI USA: ACM, Oct 2022, p. 1–12. [Online]. Available: https://dl.acm.org/doi/10.1145/3551349.3556956
- [16] L. Zhang, C. Liu, S. Chen, Z. Xu, L. Fan, L. Zhao, Y. Zhang, and Y. Liu, “Mitigating persistence of open-source vulnerabilities in maven ecosystem,” 2023.
- [17] M. H. Halstead, Elements of Software Science (Operating and programming systems series). Elsevier Science Inc., 1977.
- [18] “OSS-Fuzz,” July 2022. [Online]. Available: https://google.github.io/oss-fuzz/
- [19] X. Huang, D. Ho, J. Ren, and L. F. Capretz, “Improving the cocomo model using a neuro-fuzzy approach,” Applied Soft Computing, vol. 7, no. 1, pp. 29–40, 2007.
- [20] R. K. Sachan, A. Nigam, A. Singh, S. Singh, M. Choudhary, A. Tiwari, and D. S. Kushwaha, “Optimizing basic cocomo model using simplified genetic algorithm,” Procedia Computer Science, vol. 89, pp. 492–498, 2016.
- [21] V. Nguyen, B. Steece, and B. Boehm, “A constrained regression technique for cocomo calibration,” in Proceedings of the Second ACM-IEEE international symposium on Empirical software engineering and measurement, 2008, pp. 213–222.
- [22] E. Shihab, Y. Kamei, B. Adams, and A. E. Hassan, “Is lines of code a good measure of effort in effort-aware models?” Information and Software Technology, vol. 55, no. 11, pp. 1981–1993, 2013.
- [23] J. Lima, C. Treude, F. Figueira Filho, and U. Kulesza, “Assessing developer contribution with repository mining-based metrics,” in 2015 IEEE International Conference on Software Maintenance and Evolution (ICSME). IEEE, 2015, pp. 536–540.
- [24] H. Yin, “Quantifying the development value of code contributions,” Master’s thesis, EECS Department, University of California, Berkeley, Dec 2018. [Online]. Available: http://www2.eecs.berkeley.edu/Pubs/TechRpts/2018/EECS-2018-174.html
- [25] J. Ren, H. Yin, Q. Hu, A. Fox, and W. Koszek, “Towards quantifying the development value of code contributions,” in Proceedings of the 2018 26th ACM Joint Meeting on European Software Engineering Conference and Symposium on the Foundations of Software Engineering, 2018, pp. 775–779.
- [26] T.-Y. Liu et al., “Learning to rank for information retrieval,” Foundations and Trends® in Information Retrieval, vol. 3, no. 3, pp. 225–331, 2009.
- [27] C. Jergensen, A. Sarma, and P. Wagstrom, “The onion patch: migration in open source ecosystems,” in Proceedings of the 19th ACM SIGSOFT symposium and the 13th European conference on Foundations of software engineering, 2011, pp. 70–80.
- [28] J. L. Cánovas Izquierdo and J. Cabot, “On the analysis of non-coding roles in open source development,” Empirical Software Engineering, vol. 27, no. 1, pp. 1–32, 2022.
- [29] H. A. Çetin and E. Tüzün, “Analyzing developer contributions using artifact traceability graphs,” Empirical Software Engineering, vol. 27, no. 3, pp. 1–49, 2022.
- [30] G. Robles, J. M. Gonzalez-Barahona, and I. Herraiz, “Evolution of the core team of developers in libre software projects,” in 2009 6th IEEE international working conference on mining software repositories. IEEE, 2009, pp. 167–170.
- [31] T. J. McCabe, “A complexity measure,” IEEE Transactions on software Engineering, no. 4, pp. 308–320, 1976.
- [32] J. Falleri, F. Morandat, X. Blanc, M. Martinez, and M. Monperrus, “Fine-grained and accurate source code differencing,” in ACM/IEEE International Conference on Automated Software Engineering, ASE ’14, Vasteras, Sweden - September 15 - 19, 2014, 2014, pp. 313–324. [Online]. Available: http://doi.acm.org/10.1145/2642937.2642982
- [33] M. H. Halstead, “Halstead m, elements of software science,” 1977.
- [34] depends, “multilang-depends/depends: Depends is a fast, comprehensive code dependency analysis tool,” August 2022. [Online]. Available: https://github.com/multilang-depends/depends
- [35] F. Yamaguchi, N. Golde, D. Arp, and K. Rieck, “Modeling and discovering vulnerabilities with code property graphs,” in 2014 IEEE Symposium on Security and Privacy. IEEE, 2014, pp. 590–604.
- [36] “Joern - The Bug Hunter’s Workbench,” August 2022. [Online]. Available: https://joern.io/
- [37] L. Page, S. Brin, R. Motwani, and T. Winograd, “The pagerank citation ranking: Bringing order to the web.” Stanford InfoLab, Tech. Rep., 1999.
- [38] G. Box and D. Cox, “An analysis of transformations,” Journal of the Royal Statistical Society B, vol. 26, pp. 211–252, 1964.
- [39] “Git - git-diff documentation,” August 2022. [Online]. Available: https://git-scm.com/docs/git-diff
- [40] “Merico Document,” July 2022. [Online]. Available: https://docs.merico.cn/ee/stable/terms_explanation
- [41] P. R. de Bassi, G. M. P. Wanderley, P. H. Banali, and E. C. Paraiso, “Measuring developers’ contribution in source code using quality metrics,” in 2018 IEEE 22nd International Conference on Computer Supported Cooperative Work in Design ((CSCWD)). IEEE, 2018, pp. 39–44.
- [42] H.-M. Chen, B.-A. Nguyen, and C.-R. Dow, “Code-quality evaluation scheme for assessment of student contributions to programming projects,” Journal of Systems and Software, vol. 188, p. 111273, 2022.
- [43] “Eloc playground,” August 2022. [Online]. Available: https://playground.merico.dev/
- [44] Y. Fan, X. Xia, D. Lo, A. E. Hassan, Y. Wang, and S. Li, “A differential testing approach for evaluating abstract syntax tree mapping algorithms,” in 2021 IEEE/ACM 43rd International Conference on Software Engineering (ICSE). IEEE, 2021, pp. 1174–1185.
- [45] “Maven central repository search,” August 2022. [Online]. Available: https://search.maven.org/