∎
e1e-mail: endo.shunsuke@jaea.go.jp
Measurements of neutron total and capture cross sections of 139La and evaluation of resonance parameters
Abstract
Neutron total and capture cross sections of Lanthanum(La)-139 were measured at the Accurate Ne-utron-Nucleus Reaction measurement Instrument (ANNRI) of the Materials and Life Science Experimental Facility (MLF) in the Japan Proton Accelerator Research Complex (J-PARC). The total cross section was largely different from that in evaluated libraries, such as JENDL-5, in the energy range from 80 to 900 eV. Resonance parameters for four resonances including one negative resonance were obtained using a resonance analysis code, REFIT. The resonance analysis revealed discrepancies in several resonance parameters with the evaluated libraries. Furthermore, the information about the scattering radius was also extracted from the results of the total cross section. The obtained scattering radius was larger than that recorded in the evaluated libraries.
1 Introduction
The cross sections and resonance parameters of lanthanum (La)-139 are significant for applications in a nuclear technology and studies in a fundamental nuclear physics. In applications in the nuclear technology, an activation detector on the basis of neutron capture reactions of 139La is applied to neutron dosimetry in the epi-thermal neutron energy INDC . Furthermore, 139La is produced as one of fission products (5% fission yield England ) in a nuclear reactor; it is often used to measure the operating power distribution after the nuclear reactor shutdown because of the short half-life (1.678 d) of 140La produced by neutron capture of 139La Priyada . Therefore, the accurate cross sections are required.
In fundamental nuclear physics studies, La has been used to clarify an enhancement mechanism of parity violation in compound nuclear reactions. The 0.75-eV resonance of 139La gave the magnitude of the parity violation as large as 10% Bowman ; Yuan , which is a very large enhancement among various nuclei Michel . An ”s-p mixing model” was proposed to explain the enhancement mechanism of the parity violation, which took into account of the mixing between s- and p-wave amplitudes in the entrance channel of the compound nuclear state Flambaum . Angular correlation terms of capture reactions which are important to verify the s-p mixing model have recently been measured for several nuclei, such as 139La, 117Sn and 131Xe Okudaira ; Okudaira2021 ; Yamamoto ; Koga ; Endo2022 ; Okudaira2023 . Resonance parameters are needed to theoretically interpret the results of these correlation terms based on the s-p mixing model because the cross section of the correlation terms depends on the resonance parameters. Since 139La is one of the most significant nuclei in the study of the s-p mixing model due to observing the large enhancement of the parity violation, the accurate resonance parameters are required.
The neutron cross sections and the resonance parameters of 139La have been reported from several measurements. Terlizzi et al. measured the capture cross section at the n_TOF in CERN nTOF . They measured capture -rays with C6D6 detectors located at the 187.5-m flight length. The resonance parameters from 0.75-eV to 8970-eV resonances were determined using a resonance analysis code, SAMMY SAMMY . Shwe et al. measured the total cross section in the Argonne fast chopper at the CP-5 reactor Shwe . Boron-loaded liquid scintillators were placed at the flight length of 60 and 120 m. The resonance parameters from 0.75 eV to 10352 eV were derived by an area analysis. Harvey et al. Harvey and Alfimenkov et al. Alfimenkov also measured transmission and obtained the resonance parameters of the 0.75-eV resonance. The discrepancies between these past studies are found in the neutron widths of the 0.75-eV resonance (see Table 1). Furthermore, in the s-p mixing model, the resonance parameters are necessary for not only the p-wave but also s-waves which are mixed into the p-wave resonance. In the 139La case, the 0.75-eV p-wave resonance is considered to most strongly mix with negative resonance Okudaira , but the negative resonance parameters were not reported in those past studies. To properly restrict the negative resonance parameters, it is significant to measure both the neutron total and capture cross sections and to determine the resonance parameters by simultaneous fits to both cross sections. Consequently, in this paper, the neutron transmission and the capture yield were measured at the Accurate Neutron-Nucleus Reaction measurement Instrument (ANNRI) equipped at Beam Line 04 of the Materials and Life Science Experimental Facility (MLF) in the Japan Proton Accelerator Research Complex (J-PARC). The neutron total and capture cross sections were derived from the neutron transmission and capture yield, respectively, and the resonance parameters were evaluated using a resonance analysis code, REFIT REFIT .
2 Experiment
In MLF, pulsed protons are provided with a specific repetition rate, 25 Hz, and neutrons are produced by the proton-induced spallation reactions in the mercury target. The proton beam power was 800 kW, and the beam had a double-bunch structure Endo at the time of the present experiment. The time-of-flight (TOF) method was applied to determine the neutron energy. Figure 1 shows an overview of ANNRI and experimental conditions for the collimators and filter. Neutron transmission was measured by Li-glass detectors installed at 28.7-m flight length. Two types of Li-glass detectors, 6Li enriched and 7Li enriched, were employed. The use of 7Li-glass detector was to subtract -ray backgrounds. The backgrounds caused by scattered neutrons and captured -rays in a sample were negligibly removed with the intermediate collimator placed between the sample and detectors. In capture cross section measurement, an NaI detector installed at 27.9-m flight length was used to detect -rays emitted via neutron capture reactions.
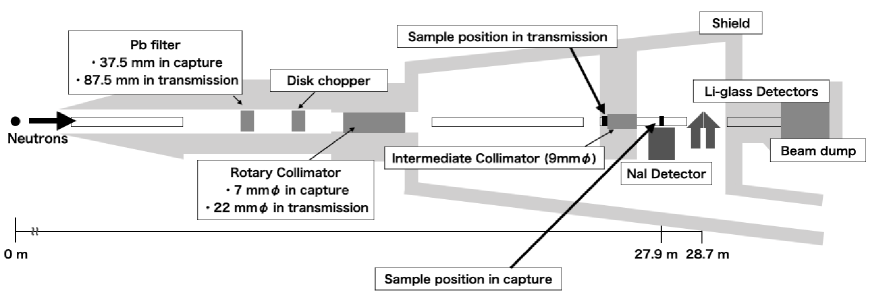
In the transmission measurement, a metallic natural La sample was used; its size was mm and areal density was atoms/b. The sample contained a slightly amount of gadolinium as an impurity. The sample-out measurement, hereinafter called ”blank”, was also conducted to obtain the transmission. A gold (Au) sample was used to determine the flight length and initial time delay using the resonances of 197Au. In addition, the measurement inserting the black resonance filters (silver, manganese, cobalt, and indium) was performed to correct the difference of the detection efficiencies between 6Li and 7Li enriched detectors. A digitizer, CAEN V1720, was adopted to acquire the TOF and the pulse height with a list mode.
In the capture cross section measurement, another metallic natural La sample was used; its size was 10 0.175 mm and areal density was atoms/barn. The blank and carbon sample were measured to correct sample-independent and sample-scattered backgrounds. Samples of Au and boron were used to normalize the cross section and to obtain the incident neutron flux, respectively. The TOF and the pulse height were acquired by the digitizer CAEN V1724 with the list mode. Details of the cross section measurements at ANNRI are described in Ref. Endo ; Igashira ; Gerard_Np ; Kimura_Am ; Terada_Am ; Endo_Ta .
3 Analysis and Results
3.1 Total cross section
3.1.1 Derivation of transmission
A TOF spectrum was obtained by cutting the pulse height of 6Li(n,) reactions. The dead-time correction was performed by the extended dead-time model Endo ; Kimura_Am , and the frame-overlap background, including a constant background, was estimated using the TOF region interrupted by the disk-chopper. Figure 2 displays TOF spectra as a function of TOF, , after dead-time corrections. The neutrons were blocked by disk-chopper after 37 ms. Thus, the region from 37 ms to 40 ms was fitted by an exponential function (6Li enriched) and a constant (7Li enriched), and the frame-overlap backgrounds were estimated by the fitting results extrapolating to the region after 40 ms.
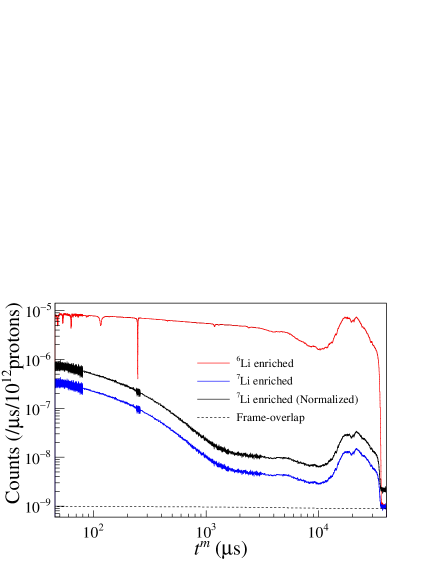
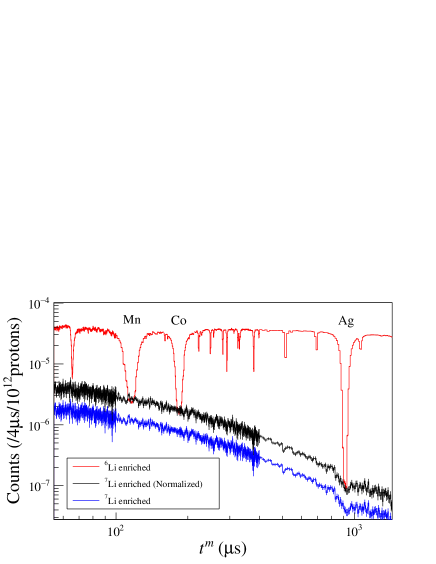
The -ray background was removed by subtracting the TOF spectrum of the 7Li enriched detector from that of the 6Li enriched one. The TOF spectra in the black resonance measurement were used to correct the difference of the detection efficiency between these detectors and shown in Fig. 3. The spectrum of the 7Li enriched detector was multiplied by to accord it with the bottom of the spectrum at the black resonances. The corrected 7Li enriched spectrum for the La measurement is simultaneously shown in Fig. 2 as “7Li enriched (Normalized)”.
3.1.2 Results of total cross section
The transmission, , was derived from the TOF spectrum of sample-in measurement divided by that of blank measurement. The total cross section was obtained as:
| (1) |
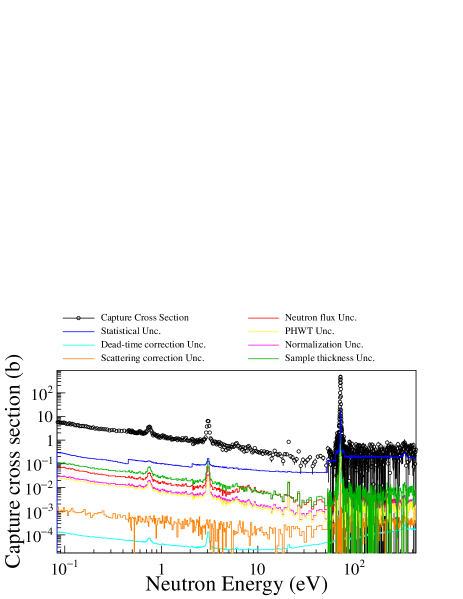
were is the areal density. Here, this cross section includes the broadening effect by the resolution function and Doppler. The broadened cross section is hereafter referred to the reduced total cross section and the reduced capture cross section. The reduced total cross section is shown in Fig. 4 with the statistical and various systematic uncertainties. The neutron flux uncertainty comes from the fluctuation of the intensity of the neutron beam due to the scattering by the air on the neutron beam line, which was estimated from the humidity and the atmospheric pressure Endo_Ta .
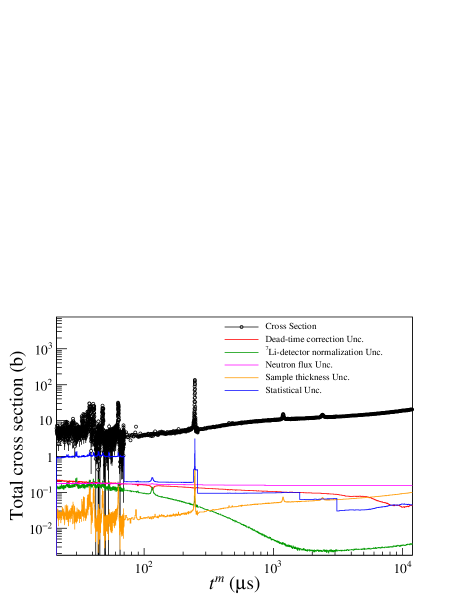
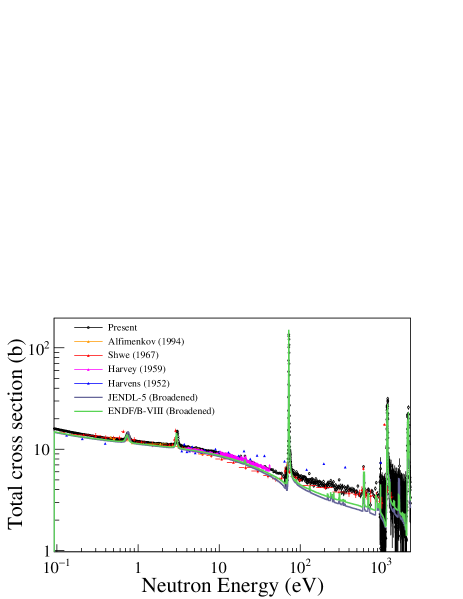
Figure 5 represents the reduced total cross section comparing to the past measurements (taken from EXFOR EXFOR ) and evaluated libraries broadened by the resolution function of ANNRI and Doppler effect. Since the resolution functions were different in each measurement, the shape of resonance has strong impacts. However, the region without resonance structure can be compared. The results are in good agreement with Harvey Harvey around 10 eV and with Shwe Shwe around a few 100 eV. On the other hand, the large discrepancy with the evaluated libraries, JENDL-5 JENDL and ENDF/B-VIII.0 ENDF , in the energy range from 80 to 900 eV, was found.
3.2 Capture cross section
3.2.1 Derivation of capture cross section
The pulse height weighting technique (PHWT) PHWT was applied to the capture cross section analysis. The capture yield as a function of TOF, , was calculated as:
| (2) |
where and are the -ray and neutron energies; is the neutron binding energy; is the number of detected event of capture -rays; is the weighting function, and it was calculated using PHITS PHITS . The obtained weighting function is as follows:
| (3) | |||||
| for La | |||||
| for Au | |||||
and is the normalization factor. This factor was determined with the following constraint that the thermal capture yield of 197Au reproduces the thermal capture cross section in JENDL-5 JENDL , 98.649 b.
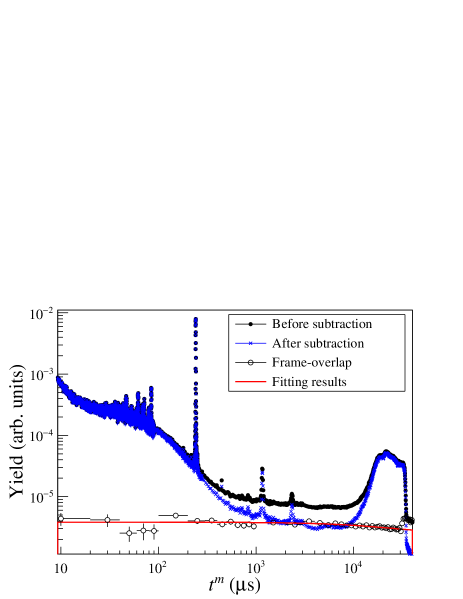
The extended dead-time model was applied to the dead-time correction Kimura_Am ; Endo . The frame-overlap background was obtained from the -ray counts when protons were not provided to MLF. In J-PARC, the protons are provided to two facilities, MLF and Main Ring (MR), with the specific allocation rate, MLF : MR =126 : 4. Therefore, when protons are provided to MR, a yield after 40 ms reflects the frame-overlap background. Figure 6 displays the yield multiplied by 126 together with a yield when protons were provided to the MLF. The frame-overlap background was subtracted from the capture yield using the fitting results performed with an exponential function.
Sample independent and sample scattered backgrou-nds were subtracted using blank and carbon measurements. The corrected yield was obtained as:
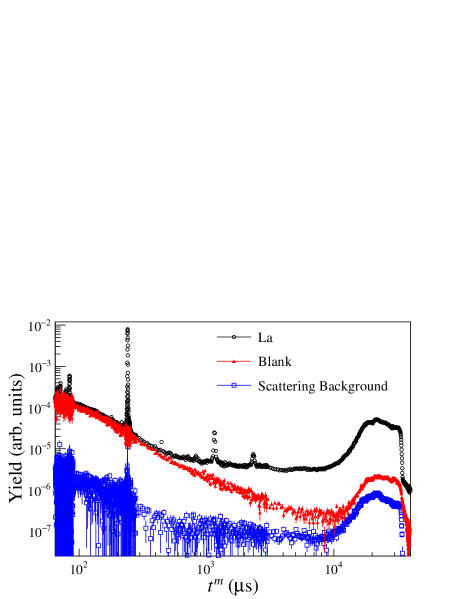
where is the yield after the frame-overlap correction; is the areal density; is the scattering cross section considering the resolution function of ANNRI obtained by Kino et al. Kino . The second term of right-hand side of Eq. (3.2.1) represents the sample-scattered background. In stead of applying the scattering cross section, the number of scattering events obtained from the PHITS simulation PHITS was used to consider the self-shielding effects on the scattering events. JENDL-4.0 was used as the input nuclear data. Figure 7 shows yields of La, blank, and sample-scattered background.
The incident neutron flux, , was obtained from the boron sample measurement by the same analysis as above. The self-shielding and multiple scattering effects were corrected by simulations using PHITS PHITS .
3.2.2 Results of capture cross section
The reduced capture cross section was obtained as
| (5) |
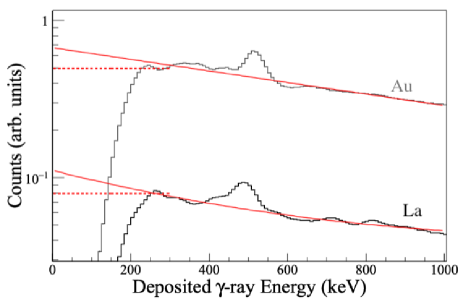
where and are the surface area of La and Au samples; is the correction factor of PHWT. The correction factor and uncertainty of PHWT are attributed to the difference in the -ray energy distributions of Au and La. To estimate the distribution of -ray counts below the detection limit of -ray energy, 300 keV, the method described in Ref. Endo_Ta was adopted. This method assumes -ray counts below the detection limit by fitting using exponential function or constant. Figure 8 shows the deposited -ray counts for La and Au near the lower limit after subtracting those of blank, and the fitting results by the exponential function and constant. The correction factor was deduced from the ratio of analyzed events to all events for La and Au. The uncertainty was calculated from the difference between the integrals of two extrapolated lines below the detection limit. The correction factor, , and the uncertainty, , of PHWT were obtained as and .
The reduced capture cross section is shown in Fig. 9 with various systematic uncertainties. The normalization uncertainty was deduced from the uncertainty of the Au yield at the thermal neutron energy including statistical, dead-time, scattering, and self-shielding uncertainties.
3.3 Resonance analysis and results
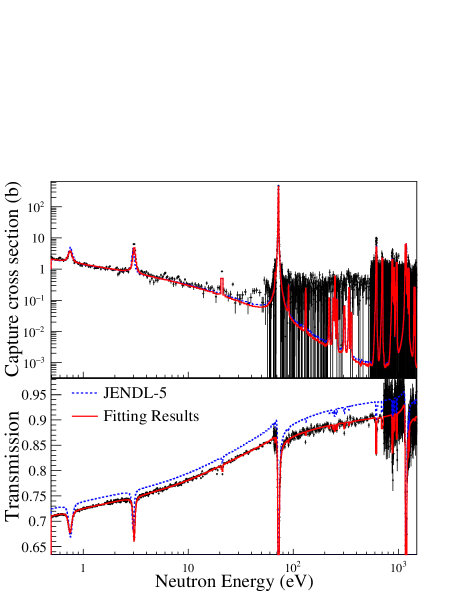
In this study, a large deviation between the present reduced total cross section and JENDL-5 was observed around 100 eV as shown in Fig. 5. This discrepancy suggests that not only the resonance parameters but also the scattering radius should be changed. Therefore, the resonance parameters and spin-dependent scattering radius were fitted using REFIT. Fitting was made for the resonance energy, neutron width, and gamma width for the negative, 0.75-eV, and 72-eV resonances and the resonance energy and neutron width for the 1180-eV resonance. The spin, , of the 72-eV resonance was used to be 3 instead of 4 as recorded in JENDL-5 JENDL based on the suggestion from the angular correlation measurement Okudaira . The other resonance parameters were fixed to those in JENDL-5. The Doppler broadening was considered by the free gas model. The resolution function in ANNRI Kino was applied.
The fitting regions were from 0.5 to 74 eV and from 0.5 to 1500 eV for the capture cross section and transmission, respectively. The region below 0.5 eV was not used for the fitting because the measured data were affected by gadolinium contained in the sample as an impurity. Alternatively, the thermal capture cross section of 9.25 b, which is the average value of three measurements with the activation method in the 2010s Priyada ; Farina ; VanDo , was taken into account in the fitting. The uncertainty was adjusted to have the same weight as that of the present transmission result.
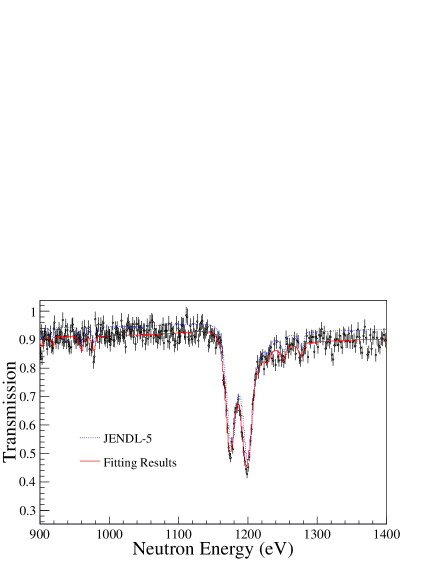
Figure 10 displays the fitting results and JENDL-5. The peaks around 0.6 eV seems to be derived from the erbium-167 of impurity, but the shape of the resonance did not match the experimental results. Therefore, this region was not considered in the fitting. The spin-dependent scattering radii were obtained to be fm and fm, and the averaged scattering radius resulted in fm which was calculated as
| (6) |
where is the spin factor, ; is the nuclear spin. The obtained resonance parameters are listed in Table 1. The past data are taken from Terlizzi et al. nTOF , Alfimenkov et al. Alfimenkov , Shwe et al. Shwe , and Harvey et al. Harvey .
| Reference | Resonance Energy [eV] | [meV] | [meV] | |
|---|---|---|---|---|
| 4/0 | Present work | |||
| JENDL-5 | -48.63 | 60.1 | 584.4 | |
| ENDF/B-VIII.0 | -48.63 | 62.2 | 572.1 | |
| 4/1 | Present work | |||
| Terlizzi et al. | ||||
| Alfimenkov et al. | ||||
| Shwe et al. | ||||
| Harvey et al. | ||||
| JENDL-5 | 0.758 | 40.1 | ||
| ENDF/B-VIII.0 | 0.734 | 45.0 | ||
| 3/0 | Present work | |||
| Terlizzi et al. | ||||
| Shwe et al. | ||||
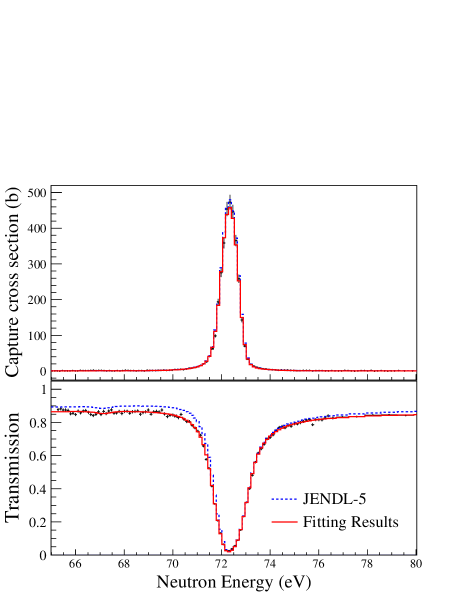
| JENDL-5 | 72.3 | 75.6 | 11.76 | |
| ENDF/B-VIII.0 | 72.3 | 52.6 | 15.15 | |
| 3/0 | Present work | (fixed) | ||
| Terlizzi et al. | 923 (fixed) | |||
| Shwe et al. | 56.5 (fixed) | |||
| JENDL-5 | 1181 | 91.6 | 923 | |
| ENDF/B-VIII.0 | 1178.7 | 50.6 | 932.5 |
4 Discussion
4.1 Cross section and positive resonance parameters
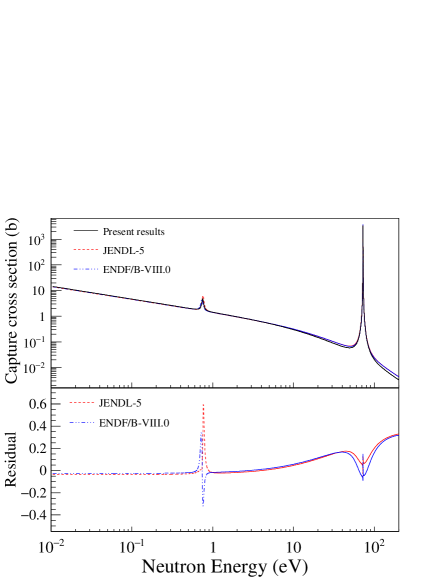
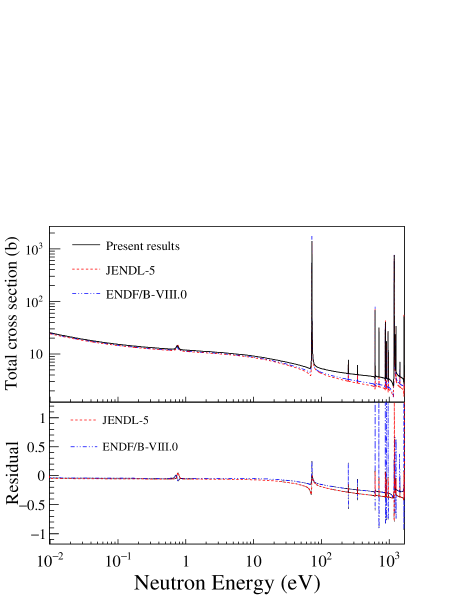
Figures 11 and 12 demonstrate the cross section calculated from the resonance parameters of the present results, , and the evaluated libraries, , with the residual defined as
| (7) |
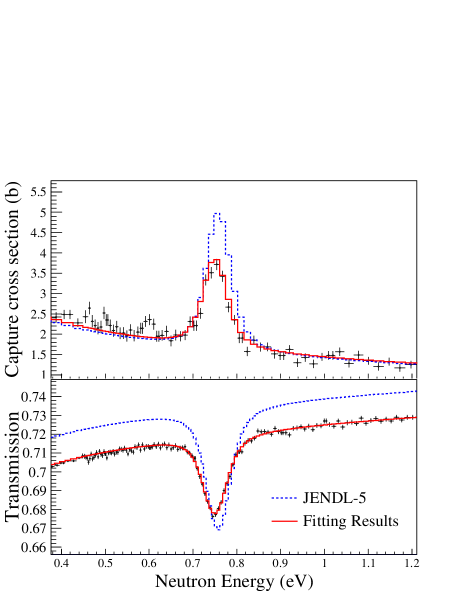
Regarding the 0.75-eV resonance, the peak of the present total and capture cross sections was almost same as those of ENDF/B-VIII.0, but it was 60% smaller than that of JENDL-5. The total cross section around 100 eV was about 20% different from the evaluated data due to the change of the scattering radius. The thermal neutron capture cross section was calculated to be b from the obtained resonance parameters. This value was a little larger than those in the evaluated libraries, 8.94 b and 9.04 b in JENDL-5 and ENDF-B/V.III.0, which were considered too small based on the results of the recent activation measurements listed in Table 2.
| Reference | Cross Section [b] |
|---|---|
| Present work | |
| Priyada et al. (2017) Priyada | |
| Priyada et al. (2017) Priyada | |
| Nguyen et al. (2014) VanDo | |
| Farina et al. (2013) Farina |
The neutron width of the 0.75-eV resonance was different from that of Terlizzi et al. nTOF , but in good agreement with that of Alfimenkov et al. Alfimenkov , Shwe et al. Shwe and Harvey et al. Harvey . Terlizzi et al. evaluated the parameter from the neutron capture cross section, while the other studies obtained it from the neutron transmission. The present results were evaluated from both the transmission and capture cross section experiments, both of which are in good agreement with the fitting results as shown in Fig. 10(b).
To estimate influence on the measurement of the power distribution in nuclear reactor, the averaged value of the cross section was calculated from the cross section of the present results and JENDL-5. The value is defined as:
| (8) |
where is the neutron spectrum in a pressurized water reactor taken from Ref. ReactorSpec . The averaged values were obtained to be b and b from the present results and JENDL-5, respectively. It was found that the change of resonance parameters only affects the derivation of power distribution by about 1%.
4.2 Negative resonance parameter
Negative resonance parameters were different from the evaluated libraries. Figure 11 indicates that the change of the negative resonance parameter has little effect on the capture cross section in the energy range below 1 eV. Change of about 20% was observed in the energy range above 10 eV, but it is difficult to measure the capture cross section in this range due to the low cross section. On the other hand, Fig. 12 presents the parameters of the negative resonance have a significant effect on the energy dependence of the total cross section. Therefore, it is necessary to fit the transmission over a wide energy range to derive the negative resonance parameters. The difference from the evaluation might be caused by the insufficient consideration of this energy dependence of transmission.
Past evaluated values of negative resonance are listed in Table 3. The parameters in Mughabghab (1981) Mughabghab1981 were changed significantly from those in Mughabghab (1973) Mughabghab1973 . The older one is relatively close to the present results. It is noted that ENDF/B-VII.0 cited Mughabghab (2006) Mughabghab2006 while ENDF/B-VI.0 did Mug-habghab (1973). The measurements added up to the update from Mughabghab (1973) were several thermal neutron capture cross sections by the activation method, two total cross sections, and one capture cross section. The thermal neutron capture cross section was little changed from b to b. Since the capture cross section measurement Musgrove was performed in the energy range above 2.7 keV, it is not seems to affect the evaluation of the negative resonance parameters. Two total cross section measurements are conducted in the energy ranges above 72.3 eV Hacken and 1 keV Camarda , respectively. The reason for such change of resonance parameters in Mughabghab (1981) was not known, but it might be difficult to accurately obtain the negative resonance parameters just from the addition of these experimental data.
| Reference | Resonance Energy [eV] | [meV] | [meV] |
|---|---|---|---|
| Present work | |||
| JENDL-5 (2023) | -48.63 | 60.1 | 584.4 |
| Mughabghab (2019) | -48.63 | (60.94) | 592.7 |
| ENDF/B-VIII.0 (2018) | -48.63 | 62.2 | 572.1 |
| ENDF/B-VII.0 (2006) | -48.63 | 62.2 | 572.1 |
| Mughabghab (2006) | -48.63 | (62.2) | 571.8 |
| ENDF/B-VI.0 (1990) | -37.5 | 50.1 | 352.1 |
| Mughabghab (1981) | -48.63 | (62.2) | 585.8 |
| Mughabghab (1973) | -37.5 | (56.5) | 352 |
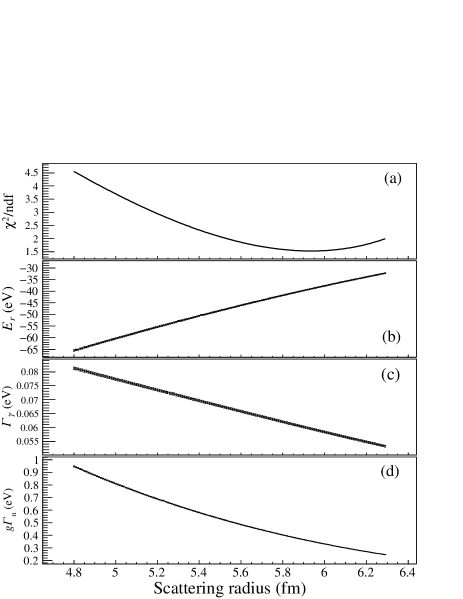
The relationship between the negative resonance parameters and the scattering radius is discussed. The scattering radius was changed from 4.80 fm to 6.30 fm in 0.01 fm steps, and the resonance parameters including negative resonance were fitted. Figure 13 shows the resonance parameters of the negative resonance for each scattering radius along with the value of the reduced chisquare, ndf. The obtained parameters were a little different from those in Table 1 because the spin-dependent scattering radius was not considered in this analysis. Figure 14 displays the fitting results for each scattering radius and indicates that the fitting was not good for value being far from 6 fm, such as fm and fm, so that the value of the reduced chisquare became large. The reduced chisquare in Fig. 13 pointed out that the fitting results could not reproduce the experimental results with only an adjustment of the negative resonance parameters when the value is far from 6 fm. In other words, to reproduce the experimental results, both the value and the negative resonance parameters needed to be adjusted.
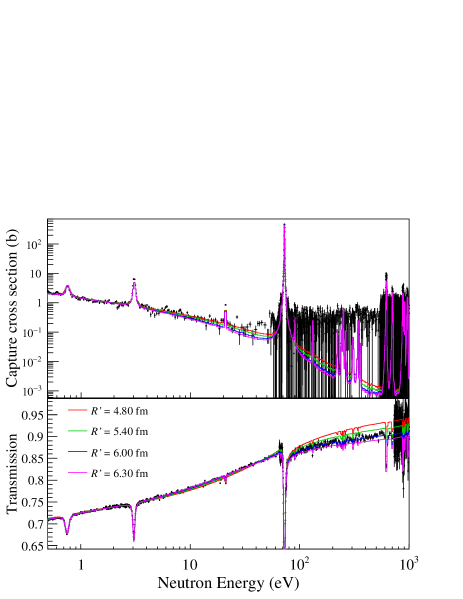
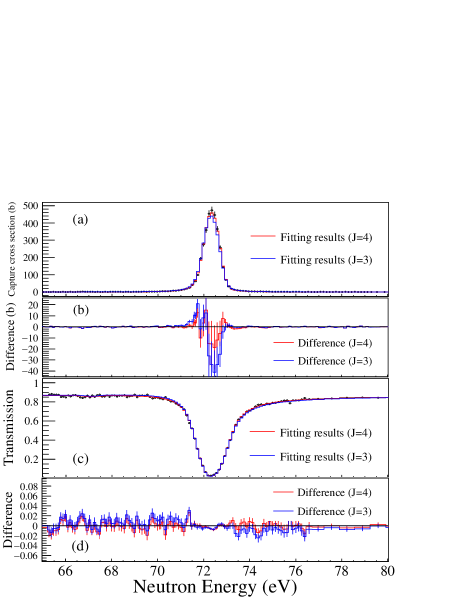
The value of spin for the negative resonance which affects most strongly on the positive energy region was assumed as 4 in aforementioned analysis. Here we discuss the case that the spin of the negative resonance is 3. The resonance parameters were evaluated using REFIT in the same method with the negative resonance spin as 3. Figure 15 compares the fitting results in the cases of and around the 72-eV resonance. Difference was calculated as the fitting results minus experimental results. The spin value of negative resonance has the largest influence on the shape of transmission near the 72-eV resonance due to the interference. Figure 15 indicates that in the case of the fitting result of the transmission is larger than the experimental result at the low energy-side, while the one is smaller than that at high energy-side. Therefore, in the case of , the cross section calculated from resonance parameters could not reproduce the measurement results well. Furthermore, the average level spacing was evaluated to be eV nTOF . The first resonance of is located at 72-eV, while the one of is done at eV. Therefore, the first negative resonance is more likely the resonance, considering the resonance spacing.
The parity-violation amplitude is predicted by the s-p mixing model Flambaum to be
| (9) |
where is the individual weak matrix element. In 139La case, the value of was established Michel . The weak matrix element was calculated to be and meV using resonance parameters in JENDL-5 and present results, respectively. The weak matrix element was changed by 25%, which was much larger than the accuracy of the parity-violation measurement, . The accuracy of the resonance parameters used to interpret the results of the angular correlation measurements based on the s-p mixing model would be important in the future.
4.3 Potential scattering radius of 139La
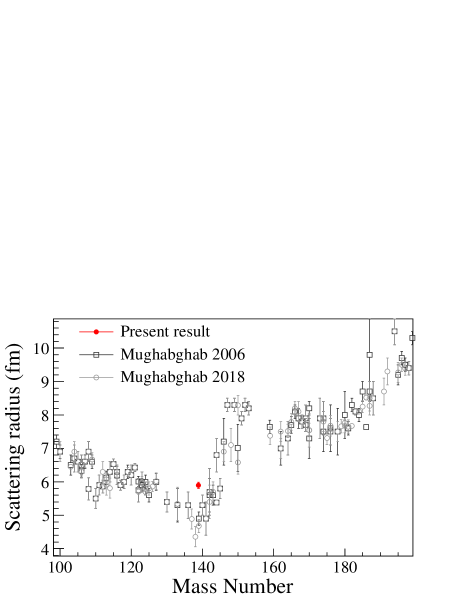
The present scattering radius, 5.94 fm on average, is larger than 4.8 fm recorded in JENDL-5. Shwe et al. Shwe estimated the scattering radius as fm by a curve fit of the transmission around the 72-eV resonance. In their analysis, the spin dependence of the nuclear radius was not considered. Since the 72-eV resonance is , it is appropriate to compare the from Shwe et al. with the fm in the present analysis, and they are in good agreement. Figure 16 shows the mass number dependence of scattering radius taken from Mughabghab Mughabghab2006 ; Mughabghab with the present results. The scattering radii of nuclei near 139La indicates that the value of 5.89 fm does not deviate significantly from those of near nuclei although it seems a little large.
Knopf and Waschkowski Knopf determined the scattering radius as fm by a Christiansen-Filter Technique Koester ; Koes . The scattering radius in Mugh-abghab and JENDL-5 was evaluated based on this results. In the Christiansen-Filter Technique, the coherent scattering length at the slow neutron energy can be obtained, and the scattering radius is deduced by subtracting the resonance effect from the scattering length. The scattering radius was calculated as Mughabghab
| (10) |
where is the mass number; is the bound coherent scattering length; is the resonance energy; is the reduce neutron width defined as
| (11) |
The second term in Eq. (10) represents the resonance effect. The negative resonance effect was calculated using the present results and the Mughabghab parameters Mughabghab1981 , which Knopf and Waschkowski employed, were and fm, respectively. Therefore, if the present result for negative resonance is used, the scattering radius obtained from the coherent scattering length becomes fm. This result is in good agreement with the present results. Therefore, the value, 4.8 fm, recorded in JENDL-5 may be small.
5 Conclusion
The cross sections and resonance parameters of 139La are significant for the applications in nuclear technology and the studies in fundamental nuclear physics. In particular, the resonance parameters are required to interpret the measurement results of the angular correlation terms for verification of the s-p mixing model. The neutron total and capture cross sections were measured in J-PARCMLFANNRI. The total cross section is in good agreement with that of past measurements, but the discrepancy with the evaluated libraries in non-resonance region around 100 eV was found. Since the scattering radius could have been estimated to be small, not only the resonance parameters but also the scattering radius was evaluated using the obtained transmission and capture cross section by the resonance analysis code, REFIT. The resonance parameters of four resonances including one negative resonance were obtained. The neutron width of the 0.75-eV resonance was different from that in the most recent measurement but consistent with that in other previous measurements. The negative resonance parameters were also different from the evaluated nuclear data libraries. The spin-dependent scattering radii were obtained to be fm and fm, and the averaged scattering radius was calculated as fm. This result was compared with the past measurements, and it was pointed out that the scattering radius recorded in the evaluated libraries might have been estimated too small.
Acknowledgements.
The authors would like to thank the staff of ANNRI for the maintenance of the germanium detectors, and MLF and J-PARC for operating the accelerators and the neutron production target. The neutron experiments at the MLF of J-PARC were performed under the user program (Proposals No. 2023P0300). This work was supported by the Neutron Science Division of KEK as an S-type research project with program number 2018S12. This work was partially supported by JSPS KAKENHI Grant No. JP20K14495 and JP21K04950.References
- (1) L.R. Greenwood, R. Paviotti-Corcuera, International Nuclear Data Committee, Summary Report on International Reactor Dosimetry File: IRDF-2002. Tech. rep., INDC(NDS)-435 (2002)
- (2) T.R. England, B.F. Rider, ENDF-349 Evaluation and Compilation of Fission Product Yields 1993. Tech. rep., LA-UR-94-3106 (1994)
- (3) P. Panikkath, P. Mohanakrishnan, Eur. Phys. Jour. A 53(3), 46 (2017). DOI https://doi.org/10.1140/epja/i2017-12231-8
- (4) C.D. Bowman, J.D. Bowman, V.W. Yuan, Phys. Rev. C 39, 1721 (1989). DOI https://link.aps.org/doi/10.1103/PhysRevC.39.1721
- (5) V.W. Yuan, et al., Phys. Rev. C 44, 2187 (1991). DOI https://link.aps.org/doi/10.1103/PhysRevC.44.2187
- (6) G.E. Mitchell, J.D. Bowman, S.T. Penttilä, E.I. Sharapov, Phys. Rep. 354(3), 157 (2001). DOI https://doi.org/10.1016/S0370-1573(01)00016-3
- (7) V.V. Flambaum, O.P. Sushkov, Nucl. Phys. A 435(2), 352 (1985). DOI https://doi.org/10.1016/0375-9474(85)90469-5
- (8) T. Okudaira, et al., Phys. Rev. C 97, 034622 (2018). DOI https://link.aps.org/doi/10.1103/PhysRevC.97.034622
- (9) T. Okudaira, et al., Phys. Rev. C 104, 014601 (2021). DOI https://link.aps.org/doi/10.1103/PhysRevC.104.014601
- (10) T. Yamamoto, et al., Phys. Rev. C 101, 064624 (2020). DOI https://link.aps.org/doi/10.1103/PhysRevC.101.064624
- (11) J. Koga, et al., Phys. Rev. C 105, 054615 (2022). DOI https://link.aps.org/doi/10.1103/PhysRevC.105.054615
- (12) S. Endo, et al., Phys. Rev. C 106, 064601 (2022). DOI https://link.aps.org/doi/10.1103/PhysRevC.106.064601
- (13) T. Okudaira, et al., Phys. Rev. C 107, 054602 (2023). DOI https://link.aps.org/doi/10.1103/PhysRevC.107.054602
- (14) R. Terlizzi, et al., Phys. Rev. C 75, 035807 (2007). DOI https://link.aps.org/doi/10.1103/PhysRevC.75.035807
- (15) N.M. Larson, Updated User’s Guide for SAMMY: Multilevel R-Matrix Fits to Neutron Data Using Bayes’ Equations. ORNL/TM-9179/R4, Oak Ridge National Laboratory (2008)
- (16) H. Shwe, R.E. Coté, W.V. Prestwich, Phys. Rev. 159, 1050 (1967). DOI https://link.aps.org/doi/10.1103/PhysRev.159.1050
- (17) J.A. Harvey, R.C. Block, G.G. Slaughter, Bull. Am. Phys. Soc. 4, 385 (1959)
- (18) V. Alfimenkov, et al., Nucl. Phys. A 398(1), 93 (1983). DOI https://doi.org/10.1016/0375-9474(83)90649-8
- (19) M.C. Moxon, T.C. Ware, C.J. Dean, REFIT-2009 A Least-Square Fitting Program for Resonance Analysis of Neutron Transmission, Capture, Fission and Scattering Data Users’ Guide for REFIT-2009-10. UKNSF (2010)
- (20) S. Endo, et al., J. Nucl. Sci. Technol. 59(3), 318 (2022). DOI https://doi.org/10.1080/00223131.2021.1970040
- (21) M. Igashira, Y. Kiyanagi, M. Oshima, Nucl. Instrum. Methods Phys. Res. A 600(1), 332 (2009). DOI https://doi.org/10.1016/j.nima.2008.11.085
- (22) G. Rovira, et al., J. Nucl. Sci. Technol. 57(1), 24 (2020). DOI https://doi.org/10.1080/00223131.2019.1651231
- (23) A. Kimura, et al., J. Nucl. Sci. Technol. 56(6), 479 (2019). DOI https://doi.org/10.1080/00223131.2019.1598508
- (24) K. Terada, et al., J. Nucl. Sci. Technol. 55(10), 1198 (2018). DOI https://doi.org/10.1080/00223131.2022.2141903
- (25) S. Endo, et al., Nucl. Sci. Eng. In press (2023). DOI https://doi.org/10.1080/00295639.2023.2227826
- (26) Exfor. [cited 2023 Mar 05]. Available from https://www-nds.iaea.org/exfor/
- (27) O. Iwamoto, et al., J. Nucl. Sci. Technol. 60(1), 1 (2023). DOI https://doi.org/10.1080/00223131.2022.2141903,
- (28) D. Brown, et al., Nucl. Data Sheets 148, 1 (2018). DOI https://doi.org/10.1016/j.nds.2018.02.001
- (29) R.L. Macklin, J.H. Gibbons, Phys. Rev. 159, 1007 (1967). DOI https://link.aps.org/doi/10.1103/PhysRev.159.1007
- (30) T. Sato, et al., J. Nucl. Sci. Technol. 55(6), 684 (2018). DOI https://doi.org/10.1080/00223131.2017.1419890
- (31) K. Kino, et al., Nucl. Instrum. Methods Phys. Res. A 736, 66 (2014). DOI https://doi.org/10.1016/j.nima.2013.09.060
- (32) F. Farina Arboccò, P. Vermaercke, K. Smits, L. Sneyers, K. Strijckmans, J. Radioanal. Nucl. Chem. 296, 931 (2013). DOI https://doi.org/10.1007/s10967-012-2132-0
- (33) N. Van Do, et al., Nucl. Instrum. Methods Phys. Res. B 335, 1 (2014). DOI https://doi.org/10.1016/j.nimb.2014.05.018
- (34) K. Shibata, Descriptive Data of JENDL-3.3. Tech. rep., JAERI Data/Code 2002-026 (2002)
- (35) S.F. Mughabghab, M. Divadeenam, N.E. Holden, Neutron Cross Sections. Vol. 1 (Academic Press, New York, 1981)
- (36) S.F. Mughabghab, D.I. Garber, Neutron Cross Sections, Volume 1, Resonance Parameters (Brookhaven national laboratory, BNL-325, 1981)
- (37) S.F. Mughabghab, Atlas of Neutron Resonance 5th edition (Elsevier, New York, 2006)
- (38) A.R. de L Musgrove, B.J. Allen, R.L. Macklin, Aust. J. Phys. 30(6), 599 (1977). DOI https://doi.org/10.1071/PH770599
- (39) G. Hacken, J. Rainwater, H.I. Liou, U.N. Singh, Phys. Rev. C 13, 1884 (1976). DOI https://link.aps.org/doi/10.1103/PhysRevC.13.1884
- (40) H.S. Camarda, Phys. Rev. C 9, 28 (1974). DOI https://link.aps.org/doi/10.1103/PhysRevC.9.28
- (41) S.F. Mughabghab, Atlas of neutron resonances. Vol. 1. 6th ed. (Elsevier, Amsterdam, 2018)
- (42) K. Knopf, W. Waschkowski, Z. Naturforsch 87, 1132 (1982). DOI https://doi.org/10.1515/zna-1982-1005
- (43) L. Koester, K. Knopf, Z. für Naturforschung A 26, 391 (1971). DOI https://doi.org/10.1515/zna-1971-0308
- (44) L. Koester, H. Rauch, E. Seymann, Atomic Data and Nucl. Data Tables 49(1), 65 (1991). DOI https://doi.org/10.1016/0092-640X(91)90012-S