Large Language Models at Work in China’s Labor Market
Abstract
This paper explores the potential impacts of large language models (LLMs) on the Chinese labor market. We analyze occupational exposure to LLM capabilities by incorporating human expertise and LLM classifications, following Eloundou et al. (2023)’s methodology. We then aggregate occupation exposure to the industry level to obtain industry exposure scores. The results indicate a positive correlation between occupation exposure and wage levels/experience premiums, suggesting higher-paying and experience-intensive jobs may face greater displacement risks from LLM-powered software. The industry exposure scores align with expert assessments and economic intuitions. We also develop an economic growth model incorporating industry exposure to quantify the productivity-employment trade-off from AI adoption. Overall, this study provides an analytical basis for understanding the labor market impacts of increasingly capable AI systems in China. Key innovations include the occupation-level exposure analysis, industry aggregation approach, and economic modeling incorporating AI adoption and labor market effects. The findings will inform policymakers and businesses on strategies for maximizing the benefits of AI while mitigating adverse disruption risks.
Introduction
The recent remarkable progress in the field of generative AI and large language models (LLMs) (Bubeck et al. 2023; Zhao et al. 2023) has provoke many pressing questions about the effects of these powerful technologies on the economy. One of the most significant questions surrounding advances in Generative AI and LLMs is the impact these technologies will have on the dynamics of labor market due to the influence of LLMs on labor inputs. A branch of research emphasizing on the disruptive labor market impacts of LLMs is emerging quickly, however, it predominantly focuses attention on the labor market in developed economy, in particularly U.S. (Eloundou et al. 2023; Peng et al. 2023; Noy and Zhang 2023; Brynjolfsson, Li, and Raymond 2023; Felten, Raj, and Seamans 2023). Nevertheless, countries differ in their labor market structures such as occupation and industry composition. Even for the same occupation, the detailed task composition or work content may show great discrepancies across countries. Therefore, this paper analyzes the potential impacts of LLMs on China’s labor market. To construct our primary exposure index, we use a recently developed methodology to systematically assess which occupations are most exposed to advances in LLMs in China. Specifically, we employ three large language models – GPT4 (OpenAI 2023), InternLM (InternLM-Team 2023), and GLM (Zeng et al. 2022; Du et al. 2022) – as classifiers to determine the occupational exposure based on the detailed description for each occupation contained in the general code of occupational classification of the People’s Republic of China. We also employ expert annotators to explore the impacts of LLMs, to make comparisons, and to shed more light on this issue.
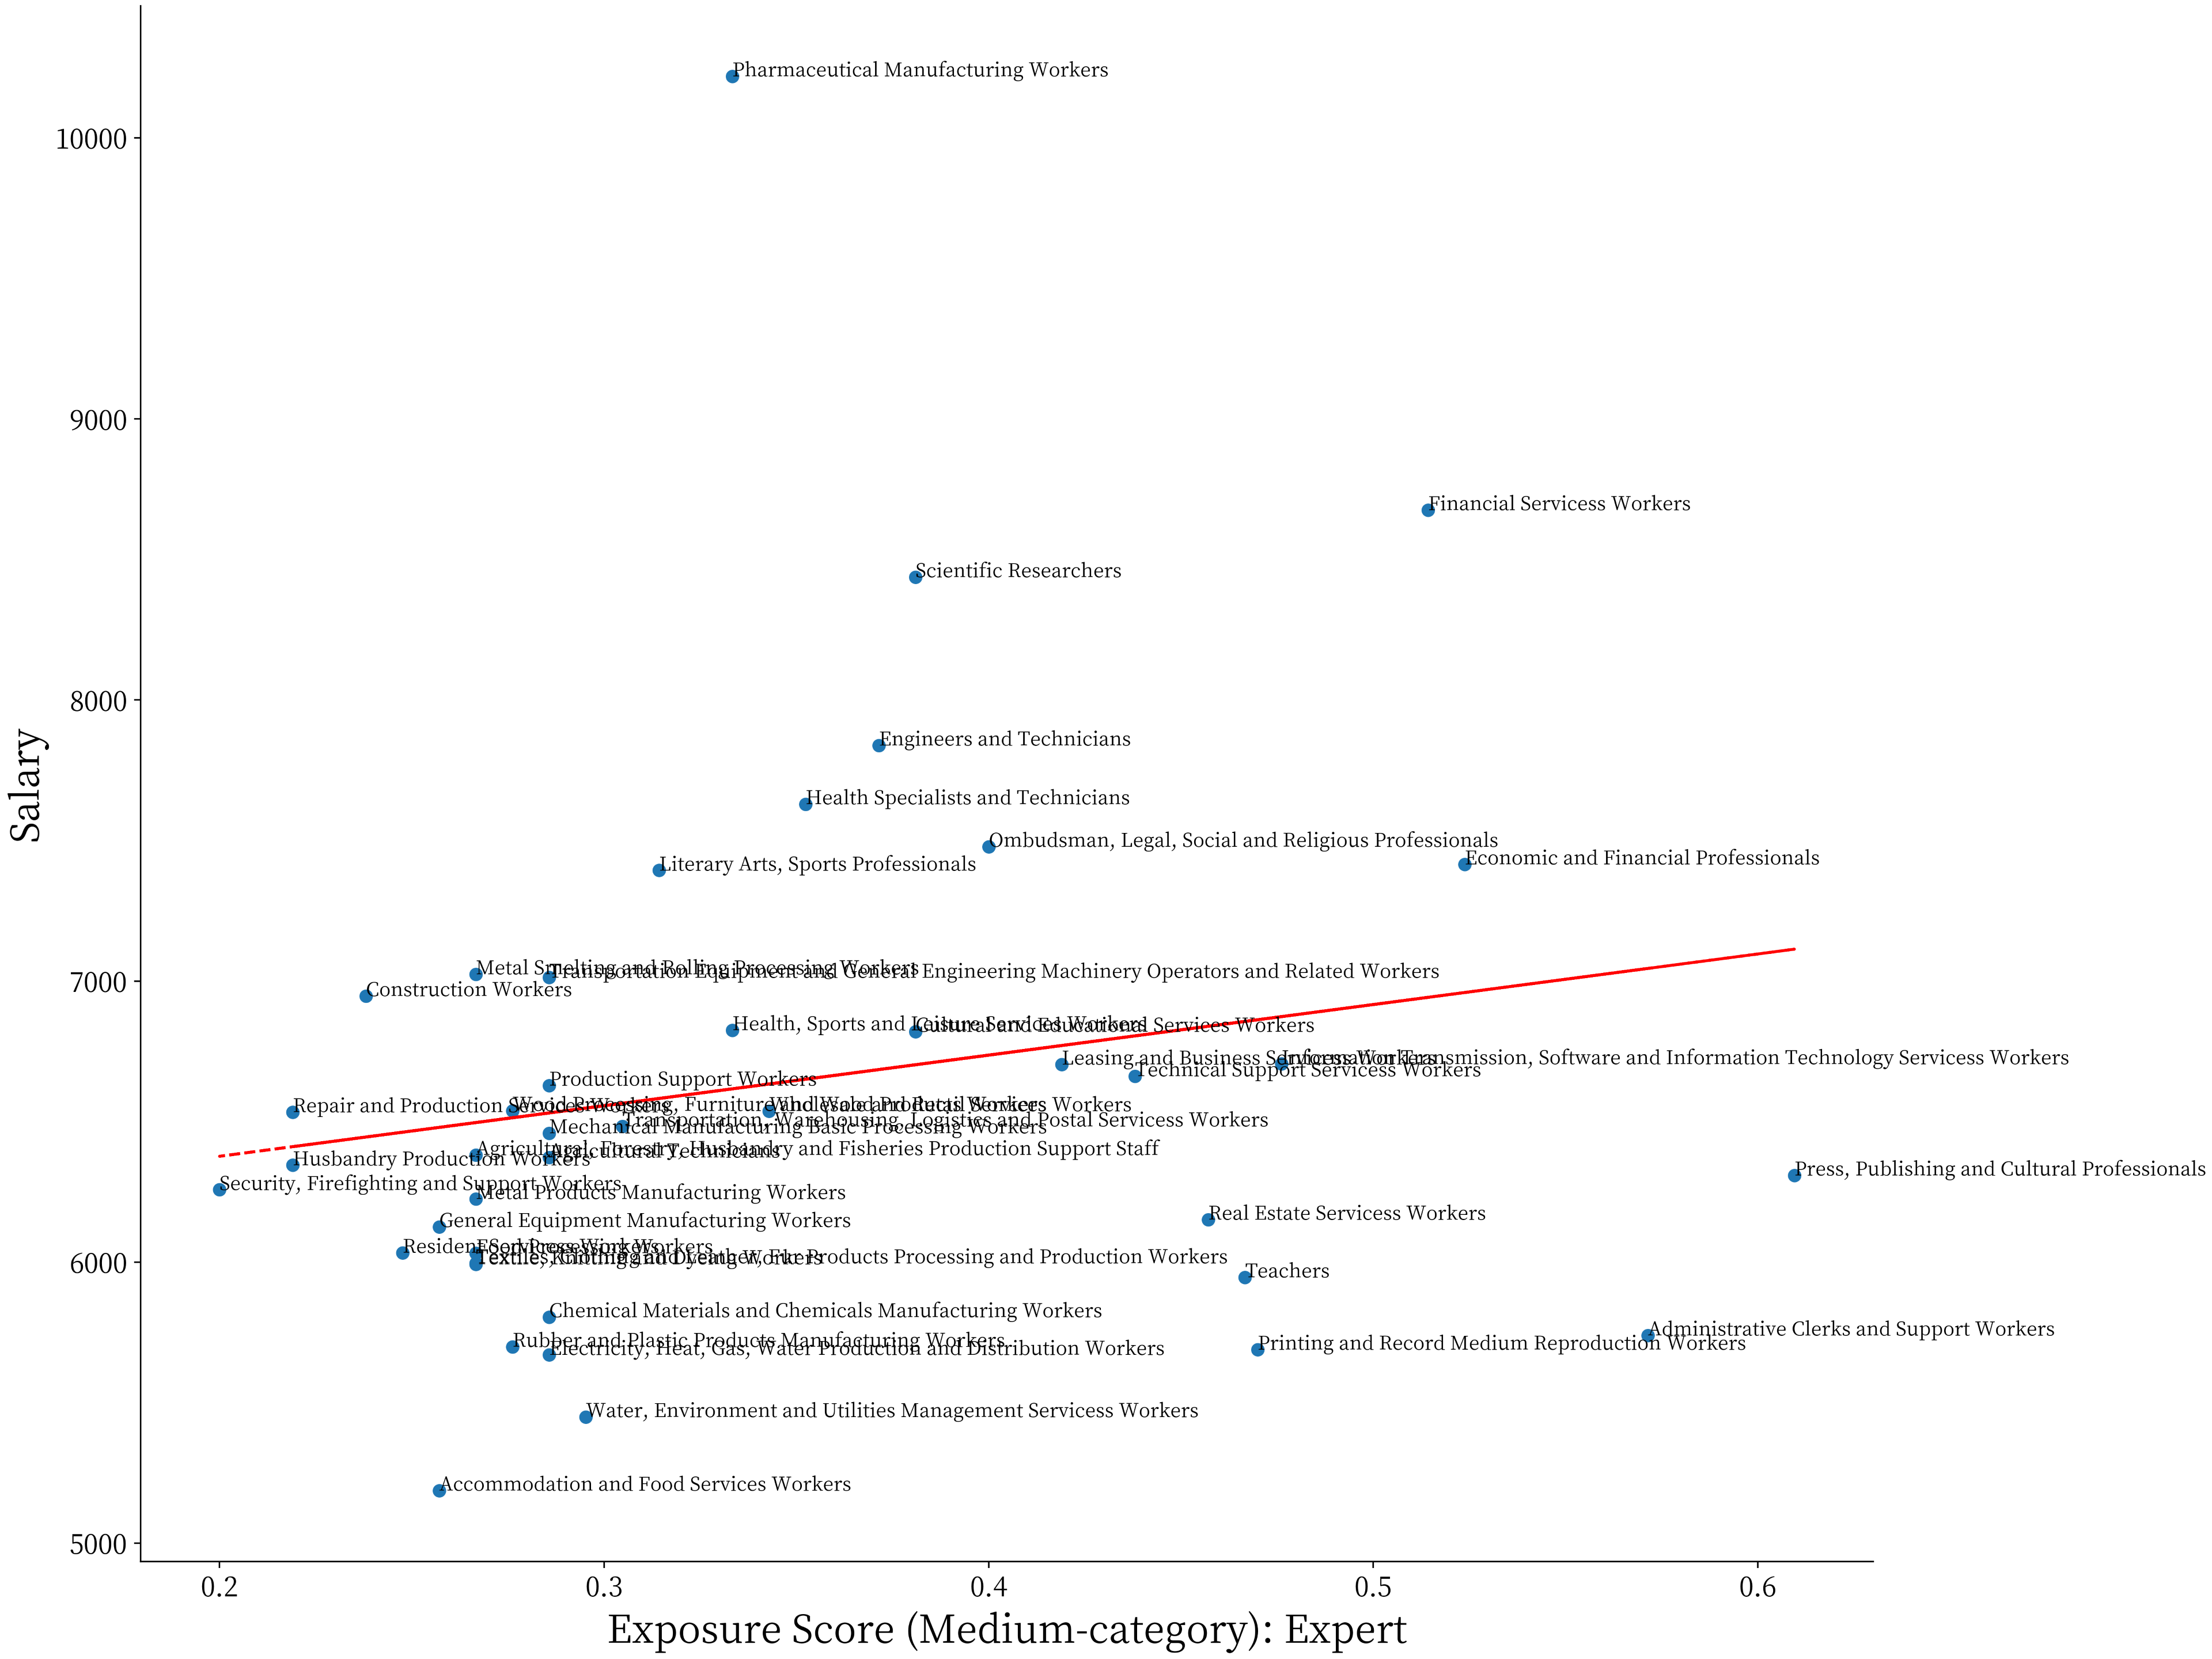
We then characterize the profile of occupational exposure to LLMs based on characteristics of the occupation in China. Our analysis indicates that the impacts of LLMs on China’s labor market are likely to be pervasive and diverse. The results show a great heterogeneous exposure across occupations and suggest that more educated, relatively high-paid, white-collar occupations may be most exposed to LLMs. In addition to the positive correlation between wage, education and occupational exposure, we also find a positive correlation between experience premium and exposure to LLMs, implying a potential diminishing return of learning by doing in the future. We analyze exposure by industry and discover that the education and healthcare industries exhibit high exposure, while manufacturing, agriculture, mining, and construction demonstrate lower exposure. Unlike other developed countries, that young and old cohort distribute highly unevenly across industries in China demonstrate a great variance of demographic exposure of LLMs. Relatively LLMs inevitably exert a higher impact on young age employers.
Our analysis also indicates that LLMs will have a greater impact on labor demand. We utilize an online job postings dataset from January 2017 to December 2022 in China to construct an occupational vacancies index. We find a positive correlation between the share of vacancies and exposure score at occupation level. This implies that the labor demand structure is likely to exacerbate the disruptive impacts on the labor market in China. Additionally a positive correlation between the growth rate of vacancy shares and exposure scores indicates a potential reversal of the occupational labor demand trend. Contrary to popular expectations, the economic and labor market structure in China exacerbate the disruptive impacts of LLMs rather than alleviate them.
When faced with the potential relevance of LLMs, it becomes imperative to address the issue of regulating LLMs. To structure our discussion, we present a simple theoretical model. Transformative technologies like LLMs exert a heterogeneous impact on different occupations or industries. The regulation of LLMs needs to strike a balance between the positive productivity effects and the negative disruption costs on labor markets. Our analysis provides the initial steps toward a comprehensive quantitative evaluation.
The paper is structured as follows: Section 2 reviews the related literature, Section 3 discusses methods and data collection, Section 4 presents the main results, Section 5 introduces a theoretical model to further discuss the impacts of LLMs, and Section 6 offers concluding remarks.
Literature Review
Artificial Intelligence, like previous technologies, is poised to impact the economy in various ways, potentially fostering economic growth and reshaping the labor market structure (Furman and Seamans 2019; Goldfarb, Taska, and Teodoridis 2023). A substantial and expanding body of literature delves into the labor market consequences of artificial intelligence and automation technologies broadly defined. The skill-biased technological change framework (Katz and Murphy 1992; Acemoglu 2002), along with the task-based framework of automation (Autor, Levy, and Murnane 2003; Acemoglu and Autor 2011; Acemoglu and Restrepo 2018) are often regarded as the foundational frameworks for comprehending technology’s impact on the labor market. This line of research has introduced the concept of routine-biased technological change, indicating that workers engaged in routine tasks face a heightened risk of displacement due to technological advancements. Numerous studies have demonstrated that automation technologies have contributed to both income inequality and job polarization, driven by declines in relative wages and employment for workers specializing in routine tasks (Autor, Katz, and Kearney 2006; Van Reenen 2011; Acemoglu and Restrepo 2022). The influence of AI on work is anticipated to be multi-faceted. Recent studies have made distinctions between task-displacement and task-reinstatement effects of technology, whereby new technology introduces novel occupations that bolster labor demand (Acemoglu and Restrepo 2018, 2019).
Historically, prior research has predominantly adopted the task-oriented approach to analyze the labor market impacts of artificial intelligence. Various methods have been employed to evaluate the similarity between AI capabilities and the tasks performed by workers across different occupations. These methodologies encompass aligning AI capabilities with diverse skills and abilities demanded by distinct occupations (Felten, Raj, and Seamans 2018; Tolan et al. 2021), mapping AI patent descriptions to worker task descriptions (Webb 2019; Meindl, Frank, and Mendonça 2021), employing machine learning classifiers to estimate the potential for automation across all occupations (Frey and Osborne 2017), devising innovative rubric the suitability of worker activities by machine learning (Brynjolfsson, Mitchell, and Rock 2018), and leveraging expert forecasts (Grace et al. 2018).
Nevertheless, this line of research is becoming increasingly challenging due to the evolving and advancing capabilities of AI. Following recent breakthroughs in Generative AI and LLMs, there has been a growing body of studies investigating the specific economic impacts and opportunities presented by LLMs. For instance, Peng et al. (2023) conducted a study where software engineers were enlisted for a specific coding task, revealing that those with access to GitHub Copilot completed the task twice as quickly. Similarly, Noy and Zhang (2023) conducted an online experiment to explore the displacement effects of Generative AI on professional writing tasks. Additionally, Brynjolfsson, Li, and Raymond (2023) examined the effects of Generative AI on customer support agents. Pertinent to this paper, Felten, Raj, and Seamans (2023) explored the heterogeneity in occupational exposure, while Eloundou et al. (2023) introduced a novel rubric to assess the impacts of LLMs on labor forces. Concurrently with this line of inquiry, we aim to characterize the potential relevance of LLMs to China’s labor market in particular.
Our paper is intricately linked to the emerging literature of on the regulation of transformative technologies like LLMs. Preliminary contributions to the AI and regulation discourse include works such as Galasso and Luo (2018) and Agrawal, Gans, and Goldfarb (2019), which delve into the implications of privacy and trade policies concerning AI adoption. Acemoglu and Lensman (2023) develop a multi-sector technology adoption model to explore the optimal regulation of transformative technologies in instances where society can progressively comprehend associated risks. In line with this discourse, we present a static multi-sector model aimed at addressing the regulatory tradeoff concerning LLMs. This model is designed to incorporate the potential disruptions stemming from the labor replacement effect, thereby contributing to a comprehensive understanding of the regulatory dynamics surrounding LLMs.
Methodology of Exposure Scoring and Data Collection
Data on Occupations in China
In order to assess occupational exposure scoring in China and facilitate standardized comparisons, a consistent occupational classification system is essential. The Occupational Classification Dictionary of the People’s Republic of China (OCD) version 2022, published by the National Bureau of Statistics of China (NBS) and the Ministry of Human Resources and Social Security of the People’s Republic of China (MOHRSS), provides such a classification system that serves as a standardized analytical tool for occupations. In particular, we utilize the general code of Occupational Classification of the People’s Republic of China 2022, which encompasses comprehensive information across 8 large categories, 79 medium categories, 449 small categories, and 1636 fine categories. This information, includes the definition of each occupation, the content and format of work activities, as well as specific description of the scope of work activities. We leverage the detailed descriptions of various occupations to facilitate the classification of online job vacancies into distinct occupational categories. To provide further clarity, a sample of occupations and their exposure to LLMs, categorized by medium categories, is presented in Appendix A.
Data on Wages and Vacancies
To acquire both vacancy and wage information, we leverage two datasets. Our primary data source is an online job posting dataset collected by the City Data Group. The dataset compiles online job postings spanning from January 2017 to December 2022, originating from major online job market platforms in China including zhaoping.com, 51job, 58.com, Ganji.com, Lagou.com, and Kanzhun. This comprehensive compilation encompasses over 800 million job openings across nearly 400 cities and 5.2 million employers. For each job vacancy entry within this database, we have access to a range of information: including the posting date, position type, occupation titles, the quantity of workers to be recruited, wage ranges (if specified), education requirements (if applicable), work experience prerequisites (if indicated), the name of the employing firm, the work location for the position, and the textual content of job descriptions. Following the classification of each job posting distinct occupations, we derive corresponding statistics encompassing the number of vacancies, the typical educational qualifications required for entry, and the wage structure within each occupation.
Our second data source is the China Labor-force Dynamic Survey (CLDS) 2016, conducted by the Social Science Survey Center of Sun Yat-sen University. The CLDS surveys the working-age population to explore aspects such as education, employment, labor rights, occupational mobility, health, and well-being. The survey encompasses comprehensive industry and occupation information for each employment entry. Consequently, we can harness this dataset to construct an occupational intensity index for each industry. This index facilitates the acquisition of an exposure score at the industry level derived from occupational exposure scores. Further details regarding the occupational intensity index across 15 industry categories are presented in Appendix C.
Methodology of Exposure Scoring
To evaluate the likelihood of an occupation in China undergoing a disruptive shock due to the widespread availability and utilization of LLMs, we continue to adopt a task-based approach. We gauge the exposure of each occupation to LLMs based on the comprehensive occupation descriptions in Chinese, as documented the Occupational Classification Dictionary of the People’s Republic of China 2022. Building upon the exposure scoring methods proposed by Eloundou et al. (2023) which conceive an occupation as a collection of tasks, assess whether a given occupation can be executed more efficiently using ChatGPT or analogous LLMs. Our methodology employs three prominent large language models to determine exposure of various occupations. Specifically, we utilize Open AI’s GPT-4 model (OpenAI 2023), the InternLM model developed by Shanghai AI Laboratory and Sense Time (InternLM-Team 2023), and the GLM (Zeng et al. 2022; Du et al. 2022) to categorize occupations based on their complete set of occupational descriptions. Each of these models operates based on a comprehensive rubric for scoring LLMs exposure. We, then, submit an occupation’s description, in conjunction with its title, to each model. In response, each model provides an exposure score. These scores effectively capture whether the time required to complete a task could be halved while maintaining consistent quality, assuming a worker has access to ChatGPT-like LLMs. The Scores are divided into four categories: E0, E1, E2, and E3, the details of each category are presented in Appendix A.
Although we share similar methodologies with Eloundou et al. (2023), several caveats should be noted. First, all the occupational description and prompt are in Chinese, our exercise relies on capabilities of the Chinese large language models. To accomplish better Chinese language performance, we use two top Chinese large language models-GLM and InternLM-in addition to GPT4. Second, the Occupational Classification Dictionary of the People’s Republic of China contains only detailed work content and descriptions for each occupation. Therefore, it is infeasible to calculate exposure score at the task level as Eloundou et al. (2023). Instead, we choose to calculate exposure score directly at the occupation level.
OpenAI has pointed out several weaknesses of the method, such as the validity of the task-based framework, relative versus absolute measures, as well as forward-looking and changing nature of the scores. Another limitation we would like to discuss here is the randomness of LLM scoring. The same prompt can still yields different results from large language models, even with a higher temperature setting. In order to compensate for this issue, we first had each LLM model label each occupation 8 times and calculated the scores. We then took the average as the final scoring result for each LLM model for each occupation.
To compare the consistency of LLM scoring with human scoring, we invited 21 experts in economics and artificial intelligence to serve as judges. We provided them with descriptions of medium-category occupations in China and asked them to score each occupation according to the rating criteria. After collecting the scores from all of the experts, we calculated the average score for each occupation as the final human score. The rating criteria represented the proportion of labor input that large language models could save in each occupation. More details on expert evaluation is presented in Appendix A.
Results and Assessment of Impacts of LLMs on China’s Labor Market
Summary Statistics
We employed the aforementioned methodology to gather results from GPT-4, GLM, and InternLM, subsequently assigning scores to the fine categories occupations. We designated E1 as 1 point, E2 and E3 as 0.5 points each, and E0 as 0 points. It is worth noting that the OCD encompasses 8 large categories, which also include 3 distinctive categories: ”National institutions, party and mass organizations leaders”, ”Military personnel”, and ”Other personnel not classified elsewhere”. In the subsequent sections, our results exclude these three categories of occupations, thereby focusing on 1606 fine-category occupations. The scores assigned to small-category, medium-category and large-category occupations represent the averaged scores of the occupations they encompass from the higher level. A comprehensive summary of these metrics, along with the correlations between different models, is provided in the Table 1.
| Fine Categories Occupation Level Exposure | |||
| GLM | InternLM | GPT-4 | |
| count | 1606 | 1606 | 1606 |
| mean | 0.44 | 0.18 | 0.24 |
| std | 0.26 | 0.18 | 0.21 |
| Fine Categories Occupation Level Exposure Corr. | |||
| GLM | InternLM | GPT-4 | |
| GLM | 1.0*** | 0.284*** | 0.1915*** |
| InternLM | 0.284*** | 1.0*** | 0.2887*** |
| GPT-4 | 0.1915*** | 0.2887*** | 1.0*** |
| Medium Categories Occupation Level Exposure | |||
| GLM | InternLM | GPT-4 | |
| count | 63 | 63 | 63 |
| mean | 0.40 | 0.14 | 0.22 |
| std | 0.15 | 0.10 | 0.18 |
| Medium Categories Occupation Level Exposure Corr. | |||
| GLM | InternLM | GPT-4 | |
| GLM | 1.0*** | 0.5938*** | 0.306* |
| InternLM | 0.5938*** | 1.0*** | 0.4807*** |
| GPT-4 | 0.306* | 0.4807*** | 1.0*** |
When examining the scoring across fine-categories occupations, GLM demonstrated an average of 0.44, while InternLM and GPT-4 yielded averages of 0.18 and 0.24 respectively. This suggests that, on average, GLM ascribes stronger capabilities to LLMs and deems occupations to be more susceptible to LLMs exposure. Despite variations in the models’ scoring and comprehension of occupations, the scoring outcomes from three models exhibited noteworthy positive correlations. This held true across fine-category, small-category, and medium-category occupations. We synthesized the outcomes from the three models, and throughout the subsequent analysis, unless otherwise specified, we relied on the average scores generated by the three models based on medium-category occupations.
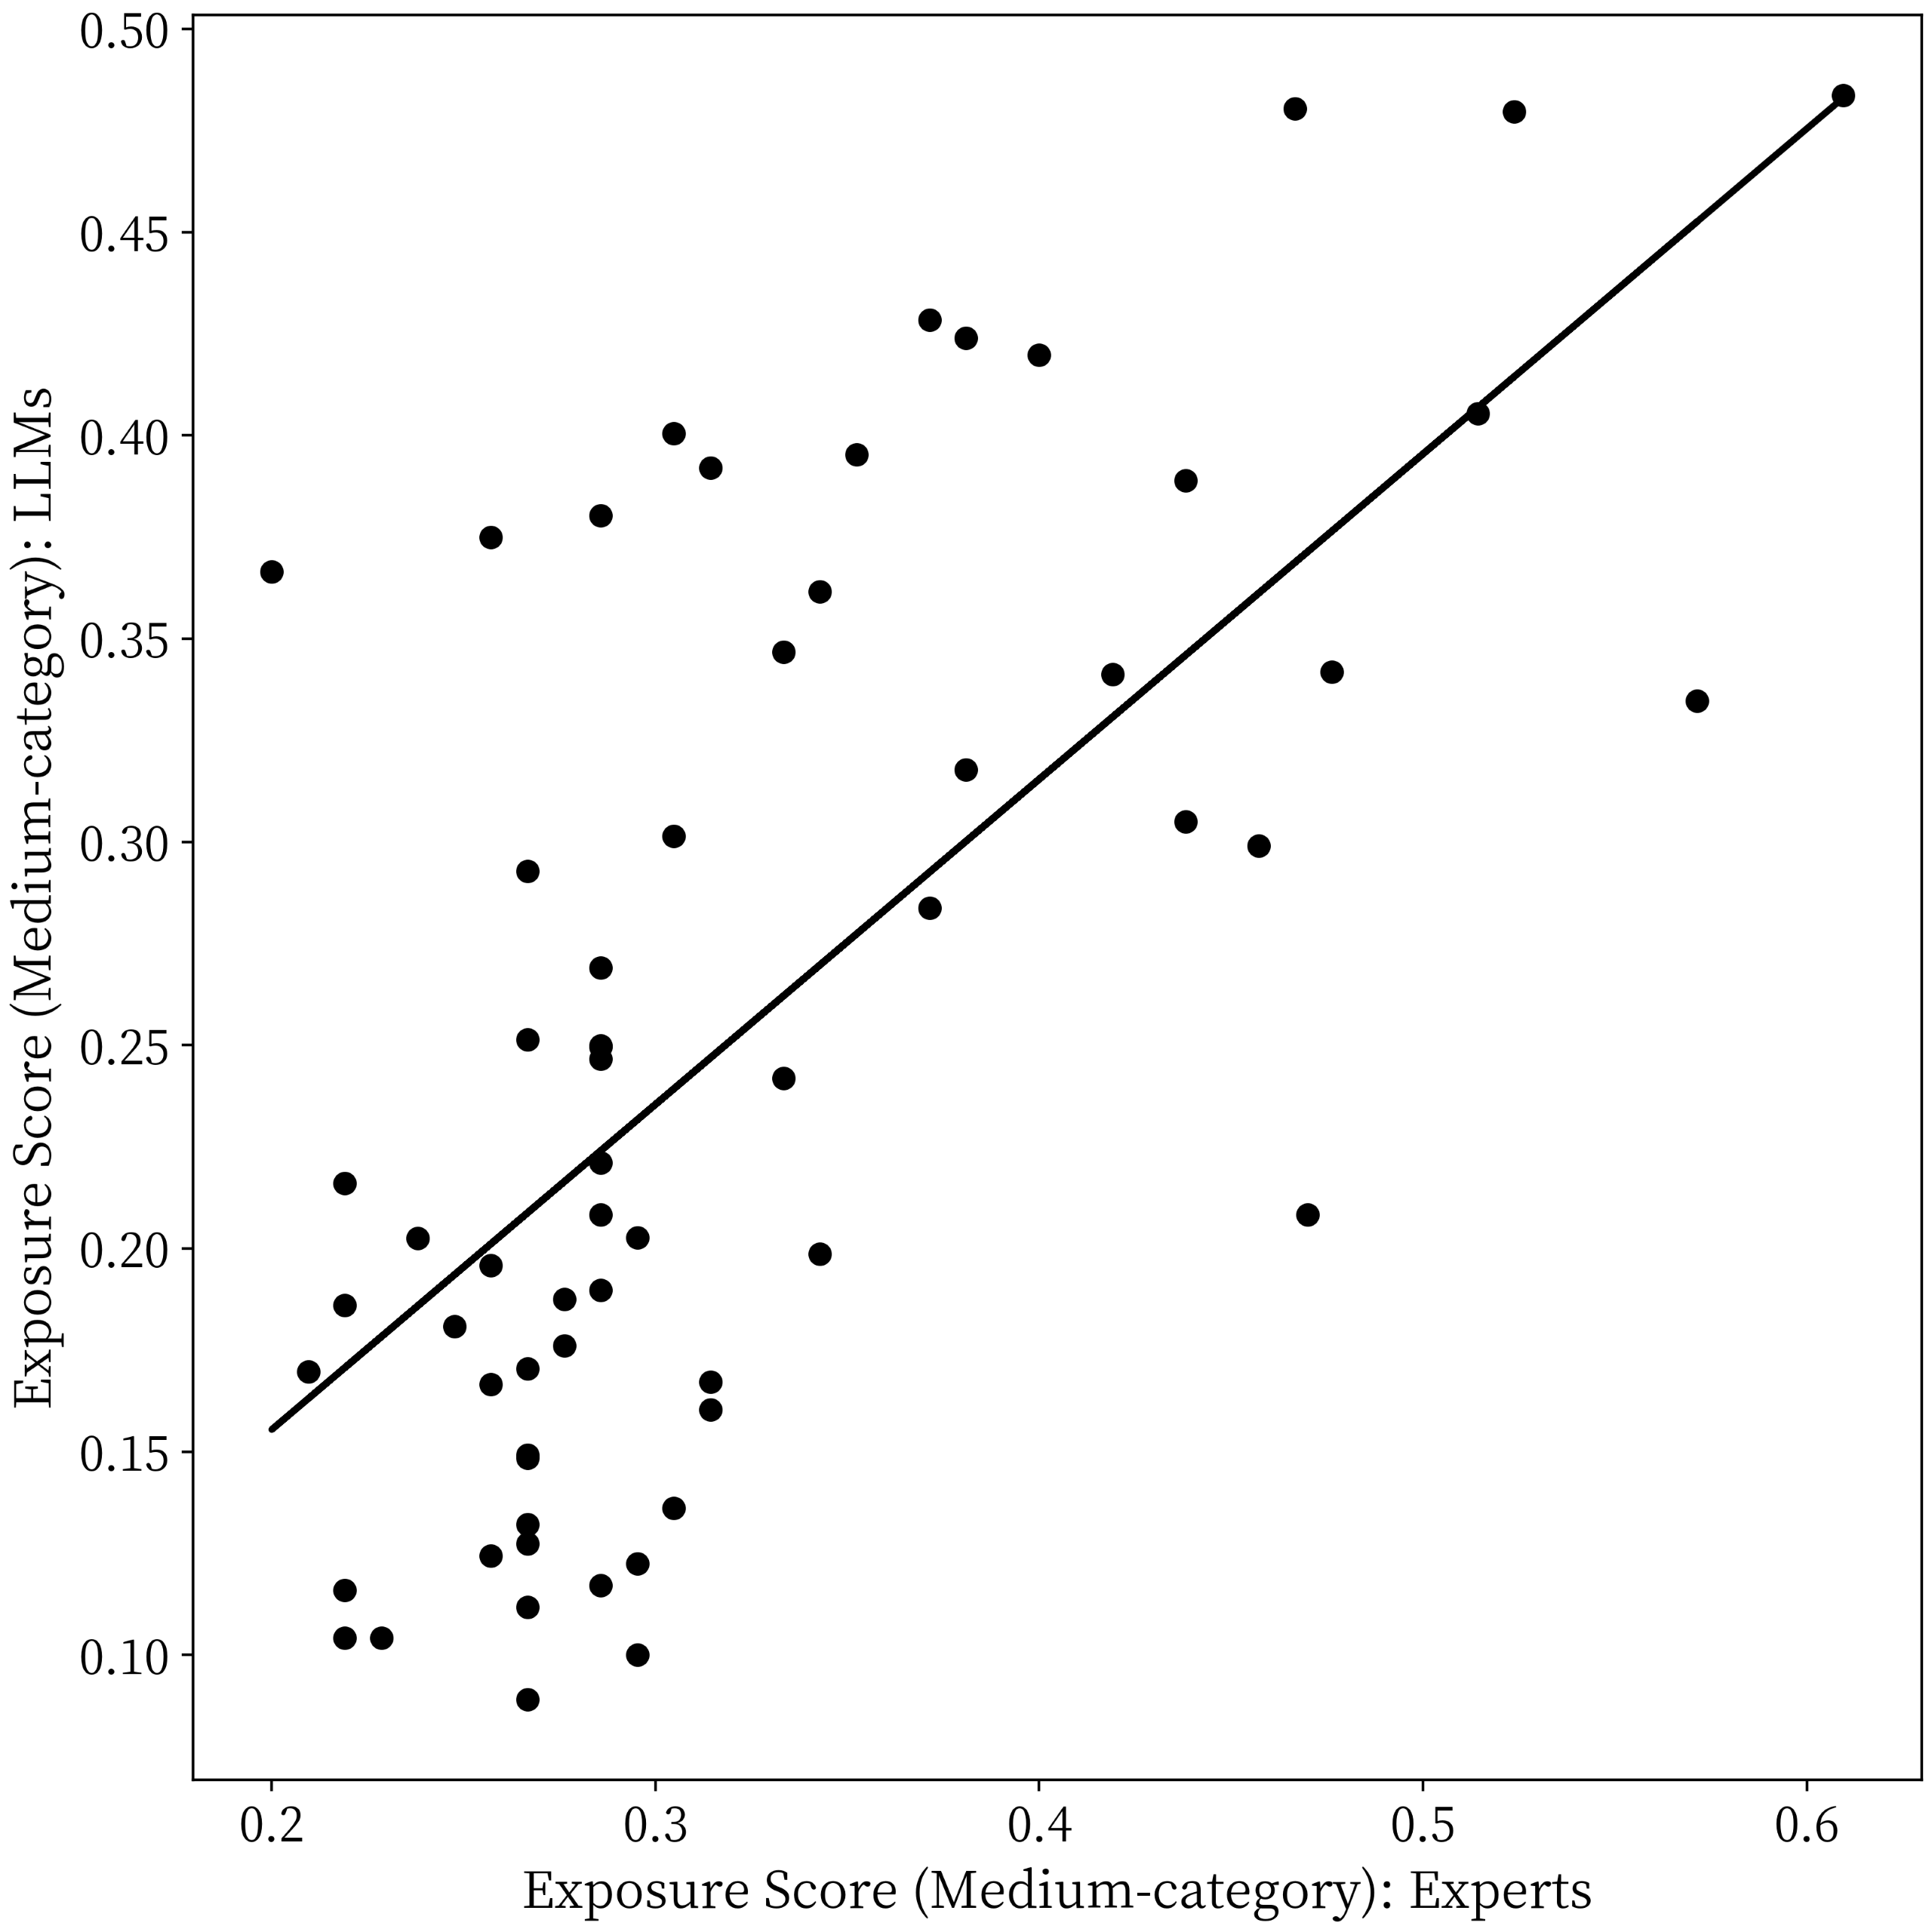
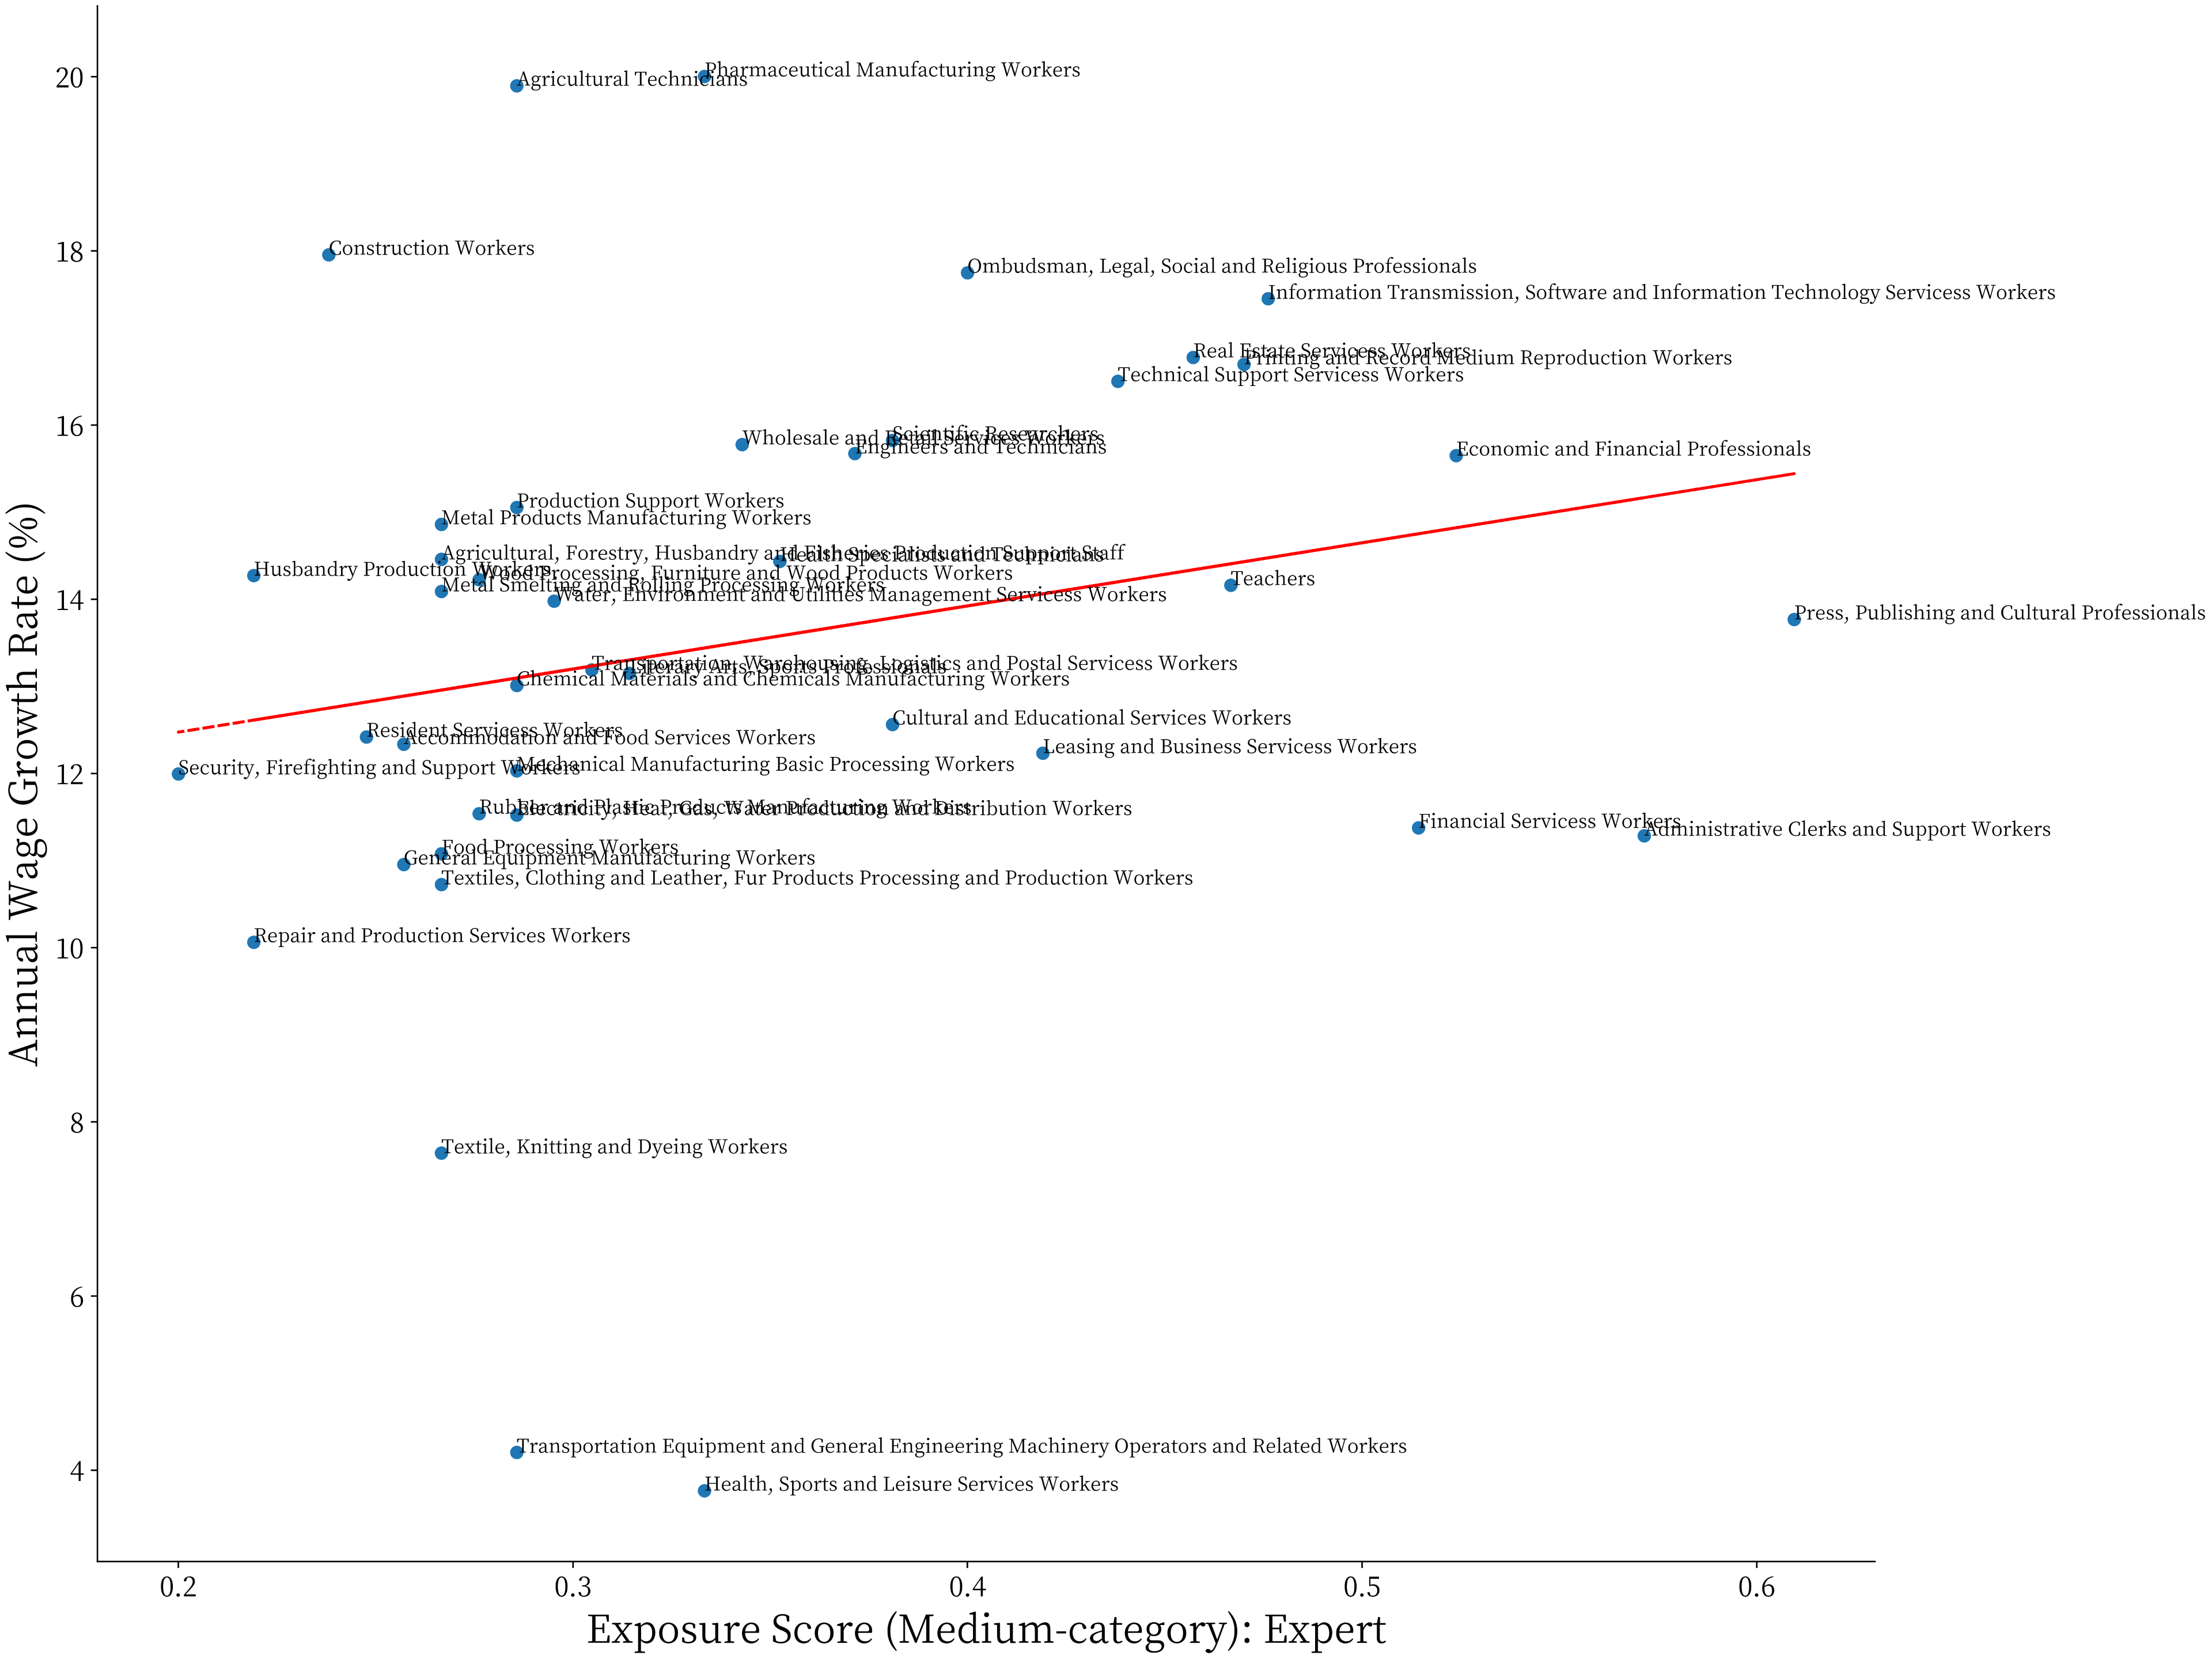
Upon comparing the model scores with the results of human expert scoring in Figure 1, we observed substantial positive correlations between the model scores and human expert scores.
Occupational Exposure
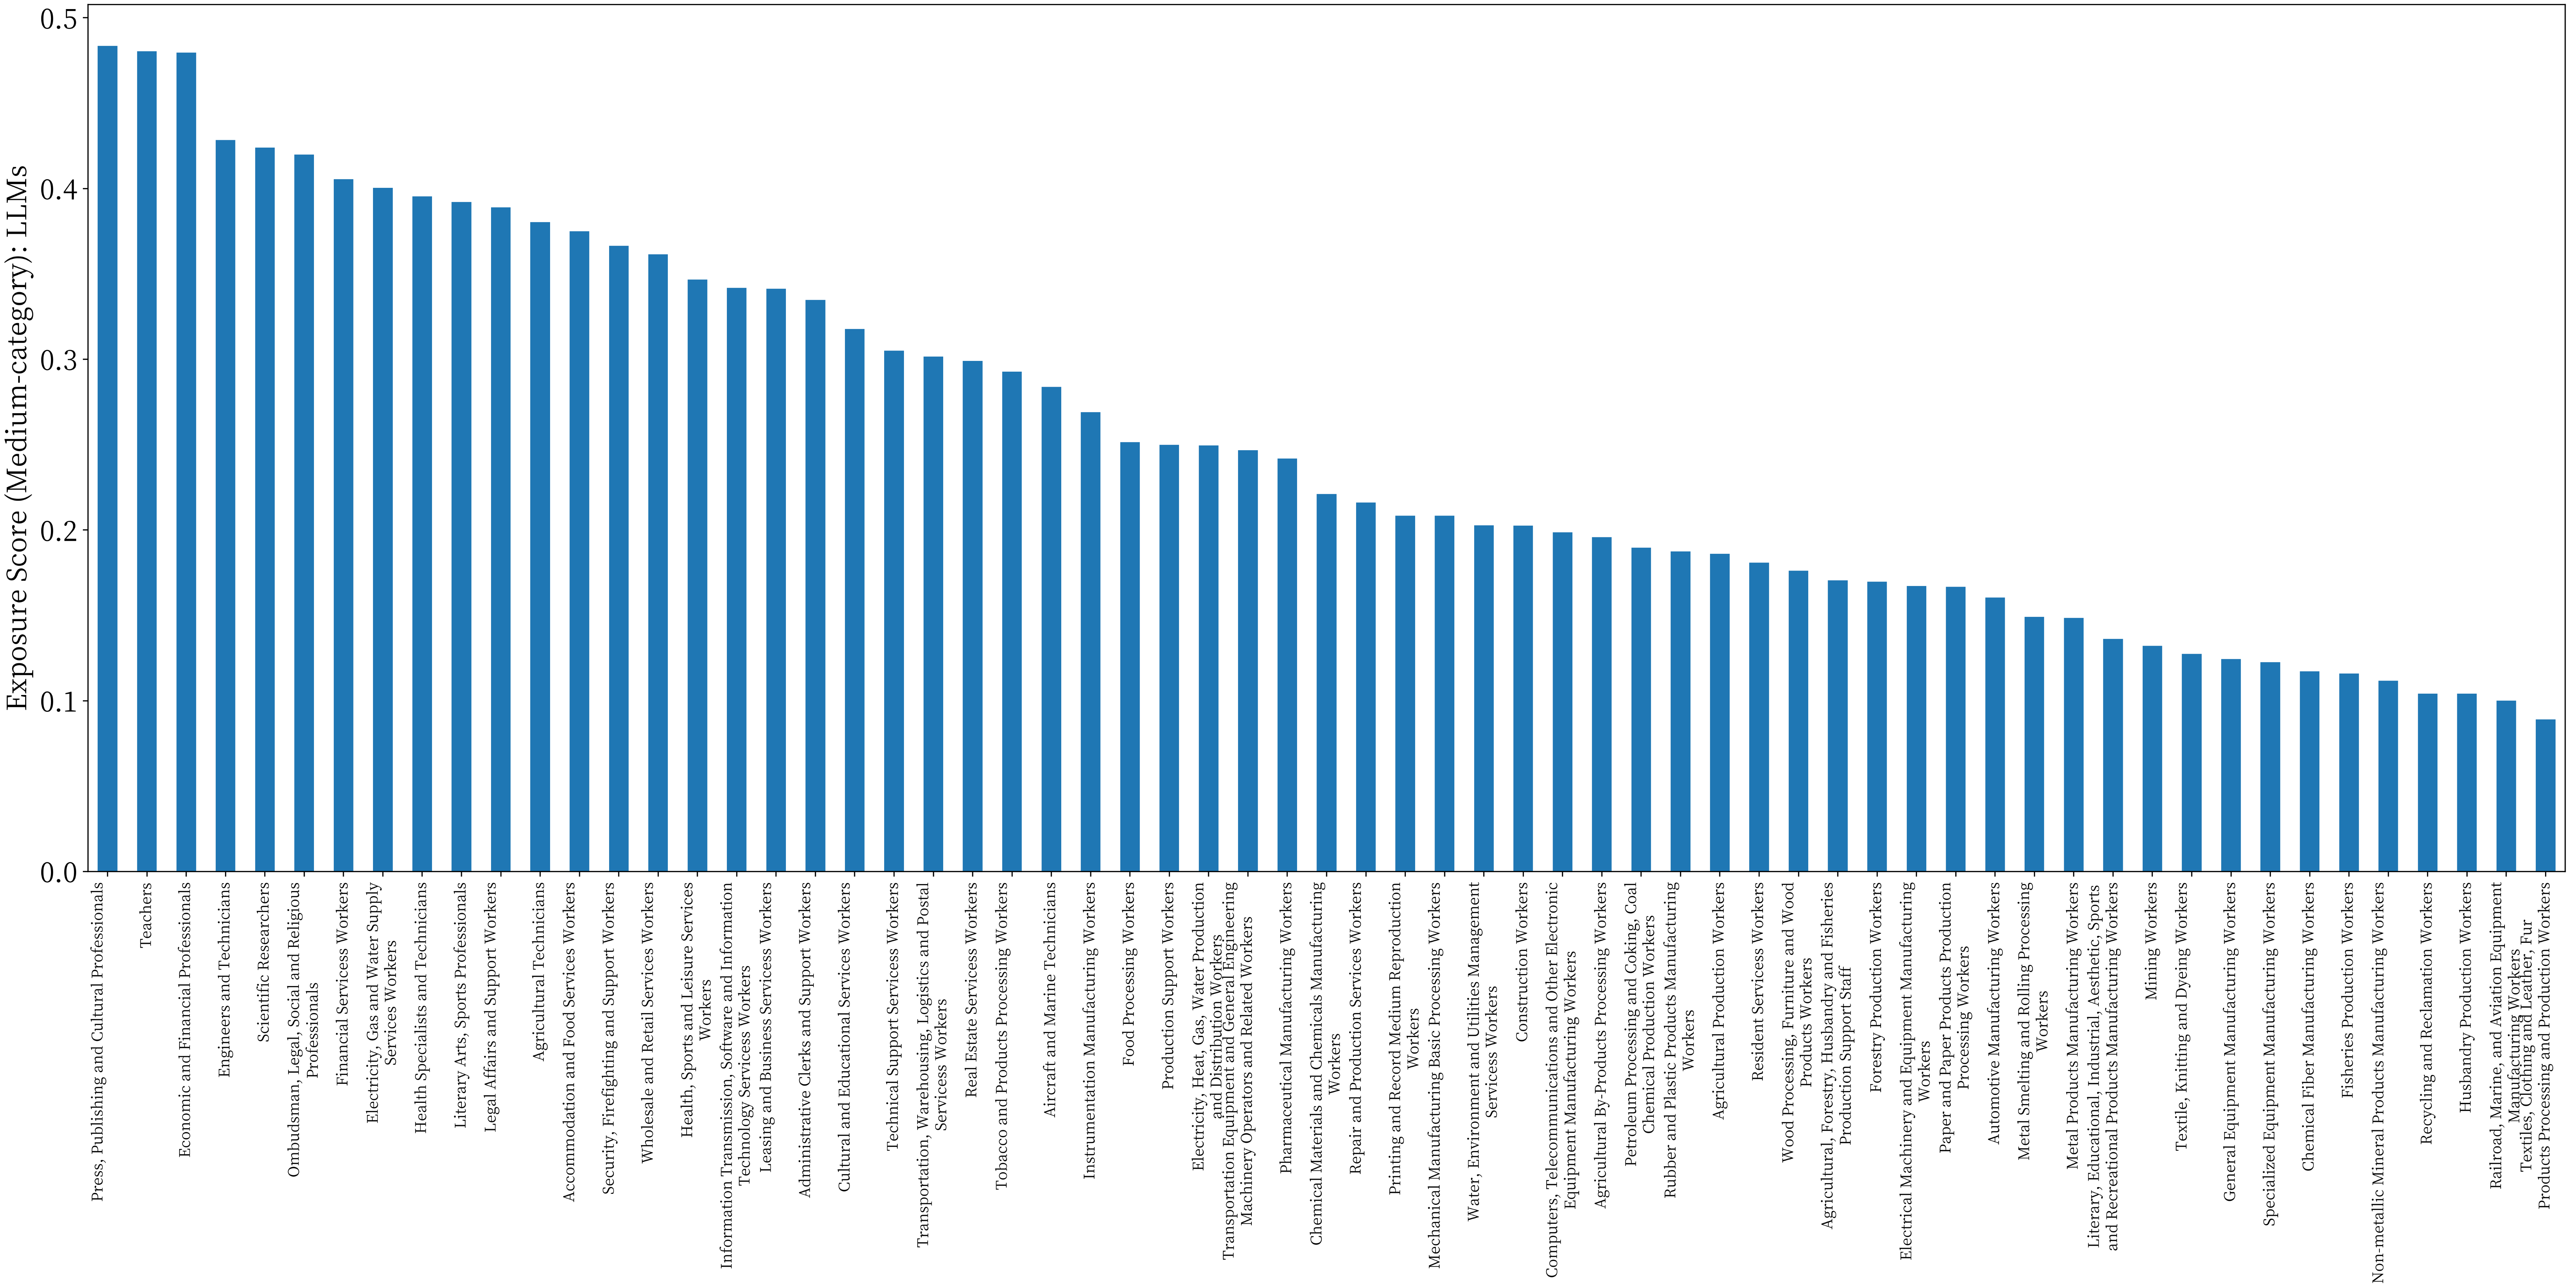
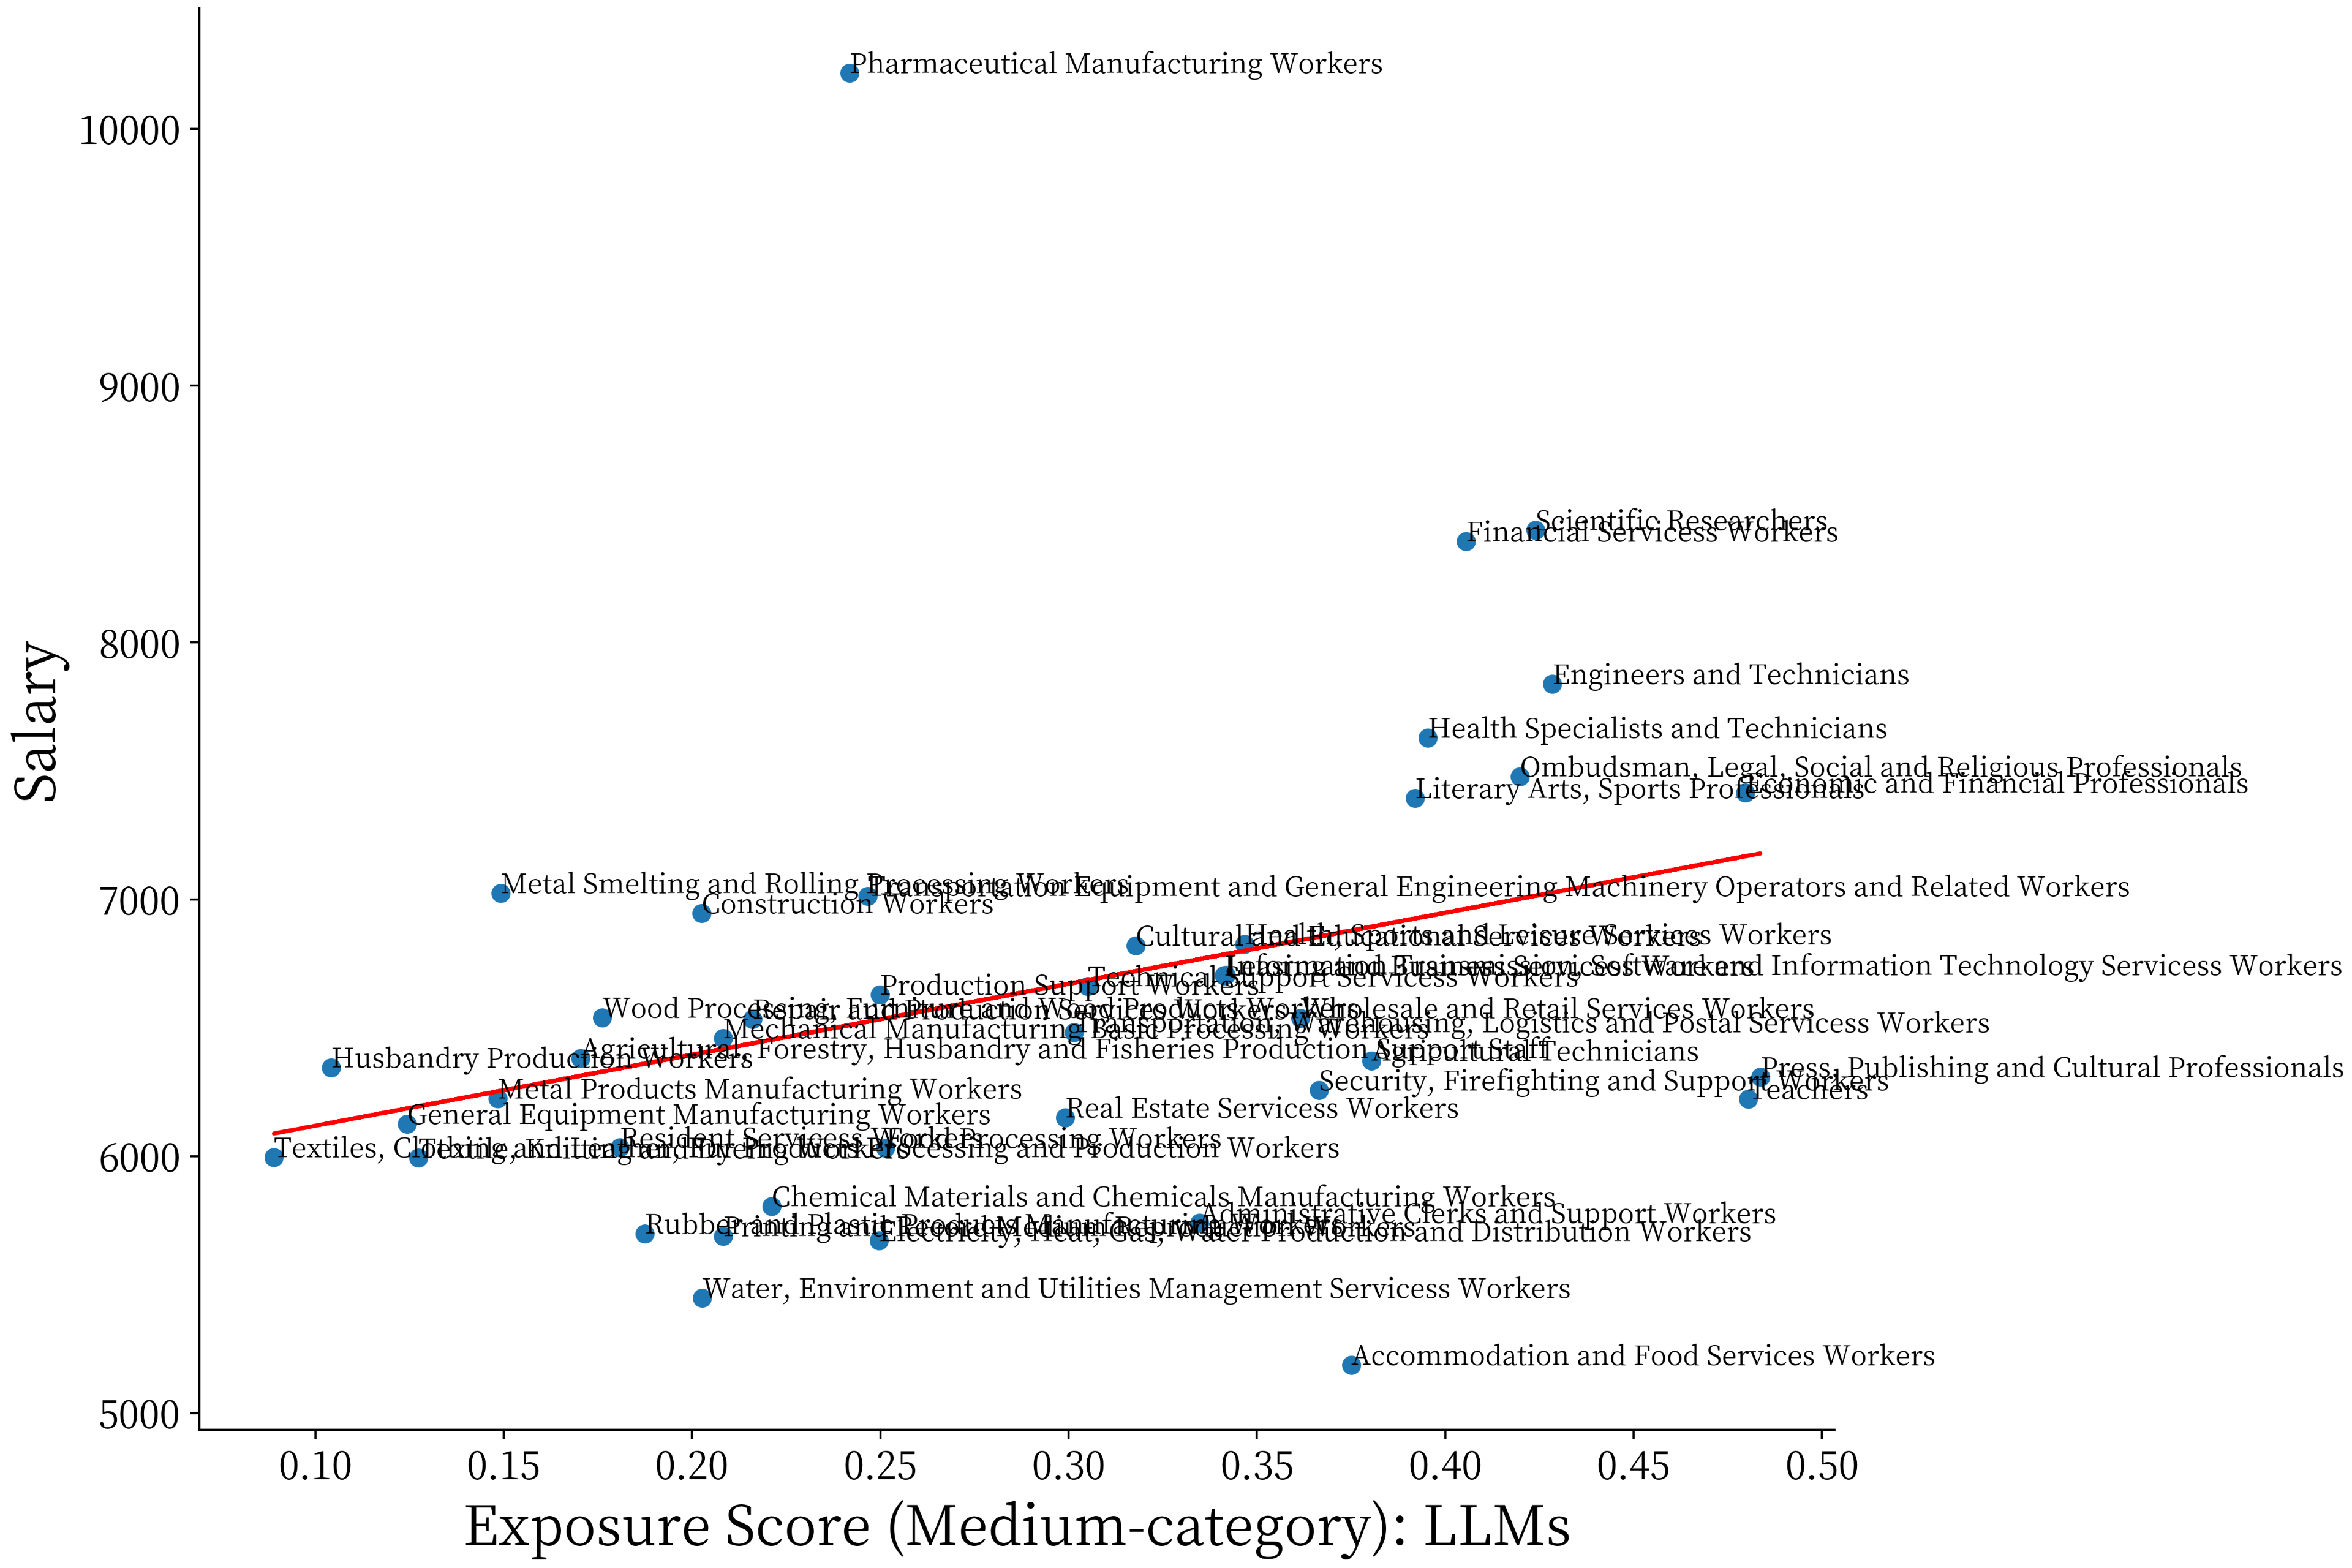
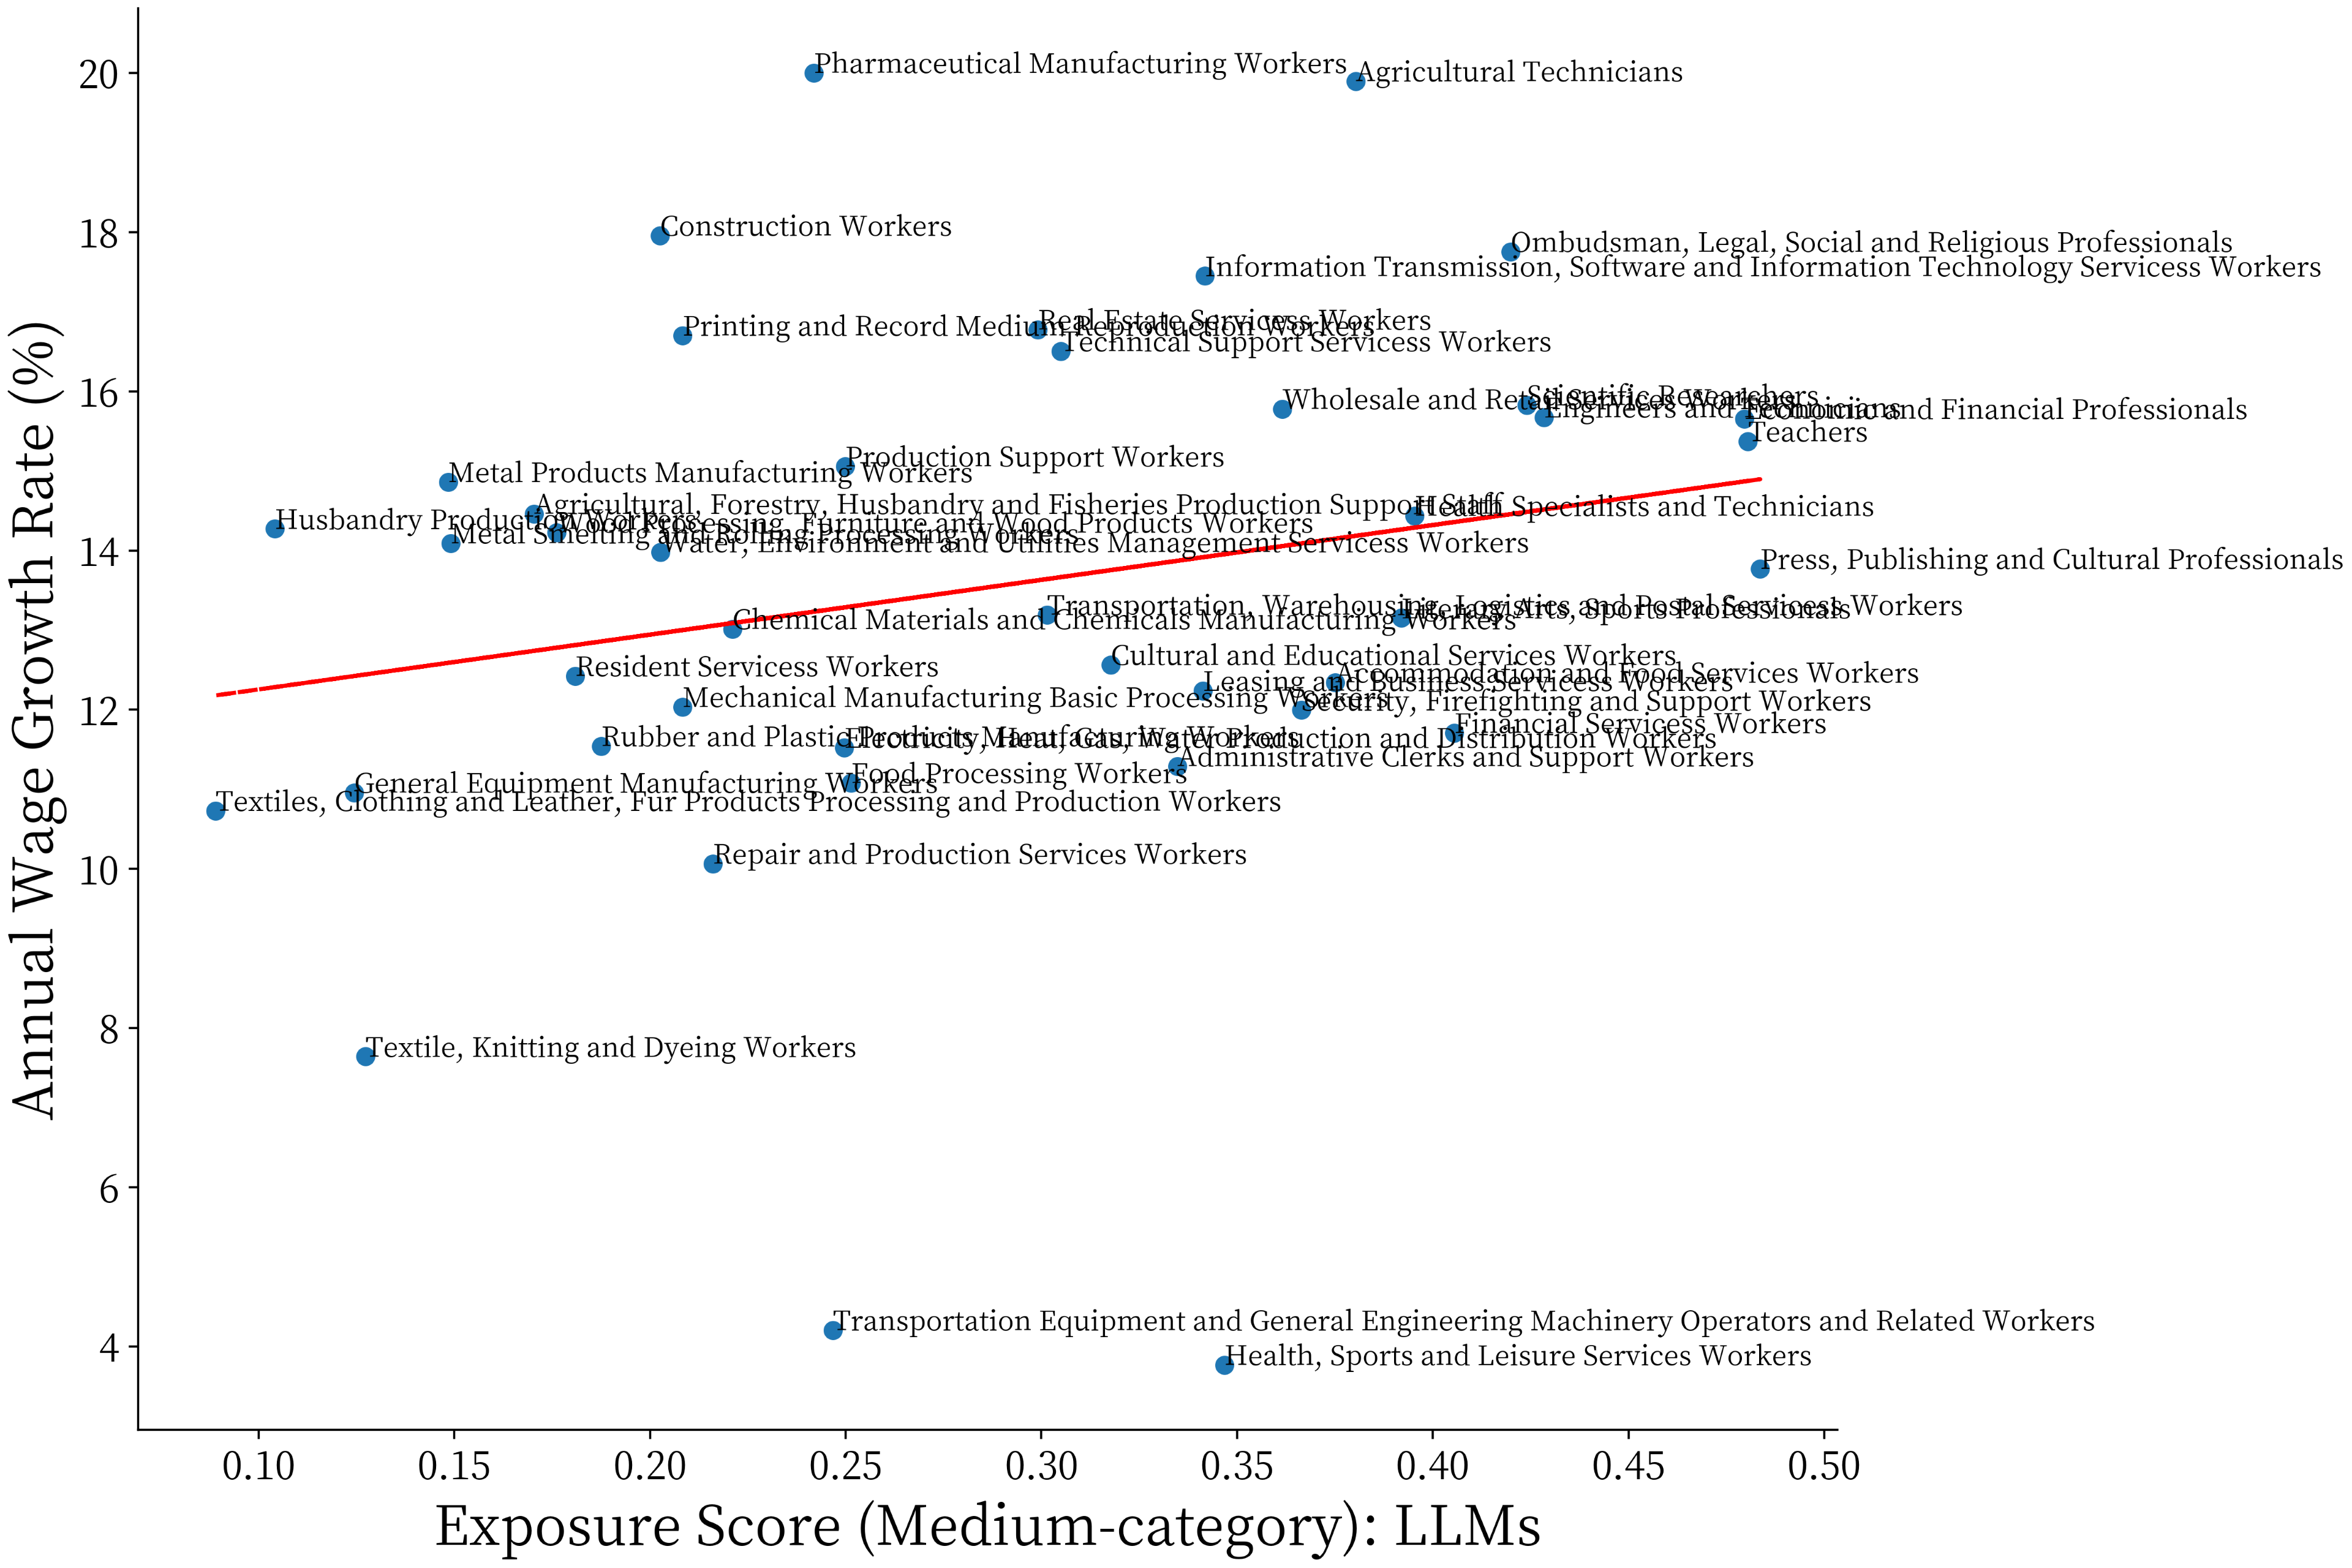
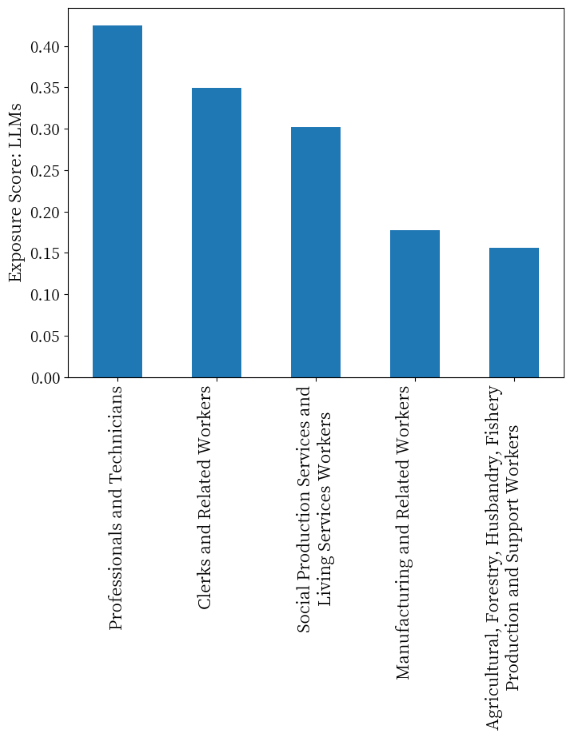
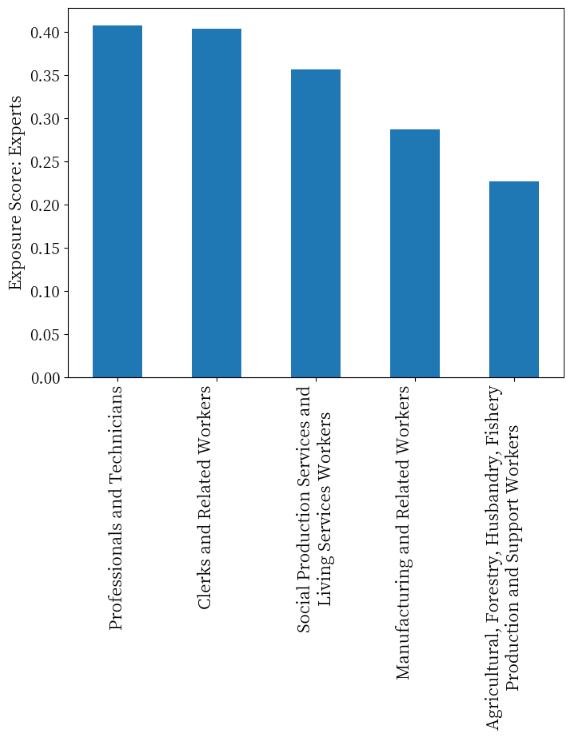
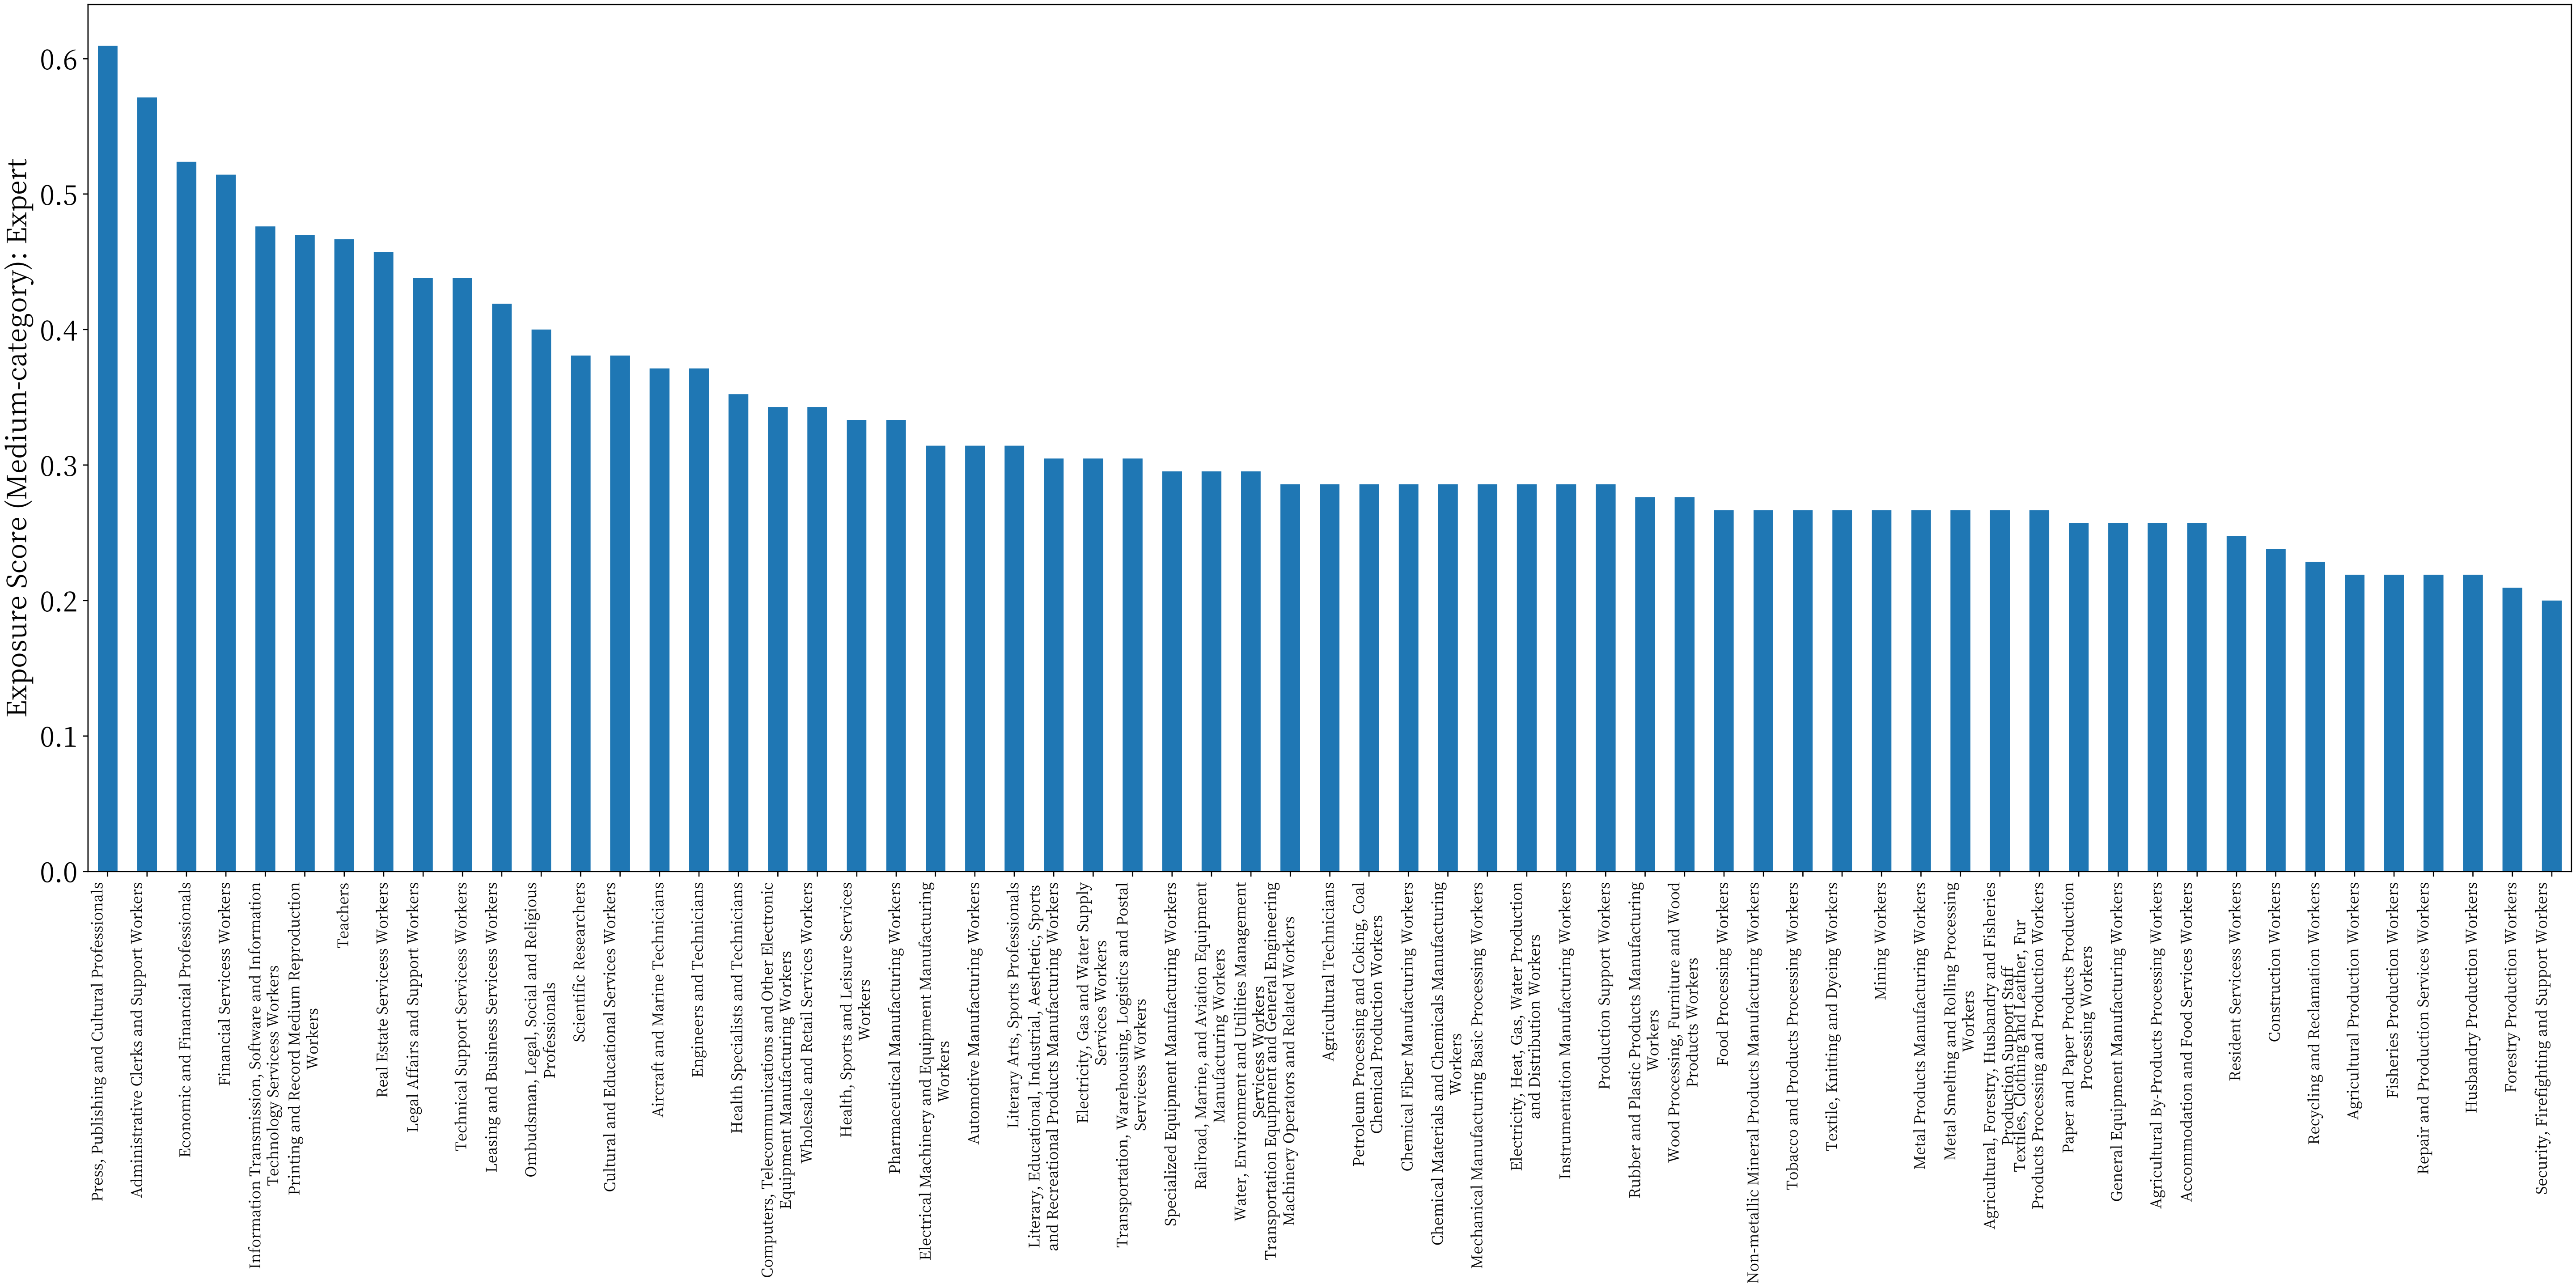
Figure 2 provides an overview of the medium-category occupation exposure scores by LLMs. It’s worth noting that within the highest exposure occupations, such as ”Teachers”, ”Economic and financial professionals”, and ”Press, publishing and cultural professionals”, a strong resonance emerges with recent technological advancements in LLMs, particularly in their capacity to handle a broad spectrum of intricate language-based tasks and even generate functional code based on high-level descriptions of a programming task. Moving to a broader perspective, the large-category occupation exposure scores by LLMs and expert are represented in Appendix B.
The results of our LLMs exposure scores indicate significantly different mechanisms and corresponding impacts on labor market, when compared with previous waves of computer-based automation. Prior research on computer-based automation posited that routine work was most susceptible to replacement by computers (Autor, Katz, and Kearney 2006; Acemoglu and Autor 2011). This ”routinization” hypothesis assumed that ”computers and computer-controlled equipment are highly productive and reliable at performing the tasks that programmers can script - and relatively inept at everything else”. The displacement of routine jobs by computers led to a heightened demand for skilled workers in ”abstract” jobs, resulting in wage inequality and job polarization. However, Figure 3 suggests that the labor market repercussions resulting from recent advances in LLMs may diverge. Specifically, this wave of technological change distinguishes itself from earlier waves by potentially substituting numerous tasks within non-routine cognitive analytical jobs that were previously considered immune to automation. In essence, this development suggests a shift in the labor market landscape, where the winners and losers associated with general-purpose technology evolve.
Beyond the distinct impacts on routine and non-routine occupations, LLMs also reshape the experience premium profile. LLMs have the capacity to learn tasks equiring tacit knowledge, knowledge that was once attainable only through experiential learning or learning by doing. As depicted in Figure 4, LLMs could potentially alter the experience premium and the profile of returns from learning. Our analysis aligns with the insights gleaned from an experimental study (Brynjolfsson, Li, and Raymond 2023).
Industrial and Demographic Exposure
As highlighted in the preceding Data section, we leveraged the 2016 CLDS dataset, which encompasses comprehensive industry and occupational information for each individual in employment. Utilizing this dataset, we derived the occupational distribution within each industry. This distribution, when coupled with the exposure scores attributed to the corresponding occupations, enabled the computation of a weighted occupational intensity index for each industry.
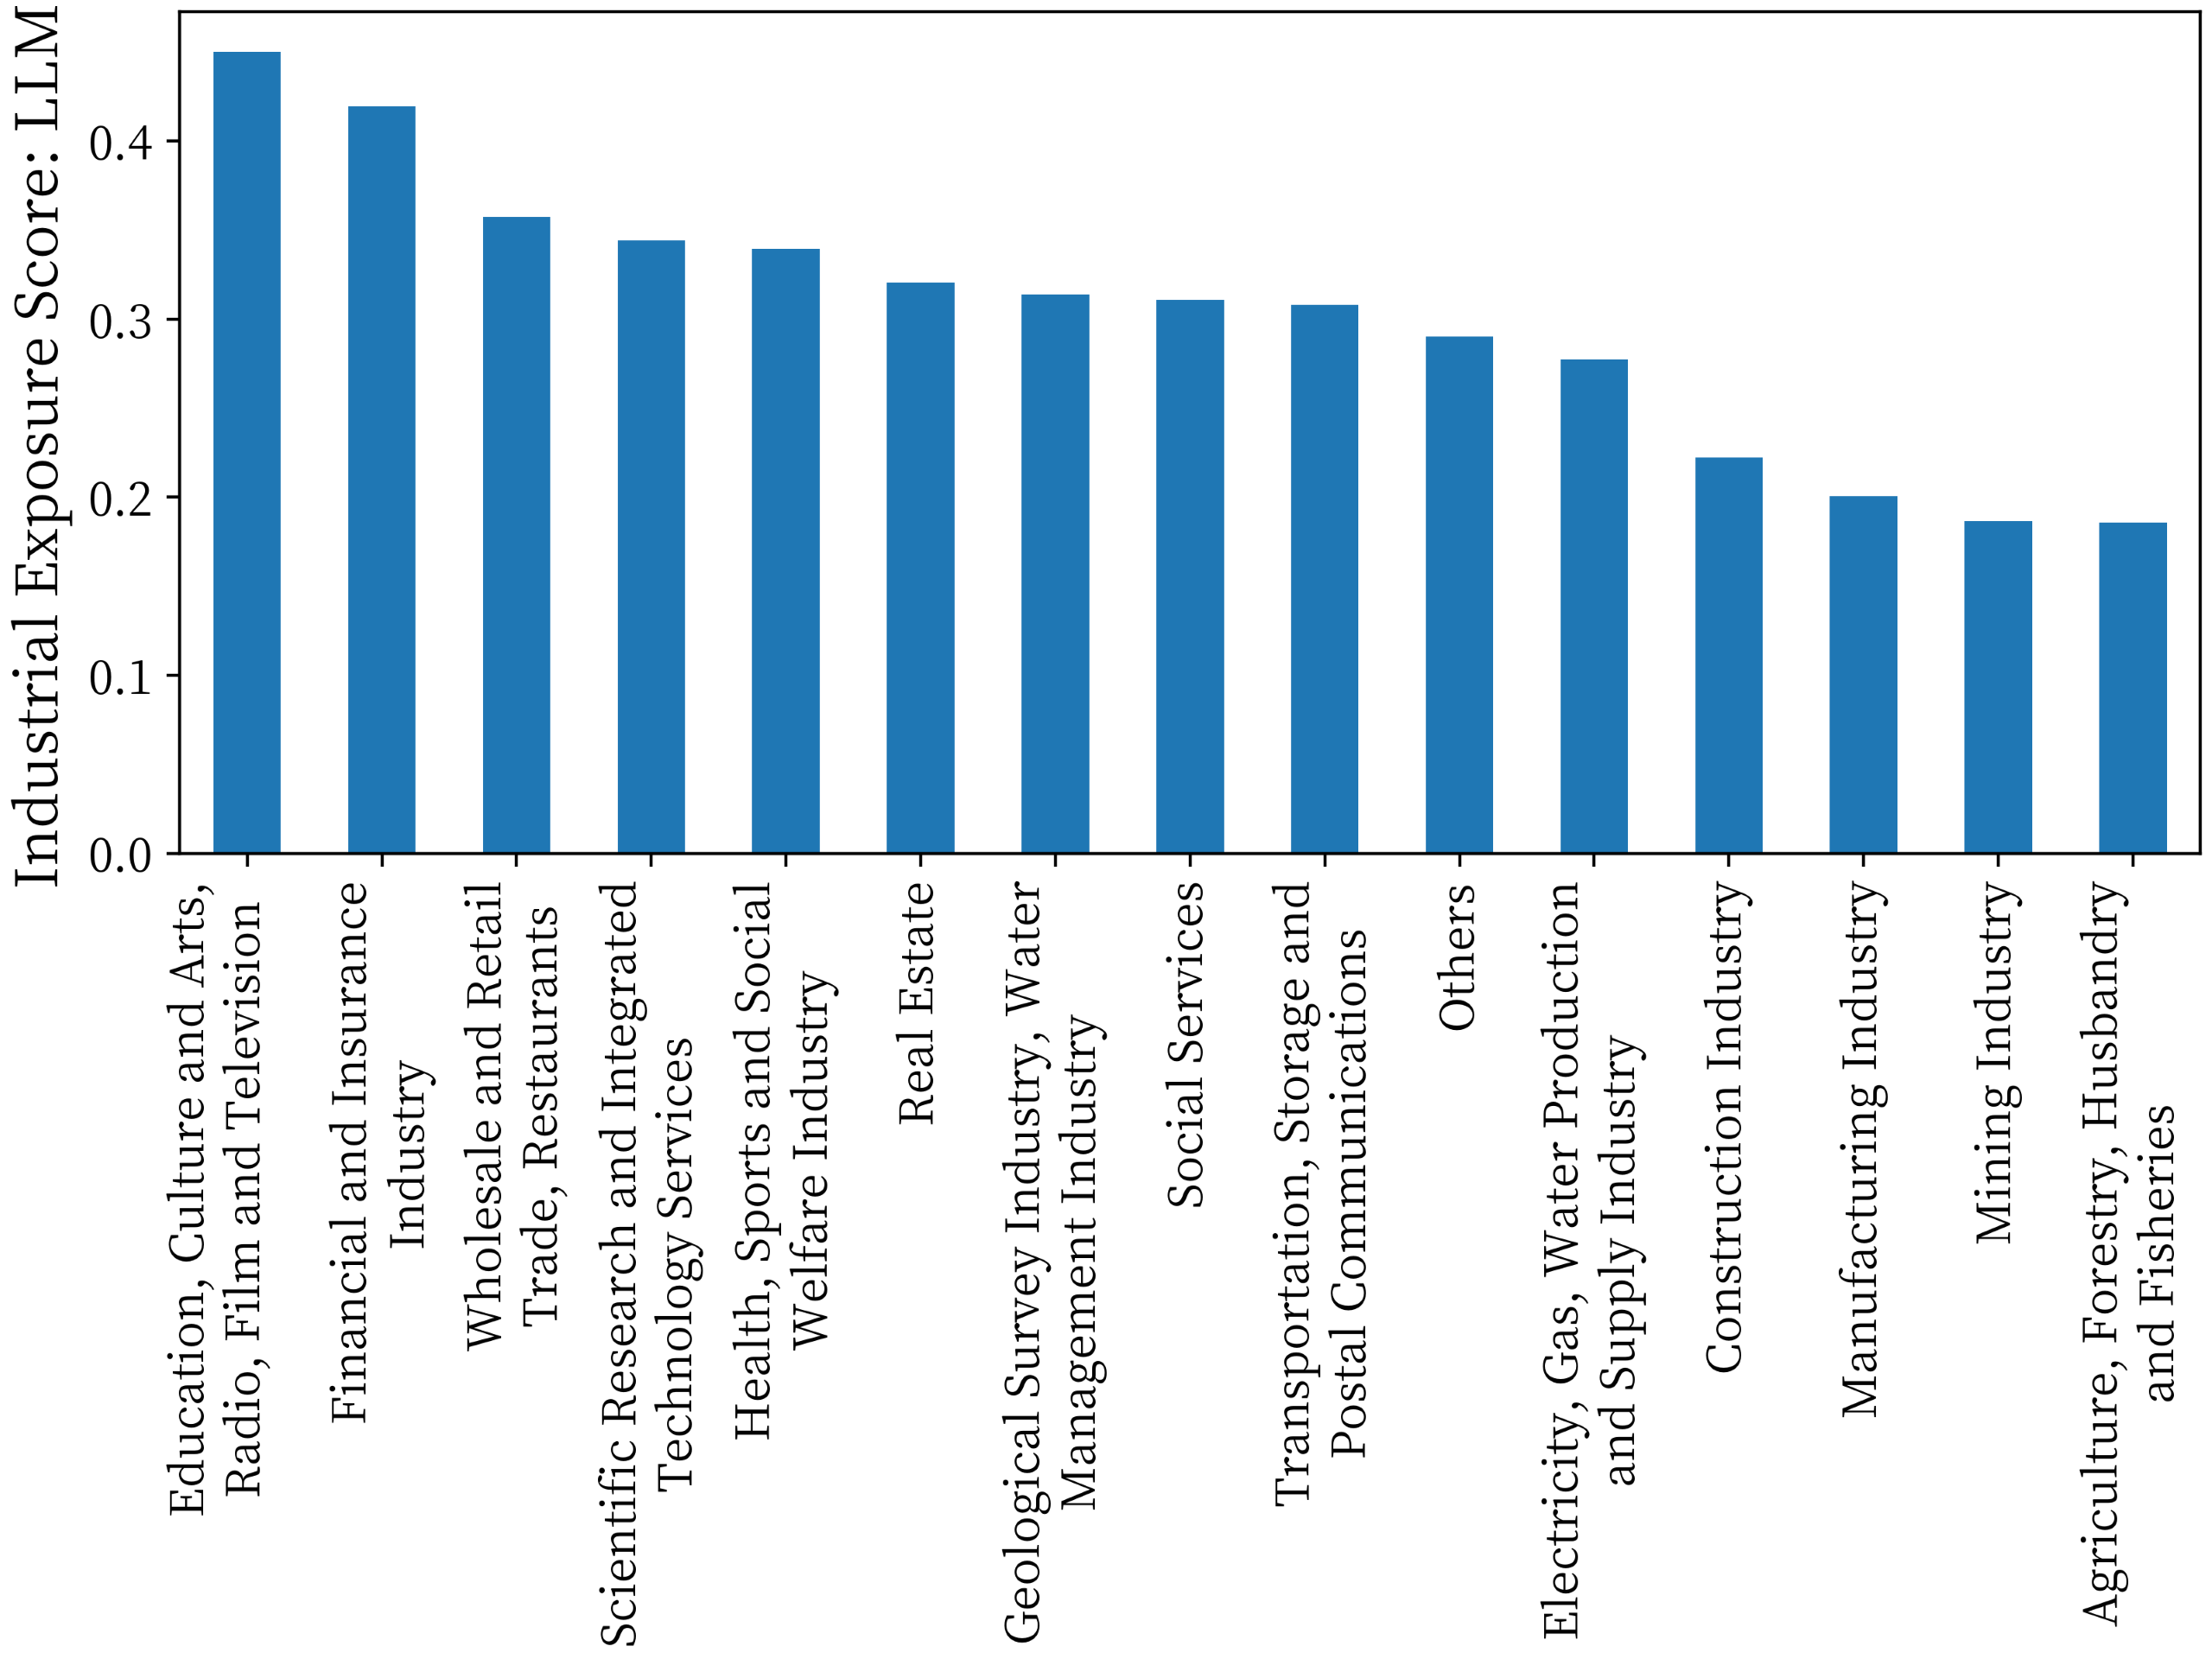
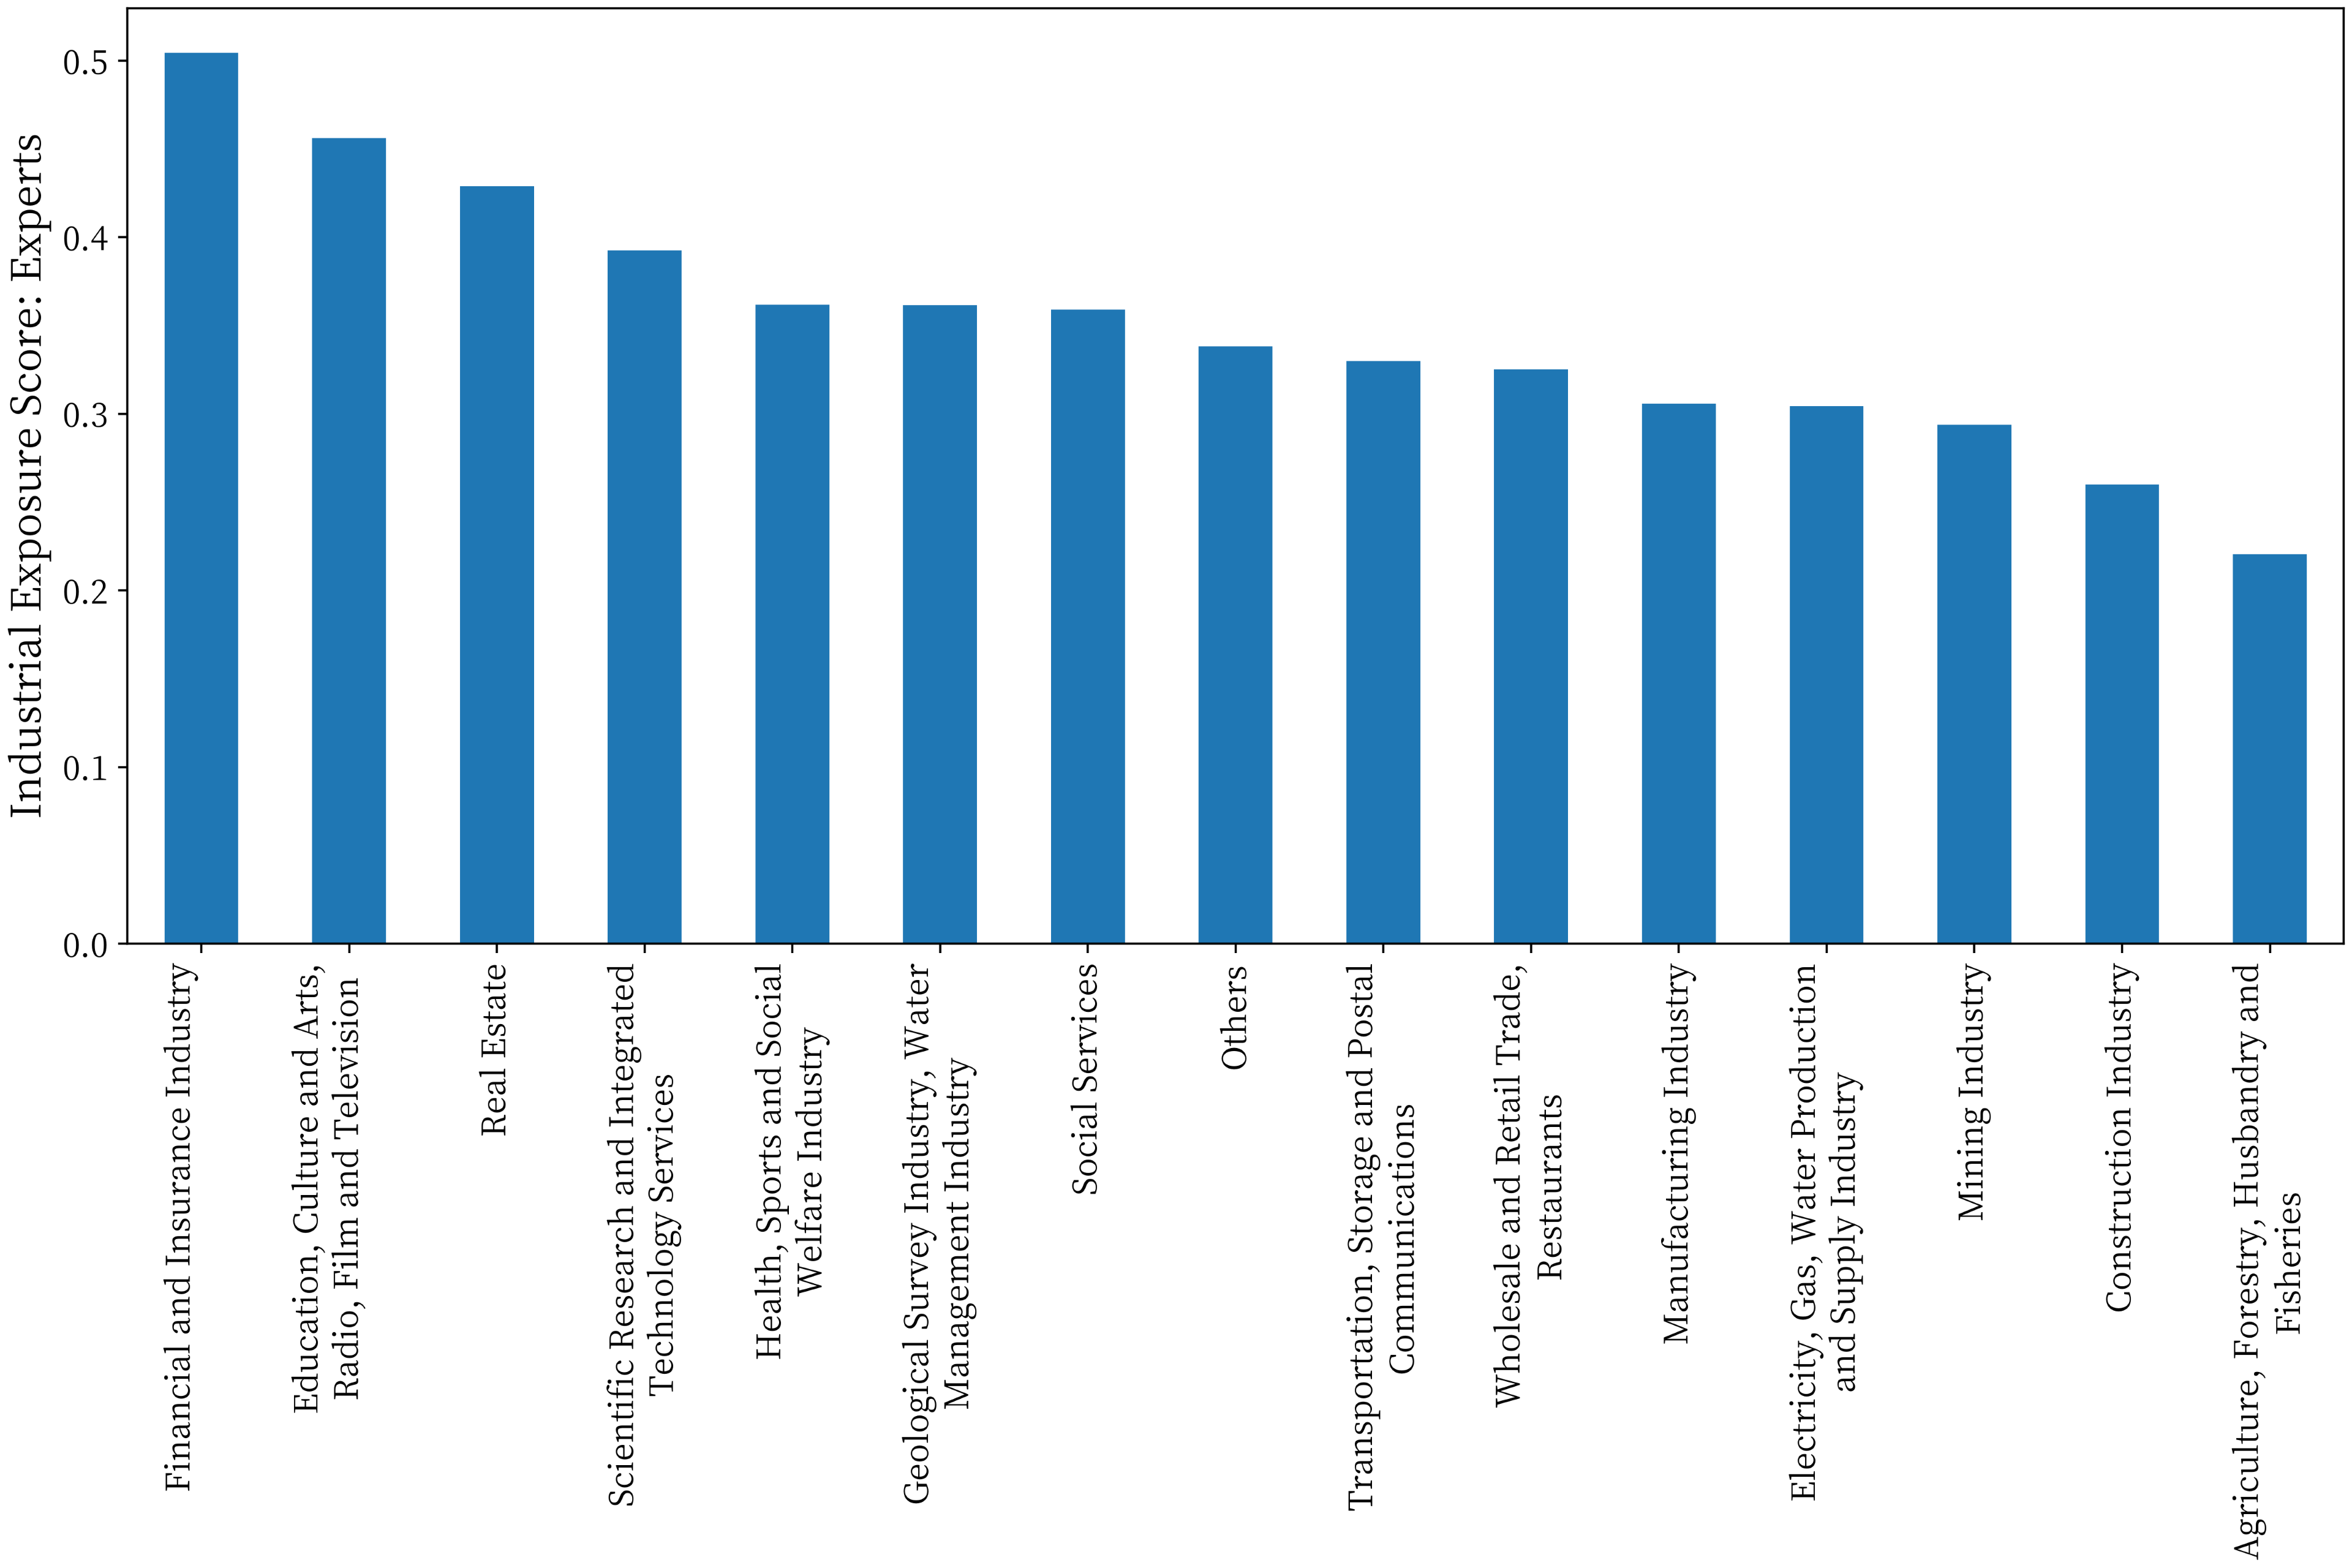
Figure 5 provides insights into substantial variations in the exposure levels of LLMs across distinct industries. Notably, sectors with the highest scores, including education, culture and arts, radio, film and television, exhibit heightened susceptibility. This observation underscores the pronounced influence of the current technological landscape on these domains. Conversely, industries with lower scores, such as agriculture, forestry, husbandry, fisheries, mining, manufacturing and construction- persist in displaying a range of distinctive complexities. Despite the overarching advancements in artificial intelligence across diverse domains, these sectors present enduring challenges. Their intricate nuances, customized requirements, and the enduring necessity for human judgment contribute to their current resilience against full automation and replacement in the foreseeable future.
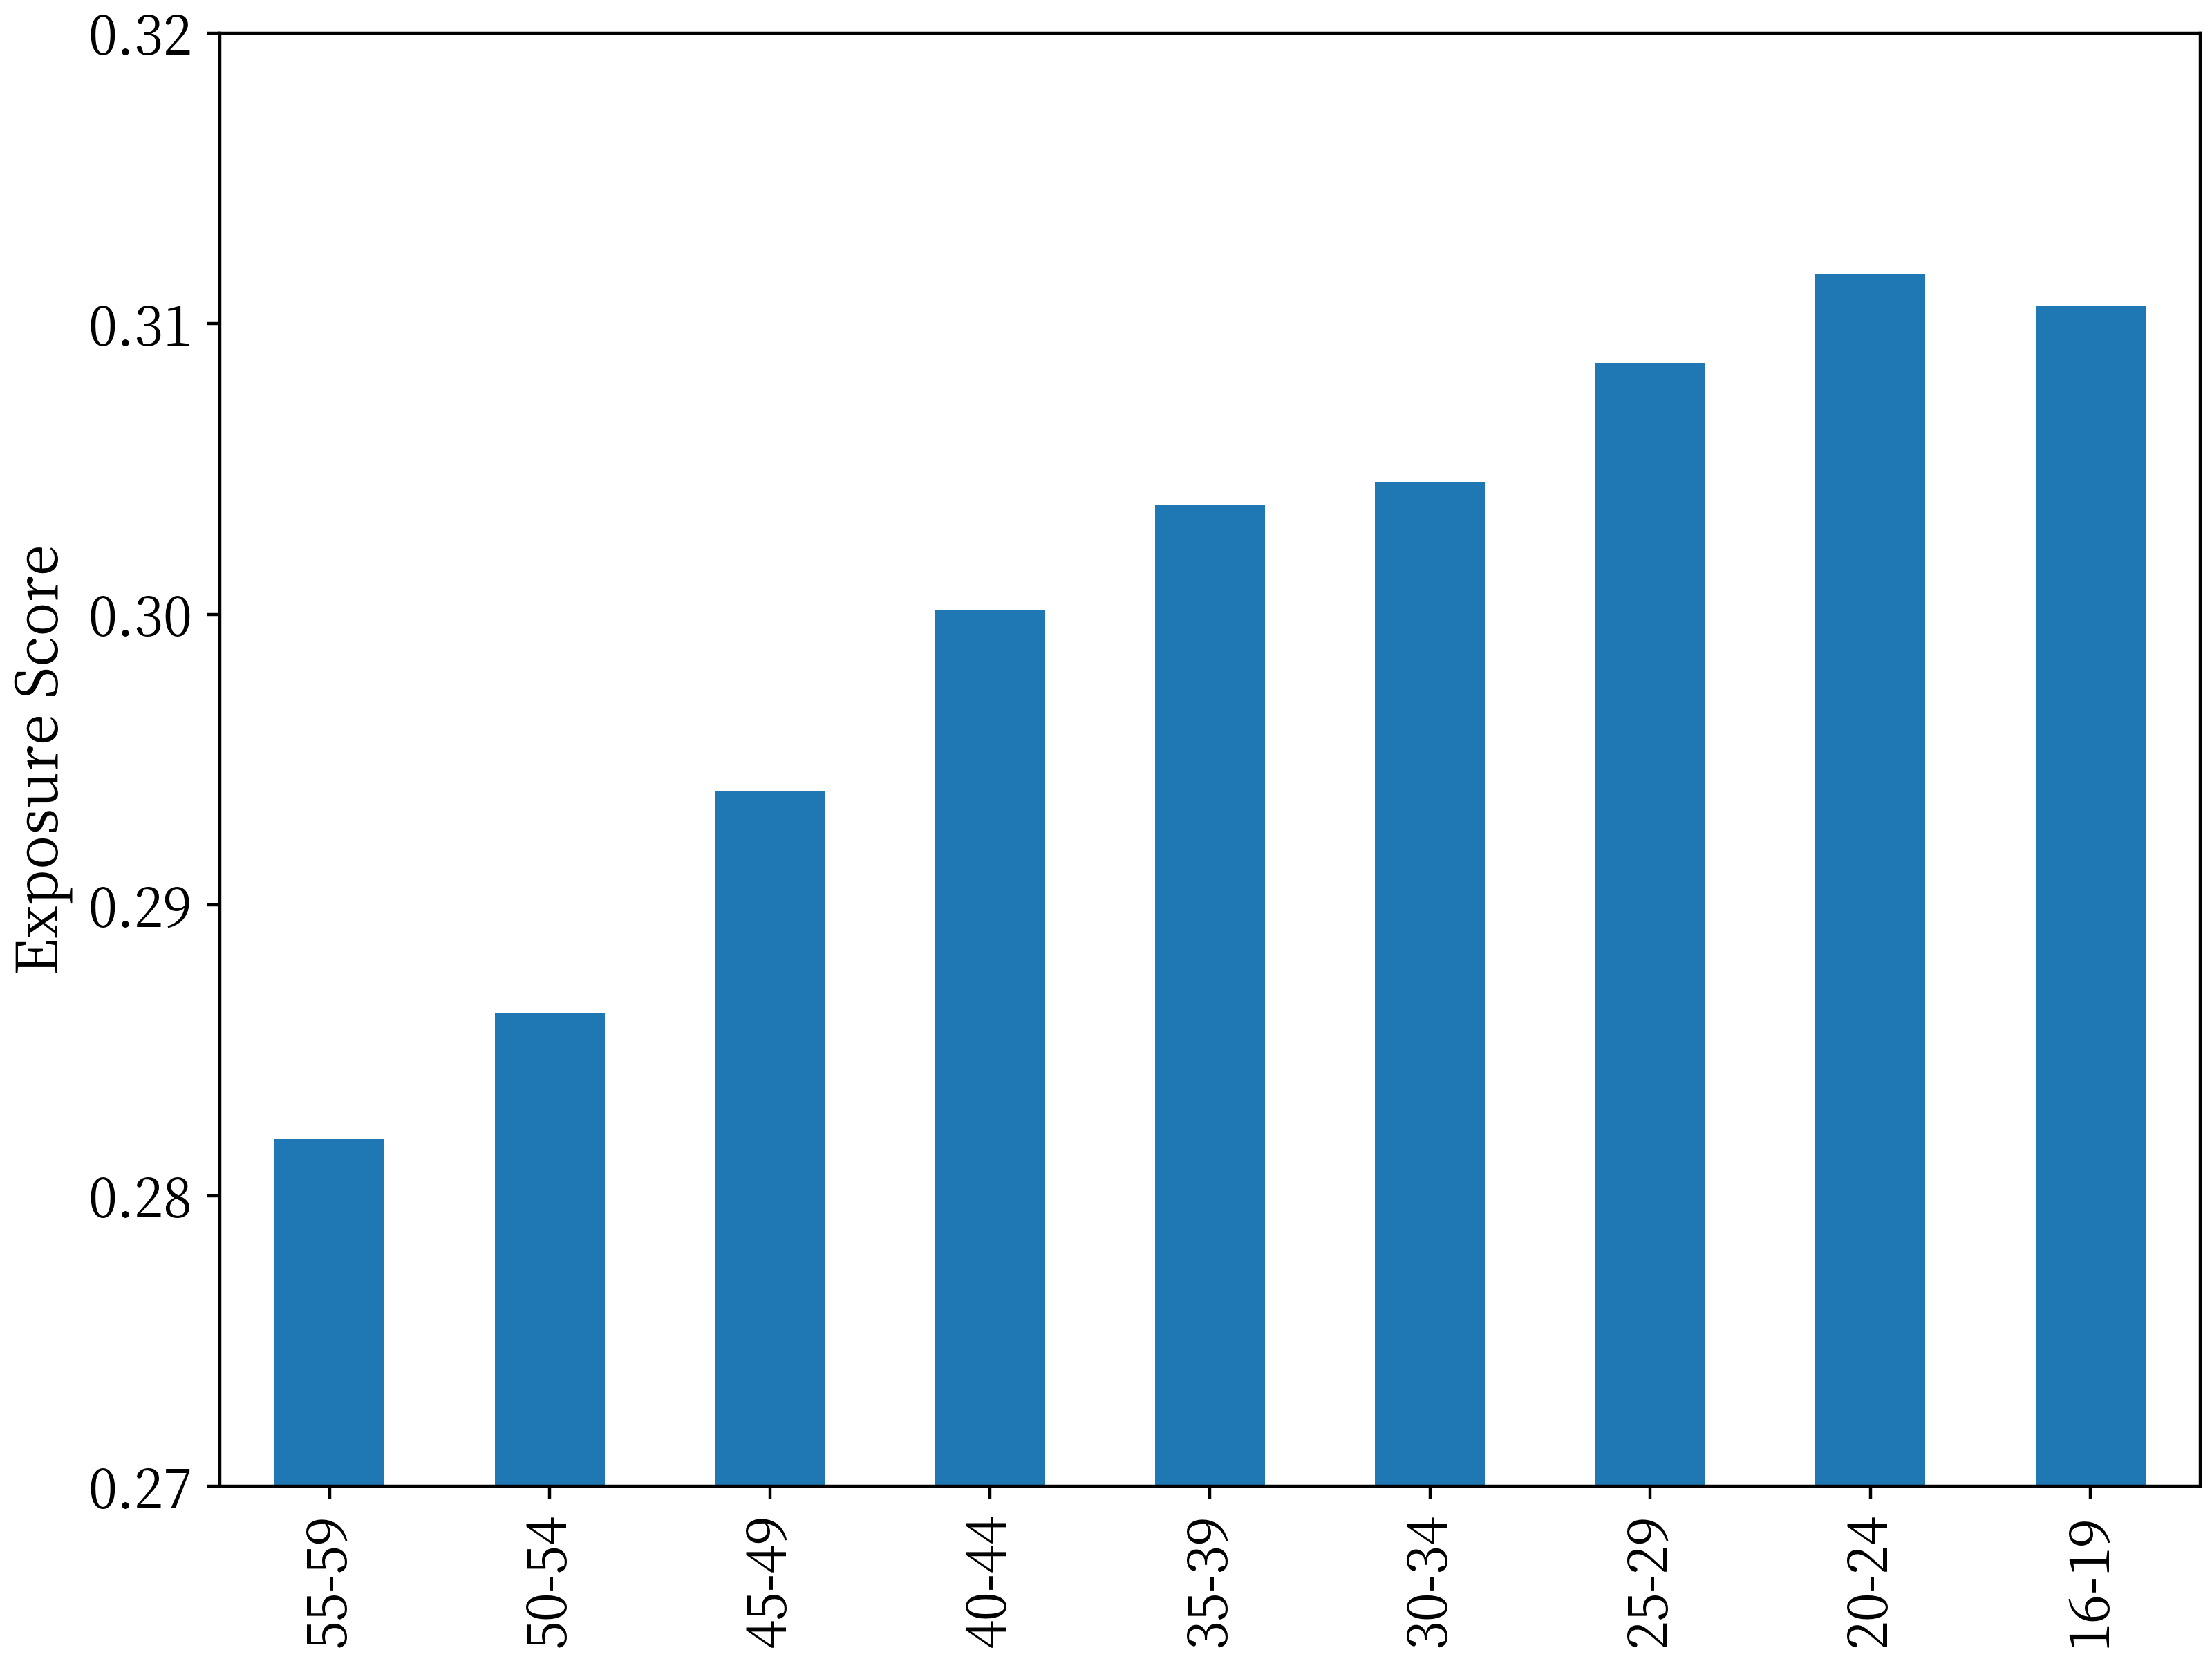
Armed with industrial exposure data, we proceed to compute demographic exposure by integrating it with the demographic distribution across industries. Relying on the tabulations of census data from 2020 in China, we observe a notable concentration of youth employment within the tertiary sector. To illustrate, during 2020, 42.5% of individuals aged 16-19 and 34.9% of those aged 20-24 were engaged in consumer service industries. Figure 6 showcases our demographic exposure scores, revealing that LLMs wield a more pronounced influence on the employment prospects of young individuals.
Vacancies
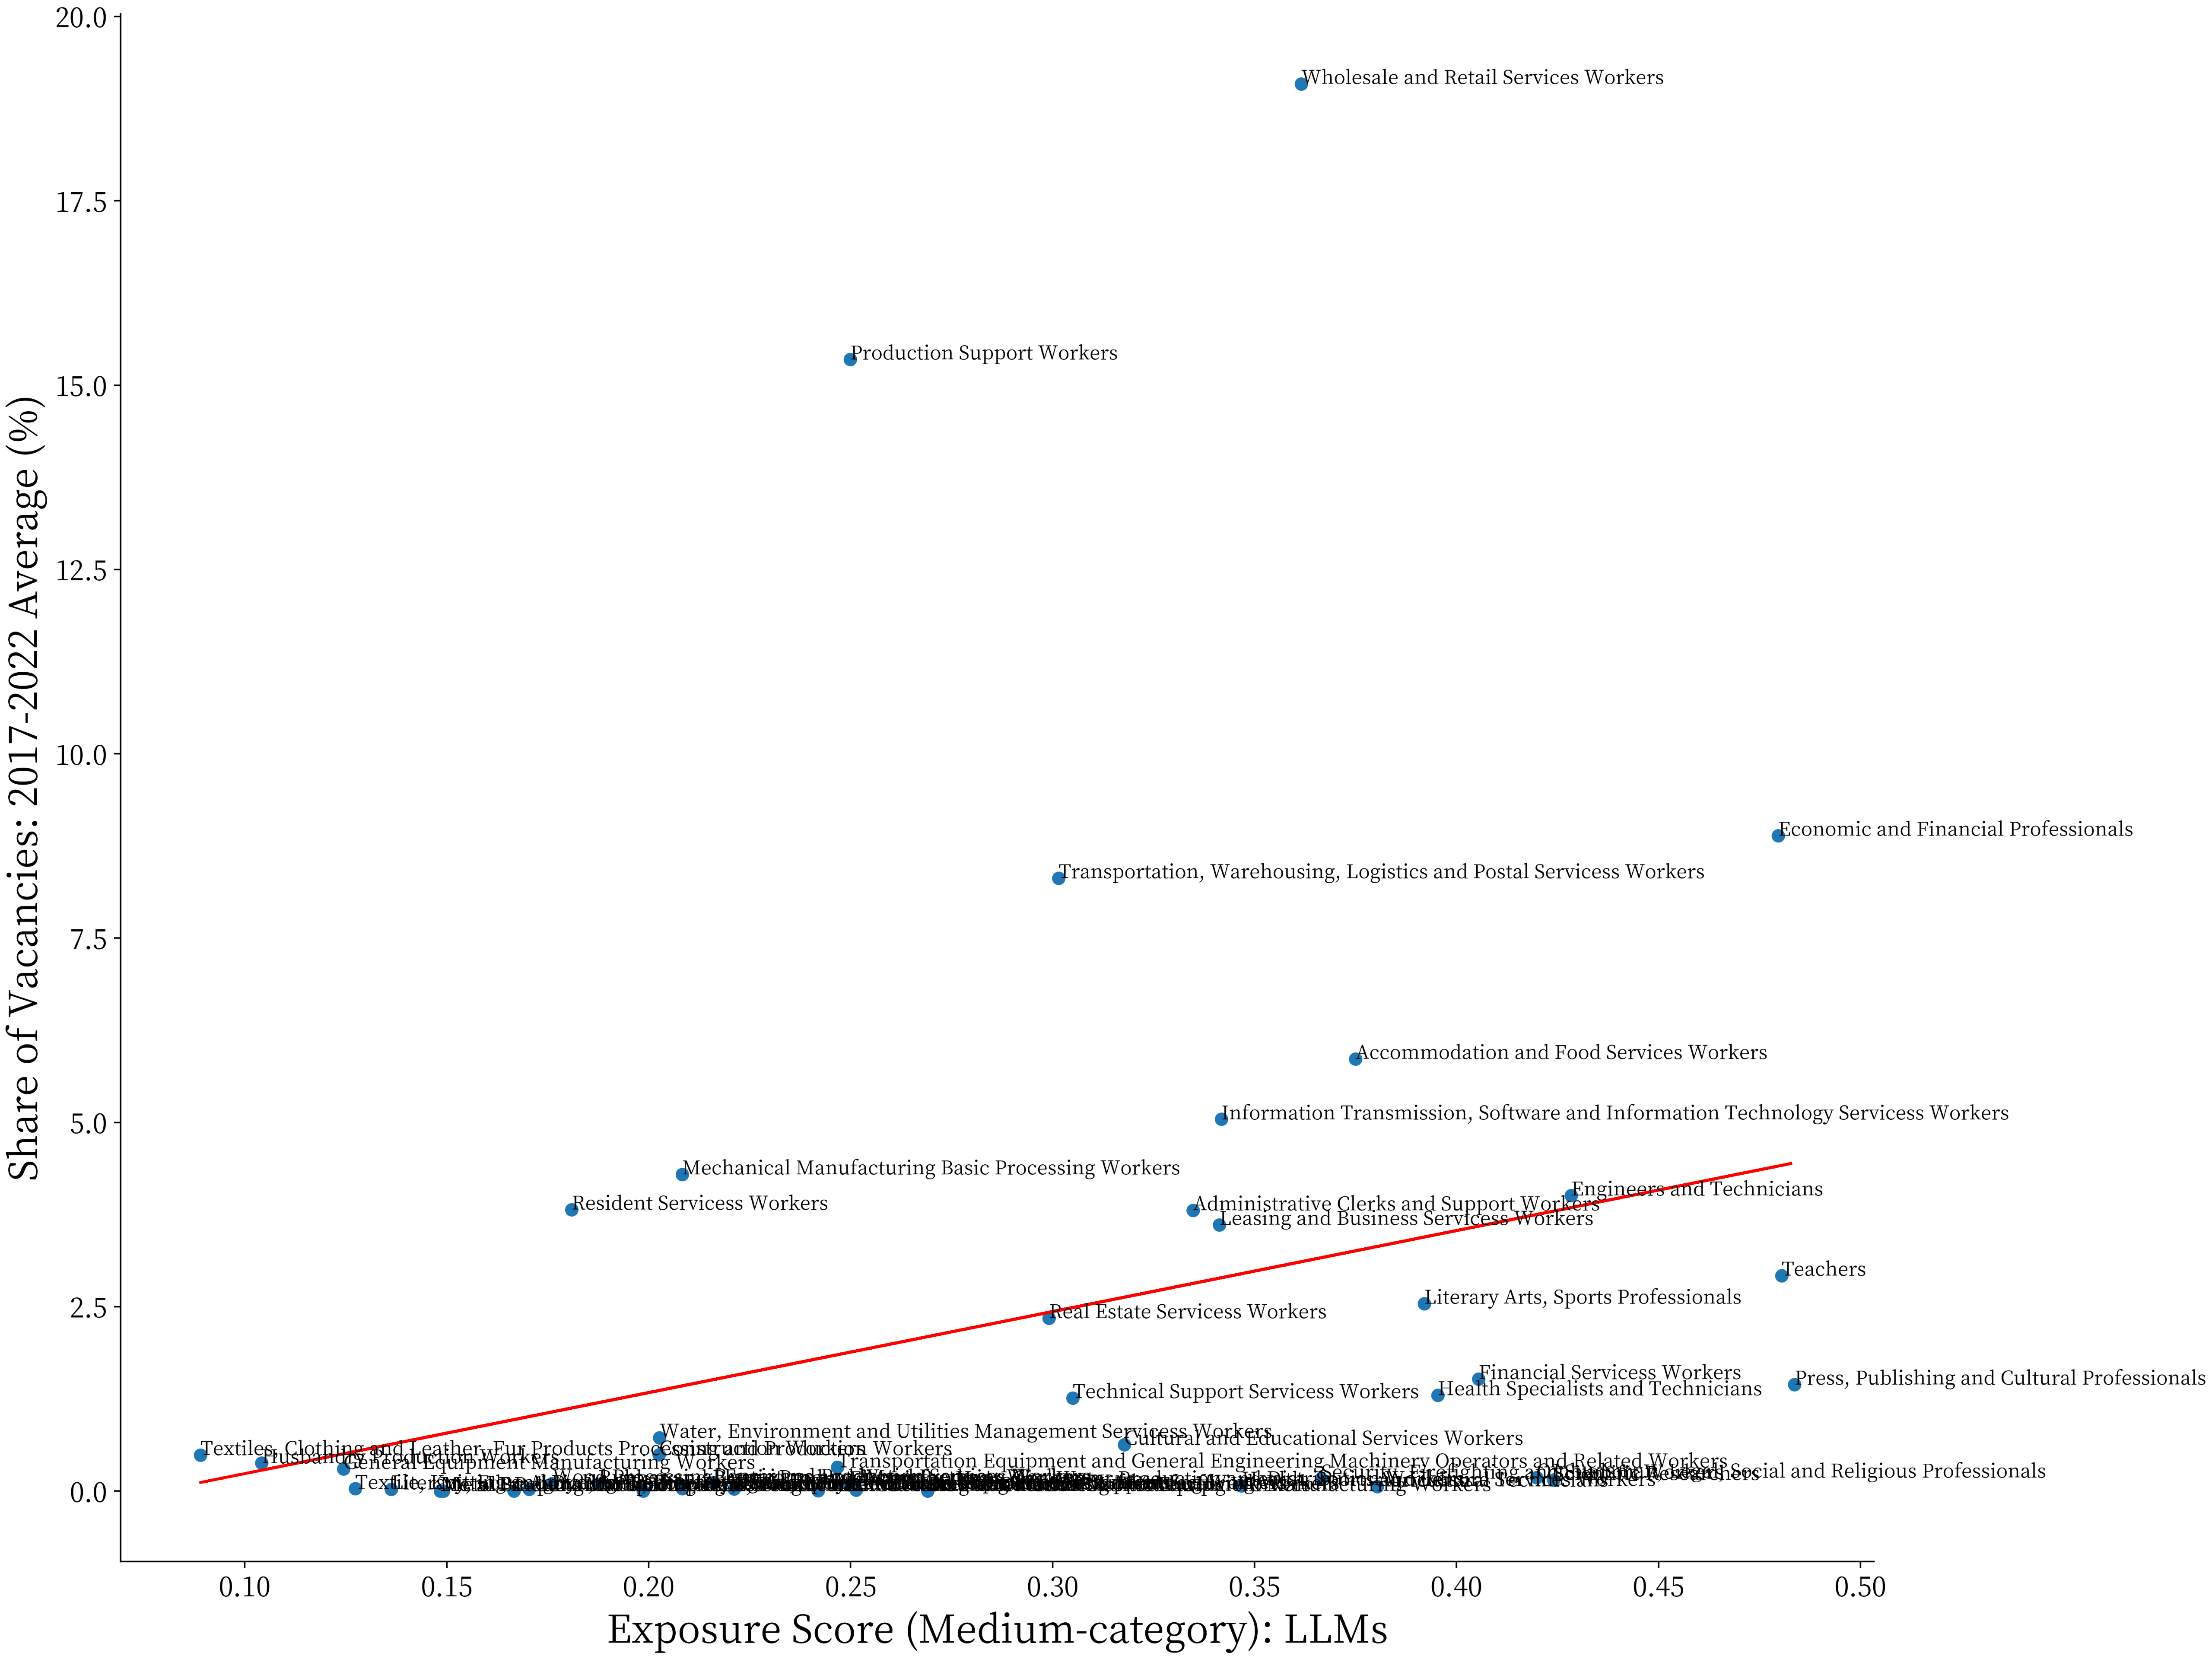
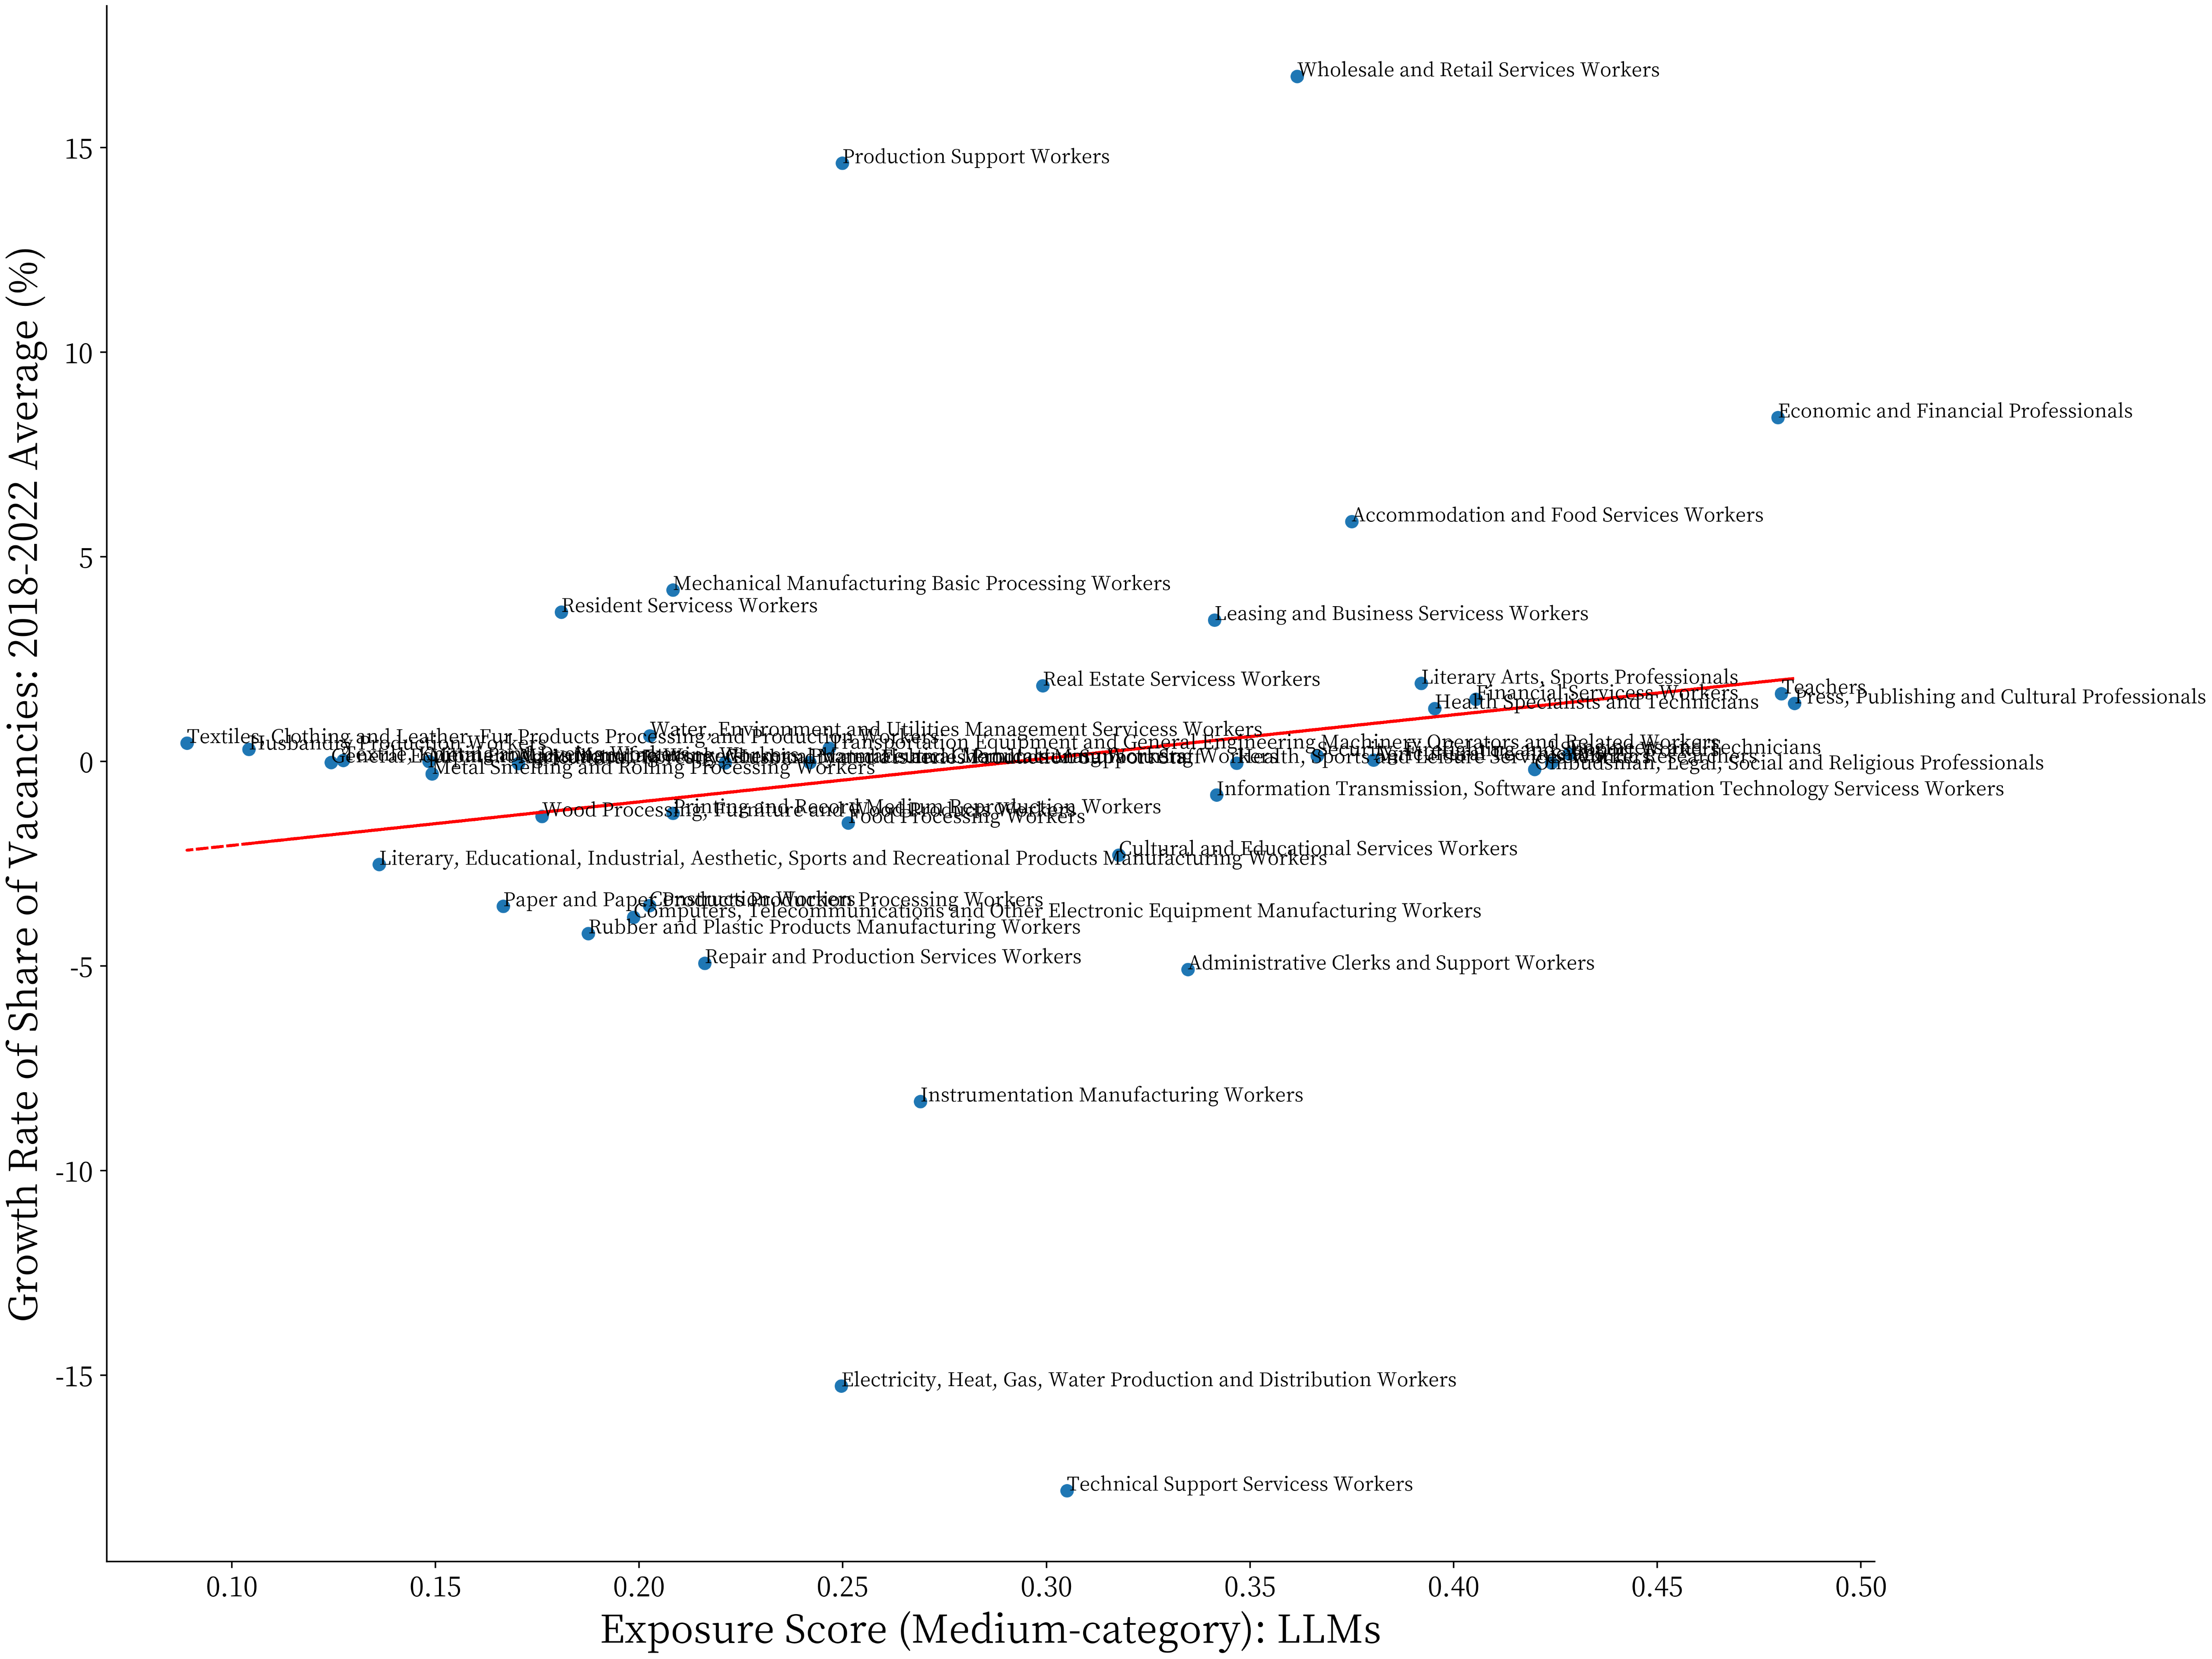
Figure 7 and 8 offer a comprehensive overview of potential impacts on future labor demand whinin China. The presence of a positive correlation between occupational exposure and vacancy share, as depicted in Figure 7, suggests that occupations with a higher vacancy share may potentially experience more pronounced disruptive effects from LLMs in the future. Contrary to the prevailing assumptions, the occupational structure in China tends to exacerbates rather than ameliorate the disruption caused by LLMs. Figure 8 unveils an additional layer of concern related to the disruptive effects of LLMs. The positive correlation between occupational exposure and growth rate of vacancy share implies that the advancements of LLMs could unexpectedly reverse the prevailing labor demand trend, thereby intensifying the structural unemployment predicament in the future.
A Model on Productivity Growth and Risk
The analysis of AI occupation and industry exposure presented in the preceding sections unveils substantial potential impacts on both labor markets and industries. It is imperative to delve deeper into comprehending the regulation of transformative technologies like LLMs, as they possess the capacity for both constructive and detrimental applications.
The transformative potential of LLMs technology originates from their capacity to enhance productivity growth across various economic sectors. Nevertheless, this potential is accompanied by disruptions in employment. The regulation of LLMs necessitates a delicate balance between the positive productivity effects and the adverse costs of disruption on labor markets.
Recently, Acemoglu and Lensman (2023) introduced a multi-sector technology adoption model that explores the optimal regulatory policy for transformative technologies, considering the dynamic evolution of societal risk awareness. In this section, we build upon their framework to develop a simplified theoretical model. Our model addresses the trade-off between productivity growth and the disruptive costs posed by LLMs. Notably, our model differs in that it is static, while also integrating AI occupation/industry exposure.
Consider an economy where a unique final good is linearly produced from a range of sectors :
Each sector has the choice to adopt either an old technology or a new AI technology . Assuming that the sectoral output under the old technology is
and the sectoral output under the new AI technology is
We define the technology choice variable if sector transitions its production process to the new AI technology , and otherwise.
As the adoption of new technology reshapes the economy, it brings forth new risks. We model these risks by considering the negative effects on labor markets. Sectors utilizing the new technology will suffer damages represented by . In simpler terms, the damage is calculated as
| (1) |
The final output is
| (2) |
Suppose there are occupations in sector , and the distribution of labor across occupations is denoted by , where 0 and . The total number of workers in sector , , can be decomposed into different occupations as
| (3) |
We can measure AI exposure at the sector level using the AI occupational exposure, denoted as . The AI sector exposure, , is calculated as
| (4) |
Assuming that the growth of productivity in sector caused by the new AI technology is represented by , we have
| (5) |
One choice for the growth of productivity can be .
The final output is given by
Simplifying further, we obtain
| (6) |
The relative growth of final output under the new AI technology with respect to the old technology is
Let the sector output share under old technology is . Then
| (7) |
The new AI technology adoption for sector can be determined if the productivity growth and damage ratio satisfies the following condition:
| (8) |
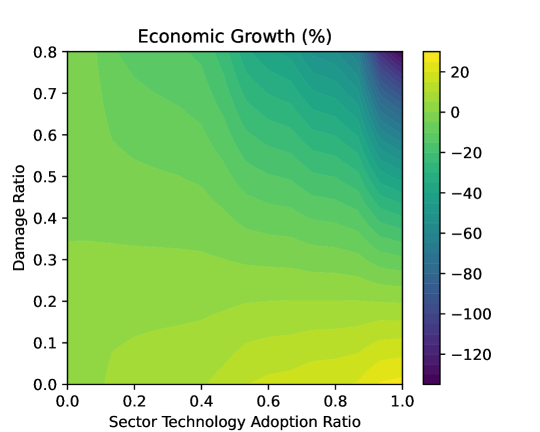
If the growth of productivity is defined as , the sector will have the incentive to adopt the new AI technology when the AI sector exposure exceeds a certain threshold determined by the damage ratio. More specifically, if
| (9) |
the sector will find it beneficial to adopt the new AI technology. We provide a quantitative contour curve illustrating the relationship between economic growth and sectoral technology adoption in Appendix B (Figure 15). Moving forward, the calibration of productivity effects and disruptive costs within the labor market will offer more comprehensive insights into formulating an optimal policy on for regulating LLMs.
Conclusions
As a general purpose technology, the arrival and diffusion of large language models represent a major technological shock with important effects on the overall economy. This paper uses occupational exposures to LLMs, along with aggregate measures of occupational composition, to assess the potential impact of LLMs on labor market within China’s economy. We find that the potential effect of the release of LLMs on the Chinese labor market will be significant, potentially reversing previous labor demand trends. LLMs represent an important shock to the Chinese labor market.
References
- Acemoglu (2002) Acemoglu, D. 2002. Technical change, inequality, and the labor market. Journal of economic literature, 40(1): 7–72.
- Acemoglu and Autor (2011) Acemoglu, D.; and Autor, D. 2011. Skills, tasks and technologies: Implications for employment and earnings. In Handbook of labor economics, volume 4, 1043–1171. Elsevier.
- Acemoglu and Lensman (2023) Acemoglu, D.; and Lensman, T. 2023. Regulating Transformative Technologies. Technical report, National Bureau of Economic Research.
- Acemoglu and Restrepo (2018) Acemoglu, D.; and Restrepo, P. 2018. The race between man and machine: Implications of technology for growth, factor shares, and employment. American economic review, 108(6): 1488–1542.
- Acemoglu and Restrepo (2019) Acemoglu, D.; and Restrepo, P. 2019. Automation and new tasks: How technology displaces and reinstates labor. Journal of Economic Perspectives, 33(2): 3–30.
- Acemoglu and Restrepo (2022) Acemoglu, D.; and Restrepo, P. 2022. Tasks, automation, and the rise in us wage inequality. Econometrica, 90(5): 1973–2016.
- Agrawal, Gans, and Goldfarb (2019) Agrawal, A.; Gans, J.; and Goldfarb, A. 2019. Economic policy for artificial intelligence. Innovation policy and the economy, 19(1): 139–159.
- Autor, Katz, and Kearney (2006) Autor, D. H.; Katz, L. F.; and Kearney, M. S. 2006. The polarization of the US labor market. American economic review, 96(2): 189–194.
- Autor, Levy, and Murnane (2003) Autor, D. H.; Levy, F.; and Murnane, R. J. 2003. The skill content of recent technological change: An empirical exploration. The Quarterly journal of economics, 118(4): 1279–1333.
- Brynjolfsson, Li, and Raymond (2023) Brynjolfsson, E.; Li, D.; and Raymond, L. R. 2023. Generative AI at work. Technical report, National Bureau of Economic Research.
- Brynjolfsson, Mitchell, and Rock (2018) Brynjolfsson, E.; Mitchell, T.; and Rock, D. 2018. What can machines learn and what does it mean for occupations and the economy? In AEA papers and proceedings, volume 108, 43–47. American Economic Association 2014 Broadway, Suite 305, Nashville, TN 37203.
- Bubeck et al. (2023) Bubeck, S.; Chandrasekaran, V.; Eldan, R.; Gehrke, J.; Horvitz, E.; Kamar, E.; Lee, P.; Lee, Y. T.; Li, Y.; Lundberg, S.; et al. 2023. Sparks of artificial general intelligence: Early experiments with GPT-4. arXiv preprint arXiv:2303.12712.
- Du et al. (2022) Du, Z.; Qian, Y.; Liu, X.; Ding, M.; Qiu, J.; Yang, Z.; and Tang, J. 2022. GLM: General Language Model Pretraining with Autoregressive Blank Infilling. In Proceedings of the 60th Annual Meeting of the Association for Computational Linguistics (Volume 1: Long Papers), 320–335.
- Eloundou et al. (2023) Eloundou, T.; Manning, S.; Mishkin, P.; and Rock, D. 2023. GPTs are GPTs: An early look at the labor market impact potential of large language models. arXiv preprint arXiv:2303.10130.
- Felten, Raj, and Seamans (2018) Felten, E. W.; Raj, M.; and Seamans, R. 2018. A method to link advances in artificial intelligence to occupational abilities. In AEA Papers and Proceedings, volume 108, 54–57. American Economic Association 2014 Broadway, Suite 305, Nashville, TN 37203.
- Felten, Raj, and Seamans (2023) Felten, E. W.; Raj, M.; and Seamans, R. 2023. Occupational heterogeneity in exposure to generative ai. Available at SSRN 4414065.
- Frey and Osborne (2017) Frey, C. B.; and Osborne, M. A. 2017. The future of employment: How susceptible are jobs to computerisation? Technological forecasting and social change, 114: 254–280.
- Furman and Seamans (2019) Furman, J.; and Seamans, R. 2019. AI and the Economy. Innovation policy and the economy, 19(1): 161–191.
- Galasso and Luo (2018) Galasso, A.; and Luo, H. 2018. Punishing Robots: issues in the economics of tort liability and innovation in artificial intelligence. In The Economics of Artificial Intelligence: An Agenda, 493–504. University of Chicago Press.
- Goldfarb, Taska, and Teodoridis (2023) Goldfarb, A.; Taska, B.; and Teodoridis, F. 2023. Could machine learning be a general purpose technology? a comparison of emerging technologies using data from online job postings. Research Policy, 52(1): 104653.
- Grace et al. (2018) Grace, K.; Salvatier, J.; Dafoe, A.; Zhang, B.; and Evans, O. 2018. When will AI exceed human performance? Evidence from AI experts. Journal of Artificial Intelligence Research, 62: 729–754.
- InternLM-Team (2023) InternLM-Team. 2023. InternLM: A Multilingual Language Model with Progressively Enhanced Capabilities. GitHub https://github.com/InternLM/InternLM-techreport/blob/main/InternLM.pdf.
- Katz and Murphy (1992) Katz, L. F.; and Murphy, K. M. 1992. Changes in relative wages, 1963–1987: supply and demand factors. The quarterly journal of economics, 107(1): 35–78.
- Meindl, Frank, and Mendonça (2021) Meindl, B.; Frank, M. R.; and Mendonça, J. 2021. Exposure of occupations to technologies of the fourth industrial revolution. arXiv preprint arXiv:2110.13317.
- Noy and Zhang (2023) Noy, S.; and Zhang, W. 2023. Experimental evidence on the productivity effects of generative artificial intelligence. Available at SSRN 4375283.
- OpenAI (2023) OpenAI. 2023. GPT-4 Technical Report. ArXiv, abs/2303.08774.
- Peng et al. (2023) Peng, S.; Kalliamvakou, E.; Cihon, P.; and Demirer, M. 2023. The impact of ai on developer productivity: Evidence from github copilot. arXiv preprint arXiv:2302.06590.
- Tolan et al. (2021) Tolan, S.; Pesole, A.; Martínez-Plumed, F.; Fernández-Macías, E.; Hernández-Orallo, J.; and Gómez, E. 2021. Measuring the occupational impact of ai: tasks, cognitive abilities and ai benchmarks. Journal of Artificial Intelligence Research, 71: 191–236.
- Van Reenen (2011) Van Reenen, J. 2011. Wage inequality, technology and trade: 21st century evidence. Labour economics, 18(6): 730–741.
- Webb (2019) Webb, M. 2019. The impact of artificial intelligence on the labor market. Available at SSRN 3482150.
- Zeng et al. (2022) Zeng, A.; Liu, X.; Du, Z.; Wang, Z.; Lai, H.; Ding, M.; Yang, Z.; Xu, Y.; Zheng, W.; Xia, X.; et al. 2022. GLM-130B: An open bilingual pre-trained model. arXiv preprint arXiv:2210.02414.
- Zhao et al. (2023) Zhao, W. X.; Zhou, K.; Li, J.; Tang, T.; Wang, X.; Hou, Y.; Min, Y.; Zhang, B.; Zhang, J.; Dong, Z.; et al. 2023. A survey of large language models. arXiv preprint arXiv:2303.18223.
Appendix
Appendix A. Methodology Notes
LLMs Scoring Details
The scores fall into the following categories:
-
•
E0 indicates no exposure as the LLMs are neither sufficiently useful for the occupation, nor considered a result of the intrinsic nature of the occupation, (e.g., involving physical activities);
-
•
E1 is applied if a 50 reduction in completion time is already feasible with the existing large language model interfaces;
-
•
E2 is applied if such a productivity gain is feasible, but only once the current capabilities of the model can be deployed through applications with further inputs or if it is trained on domain-specific issues or data;
-
•
E3 is applied when the productivity increase would require image processing capabilities in addition to current text processing.
Expert Rubrics
You are an expert evaluator of the potential for large language models to replace human labor. Large language models are deep learning models used to process and generate natural language text. The latest large language models can generate and describe images and videos based on natural language texts. In this context, you are asked to score each occupation based on whether the occupation could reduce the need for human labor time and participation to achieve the same output or effect in the same amount of time with the aid of large language models.
The scores range from 0 to 1:
-
•
0 means the occupation cannot reduce human labor input with the help of large language models.
-
•
0.2 means human labor input could be reduced by 20%.
-
•
0.4 means human labor input could be reduced by 40%.
-
•
0.6 means human labor input could be reduced by 60%.
-
•
0.8 means human labor input could be reduced by 80%.
-
•
1 means human labor input could be reduced by 100%, meaning the occupation would no longer require human participation.
Your scores represent the potential proportion of human labor input that could be saved by large language models for each occupation. Please score carefully based on the current capabilities of large language models and what you think is possible in the future.
Appendix B. Appendix Figures
Appendix C. Appendix Tables
| Occupation Code | Medium-category Occupation Title | Expert | GLM | GPT4 | InternLM | GLM + InternLM + GPT4 |
| 2-01 | Scientific Researchers | 0.3810 | 0.6227 | 0.3472 | 0.3021 | 0.4240 |
| 2-02 | Engineers and Technicians | 0.3714 | 0.5612 | 0.3600 | 0.3640 | 0.4284 |
| 2-03 | Agricultural Technicians | 0.2857 | 0.5881 | 0.2308 | 0.3221 | 0.3803 |
| 2-04 | Aircraft and Marine Technicians | 0.3714 | 0.6235 | 0.0893 | 0.1384 | 0.2837 |
| 2-05 | Health Specialists and Technicians | 0.3524 | 0.6776 | 0.2778 | 0.2307 | 0.3954 |
| 2-06 | Economic and Financial Professionals | 0.5238 | 0.6673 | 0.4467 | 0.3248 | 0.4796 |
| 2-07 | Ombudsman, Legal, Social and Religious Professionals | 0.4000 | 0.5505 | 0.4808 | 0.2284 | 0.4199 |
| 2-08 | Teachers | 0.4667 | 0.8164 | 0.5313 | 0.0938 | 0.4805 |
| 2-09 | Literary Arts, Sports Professionals | 0.3143 | 0.4573 | 0.5196 | 0.1991 | 0.3920 |
| 2-10 | Press, Publishing and Cultural Professionals | 0.6095 | 0.6176 | 0.5179 | 0.3155 | 0.4836 |
| 3-01 | Administrative Clerks and Support Workers | 0.5714 | 0.3196 | 0.5568 | 0.1278 | 0.3348 |
| 3-02 | Security, Firefighting and Support Workers | 0.2000 | 0.3551 | 0.4545 | 0.2898 | 0.3665 |
| 3-03 | Legal Affairs and Support Workers | 0.4381 | 0.4583 | 0.5000 | 0.2083 | 0.3889 |
| 4-01 | Wholesale and Retail Services Workers | 0.3429 | 0.3199 | 0.5515 | 0.2132 | 0.3615 |
| 4-02 | Transportation, Warehousing, Logistics and Postal Servicess Workers | 0.3048 | 0.3047 | 0.5160 | 0.0838 | 0.3015 |
| 4-03 | Accommodation and Food Services Workers | 0.2571 | 0.4570 | 0.4531 | 0.2148 | 0.3750 |
| 4-04 | Information Transmission, Software and Information Technology Servicess Workers | 0.4762 | 0.4074 | 0.3241 | 0.2940 | 0.3418 |
| 4-05 | Financial Servicess Workers | 0.5143 | 0.4808 | 0.4327 | 0.3029 | 0.4054 |
| 4-06 | Real Estate Servicess Workers | 0.4571 | 0.3393 | 0.3929 | 0.1652 | 0.2991 |
| 4-07 | Leasing and Business Servicess Workers | 0.4190 | 0.4724 | 0.3669 | 0.1845 | 0.3413 |
| 4-08 | Technical Support Servicess Workers | 0.4381 | 0.4199 | 0.3066 | 0.1885 | 0.3050 |
| 4-09 | Water, Environment and Utilities Management Servicess Workers | 0.2952 | 0.3267 | 0.1583 | 0.1229 | 0.2027 |
| 4-10 | Resident Servicess Workers | 0.2476 | 0.2885 | 0.1417 | 0.1125 | 0.1809 |
| 4-11 | Electricity, Gas and Water Supply Services Workers | 0.3048 | 0.6753 | 0.1458 | 0.3802 | 0.4005 |
| 4-12 | Repair and Production Services Workers | 0.2190 | 0.4203 | 0.1250 | 0.1029 | 0.2161 |
| 4-13 | Cultural and Educational Services Workers | 0.3810 | 0.5036 | 0.1685 | 0.2813 | 0.3178 |
| 4-14 | Health, Sports and Leisure Services Workers | 0.3333 | 0.6070 | 0.1595 | 0.2737 | 0.3467 |
| 5-01 | Agricultural Production Workers | 0.2190 | 0.3259 | 0.1964 | 0.0357 | 0.1860 |
| 5-02 | Forestry Production Workers | 0.2095 | 0.2054 | 0.2321 | 0.0714 | 0.1696 |
| 5-03 | Husbandry Production Workers | 0.2190 | 0.1518 | 0.1429 | 0.0179 | 0.1042 |
| 5-04 | Fisheries Production Workers | 0.2190 | 0.2852 | 0.0000 | 0.0625 | 0.1159 |
| 5-05 | Agricultural, Forestry, Husbandry and Fisheries Production Support Staff | 0.2667 | 0.3163 | 0.0650 | 0.1300 | 0.1704 |
| 6-01 | Agricultural By-Products Processing Workers | 0.2571 | 0.3958 | 0.1750 | 0.0167 | 0.1958 |
| 6-02 | Food Processing Workers | 0.2667 | 0.4807 | 0.2054 | 0.0681 | 0.2514 |
| 6-03 | Tobacco and Products Processing Workers | 0.2667 | 0.4826 | 0.3333 | 0.0625 | 0.2928 |
| 6-04 | Textile, Knitting and Dyeing Workers | 0.2667 | 0.2259 | 0.1193 | 0.0369 | 0.1274 |
| 6-05 | Textiles, Clothing and Leather, Fur Products Processing and Production Workers | 0.2667 | 0.1534 | 0.0682 | 0.0455 | 0.0890 |
| 6-06 | Wood Processing, Furniture and Wood Products Workers | 0.2762 | 0.1989 | 0.2727 | 0.0568 | 0.1761 |
| 6-07 | Paper and Paper Products Production Processing Workers | 0.2571 | 0.1979 | 0.2292 | 0.0729 | 0.1667 |
| 6-08 | Printing and Record Medium Reproduction Workers | 0.4700 | 0.2656 | 0.2813 | 0.0781 | 0.2083 |
| 6-09 | Literary, Educational, Industrial, Aesthetic, Sports and Recreational Products Manufacturing Workers | 0.3048 | 0.2997 | 0.0481 | 0.0609 | 0.1362 |
| 6-10 | Petroleum Processing and Coking, Coal Chemical Production Workers | 0.2857 | 0.5016 | 0.0000 | 0.0674 | 0.1897 |
| 6-11 | Chemical Materials and Chemicals Manufacturing Workers | 0.2857 | 0.5307 | 0.0000 | 0.1327 | 0.2211 |
| 6-12 | Pharmaceutical Manufacturing Workers | 0.3333 | 0.6215 | 0.0000 | 0.1042 | 0.2419 |
| 6-13 | Chemical Fiber Manufacturing Workers | 0.2857 | 0.3203 | 0.0000 | 0.0313 | 0.1172 |
| 6-14 | Rubber and Plastic Products Manufacturing Workers | 0.2762 | 0.4583 | 0.0000 | 0.1042 | 0.1875 |
| 6-15 | Non-metallic Mineral Products Manufacturing Workers | 0.2667 | 0.2829 | 0.0174 | 0.0349 | 0.1118 |
| 6-16 | Mining Workers | 0.2667 | 0.2885 | 0.0000 | 0.1080 | 0.1322 |
| 6-17 | Metal Smelting and Rolling Processing Workers | 0.2667 | 0.3379 | 0.0660 | 0.0436 | 0.1492 |
| 6-18 | Mechanical Manufacturing Basic Processing Workers | 0.2857 | 0.3448 | 0.2500 | 0.0302 | 0.2083 |
| 6-19 | Metal Products Manufacturing Workers | 0.2667 | 0.3438 | 0.0625 | 0.0391 | 0.1484 |
| 6-20 | General Equipment Manufacturing Workers | 0.2571 | 0.2856 | 0.0000 | 0.0877 | 0.1244 |
| 6-21 | Specialized Equipment Manufacturing Workers | 0.2952 | 0.3006 | 0.0000 | 0.0670 | 0.1225 |
| 6-22 | Automotive Manufacturing Workers | 0.3143 | 0.3813 | 0.0000 | 0.1000 | 0.1604 |
| 6-23 | Railroad, Marine, and Aviation Equipment Manufacturing Workers | 0.2952 | 0.1629 | 0.0000 | 0.1373 | 0.1001 |
| 6-24 | Electrical Machinery and Equipment Manufacturing Workers | 0.3143 | 0.3898 | 0.0197 | 0.0921 | 0.1672 |
| 6-25 | Computers, Telecommunications and Other Electronic Equipment Manufacturing Workers | 0.3429 | 0.3801 | 0.1212 | 0.0947 | 0.1987 |
| 6-26 | Instrumentation Manufacturing Workers | 0.2857 | 0.4323 | 0.1250 | 0.2500 | 0.2691 |
| 6-27 | Recycling and Reclamation Workers | 0.2286 | 0.1250 | 0.1250 | 0.0625 | 0.1042 |
| 6-28 | Electricity, Heat, Gas, Water Production and Distribution Workers | 0.2857 | 0.4236 | 0.2407 | 0.0845 | 0.2496 |
| 6-29 | Construction Workers | 0.2381 | 0.2525 | 0.2072 | 0.1480 | 0.2026 |
| 6-30 | Transportation Equipment and General Engineering Machinery Operators and Related Workers | 0.2857 | 0.3760 | 0.2438 | 0.1203 | 0.2467 |
| 6-31 | Production Support Workers | 0.2857 | 0.3179 | 0.2315 | 0.2002 | 0.2499 |
| Ind. | ID |
| Education, Culture and Arts, Radio, Film and Television | 1 |
| Scientific Research and Integrated Technology Services | 2 |
| Wholesale and Retail Trade, Restaurants | 3 |
| Social Services | 4 |
| Others | 5 |
| Financial and Insurance Industry | 6 |
| Transportation, Storage and Postal Communications | 7 |
| Real Estate | 8 |
| Construction Industry | 9 |
| Electricity, Gas, Water Production and Supply Industry | 10 |
| Manufacturing Industry | 11 |
| Health, Sports and Social Welfare Industry | 12 |
| Agriculture, Forestry, Husbandry and Fisheries | 13 |
| Mining Industry | 14 |
| Geological Survey Industry, Water Management Industry | 15 |
|
Ind.
Occ. |
1 | 2 | 3 | 4 | 5 | 6 | 7 | 8 | 9 | 10 | 11 | 12 | 13 | 14 | 15 |
| Transporta-tion, Warehousing, Logistics and Postal Services Workers | 0% | 0% | 1% | 7% | 8% | 1% | 72% | 0% | 1% | 1% | 3% | 1% | 0% | 4% | 0% |
| Accommoda-tion and Food Services Workers | 0% | 0% | 21% | 10% | 5% | 1% | 0% | 1% | 0% | 1% | 1% | 0% | 0% | 0% | 5% |
| Information Transmission, Software and Information Technology Servicess Workers | 0% | 23% | 0% | 1% | 4% | 1% | 6% | 0% | 0% | 1% | 0% | 0% | 0% | 0% | 0% |
| Repair and Production Services Workers | 0% | 7% | 0% | 2% | 5% | 0% | 2% | 0% | 0% | 2% | 1% | 0% | 0% | 1% | 0% |
| Agricultural Production Workers | 0% | 2% | 0% | 0% | 3% | 1% | 0% | 1% | 1% | 0% | 0% | 1% | 96% | 0% | 0% |
| Printing and Record Medium Reproduction Workers | 0% | 0% | 0% | 0% | 0% | 0% | 0% | 0% | 0% | 0% | 1% | 0% | 0% | 0% | 0% |
| Resident Servicess Workers | 2% | 8% | 0% | 14% | 7% | 0% | 0% | 0% | 0% | 1% | 1% | 2% | 0% | 0% | 0% |
| Engineers and Technicians | 0% | 18% | 0% | 0% | 0% | 1% | 1% | 1% | 3% | 2% | 2% | 1% | 0% | 2% | 14% |
| Construction Workers | 0% | 0% | 0% | 1% | 3% | 0% | 1% | 9% | 78% | 5% | 1% | 0% | 0% | 0% | 5% |
| Wholesale and Retail Services Workers | 1% | 3% | 69% | 14% | 17% | 3% | 4% | 9% | 3% | 1% | 3% | 8% | 0% | 2% | 5% |
| Technical Support Servicess Workers | 3% | 2% | 0% | 0% | 2% | 0% | 0% | 1% | 0% | 0% | 1% | 0% | 0% | 0% | 18% |
| Teachers | 77% | 0% | 0% | 0% | 0% | 0% | 0% | 0% | 0% | 0% | 0% | 3% | 0% | 0% | 0% |
| Cultural and Educational Services Workers | 1% | 3% | 0% | 1% | 3% | 0% | 0% | 0% | 0% | 0% | 0% | 0% | 0% | 0% | 0% |
| Literary Arts, Sports Professionals | 4% | 2% | 0% | 0% | 2% | 0% | 0% | 0% | 0% | 0% | 0% | 0% | 0% | 0% | 0% |
| Press, Publishing and Cultural Professionals | 2% | 0% | 0% | 0% | 0% | 0% | 0% | 0% | 0% | 0% | 0% | 1% | 0% | 0% | 0% |
| Ombudsman, Legal, Social and Religious Professionals | 0% | 0% | 0% | 5% | 1% | 1% | 0% | 0% | 0% | 0% | 0% | 0% | 0% | 0% | 0% |
| Leasing and Business Servicess Workers | 1% | 2% | 1% | 11% | 9% | 1% | 1% | 5% | 0% | 4% | 1% | 1% | 0% | 2% | 0% |
| Economic and Financial Professionals | 2% | 12% | 2% | 4% | 5% | 26% | 2% | 11% | 1% | 1% | 3% | 2% | 0% | 1% | 5% |
| Admini-strative Clerks and Support Workers | 4% | 5% | 0% | 11% | 5% | 2% | 3% | 4% | 1% | 3% | 3% | 7% | 0% | 4% | 9% |
| Health, Sports and Leisure Services Workers | 0% | 2% | 0% | 1% | 0% | 0% | 0% | 0% | 0% | 0% | 0% | 6% | 0% | 0% | 0% |
| Agricultural, Forestry, Husbandry and Fisheries Production Support Staff | 0% | 2% | 0% | 0% | 1% | 0% | 0% | 0% | 0% | 0% | 0% | 0% | 0% | 0% | 0% |
| Security, Firefighting and Support Workers | 0% | 2% | 0% | 1% | 0% | 0% | 0% | 0% | 0% | 0% | 0% | 0% | 0% | 0% | 0% |
| Production Support Workers | 0% | 3% | 0% | 0% | 4% | 0% | 1% | 0% | 2% | 17% | 8% | 1% | 0% | 8% | 0% |
| Scientific Researchers | 0% | 3% | 0% | 0% | 0% | 1% | 0% | 0% | 0% | 0% | 0% | 0% | 0% | 0% | 0% |
| Computers, Telecommunications and Other Electronic Equipment Manufacturing Workers | 0% | 2% | 0% | 0% | 2% | 0% | 0% | 0% | 0% | 1% | 6% | 0% | 0% | 0% | 0% |
| Recycling and Reclamation Workers | 0% | 0% | 0% | 0% | 1% | 0% | 0% | 0% | 0% | 0% | 0% | 0% | 0% | 0% | 5% |
| Agricultural By-Products Processing Workers | 0% | 0% | 0% | 0% | 1% | 0% | 0% | 0% | 0% | 0% | 0% | 0% | 0% | 0% | 0% |
| Literary, Educational, Industrial, Aesthetic, Sports and Recreational Products Manufacturing Workers | 0% | 0% | 0% | 0% | 0% | 0% | 0% | 0% | 0% | 0% | 4% | 0% | 0% | 0% | 0% |
| Wood Processing, Furniture and Wood Products Workers | 0% | 0% | 0% | 0% | 1% | 0% | 0% | 0% | 2% | 0% | 4% | 0% | 0% | 0% | 0% |
| Mechanical Manufacturing Basic Processing Workers | 0% | 0% | 0% | 0% | 1% | 0% | 0% | 0% | 1% | 1% | 6% | 0% | 0% | 0% | 0% |
| Rubber and Plastic Products Manufacturing Workers | 0% | 0% | 0% | 0% | 1% | 0% | 0% | 0% | 0% | 1% | 2% | 0% | 0% | 0% | 0% |
| Water, Environment and Utilities Management Servicess Workers | 0% | 0% | 1% | 10% | 3% | 0% | 0% | 0% | 0% | 1% | 0% | 20% | 0% | 0% | 14% |
| Textile, Knitting and Dyeing Workers | 0% | 0% | 0% | 0% | 1% | 0% | 0% | 0% | 0% | 1% | 4% | 0% | 0% | 0% | 0% |
| Textiles, Clothing and Leather, Fur Products Processing and Production Workers | 0% | 0% | 0% | 0% | 1% | 0% | 0% | 0% | 0% | 0% | 13% | 0% | 0% | 0% | 0% |
| Metal Products Manufacturing Workers | 0% | 0% | 0% | 0% | 0% | 0% | 0% | 0% | 0% | 0% | 7% | 0% | 0% | 0% | 0% |
| Non-metallic Mineral Products Manufacturing Workers | 0% | 0% | 0% | 0% | 1% | 0% | 0% | 0% | 2% | 0% | 6% | 0% | 0% | 0% | 0% |
| Food Processing Workers | 0% | 0% | 1% | 0% | 1% | 0% | 0% | 0% | 0% | 0% | 1% | 0% | 0% | 0% | 0% |
| Health Specialists and Technicians | 0% | 0% | 0% | 1% | 0% | 0% | 0% | 0% | 0% | 0% | 0% | 41% | 0% | 1% | 0% |
| Real Estate Servicess Workers | 0% | 0% | 0% | 4% | 0% | 0% | 0% | 56% | 0% | 0% | 0% | 0% | 0% | 0% | 0% |
| Forestry Production Workers | 0% | 0% | 0% | 0% | 0% | 0% | 0% | 0% | 0% | 0% | 0% | 0% | 0% | 0% | 0% |
| Electricity, Gas and Water Supply Services Workers | 0% | 0% | 0% | 1% | 0% | 0% | 1% | 0% | 0% | 19% | 0% | 0% | 0% | 0% | 14% |
| Paper and Paper Products Production Processing Workers | 0% | 0% | 0% | 0% | 0% | 0% | 0% | 0% | 0% | 0% | 2% | 0% | 0% | 0% | 0% |
| Financial Servicess Workers | 0% | 0% | 0% | 0% | 1% | 63% | 0% | 0% | 0% | 0% | 0% | 0% | 0% | 0% | 0% |
| Specialized Equipment Manufacturing Workers | 0% | 0% | 0% | 0% | 0% | 0% | 0% | 0% | 0% | 0% | 1% | 0% | 0% | 0% | 0% |
| Instrumenta-tion Manufacturing Workers | 0% | 0% | 0% | 0% | 0% | 0% | 0% | 0% | 0% | 0% | 0% | 0% | 0% | 0% | 0% |
| Agricultural Technicians | 0% | 0% | 0% | 0% | 0% | 0% | 0% | 0% | 0% | 0% | 0% | 0% | 0% | 0% | 0% |
| Chemical Materials and Chemicals Manufacturing Workers | 0% | 0% | 0% | 0% | 2% | 0% | 0% | 0% | 0% | 1% | 1% | 0% | 0% | 0% | 0% |
| Pharmaceutical Manufacturing Workers | 0% | 0% | 0% | 0% | 0% | 0% | 0% | 0% | 0% | 0% | 0% | 1% | 0% | 0% | 0% |
| Electricity, Heat, Gas, Water Production and Distribution Workers | 0% | 0% | 0% | 0% | 0% | 0% | 0% | 1% | 0% | 30% | 0% | 0% | 0% | 0% | 5% |
| Electrical Machinery and Equipment Manufacturing Workers | 0% | 0% | 0% | 0% | 0% | 0% | 0% | 0% | 0% | 0% | 3% | 0% | 0% | 0% | 0% |
| Petroleum Processing and Coking, Coal Chemical Production Workers | 0% | 0% | 0% | 0% | 0% | 0% | 0% | 0% | 0% | 2% | 0% | 0% | 0% | 0% | 0% |
| Transporta-tion Equipment and General Engineering Machinery Operators and Related Workers | 0% | 0% | 0% | 0% | 0% | 0% | 3% | 0% | 2% | 0% | 1% | 0% | 0% | 5% | 0% |
| Mining Workers | 0% | 0% | 0% | 0% | 1% | 0% | 0% | 0% | 0% | 5% | 0% | 0% | 0% | 68% | 0% |
| Metal Smelting and Rolling Processing Workers | 0% | 0% | 0% | 0% | 0% | 0% | 0% | 0% | 0% | 1% | 3% | 0% | 0% | 0% | 5% |
| Railroad, Marine, and Aviation Equipment Manufacturing Workers | 0% | 0% | 0% | 0% | 0% | 0% | 0% | 0% | 0% | 0% | 1% | 0% | 0% | 0% | 0% |
| Aircraft and Marine Technicians | 0% | 0% | 0% | 0% | 0% | 0% | 0% | 0% | 0% | 0% | 0% | 0% | 0% | 0% | 0% |
| General Equipment Manufacturing Workers | 0% | 0% | 0% | 0% | 0% | 0% | 0% | 0% | 1% | 1% | 1% | 0% | 0% | 0% | 0% |
| Chemical Fiber Manufacturing Workers | 0% | 0% | 0% | 0% | 0% | 0% | 0% | 0% | 0% | 0% | 0% | 0% | 0% | 0% | 0% |
| Automotive Manufacturing Workers | 0% | 0% | 0% | 0% | 0% | 0% | 0% | 0% | 0% | 0% | 1% | 0% | 0% | 0% | 0% |
| Tobacco and Products Processing Workers | 0% | 0% | 0% | 0% | 0% | 0% | 0% | 0% | 0% | 0% | 0% | 0% | 0% | 0% | 0% |
| Fisheries Production Workers | 0% | 0% | 0% | 0% | 0% | 0% | 0% | 0% | 0% | 0% | 0% | 0% | 1% | 0% | 0% |
| Husbandry Production Workers | 0% | 0% | 0% | 0% | 0% | 0% | 0% | 0% | 0% | 0% | 0% | 0% | 1% | 0% | 0% |