2023
[1]\fnmHakim \surAtek
1]Institut d’Astrophysique de Paris, CNRS, Sorbonne Université, 98bis Boulevard Arago, 75014, Paris, France 2]Centre for Astrophysics and Supercomputing, Swinburne University of Technology, Melbourne, VIC 3122, Australia 3]Physics Department, Ben-Gurion University of the Negev, P.O. Box 653, Be’er-Sheva 84105, Israel 4]Department of Astronomy, The University of Texas at Austin, Austin, TX 78712, USA 5]Department of Physics and Astronomy and PITT PACC, University of Pittsburgh, Pittsburgh, PA 15260, USA 6]Center for Interdisciplinary Exploration and Research in Astrophysics (CIERA) and Department of Physics & Astronomy, Northwestern University, IL 60201, USA 7]Department of Astronomy, University of Geneva, Chemin Pegasi 51, 1290 Versoix, Switzerland 8]Cosmic Dawn Center (DAWN), Niels Bohr Institute, University of Copenhagen, Jagtvej 128, København N, DK-2200, Denmark 9]Kapteyn Astronomical Institute, University of Groningen, P.O. Box 800, 9700 AV Groningen, The Netherlands 10]Department of Astronomy, University of Massachusetts, Amherst, MA 01003, USA 11]Department of Astronomy, Yale University, New Haven, CT 06511, USA 12]NSF’s National Optical-Infrared Astronomy Research Laboratory, 950 N. Cherry Avenue, Tucson, AZ 85719, USA 13]Steward Observatory, University of Arizona, Tucson, AZ 85721, USA 14]Department of Astrophysical Sciences, Princeton University, 4 Ivy Lane, Princeton, NJ 08544 15]Institute for Computational Science, University of Zurich, CH-8057 Zurich, Switzerland 16]Waseda Research Institute for Science and Engineering, Faculty of Science and Engineering, Waseda University, 3-4-1 Okubo, Shinjuku, Tokyo 169-8555, Japan 17]National Astronomical Observatory of Japan, 2-21-1, Osawa, Mitaka, Tokyo, Japan 18] Department of Astronomy & Astrophysics, The Pennsylvania State University, University Park, PA 16802, USA 19]Institute for Computational & Data Sciences, The Pennsylvania State University, University Park, PA 16802, USA 20]Institute for Gravitation and the Cosmos, The Pennsylvania State University, University Park, PA 16802, USA 21]Department of Astronomy, University of Wisconsin, 475 N. Charter Street, Madison, WI 53706, USA 22]Department of Physics and Astronomy, York University, 4700 Keele Street, Toronto, ON, M3J 1P3, Canada 23]Department of Physics and Astronomy, Tufts University, 574 Boston Ave., Medford, MA 02155, USA 24]Department of Physics and Astronomy, Texas A&M University, College Station, TX, 77843-4242 USA 25]George P. and Cynthia Woods Mitchell Institute for Fundamental Physics and Astronomy, Texas A&M University, College Station, TX, 77843-4242 USA 26]Department for Astrophysical and Planetary Science, University of Colorado, Boulder, CO 80309, USA 27]Steward Observatory, University of Arizona, 933 N Cherry Ave, Tucson, AZ 85721 USA 28]Departament d’Astronomia i Astrofìsica, Universitat de València, C. Dr. Moliner 50, E-46100 Burjassot, València, Spain 29]Department of Astronomy and Astrophysics, University of California, Santa Cruz, 1156 High Street, Santa Cruz, CA 95064 USA 30]Kavli Institute for Particle Astrophysics and Cosmology and Department of Physics, Stanford University, Stanford, CA 94305, USA
First spectroscopic observations of the galaxies that reionized the Universe
Low-mass galaxies in the early universe are believed to be the building blocks of present-day galaxies. These fledgling systems likely played a pivotal role in cosmic reionization, a major phase transition from neutral Hydrogen to ionized plasma around 600-800 Myr after the Big Bangdayal18 ; robertson22 . However, these galaxies have eluded comprehensive spectroscopic studies owing to their extreme faintness. Here we report the first spectroscopic analysis of 8 ultra-faint galaxies during the epoch of reionization with absolute magnitudes between to mag (down to 0.005 finkelstein15 ; bouwens15 ). The combination of ultra-deep NIRSpec (Near-Infrared Spectrograph) observations and the strong gravitational lensing boost of Abell 2744 allow us to derive the first spectroscopic constraints on the prevalence of faint galaxies and their ionizing properties during the Universe’s first billion years. We find that faint galaxies are prodigious producers of ionizing photons with log(/ Hz erg-1) =, a factor of 4 larger than canonical values. This means that the total rate of ionizing photons produced by galaxies exceeds that needed for reionization, even for modest values of escape fraction (=5%). These findings provide robust evidence that faint galaxies were the main drivers of cosmic reionization at .
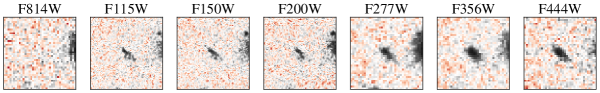
In this paper, we combine ultra-deep JWST imaging data with ancillary Hubble Space Telescope (HST) imaging of the gravitational lensing cluster Abell 2744 (A2744 hereafter) in order to photometrically select extremely faint galaxy candidates in the epoch of reionization (EoR). Besides the deep HST data in 7 broadband filterslotz17 ; steinhardt20 (F435W, F606W, F814W, F105W, F125W, F140W, F160W), we use deep multi-wavelength NIRCam (Near-Infrared Camera) imaging as part of the JWST UNCOVER survey bezanson22 ; weaver23 of A2744 (F115W, F150W, F200W, F277W, F356W, F410M, F444W). The selection combines several criteria to robustly constrain the photometric redshifts of the sources. First, we applied a color-color selection, based on a flux-dropout in the HST optical filters caused by rest-frame Lyman absorption by residual intergalactic Hydrogen gas. This selection consolidates most of the sources identified in the Hubble Frontier Fields (HFF) data atek18 ; bouwens22c at . Second, we performed spectral energy distribution (SED) fitting with the Eazy brammer22 software to estimate photometric redshifts, assuming a flat luminosity prior and the corr_sfhz library of stellar population templates. The allowed redshift range was set to . The sources have confirmed best-fit photometric solutions lying in the range. The final selection was then performed according to the intrinsic luminosity, combining high magnifications () and faint observed luminosities in F150W, resulting in intrinsic absolute UV magnitudes of order .
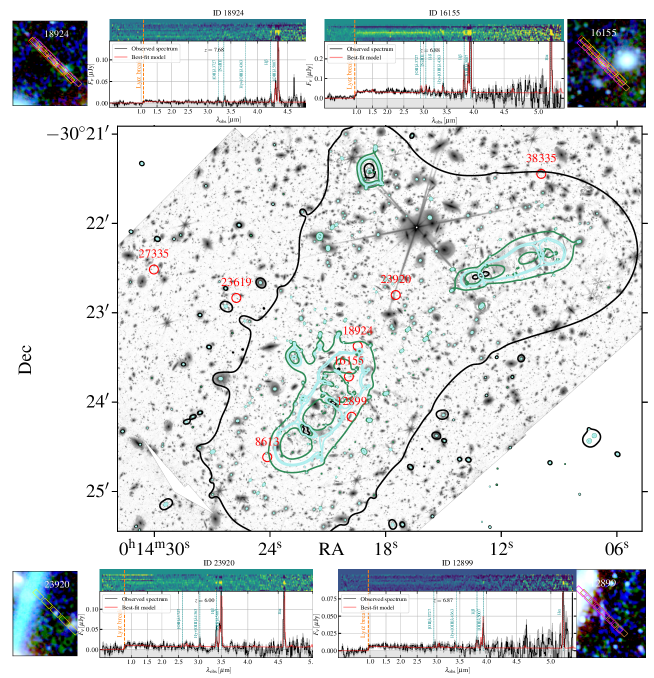
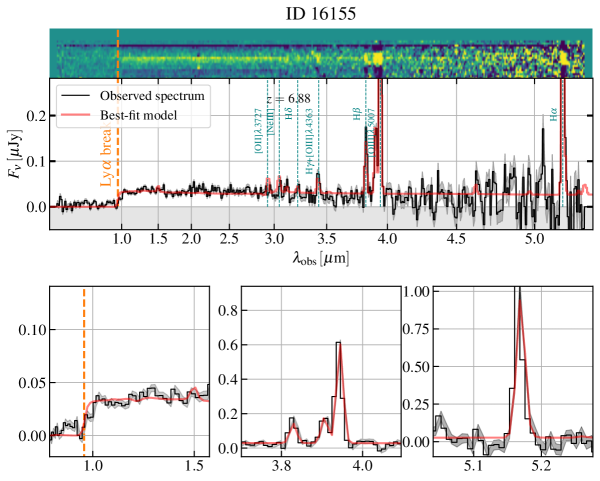
A crucial component of the present study is the use of strong gravitational lensing (SL) to amplify the intrinsically-faint flux of distant sources. An accurate estimate of the magnification factor is required to retrieve the intrinsic luminosity of sources. This step relies on a good knowledge of the total mass distribution in the galaxy cluster. Here we use the most recent SL model (v1.1) published for UNCOVERfurtak23b . The magnification factors for our galaxy sample range from to . The values are reported in Table 1, together with 1 uncertainties. The second part of the UNCOVER program consists of ultra-deep follow-up spectroscopy with the NIRSpec instrument jacobsen22 . We used the Multi-Shutter Assembly (MSA) to obtain multi-object spectroscopy in 7 pointings, totaling an exposure time ranging from 2.7 to 17.4 hours. Figure 1 shows the position of these sources in the A2744 field with the associated regions of high magnification and the configuration of the NIRSpec slits. The extracted NIRSpec prism spectra of the faintest sources, spanning the wavelength range m are shown in Figure 1 (see Section Methods for a detailed version). A clear Lyman-break at rest-frame wavelength Å is observed, together with multiple strong emission lines, including H+[Nii], [Oiii], H, H, and [Oii]. Simultaneous spectral fits to the continuum and the emission lines provide robust estimates of the spectroscopic redshifts of these sources, which lie between and (cf. Table 1). The spectral extraction and fitting procedure are discussed in the Methods section.
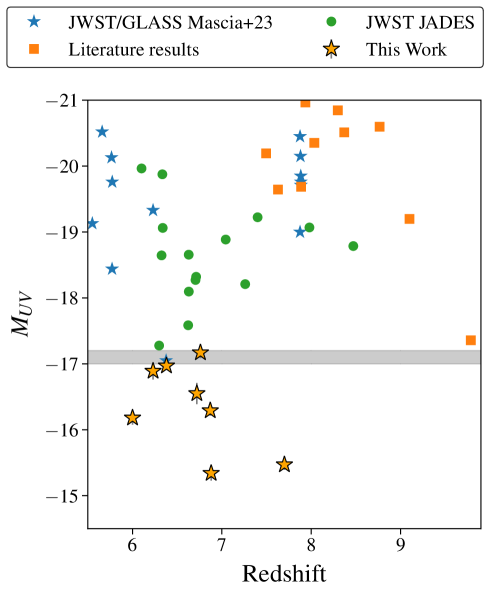
Thanks to the gravitational magnification, we robustly measure extremely faint line fluxes down to erg s-1 cm-2. We also derive intrinsic absolute magnitudes as faint as mag, which is 2 magnitudes fainter than the deepest JWST spectroscopic surveys bunker23b ; roberts-borsani23 ; mascia23 of the EoR so far (see Figure 2). Assuming a characteristic magnitude of mag at bouwens21 , these galaxies are as faint as 0.005. As such, and in light of the steep faint-end slope of the galaxy UV luminosity function at finkelstein15 ; ishigaki18 ; yue17 ; bhatawdekar19 , such galaxies likely provide the bulk of the radiation that reionized the Universe dayal20 ; robertson22 . We are therefore exploring a new realm of the parameter space that enables us to characterize the nature of the most abundant population of galaxies at and establish their role in cosmic reionization for the first time.
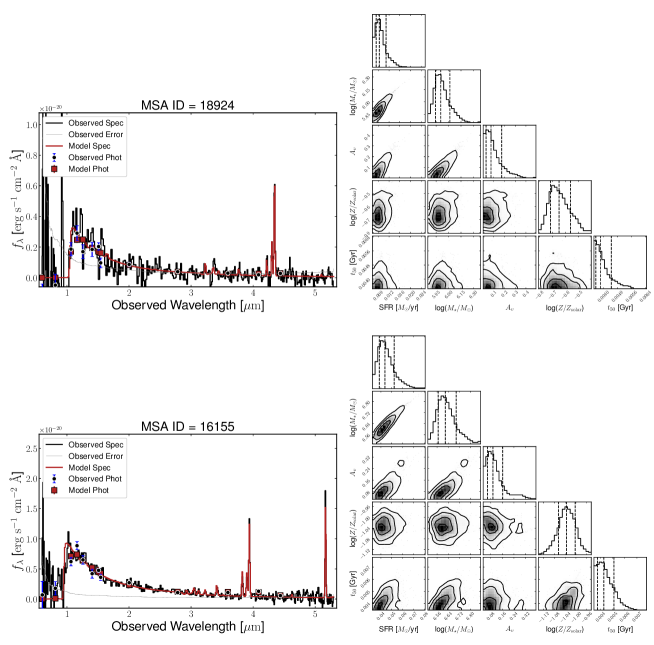
In order to infer the stellar populations of these systems, we perform joint spectro-photometric SED fits using the Bagpipes software package (Bayesian Analysis of Galaxies for Physical Inference and Parameter EStimation; Carnall2018 ; Carnall2019:VANDELS ). Accounting for the magnification, we derive extremely-low stellar masses between log(M⋆/M⊙) = and log(M⋆/M⊙) = . (cf. Figure 7). Our results also clearly show that these galaxies harbor very young stellar populations, with stellar ages mostly around a few million years (cf. Table 2). This picture is also supported by their blue UV continuum slopes, derived from our SED-fitting, in the range . Indeed, these values are generally indicative of a young massive stellar population and low dust attenuation. In addition to the star-formation rate (SFR) derived from SED-fitting, we also compute the SFR based on the H recombination line. The H indicator traces massive short-lived stars on a timescale of a few Myr, whereas the UV emission indicates an SFR averaged on a longer timescale up to a few 100 Myr. We report high values for the SFRHα/SFRUV ratio in the range [5-60], indicating recent bursts of star-formation in these young systems. This is in line with their specific star-formation rates (sSFR). Given their low stellar masses, these sources have log(sSFR / yr-1)=[], which means that they can double their stellar mass within 2 to 20 Myr. To further characterize these sources, we measure their sizes by fitting their morphology in the NIRCam F150W filter with a Sérsic profilesersic63 . The derived effective radii, corrected for magnification and taking the shear into account, vary between = 30 to 300 pc. Overall, these constraints show that these sources are small, in broad agreement with an extrapolation to lower masses of the size-mass relation derived at similar redshiftsholwerda15 , albeit with significant scatter. Such small sizes and high sSFRs also supports the scenario of stochastic star formation histories in these systems, owing to their small dynamical time and a low gravitational potential.
Contribution to cosmic reionization
Cosmic reionization corresponds to a dramatic transition between neutral hydrogen pervading the entire space and the complexity of the present-day Universe, marking a major phase change of baryons in our Universe. Galaxies have long been thought to be the best candidates for providing the required radiation to complete the reionization process by stark16 . Ultimately, the ability of galaxies to reionize the Universe will depend on their production of ionizing photon density per unit of time which is available to ionize the intergalactic neutral gas. This quantity can be summarized by the following relation: , where is the non-ionizing UV luminosity density at 1500 Å, is the ionizing photon production efficiency which represents the number of ionizing photons (Lyman continuum photons, LyC) per unit UV luminosity density, and is the fraction of this LyC radiation that escapes the galaxy to ionize the IGMrobertson22 . It is now well-established that faint galaxies () are the dominant source of UV radiation during the EoR atek15b ; finkelstein15 ; bouwens17b ; ishigaki18 ; robertson21 , although recent JWST observations are unveiling a number of faint active galactic nuclei (AGNs) at labbe23 ; matthee23b ; kocevski23 . The ionizing properties of these galaxies however are virtually unknown. For example, measurements of their ionizing efficiency have proven challenging even with the deepest JWST spectroscopic surveys, which are limited to galaxies brighter than fujimoto23 ; matthee23 . For the first time, we report direct spectroscopic measurements of the ionizing efficiency of the faint population of galaxies during the EoR.
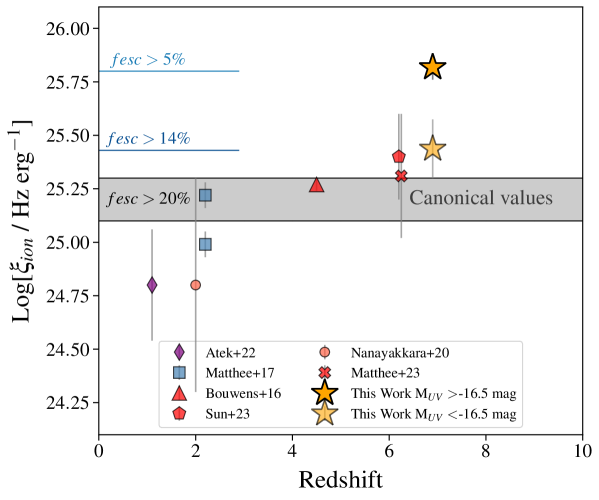
In Figure 3 we present our measurements based on the ratio of H recombination line, which is powered by reprocessed ionizing radiation, and the non-ionizing UV luminosity. The most striking result is the high value of log(/ Hz erg-1) = observed in faint () galaxies, compared to the commonly assumed canonical value of log(/ Hz erg-1 =25.2)robertson15 assumed in reionization models, or previous studies at the EoR. For example, the measured efficiency in a population of Ly emitters, which are thought to have larger ionization radiation than the average galaxy population, is around log(/ Hz erg-1) =25.4simmonds23 . Our measured value is consistent with the maximum values predicted by the BPASS eldridge17 ; stanway18 stellar population models for a dust-free galaxy with a constant star formation and a stellar age of less than 3 Myr and a 0.1 metallicity. Such a large ionizing efficiency in faint galaxies implies that modest values of are sufficient for galaxies to reionize the Universe by . Until now, models of reionization needed to assume large values of , typically around 20%, to accommodate the relatively low ionizing photon emissivity observed in high galaxies. However, direct measurements of analogs, reported typical or sample-averaged values below 10% pahl21 ; flury22a , albeit with a large dispersion and higher values have been observed in individual objects. As we can see in Figure 3, we show that a volume-averaged escape fraction as low as is sufficient for faint galaxies to maintain reionization.
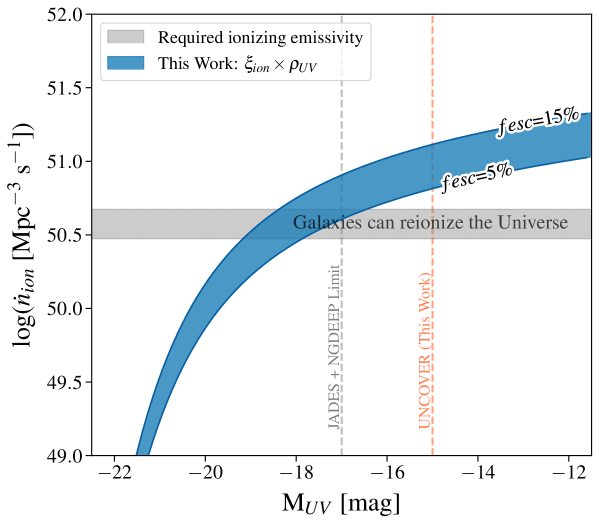
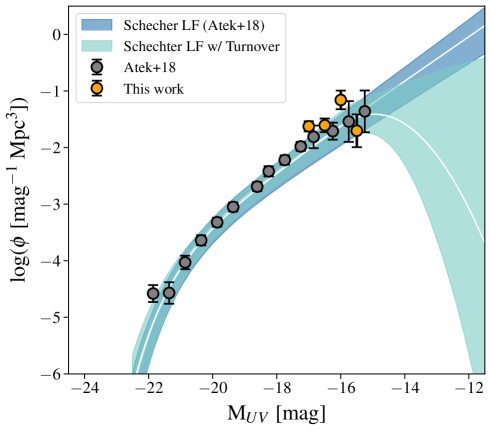
To paint a complete picture of cosmic reionization by star-forming galaxies, we compute the spectroscopic UV luminosity function based on the present sample. We put for the first time robust spectroscopic constraints on the prevalence of ultra-faint galaxies. Our measurements confirm the steep faint-end slope of the UV LF at , in agreement with the photometric UV LF derived from HFF observationsatek18 . By integrating this UV LF down to a faint-end limit of mag, we determine a UV luminosity density of log( / erg s-1 Mpc-3)=26.22. Now combining these two quantities we can infer the total ionizing emissivity of galaxies for different values of , accounting for the contribution of the ultra-faint population. The result is shown in Figure 4. Galaxies clearly produce enough ionizing photons to maintain reionization at madau99 ; gnedin22 , assuming on average as little as 5% of this radiation escape from the galaxies to heat the IGM. We can go a step further by indirectly estimating using the UV continuum slope we measured for these galaxies. Specifically, we follow an approach pioneered by recent studies of nearby galaxies that calibrated indirect indicators of to LyC emission flury22b . In particular, a strong correlation is observed between the observed slope and chisholm22 . Adopting the UV-slope (see Table 2) as a proxy for , we infer escape fractions within =[0.045, 0.16], well in the range of assumed values in Figure 4. Other physical properties, such as the high sSFRs, also point to LyC-leakage in these galaxies, since this parameter is also known to correlate with flury22b . Another indirect indicator of that has been explored in recent studies is the star formation surface density naidu22 ; flury22b . For these compact sources, we measure log(/ M⊙ yr-1kpc2) . These values are commonly observed in LyC leakers naidu17 ; vanzella18 and also predictive of high according to published best-fit relations of -naidu20 .
Overall, we were able to directly measure the total ionizing photon production of faint galaxies at . We indirectly estimated their escape fractions, which is the only possible way during the EoR due to the strong IGM absorption above inoue14 . Our results provide strong support to the scenario of reionization by star-forming galaxies.
In addition to the physical properties that may ease the escape of ionizing photons from these galaxies, some physical properties, such as the metallicity, can also indicate the ionizing properties of this population. We measured the gas-phase metallicity using the R3 = [Oiii]/H line ratio based on the most recent calibrations sanders23 . We find extremely low metallicities, ranging from 12+log(O/H)= 6.70 to 7.46, which corresponds to 1% to 6% of the solar metallicity. Such low metallicities are often suggestive of strong ionizing radiation from massive starsstanway19 . At the same time, these distant low-mass galaxies, considered as the building-blocks of present-day galaxies, are expected to be metal-poor, owing to their supposedly pristine gas conditions.
To summarize, these observations provide strong constraints on the most important parameters that determine whether galaxies can drive the cosmic reionization. Both the prevalence and the ionizing photon production are measured for these faint sources. Measurements of can be significantly affected by dust attenuationemami20 ; atek22 . This concern also applies to our estimate of stochastic star-formation through the SFRHα/SFRUV ratio. However, as indicated by the blue UV continuum slopes that we observe, we expect the dust content to be small in these galaxies. This assumption is also supported by the low Balmer decrement H/H, for which we measure an average value of . Therefore, dust attenuation should not affect significantly these quantities. We also note that we used indirect indicators, which come with a significant scatter, to estimate , because direct measurements of LyC at the epoch of reionization are impossible. The stochastic nature of star formation in these low-mass galaxies also makes the highly variable, since it mainly relies on stellar and supernovae feedback clearing the ISM for LyC escape trebitsch17 ; barrow20 . However, on average, hydrodynamical simulations predict higher in lower-mass galaxiesma20 ; yeh23 . Again, based on the ionizing photon production we estimated, modest values of around 5% are sufficient. Finally, our metallicity estimate relies on the calibration of strong lines diagnostics, which are prone to significant uncertainties at . We used the most recent constraints from JWST spectroscopic studies of to assess the extent of potential systematic effectsnakajima22 ; sanders23 . On average, these estimates lie with 1 to 2 intervals from each other.
The unprecedented NIR spectroscopic capabilities of JWST, coupled with the SL magnification of A2744, has allowed us to probe the details of the ultra-faint population of galaxies during the epoch of reionization. They are characterized by extremely low stellar masses and metallicities, young ages, and likely undergo bursts of star formation. Important efforts have been devoted in the last decades to determine the nature of the sources that reionized the Universe. While several studies have pointed to massive galaxies naidu20 or AGN madau15 ; mitra18 providing a significant contribution, we present here here compelling evidence supporting the scenario of faint galaxies as the main ionizing agents driving the bulk of cosmic reionization. These findings lay the groundwork for upcoming spectroscopic initiatives aimed at investigating this elusive population through cluster lensing to get deeper insights into the conditions of early galaxy formation.
Methods
Throughout the paper, we use AB magnitudes oke83 and a standard cosmology with H km s-1 Mpc-1, , and .
Observations
The UNCOVER dataset consists of both imaging and spectroscopic observations of the lensing cluster A2744. The imaging observations and data reduction are described in detail in the survey and catalog papers bezanson22 ; weaver23 . Here, we briefly summarize the imaging and photometric products used in the present paper. The NIRCamrieke23 images include short-wavelength (SW) broadband filters (F115W, F150W, F200W), long-wavelength (LW) broadbands (F277W, F356W, F444W), and one medium-band filter (F410M). Data were processed, and drizzled into 0.04 arcsec pix-1 mosaics using the Grism redshift and line analysis software for space-based spectroscopy (Grizli111https://github.com/gbrammer/grizli; v1.6.0.dev99)brammer19 .
In terms of ancillary data, the HFF program lotz17 has obtained deep optical and NIR observations of the core area of A2744 with the Advanced Camera for Surveys (435W, F606W, F814W), and Wide-Field Camera Three (F105W, F125W, F140W, F160W). A wider area around the cluster has also been covered by the BUFFALO program steinhardt20 in almost identical broadband filters (without F435W and F140W). All HST observations were drizzled to the same pixel scale and the same orientation as the NIRCam mosaics.
The second part of the UNCOVER program consists of ultra-deep follow-up spectroscopy with the NIRSpec instrument jacobsen22 . Data were obtained between July 31st and August 2nd 2023. Observations use the Prism mode and the Multi-Shutter Assembly (MSA) ferruit22 of NIRSpec to observe more than 650 targets. In order to optimize background subtraction, each target has been observed with a 3-slitlet nodding strategy. Observations were split into 7 pointings, with important overlap at the center, providing total on-target exposure times ranging from to . The spectral resolution is wavelength-dependent and varies between to over the full wavelength range . Data were reduced using the JWST/NIRSpec analysis software msaexp222https://github.com/gbrammer/msaexp version 0.6.10. The processing is based on level 2 MAST333https://archive.stsci.edu/missions-and-data/jwst products, using the CRDS context file jwst_1100.pmap. The software performs basic reduction steps, including flat-field, bias, 1/f noise and snowballs correction, wavelength and photometric calibrations of individual exposure frames heintz23 . The extraction of 1D spectra from individual exposures is operated on inverse-weighted stack of 2D spectrum in the dispersion direction, following an optimal extraction procedure horne86 . Then the software fits a Gaussian profile along the cross-dispersion direction to define the 1D extraction aperture. Finally, we compute the final deep 1D spectrum by inverse-variance stacking the individual spectra. In order to account for slit loss effects, we apply a wavelength- (broadband-) dependent correction factor to re-scale the 1D spectrum to the observed NIRCam aperture photometry.
Spectral fitting
In order to determine the spectroscopic redshift of the sources, we fit spectral templates using msaexp, which based on the SED fitting software EazyBrammer2008 . The code combine a set of templates to fit simultaneously the continuum, including the Lyman break caused by the IGM absorption, and the emission lines. For our analysis, we adopt the corr_sfhz_13 template library which include redshift-dependent SFHs, which are known to perform better than the default fsps_full library in recovering the true redshift weaver23 . We search for the best-fit solution over the redshift interval . The spectroscopic redshifts are reported in Table 1. Once the best-fit redshift is found, we refit the spectra, fixing the redshift to , with a set of spline functions to measure the continuum and Gaussians in order to measure the emission line fluxes. Examples of the best-fit model plotted over the observed spectrum are presented in Figure 1.
Strong lensing
We use version v1.1 of the UNCOVER lensing modelfurtak23b , which is publicly available in the latest UNCOVER data release DR-1444https://jwst-uncover.github.io/DR1.html##LensingMaps. The model is based on the parametric approach by Zitrin et al.zitrin15b which has been re-written to be fully analytic, i.e. not limited by a grid-resolutionpascale22 ; furtak23b . The UNCOVER lens model of A2744 was constructed on a wealth of ground- and space-based data, including deep HST and JWST imaging, and Multi Unit Spectroscopic Explorerbacon10 (MUSE) spectroscopic redshifts of both cluster members and multiple imagesmahler18 ; richard21 ; bergamini23 ; bergamini23b . It comprises 421 cluster member galaxies identified in the UNCOVER field-of-view and five smooth cluster-scale dark matter (DM) halos. The model is constrained with 141 multiple images belonging to 48 sources and achieves an image reproduction RMS of in the lens plane. Thanks to the massive cluster substructures identified with UNCOVERfurtak23b , the critical area of the cluster is larger than inferred from HFF data and the total source plane area with of for a source at redshift .
Physical properties
Bagpipes
We infer global physical properties from SED-fitting using the Bagpipes software package. Before fitting, all models are convolved with the NIRSpec/Prism instrumental resolution curve provided by the Space Telescope Science Institute (jwst_nirspec_Prism_disp.fits), assuming that the flight performance is 1.3 times better than stated, and is consistent with an earlier work where a factor 1/0.7 is introduced for modeling galaxies curtis-lake23 . Additionally, we fit with a wavelength-independent velocity smoothing ( log) as a nuisance parameter. We adapt the following model grid: bc03 stellar population models, the MILES spectral library Sanchez-Blazquez2006 ; Falcon-Barroso2011 , CLOUDY nebular emission models Ferland:2017 , and Charlot2000 dust model (with and as free parameters). The stellar and gas phase metallicity are tied to the same value, and also included as a free parameter in the range . The ionization parameter is also left free in the range of . We parameterize the star formation history as a delayed- model (SFR, which can flexibly produce rising or falling star formation histories for this range of at the redshift of the sample), with the age (log(age)) and (0.01<5) as free parameters. This parameterization has been shown to reliably recover star formation rates and the mass formed in recent star formation, but is potentially susceptible to under-estimating stellar masses due to outshining by the youngest stellar population Papovich2023 . Redshift is restricted to vary in a narrow range around the best-fitting spectroscopic redshifts (0.1). We fit for a polynomial calibration vector of order 2 after applying a wavelength-independent calibration to scale the normalization of the spectrum to the photometry. The Bagpipes white noise model is used to allow for underestimated errors up to a factor of 10. A signal-to-noise ceiling of 20 is imposed on both our photometry and spectroscopy to account for systematic issues with the flux calibration. Sampling is performed via PyMultinest Buchner:2014 ; Feroz:2019 , with the default Bagpipes convergence criteria. The most important physical properties derived from this procedure are presented in Table 2, and example fits and posteriors are presented in Figure 7.
BEAGLE
We run an additional spectral fit with the BayEsian Analysis of GaLaxy sEdschevallard16 tool (BEAGLE) on the magnification-corrected spectra. BEAGLE uses the latest version of the Bruzual & Charlot stellar population synthesis modelsBruzual_Charlot_2003 and nebular emission templates computed with CLOUDYferland13 ; gutkin16 . We then assume a Chabrierchabrier03 initial stellar mass function (IMF), an SMC dust attenuation lawpei92 , the latest Inoue et al. analytic IGM attenuation modelsinoue14 , and a delayed exponential SFH as for our Bagpipes fit. All other parameters are left free to vary with uniform or log-uniform priors: stellar mass , current (10 Myr) SFR , maximum stellar age , star-formation e-folding time , stellar metallicity , effective V-band dust attenuation optical depth , effective galaxy-wide ionization parameter , gas-phase metallicity , and dust-to-metal mass ratio .
The posterior distribution of the physical properties that we derive with BEAGLE agree well with the Bagpipes results presented in Table 2.
Contribution of galaxies to reionization
Using the present spectroscopically-confirmed sample of ultra-faint galaxies, we have the opportunity to put robust constraints on the UV luminosity function. The original NIRSpec sample has been selected in HFF studiesatek18 ; bouwens22c , based on HST observation, in addition to three sources selected from the UNCOVER imaging data based on their photometric redshifts. First, we compute an initial UV LF based on the present sample binned in four magnitude bins and a survey volume, which depends on the original selection of the source. For the five HFF sources, we use the source plane effective volumeatek18 as a function of the magnitude bin. We rebin the original HFF sample to match the new magnitude bins. A scaling factor is then applied to the LF points to match the HFF completeness-corrected counts. Finally, we apply a correction factor based on the success rate of the spectroscopic confirmation. For the three sources outside the HFF area, we recompute the source plane effective survey volume using the new lensing model and assuming a similar completeness function across the field. We perform the same exercise of rescaling the number counts in each magnitude bin. The final UV LF is calculated by combining all galaxies with their associated corrected effective volume. Regarding uncertainties, we use the HFF volume uncertainties for the HFF sources, and the updated volume uncertainties for the new sample, respectively. We include Poisson errors and cosmic variancetrenti08 . Figure 5 shows that our measurements (orange points) are in good agreement with the faint-end of the photometric UV LF derived from HFF observationsatek18 (gray points).
In our efforts to determine whether galaxies can reionize the Universe, we proceed to calculate another crucial parameter: the production efficiency of ionizing radiation . This quantity is defined as the ratio between the LyC photon production rate in the units of s-1, and the observed non-ionizing UV luminosity density estimated at 1500 Å in units of erg s-1 Hz-1:
| (1) |
where can be estimated from the H Balmer lineleitherer95 assuming a case B recombination theoryosterbrock89 :
| (2) |
where is in units of erg s-1, and is the escape fraction of Lyman continuum radiation. In this calculation, we assume that =0, meaning that all Lyc photons are reprocessed into the Balmer lines. The derived value can be considered as a lower limit, since higher will lead to a higher . The H emission line is not detected in source ID 18924. In this case, we use the H luminosity and a case B conversion factor.
Finally, we derive constraint on the LyC escape fraction using indirect indicators calibrated in a large sample of nearby LyC emitting galaxies. Since the LyC emission is impossible to measure at the EoR, large efforts have been devoted in the last two decades to determine the escape fraction in galaxies, and more importantly establish robust indirect methods, which can be transferable to EoR sources. This was precisely the motivation of the recent Low-redshift Lyman continuum survey (LzLCS)flury22a . Among the different physical properties of LyC leakers, the observed UV continuum slope has been identified as a promising proxy of chisholm22 . Here, we use the UV slopes derived from the best-fit models of Bagpipes and the LzLCS relation to infer . The derived values for the present sample range from 4.5% to 15.6%. Despite large uncertainties (around 50%), only two sources have values that can reach below 4% at 1-sigma.
Now with all three properties in hand, we can assess the contribution of faint galaxies to cosmic reionization. We compute the ionizing photon emissivity of galaxies, which is the product of the total UV luminosity density , derived from integrating the UV LF, and the production efficiency . The result will depend on the faint integration limit, which is set the faintest bin of the spectroscopic LF at =-15 mag. By multiplying this quantity by the escape fraction , we obtain the total ionizing photon rate density that is available to ionize the IGM. Down to =-15 mag, modest values around 5% are sufficient to maintain reionization.
We measure the gas-phase oxygen abundance using the strong optical lines diagnostic. Specifically, we use the R3=log([Oiii]5007 /H) and adopt the most recent empirical calibrations at high-redshiftnakajima22 ; nakajima23 ; sanders21 . All of our sources have robust detections of [Oiii]5007 and H. Furthermore, we also separate our sample into two bins according to the EW(H) at EW(H)=100Å to account for ionization parameter variationsnakajima22 . Also, for a given value of R3, the calibration defines two metallicity solutions. Although these sources have likely low metallicities, we use the O32=log([Oiii]4949,5007/[Oii]3727,3729) ratio to distinguish between the two branches. For most of the sources, the [Oii] is not detected, which provides a lower-limit on O32, which is found to vary in the range O32=[0.7-1.4]. Using the O32 metallicity indicator, the resulting values are all compatible with the low-metallicity branch solution. The metallicity measurements are reported in Table 2.
Size Measurements
Measurements of the half-light radii for all eight galaxies are performed using the pysersic Pasha2023 package, focusing on the F150W image. For each source, we assume a single Sersic profile and mask all nearby sources in the photometric catalogweaver23 . The priors for the half-light radius, Sersic index, axis ratio and position angle are all uniform and varied from pixels, , and respectively. Priors central position and flux are represented as Gaussian distributions with the location and width based on the photometric catalogweaver23 . A flat sky background is fit simultaneously. The Posterior distribution is explored using the No-U Turn (NUTS) Hoffman2014 sampler implemented in numpyro Phan2019 with 2 chains for 1,000 warm-up and sampling steps each.
Several of our objects are significantly distorted by the gravitational lensing which means that we need to take the shear into account when deriving the half-light radius. In order to do that, we use our SL model to derive the tangential and radial magnifications, defined as , from the deflection field at each source’s position and redshift. Since our objects are sheared along the tangential direction, we use the tangential component of the magnification to correct the half-light radii.
| Source | RA | Dec | Exptime | ||||
|---|---|---|---|---|---|---|---|
| J2000 | J2000 | hours | AB | ||||
| 18924 | 3.581044 | -30.389561 | 17.4 | 7.88 | 7.70 | ||
| 16155 | 3.582953 | -30.395232 | 17.4 | 6.70 | 6.87 | ||
| 23920 | 3.572830 | -30.380026 | 3.7 | 6.35 | 6.00 | ||
| 12899 | 3.582353 | -30.402732 | 10.2 | 6.64 | 6.88 | ||
| 8613 | 3.600602 | -30.410271 | 2.7 | 6.53 | 6.38 | ||
| 23619 | 3.607272 | -30.380578 | 7.5 | 6.68 | 6.72 | ||
| 38335 | 3.541383 | -30.357435 | 2.7 | 6.41 | 6.23 | ||
| 27335 | 3.625081 | -30.375261 | 7.5 | 6.88 | 6.76 |
| Source | log(M⋆/M⊙) | SFRHα | SFRUV | 12+Log(O/H) | ||
|---|---|---|---|---|---|---|
| M⊙ yr-1 | M⊙ yr-1 | Myr | ||||
| 18924 | ||||||
| 16155 | ||||||
| 23920 | ||||||
| 12899 | ||||||
| 8613 | ||||||
| 23619 | ||||||
| 38335 | ||||||
| 27335 |
Data Availability The NIRCam and HST imaging data are available on the UNCOVER webpage: https://jwst-uncover.github.io/. The NIRSpec spectroscopic data are publicly available through the Mikulski Archive for Space Telescopes555https://archive.stsci.edu/ (MAST), under program ID 2561.
Code Availability Astropy astropy13 ; astropy18 , Bagpipes Carnall2018 ; Carnall2019:VANDELS , BEAGLE chevallard16 , EAzY Brammer2008 , Matplotlib plt07 , msaexp (brammer22msa, , v0.6.10), NumPy numpy20 , NUTS nuts11 ; nuts19 , PyMultinest Buchner:2014 ; Feroz:2019 , pysersic Pasha2023 , SciPy scipy20
Acknowledgments H.A. and IC acknowledge support from CNES, focused on the JWST mission, and the Programme National Cosmology and Galaxies (PNCG) of CNRS/INSU with INP and IN2P3, co-funded by CEA and CNES. H.A thanks the Cosmic Dawn Center (DAWN) for their support. DAWN is funded by the Danish National Research Foundation under grant No. 140. A.Z. acknowledges support by Grant No. 2020750 from the United States-Israel Binational Science Foundation (BSF) and Grant No. 2109066 from the United States National Science Foundation (NSF), and by the Ministry of Science & Technology, Israel. P.D. acknowledges support from the NWO grant 016.VIDI.189.162 (“ODIN") and from the European Commission’s and University of Groningen’s CO-FUND Rosalind Franklin program. The work of C.C.W. is supported by NOIRLab, which is managed by the Association of Universities for Research in Astronomy (AURA) under a cooperative agreement with the National Science Foundation.
Author Contributions H.A. led the analysis and article writing. L.J.F. and A.Z. constructed the lens model and extracted lensing related quantities. S.F produced figures. I.L. and R.B. are the PIs of the UNCOVER program. R.B. and I.L. designed the observations and reduced the spectra. J.W. and B.W. produced the catalogs used for target selection. P.D. provided simulations to interpret the observational results obtained. V.K. produced line measurements. I.C. estimated survey volumes. D.J.S. ran SED fitting analysis. T.B.M. measured the galaxy sizes. All authors contributed to the manuscript and aided the analysis and interpretation.
Competing Interests The authors declare that they have no competing financial interests.
References
- (1) Dayal, P. & Ferrara, A. Early galaxy formation and its large-scale effects. Phys. Rep. 780, 1–64 (2018).
- (2) Robertson, B. E. et al. Discovery and properties of the earliest galaxies with confirmed distances. arXiv e-prints arXiv:2212.04480 (2022).
- (3) Finkelstein, S. L. et al. The Evolution of the Galaxy Rest-frame Ultraviolet Luminosity Function over the First Two Billion Years. ApJ 810, 71 (2015).
- (4) Bouwens, R. J. et al. UV Luminosity Functions at Redshifts z4 to z10: 10,000 Galaxies from HST Legacy Fields. ApJ 803, 34 (2015).
- (5) Lotz, J. M. et al. The Frontier Fields: Survey Design and Initial Results. ApJ 837, 97 (2017).
- (6) Steinhardt, C. L. et al. The BUFFALO HST Survey. ApJS 247, 64 (2020).
- (7) Bezanson, R. et al. The JWST UNCOVER Treasury survey: Ultradeep NIRSpec and NIRCam ObserVations before the Epoch of Reionization. arXiv e-prints arXiv:2212.04026 (2022).
- (8) Weaver, J. R. et al. The UNCOVER Survey: A first-look HST+JWST catalog of 50,000 galaxies near Abell 2744 and beyond. arXiv e-prints arXiv:2301.02671 (2023).
- (9) Atek, H., Richard, J., Kneib, J.-P. & Schaerer, D. The extreme faint end of the UV luminosity function at z=6 through gravitational telescopes: a comprehensive assessment of strong lensing uncertainties. MNRAS 479, 5184–5195 (2018).
- (10) Bouwens, R. J., Illingworth, G., Ellis, R. S., Oesch, P. & Stefanon, M. z 2-9 Galaxies Magnified by the Hubble Frontier Field Clusters. II. Luminosity Functions and Constraints on a Faint-end Turnover. ApJ 940, 55 (2022).
- (11) Brammer, G., Strait, V., Matharu, J. & Momcheva, I. grizli. Zenodo (2022).
- (12) Furtak, L. J. et al. UNCOVERing the extended strong lensing structures of Abell 2744 with the deepest JWST imaging. MNRAS 523, 4568–4582 (2023).
- (13) Jakobsen, P. et al. The Near-Infrared Spectrograph (NIRSpec) on the James Webb Space Telescope. I. Overview of the instrument and its capabilities. A&A 661, A80 (2022).
- (14) Bunker, A. J. et al. JADES NIRSpec Initial Data Release for the Hubble Ultra Deep Field: Redshifts and Line Fluxes of Distant Galaxies from the Deepest JWST Cycle 1 NIRSpec Multi-Object Spectroscopy. arXiv e-prints arXiv:2306.02467 (2023).
- (15) Roberts-Borsani, G. et al. The nature of an ultra-faint galaxy in the cosmic dark ages seen with JWST. Nature 618, 480–483 (2023).
- (16) Mascia, S. et al. Closing in on the sources of cosmic reionization: First results from the GLASS-JWST program. A&A 672, A155 (2023).
- (17) Bouwens, R. J. et al. New Determinations of the UV Luminosity Functions from z 9 to 2 Show a Remarkable Consistency with Halo Growth and a Constant Star Formation Efficiency. AJ 162, 47 (2021).
- (18) Ishigaki, M. et al. Full-data Results of Hubble Frontier Fields: UV Luminosity Functions at z 6-10 and a Consistent Picture of Cosmic Reionization. ApJ 854, 73 (2018).
- (19) Yue, B. et al. On the faint-end of the galaxy luminosity function in the Epoch of Reionization: updated constraints from the HST Frontier Fields. ArXiv e-prints (2017).
- (20) Bhatawdekar, R., Conselice, C. J., Margalef-Bentabol, B. & Duncan, K. Evolution of the galaxy stellar mass functions and UV luminosity functions at z = 6-9 in the Hubble Frontier Fields. MNRAS 486, 3805–3830 (2019).
- (21) Dayal, P. et al. Reionization with galaxies and active galactic nuclei. MNRAS 495, 3065–3078 (2020).
- (22) Finkelstein, S. L. et al. A galaxy rapidly forming stars 700 million years after the Big Bang at redshift 7.51. Nature 502, 524–527 (2013).
- (23) Oesch, P. A. et al. A Spectroscopic Redshift Measurement for a Luminous Lyman Break Galaxy at z = 7.730 Using Keck/MOSFIRE. ApJ 804, L30 (2015).
- (24) Watson, D. et al. A dusty, normal galaxy in the epoch of reionization. Nature 519, 327–330 (2015).
- (25) Zitrin, A. et al. Lyman Emission from a Luminous z = 8.68 Galaxy: Implications for Galaxies as Tracers of Cosmic Reionization. ApJ 810, L12 (2015).
- (26) Hoag, A. et al. Spectroscopic confirmation of an ultra-faint galaxy at the epoch of reionization. Nature Astronomy 1, 0091 (2017).
- (27) Laporte, N. et al. Dust in the Reionization Era: ALMA Observations of a z = 8.38 Gravitationally Lensed Galaxy. ApJ 837, L21 (2017).
- (28) Laporte, N. et al. Probing cosmic dawn: Ages and star formation histories of candidate z 9 galaxies. MNRAS 505, 3336–3346 (2021).
- (29) Hashimoto, T. et al. The onset of star formation 250 million years after the Big Bang. Nature 557, 392–395 (2018).
- (30) Tamura, Y. et al. Detection of the Far-infrared [O III] and Dust Emission in a Galaxy at Redshift 8.312: Early Metal Enrichment in the Heart of the Reionization Era. ApJ 874, 27 (2019).
- (31) Topping, M. W. et al. The Detection of Ionized Carbon Emission at z 8. ApJ 917, L36 (2021).
- (32) Roberts-Borsani, G. et al. Early Results from GLASS-JWST. I: Confirmation of Lensed z 7 Lyman-break Galaxies behind the Abell 2744 Cluster with NIRISS. ApJ 938, L13 (2022).
- (33) Carnall, A. C., McLure, R. J., Dunlop, J. S. & Davé, R. Inferring the star formation histories of massive quiescent galaxies with BAGPIPES: evidence for multiple quenching mechanisms. MNRAS 480, 4379–4401 (2018).
- (34) Carnall, A. C. et al. The VANDELS survey: the star-formation histories of massive quiescent galaxies at 1.0 < z < 1.3. MNRAS 490, 417–439 (2019).
- (35) Sérsic, J. L. Influence of the atmospheric and instrumental dispersion on the brightness distribution in a galaxy. Boletin de la Asociacion Argentina de Astronomia La Plata Argentina 6, 41–43 (1963).
- (36) Holwerda, B. W. et al. The Sizes of Candidate z9-10 Galaxies: Confirmation of the Bright CANDELS Sample and Relation with Luminosity and Mass. ApJ 808, 6 (2015).
- (37) Stark, D. P. Galaxies in the First Billion Years After the Big Bang. ARA&A 54, 761–803 (2016).
- (38) Atek, H. et al. Are Ultra-faint Galaxies at z = 6-8 Responsible for Cosmic Reionization? Combined Constraints from the Hubble Frontier Fields Clusters and Parallels. ApJ 814, 69 (2015).
- (39) Bouwens, R. J., Oesch, P. A., Illingworth, G. D., Ellis, R. S. & Stefanon, M. The z=6 Luminosity Function Fainter than -15 mag from the Hubble Frontier Fields: The Impact of Magnification Uncertainties. ApJ 843, 129 (2017).
- (40) Robertson, B. E. Galaxy Formation and Reionization: Key Unknowns and Expected Breakthroughs by the James Webb Space Telescope. arXiv e-prints arXiv:2110.13160 (2021).
- (41) Labbe, I. et al. A population of red candidate massive galaxies ~600 Myr after the Big Bang. arXiv e-prints arXiv:2207.12446 (2022).
- (42) Matthee, J. et al. Little Red Dots: an abundant population of faint AGN at revealed by the EIGER and FRESCO JWST surveys. arXiv e-prints arXiv:2306.05448 (2023).
- (43) Kocevski, D. D. et al. Hidden Little Monsters: Spectroscopic Identification of Low-Mass, Broad-Line AGN at with CEERS. arXiv e-prints arXiv:2302.00012 (2023).
- (44) Fujimoto, S. et al. CEERS Spectroscopic Confirmation of NIRCam-selected z 8 Galaxy Candidates with JWST/NIRSpec: Initial Characterization of Their Properties. ApJ 949, L25 (2023).
- (45) Matthee, J. et al. EIGER. II. First Spectroscopic Characterization of the Young Stars and Ionized Gas Associated with Strong H and [O III] Line Emission in Galaxies at z = 5-7 with JWST. ApJ 950, 67 (2023).
- (46) Robertson, B. E., Ellis, R. S., Furlanetto, S. R. & Dunlop, J. S. Cosmic Reionization and Early Star-forming Galaxies: A Joint Analysis of New Constraints from Planck and the Hubble Space Telescope. ApJ 802, L19 (2015).
- (47) Simmonds, C. et al. The ionizing photon production efficiency at z 6 for Lyman-alpha emitters using JEMS and MUSE. MNRAS 523, 5468–5486 (2023).
- (48) Eldridge, J. J. et al. Binary Population and Spectral Synthesis Version 2.1: Construction, Observational Verification, and New Results. PASA 34, e058 (2017).
- (49) Stanway, E. R. & Eldridge, J. J. Re-evaluating old stellar populations. MNRAS 479, 75–93 (2018).
- (50) Pahl, A. J., Shapley, A., Steidel, C. C., Chen, Y. & Reddy, N. A. An uncontaminated measurement of the escaping Lyman continuum at z 3. MNRAS 505, 2447–2467 (2021).
- (51) Flury, S. R. et al. The Low-Redshift Lyman Continuum Survey I: New, Diverse Local Lyman-Continuum Emitters. arXiv e-prints arXiv:2201.11716 (2022).
- (52) Atek, H. et al. The star formation burstiness and ionizing efficiency of low-mass galaxies. MNRAS 511, 4464–4479 (2022).
- (53) Bouwens, R. J. et al. The Lyman-Continuum Photon Production Efficiency ion of z 4-5 Galaxies from IRAC-based H Measurements: Implications for the Escape Fraction and Cosmic Reionization. ApJ 831, 176 (2016).
- (54) Matthee, J. et al. The production and escape of Lyman-Continuum radiation from star-forming galaxies at z 2 and their redshift evolution. MNRAS 465, 3637–3655 (2017).
- (55) Nanayakkara, T. et al. Reconstructing the Observed Ionizing Photon Production Efficiency at z 2 Using Stellar Population Models. ApJ 889, 180 (2020).
- (56) Sun, F. et al. First Sample of H+[O III]5007 Line Emitters at z > 6 Through JWST/NIRCam Slitless Spectroscopy: Physical Properties and Line-luminosity Functions. ApJ 953, 53 (2023).
- (57) Madau, P., Haardt, F. & Rees, M. J. Radiative Transfer in a Clumpy Universe. III. The Nature of Cosmological Ionizing Sources. ApJ 514, 648–659 (1999).
- (58) Gnedin, N. Y. & Madau, P. Modeling cosmic reionization. Living Reviews in Computational Astrophysics 8, 3 (2022).
- (59) Flury, S. R. et al. The Low-redshift Lyman Continuum Survey. II. New Insights into LyC Diagnostics. ApJ 930, 126 (2022).
- (60) Chisholm, J. et al. The far-ultraviolet continuum slope as a Lyman Continuum escape estimator at high redshift. MNRAS 517, 5104–5120 (2022).
- (61) Naidu, R. P. et al. Two Remarkably Luminous Galaxy Candidates at Revealed by JWST. arXiv e-prints arXiv:2207.09434 (2022).
- (62) Naidu, R. P. et al. The HDUV Survey: Six Lyman Continuum Emitter Candidates at z 2 Revealed by HST UV Imaging. ApJ 847, 12 (2017).
- (63) Vanzella, E. et al. Direct Lyman continuum and Ly escape observed at redshift 4. MNRAS 476, L15–L19 (2018).
- (64) Naidu, R. P. et al. Rapid Reionization by the Oligarchs: The Case for Massive, UV-bright, Star-forming Galaxies with High Escape Fractions. ApJ 892, 109 (2020).
- (65) Inoue, A. K., Shimizu, I., Iwata, I. & Tanaka, M. An updated analytic model for attenuation by the intergalactic medium. MNRAS 442, 1805–1820 (2014).
- (66) Sanders, R. L., Shapley, A. E., Topping, M. W., Reddy, N. A. & Brammer, G. B. Direct T_e-based Metallicities of z=2-9 Galaxies with JWST/NIRSpec: Empirical Metallicity Calibrations Applicable from Reionization to Cosmic Noon. arXiv e-prints arXiv:2303.08149 (2023).
- (67) Stanway, E. R. & Eldridge, J. J. Initial mass function variations cannot explain the ionizing spectrum of low metallicity starbursts. A&A 621, A105 (2019).
- (68) Emami, N. et al. The Ionizing Photon Production Efficiency (ion) of Lensed Dwarf Galaxies at z 2. ApJ 895, 116 (2020).
- (69) Trebitsch, M., Blaizot, J., Rosdahl, J., Devriendt, J. & Slyz, A. Fluctuating feedback-regulated escape fraction of ionizing radiation in low-mass, high-redshift galaxies. MNRAS 470, 224–239 (2017).
- (70) Barrow, K. S. S. et al. The Lyman Continuum Escape Survey: Connecting Time-dependent [O III] and [O II] Line Emission with Lyman Continuum Escape Fraction in Simulations of Galaxy Formation. ApJ 902, L39 (2020).
- (71) Ma, X. et al. No missing photons for reionization: moderate ionizing photon escape fractions from the FIRE-2 simulations. MNRAS 498, 2001–2017 (2020).
- (72) Yeh, J. Y. C. et al. The THESAN project: ionizing escape fractions of reionization-era galaxies. MNRAS 520, 2757–2780 (2023).
- (73) Nakajima, K. et al. EMPRESS. V. Metallicity Diagnostics of Galaxies over 12+log(O/H)=6.9-8.9 Established by a Local Galaxy Census: Preparing for JWST Spectroscopy. ApJS 262, 3 (2022).
- (74) Madau, P. & Haardt, F. Cosmic Reionization after Planck: Could Quasars Do It All? ApJ 813, L8 (2015).
- (75) Mitra, S., Choudhury, T. R. & Ferrara, A. Cosmic reionization after Planck II: contribution from quasars. MNRAS 473, 1416–1425 (2018).
- (76) Oke, J. B. & Gunn, J. E. Secondary standard stars for absolute spectrophotometry. ApJ 266, 713–717 (1983).
- (77) Rieke, M. J. et al. Performance of NIRCam on JWST in Flight. PASP 135, 028001 (2023).
- (78) Brammer, G. Grizli: Grism redshift and line analysis software. Astrophysics Source Code Library, record ascl:1905.001 (2019). 1905.001.
- (79) Ferruit, P. et al. The Near-Infrared Spectrograph (NIRSpec) on the James Webb Space Telescope. II. Multi-object spectroscopy (MOS). A&A 661, A81 (2022).
- (80) Heintz, K. E. et al. Extreme damped Lyman- absorption in young star-forming galaxies at . arXiv e-prints arXiv:2306.00647 (2023).
- (81) Horne, K. An optimal extraction algorithm for CCD spectroscopy. PASP 98, 609–617 (1986).
- (82) Brammer, G. B., van Dokkum, P. G. & Coppi, P. EAZY: A Fast, Public Photometric Redshift Code. ApJ 686, 1503–1513 (2008).
- (83) Zitrin, A. et al. Hubble Space Telescope Combined Strong and Weak Lensing Analysis of the CLASH Sample: Mass and Magnification Models and Systematic Uncertainties. ApJ 801, 44 (2015).
- (84) Pascale, M. et al. Unscrambling the Lensed Galaxies in JWST Images behind SMACS 0723. ApJ 938, L6 (2022).
- (85) Bacon, R. et al. The MUSE second-generation VLT instrument. In McLean, I. S., Ramsay, S. K. & Takami, H. (eds.) Ground-based and Airborne Instrumentation for Astronomy III, vol. 7735 of Society of Photo-Optical Instrumentation Engineers (SPIE) Conference Series, 773508 (2010).
- (86) Mahler, G. et al. Strong-lensing analysis of A2744 with MUSE and Hubble Frontier Fields images. MNRAS 473, 663–692 (2018).
- (87) Richard, J. et al. An atlas of MUSE observations towards twelve massive lensing clusters. A&A 646, A83 (2021).
- (88) Bergamini, P. et al. New high-precision strong lensing modeling of Abell 2744. Preparing for JWST observations. A&A 670, A60 (2023).
- (89) Bergamini, P. et al. The GLASS-JWST Early Release Science Program. III. Strong-lensing Model of Abell 2744 and Its Infalling Regions. ApJ 952, 84 (2023).
- (90) Curtis-Lake, E. et al. Spectroscopy of four metal-poor galaxies beyond redshift ten. arXiv e-prints arXiv:2212.04568 (2022).
- (91) Bruzual, G. & Charlot, S. Stellar population synthesis at the resolution of 2003. MNRAS 344, 1000–1028 (2003).
- (92) Sánchez-Blázquez, P. et al. Medium-resolution Isaac Newton Telescope library of empirical spectra. MNRAS 371, 703–718 (2006).
- (93) Falcón-Barroso, J. et al. An updated MILES stellar library and stellar population models. A&A 532, A95 (2011).
- (94) Ferland, G. J. et al. The 2017 Release Cloudy. Rev. Mexicana Astron. Astrofis. 53, 385–438 (2017).
- (95) Charlot, S. & Fall, S. M. A Simple Model for the Absorption of Starlight by Dust in Galaxies. ApJ 539, 718–731 (2000).
- (96) Papovich, C. et al. CEERS Key Paper. V. Galaxies at 4 < z < 9 Are Bluer than They Appear-Characterizing Galaxy Stellar Populations from Rest-frame 1 m Imaging. ApJ 949, L18 (2023).
- (97) Buchner, J. et al. X-ray spectral modelling of the AGN obscuring region in the CDFS: Bayesian model selection and catalogue. A&A 564, A125 (2014).
- (98) Feroz, F., Hobson, M. P., Cameron, E. & Pettitt, A. N. Importance Nested Sampling and the MultiNest Algorithm. The Open Journal of Astrophysics 2, 10 (2019).
- (99) Chevallard, J. & Charlot, S. Modelling and interpreting spectral energy distributions of galaxies with BEAGLE. MNRAS 462, 1415–1443 (2016).
- (100) Bruzual, G. & Charlot, S. Stellar population synthesis at the resolution of 2003. Monthly Notices of the Royal Astronomical Society 344, 1000–1028 (2003). URL http://dx.doi.org/10.1046/j.1365-8711.2003.06897.x.
- (101) Ferland, G. J. et al. The 2013 Release of Cloudy. Rev. Mexicana Astron. Astrofis. 49, 137–163 (2013).
- (102) Gutkin, J., Charlot, S. & Bruzual, G. Modelling the nebular emission from primeval to present-day star-forming galaxies. MNRAS 462, 1757–1774 (2016).
- (103) Chabrier, G. Galactic Stellar and Substellar Initial Mass Function. PASP 115, 763–795 (2003).
- (104) Pei, Y. C. Interstellar Dust from the Milky Way to the Magellanic Clouds. ApJ 395, 130 (1992).
- (105) Trenti, M. & Stiavelli, M. Cosmic Variance and Its Effect on the Luminosity Function Determination in Deep High-z Surveys. ApJ 676, 767–780 (2008).
- (106) Leitherer, C. & Heckman, T. M. Synthetic Properties of Starburst Galaxies. ApJS 96, 9 (1995).
- (107) Osterbrock, D. E. Astrophysics of gaseous nebulae and active galactic nuclei (Research supported by the University of California, John Simon Guggenheim Memorial Foundation, University of Minnesota, et al. Mill Valley, CA, University Science Books, 1989, 422 p., 1989).
- (108) Nakajima, K. et al. JWST Census for the Mass-Metallicity Star-Formation Relations at z=4-10 with the Self-Consistent Flux Calibration and the Proper Metallicity Calibrators. arXiv e-prints arXiv:2301.12825 (2023).
- (109) Sanders, R. L. et al. The MOSDEF Survey: The Evolution of the Mass-Metallicity Relation from z = 0 to z 3.3. ApJ 914, 19 (2021).
- (110) Pasha, I. & Miller, T. B. pysersic: A Python package for determining galaxy structural properties via Bayesian inference, accelerated with jax. arXiv e-prints arXiv:2306.05454 (2023).
- (111) Hoffman, M. D., Gelman, A. et al. The no-u-turn sampler: adaptively setting path lengths in hamiltonian monte carlo. J. Mach. Learn. Res. 15, 1593–1623 (2014).
- (112) Phan, D., Pradhan, N. & Jankowiak, M. Composable effects for flexible and accelerated probabilistic programming in numpyro. arXiv preprint arXiv:1912.11554 (2019).
- (113) Astropy Collaboration et al. Astropy: A community Python package for astronomy. A&A 558, A33 (2013).
- (114) Astropy Collaboration et al. The Astropy Project: Building an Open-science Project and Status of the v2.0 Core Package. AJ 156, 123 (2018).
- (115) Hunter, J. D. Matplotlib: A 2D Graphics Environment. Computing in Science and Engineering 9, 90–95 (2007).
- (116) Brammer, G. msaexp: NIRSpec analyis tools. Zenodo (2022).
- (117) Harris, C. R. et al. Array programming with NumPy. Nature 585, 357–362 (2020).
- (118) Hoffman, M. D. & Gelman, A. The No-U-Turn Sampler: Adaptively Setting Path Lengths in Hamiltonian Monte Carlo. arXiv e-prints arXiv:1111.4246 (2011).
- (119) Phan, D., Pradhan, N. & Jankowiak, M. Composable Effects for Flexible and Accelerated Probabilistic Programming in NumPyro. arXiv e-prints arXiv:1912.11554 (2019).
- (120) Virtanen, P. et al. SciPy 1.0: fundamental algorithms for scientific computing in Python. Nature Methods 17, 261–272 (2020).