Survey of Bare Active Galactic Nuclei in the local universe (): I. On the origin of Soft-Excess
Abstract
We analyse a sample of 21 ‘bare’ Seyfert 1 Active Galactic Nuclei (AGNs), a sub-class of Seyfert 1s, with intrinsic absorption , in the local universe (z 0.2) using XMM-Newton and Swift/XRT observations. The luminosities of the primary continuum, the X-ray emission in the 3 to 10 keV energy range and the soft-excess, the excess emission that appears above the low-energy extrapolation of the power-law fit of 3 to 10 keV X-ray spectra, are calculated. Our spectral analysis reveals that the long-term intrinsic luminosities of the soft-excess and the primary continuum are tightly correlated . We also found that the luminosities are correlated for each source. This result suggests that both the primary continuum and soft excess emissions exhibit a dependency on the accretion rate in a similar way.
1 Introduction
Most massive galaxies nurture supermassive black holes (SMBHs), having mass M M⊙, at their centre (Kormendy & Richstone, 1995; Kormendy & Ho, 2013). The accretion of matter onto the SMBHs is one of the most efficient mechanisms to transform gravitational potential energy into electromagnetic radiation. The radiation spans the entire range of the electromagnetic spectrum, from radio to -rays. Using the X-ray band, it is possible to explore the innermost regions of the accretion disk (Shakura & Sunyaev, 1973) and the Compton cloud or corona (Fabian et al., 2015, 2017) around these SMBHs. A galactic nucleus becomes active when the radiation in any energy band surpasses significantly its stellar or thermal radiation and is classified as an Active Galactic Nucleus (AGN). The primary source of emission in the X-ray band from the AGNs is an optically thin and hot corona through the process of inverse Compton scattering (Sunyaev & Titarchuk, 1980) of the UV photons, originating from the accretion disk (Shakura & Sunyaev, 1973). The scatterings produce a power-law spectrum with a sharp cut-off in the X-ray band (Sunyaev & Titarchuk, 1980; Haardt & Maraschi, 1991, 1993). A fraction of coronal continuum photons could get reprocessed in the colder circumnuclear matter, like a dusty torus, broad line region (BLR), and narrow line region (NLR), producing several spectral features, like absorption lines and iron lines having various shapes (Jana et al., 2020). The X-ray spectra of AGNs are often associated with an excess emission below 2 keV, known as soft-excess (Halpern, 1984; Arnaud et al., 1985; Fabian et al., 2009; Done et al., 2012; García et al., 2014; Nandi et al., 2021) and several fluorescent emission lines in the soft and hard X-rays. Among them, the most prominent and ubiquitous is the Fe Kα line at keV (Ross & Fabian, 2005; Fabian et al., 2009; García & Kallman, 2010). The Fe Kα line could be broadened and distorted by the relativistic effects due to the strong gravitational field around the black hole (Fabian et al., 1989; Laor, 1991). However, the broadening of the Fe Kα line is not omnipresent. The narrow Kα line is believed to originate far from the black hole in the broad-line (BLR) or in the distant torus region (George & Fabian, 1991; Matt et al., 1991). The Comptonized photons could also be reflected from the ionized accretion disc which produces a Compton hump above 15 keV (Magdziarz & Zdziarski, 1995; Murphy & Yaqoob, 2009). The Compton hump is generally found in the energy band of 15 to 50 keV and peaks between 20 to 30 keV. The low-energy part of this hump is generally shaped by the photoelectric absorption of iron in the reflector. In contrast, the high-energy counterpart is formed by the process of down-scattering of high-energy photons from the Compton cloud reprocessed in the accretion disc or distant matter (Pounds et al., 1990; Nandra et al., 1991).
The soft-excess, an excess emission below 2 keV, is an extraordinary feature in the X-ray spectra for most of the Seyfert 1 AGNs (Pravdo et al., 1981; Halpern, 1984; Arnaud et al., 1985; Turner & Pounds, 1989). The origin of soft-excess is one of the major open questions in AGN research (Turner & Miller, 2009), even about four decades after its discovery. The excess emission appears above the low-energy extrapolation of the power-law fit of 3 to 10 keV X-ray spectra. Historically associated with the high-energy counterpart of the blackbody radiation coming from the accretion disk, it has been shown that modelling soft-excess with thermal continuum (Singh et al., 1985; Pounds et al., 1986; Leighly, 1999; Czerny et al., 2003; Gierliński & Done, 2004; Piconcelli et al., 2005; Crummy et al., 2006) indicates a characteristic temperature which is much higher than the expectations from the standard disk (Shakura & Sunyaev, 1973). Besides, the temperature remains remarkably constant across a range of AGNs despite the widespread black hole mass and AGN luminosity (Bechtold et al., 1987; Vaughan et al., 2002; Piconcelli et al., 2005). Moreover, the blackbody luminosity-temperature () relation is not followed by the soft-excess emission from the bright and variable AGNs (Ponti et al., 2006). It was also observed that the ratio between the soft excess at 0.5 keV and the extrapolation of the high-energy power-law emission has a small scatter (Piconcelli et al., 2005; Miniutti et al., 2009). This departs from the Galactic black holes in their bright soft state, where the radiation is mostly dominated by the disk black-body emission (Done et al., 2007). Moreover, considering the timing aspect of the soft-excess with respect to the primary continuum, if a thermal blackbody generates the soft-excess, then 0.5 to 2 keV from the standard accretion disk should lead to the 3-10 keV Comptonized primary continuum in time. However, this was not observed for all cases (Nandi et al., 2021). These discoveries provoked the alternate origins of the soft-excess. One of the popular ideas suggests that Comptonization might take place in the upper layer of the accretion disc (Czerny et al., 2003; Sobolewska & Done, 2007; Jiang et al., 2018; García et al., 2019). This model explains some of the characteristics of soft-excess, such as the shape of the soft excess, its high temperature, coronal-disc feedback etc. On the other hand, the observed high temperature of the soft-excess suggests a nature tied to the atomic processes. If the upper layer of the disc is ionized, the reflection component will contain many X-ray lines (Ross & Fabian, 2005) which will be broadened and distorted due to relativistic effects. Ionized absorption features are also imprinted into the X-ray band. Numerical simulations show (Schurch & Done, 2008) that the outflowing absorbers could produce soft-excess emission. However, velocities of the absorbers of the order of are needed to reproduce the excess emission in the soft X-ray band.
The other proposed model to explain the soft-excess is a warm Comptonizing corona model (Czerny & Elvis, 1987; Middleton et al., 2009; Done et al., 2012; Kubota & Done, 2018; Petrucci et al., 2018). In this scenario, the UV photons are Compton up-scattered in a warm and optically thick corona which is somewhat sandwiching the inner region of the disk. Recently, Nandi et al. (2021) reported a strong correlation (a Pearson coefficient of 0.9) between the soft-excess and the primary continuum luminosities in the 0.5–10 keV energy band for Ark 120, a well-known ‘bare’ AGN. Their finding suggests the origin of both luminosities could be linked to a similar radiation process. Further, Bechtold et al. (1987); Vaughan et al. (2002) suggested a plausible cause of soft-excess emission which depends on the inverse Compotization in the Compton cloud or hot corona. From the Monte-Carlo simulations, it was observed that the fewer scatterings in the corona could provide the steeper power-law spectrum for the soft X-ray regime while the higher number of scatterings could produce the primary continuum (Nandi et al., 2021).
In this paper, we apply a holistic approach to probe the origin of the soft-excess in ‘bare’ AGNs, a sub-class of Seyfert 1s, with intrinsic neutral and ionized absorption , in the local universe (at a redshift z 0.2). We utilize a large sample of archival data obtained with XMM-Newton and Swift/XRT. Our study focused on investigating the origin of the soft excess from an observational standpoint. Instead of employing physical or phenomenological models to fit the observed spectra, we exclusively utilized a power law to parameterize the observed spectrum. The purpose of our work was focused to explore the physical mechanism or drivers of the soft excess emission, rather than to validate or establish any specific model. The paper is organized as follows. Section 2 describes the observations; the details on the source selection and the data reduction procedures are presented in Section 2.1 and Section 2.2, respectively. Then, in Section 3, we discuss the global results of our analysis, where we also discuss the inter-dependency of various parameters, such as spectral indices (Section 3.2), luminosities (Section 3.3), and a plausible explanation of the origin of the soft-excess in our sample in Section 3.4. Finally, the conclusions are summarized in Section 4.
2 Observations and Data Reductions
2.1 Sample Selection
To understand the soft-excess emission, we focused on the ‘bare’ type of AGNs, a sub-class of Seyfert 1s, with intrinsic neutral and ionized absorption . They exhibit excess emission below 2.0 keV energy. In this study, we followed the same procedures described by (Walton et al., 2013). Initially, we fitted the 3.0 to 10.0 keV X-ray spectra with the powerlaw model along with the Galactic and extragalactic absorption using TBabs and zTbabs models, respectively. Then the values for Galactic hydrogen column densities are calculated using NASA’s HEASARC online tool111https://heasarc.gsfc.nasa.gov/cgi-bin/Tools/w3nh/w3nh.pl. For some cases, we found the presence of Fe K- line within the energy range of 6–7 keV. We modelled the line with a Gaussian function which tackles the iron emission present in the spectra and provides reliable determination of the continuum. Following that, we selected our sources which have relatively smoother and cleaner excess emissions below 2.0 keV. The resulting sample contains 21 sources which have no less than a total of five observations with XMM-Newton and Swift/XRT. The observational details of the sources are provided in Table 1. The distribution of sources with respect to various intrinsic parameters, such as redshift () and the mass of the central black hole () are shown in Figure 1. The sample considers the ‘bare’ type of AGNs in the local universe, where most of the sources have redshifts . The sample, however, has only three sources with . The Eddington luminosity () (Rybicki & Lightman, 1979) is calculated using the relation
| (1) |
where, is the universal gravitational constant, is the mass of proton, is the speed of light in vacuum, is the Thompson scattering cross-section, and is the Solar mass.
| Source | RA | Dec. | ||||
|---|---|---|---|---|---|---|
| (h:m:s) | (d:m:s) | cm | (erg ) | |||
| 1H 0323+342 | 03:24:41.1 | +34:10:46 | 0.0610 | 12.7 | 45.40 | |
| 1H 0419–577 | 04:26:00.8 | -57:12:00 | 0.1040 | 1.26 | 46.68 | |
| 1H 0707–495 | 07:08:41.5 | -49:33:06 | 0.0406 | 4.31 | 44.40 | |
| 3C 382 | 18:35:03.4 | +32:41:47 | 0.0579 | 6.98 | 47.08 | |
| 3C 390.3 | 18:42:09.0 | +79:46:17 | 0.0561 | 3.47 | 47.40 | |
| Ark 120 | 05:16:11.4 | -00:08:59 | 0.0327 | 9.78 | 46.28 | |
| Ark 564 | 22:42:39.3 | +29:43:31 | 0.0247 | 4.34 | 44.50 | |
| Fairall 9 | 01:23:45.8 | -58:48:20 | 0.0470 | 3.16 | 46.51 | |
| IRAS 13224–3809 | 13:12:19.4 | -38:24:53 | 0.0658 | 5.34 | 44.40 | |
| Mrk 1018 | 02:06:16.0 | -00:17:29 | 0.0424 | 2.43 | 45.95 | |
| Mrk 110 | 09:25:12.9 | +52:17:11 | 0.0353 | 1.30 | 46.36 | |
| Mrk 335 | 00:06:19.5 | +20:12:10 | 0.0258 | 3.56 | 45.53 | |
| Mrk 359 | 01:27:32.5 | +19:10:44 | 0.0174 | 4.26 | 44.46 | |
| Mrk 509 | 20:44:09.7 | -10:43:25 | 0.0344 | 4.25 | 46.45 | |
| Mrk 841 | 15:04:01.2 | +10:26:16 | 0.0364 | 2.22 | 45.40 | |
| PDS 456 | 17:28:19.8 | -14:15:56 | 0.1854 | 19.6 | 47.30 | |
| PKS 0558–504 | 05:59:47.4 | -50:26:52 | 0.1372 | 3.36 | 46.50 | |
| SWIFT J0501.9–3239 | 05:19:35.8 | -32:39:38 | 0.0124 | 1.75 | 45.79 | |
| NGC 7469 | 23:03:15.6 | +08:52:26 | 0.0163 | 4.45 | 45.10 | |
| Ton S180 | 00:57:19.9 | -22:22:59 | 0.0620 | 1.36 | 45.40 | |
| UGC 6728 | 11:45:16.0 | +79:40:53 | 0.0065 | 4.42 | 43.95 |
(1) Landt et al. (2017); (2) O’Neill et al. (2005); (3) Zhou & Wang (2005); (4) Fausnaugh et al. (2017); (5) Sergeev et al. (2011); (6) Peterson et al. (2004); (7) Zhang & Wang (2006); (8) Alston et al. (2019); (9) Ezhikode et al. (2017); (10) Liu et al. (2017); (11) Grier et al. (2012); (12) Middei et al. (2020); (13) Ross et al. (1992); (14) Nardini et al. (2015); (15) Gliozzi et al. (2010); (16) Agís-González et al. (2014); (17) Turner et al. (2002); (18) Bentz et al. (2016).

2.2 Data Reduction
We employed publicly available archival data from the XMM-Newton and Swift observatories using HEASARC222https://heasarc.gsfc.nasa.gov/. We reprocessed all the data using the HEAsoft version 6.29c (Arnaud, 1996), which includes XSPEC v12.12.0.
We included the observations from XMM-Newton (Jansen et al., 2001) in the X-ray range of 0.2–10 keV obtained with the EPIC-pn detector (Strüder et al., 2001). We reprocessed the raw data to level 1 data for EPIC-pn by Scientific Analysis System (SAS v16.1.0333https://www.cosmos.esa.int/web/xmm-newton/sas-threads) (Gabriel et al., 2004) with calibration files released on February 2, 2018. We followed the standard prescription outlined in the XMM-Newton ABC online guide444https://heasarc.gsfc.nasa.gov/docs/xmm/abc/. Calibrated, cleaned event files were created from the raw data files of EPIC-pn detector using the SAS command epchain. We used FLAG==0 to avoid the flagged events. We also excluded the bad pixels and the edge of the CCD. Apart from that, we also used PATTERN 4 for single and double pixels. We excluded the photon flares by using appropriate GTI files to acquire the maximum signal-to-noise ratio. We chose an annular region with outer and inner radii of 30″ and 5″, respectively, centred at the source to extract the source events. Circular regions of 60″ radii were considered for the backgrounds on the same CCD chip far from the source to avoid contamination. Source spectra were extracted from the cleaned event files using the SAS task xmmselect. For the pile-up correction, we used the SAS task EPATPLOT. To remove the pile-up effect from the data, we adjusted the inner and outer radii of the annular extraction region. We generated instrumental response files using the SAS tasks rmfgen and arfgen. The details of the XMM-Newton/EPIC-pn observations of each source are listed in Table A.
Apart from the XMM-Newton observations, we also used data from the X-ray Telescope (XRT, (Burrows et al., 2005)) on board the Neil Gehrels Swift Observatory or Swift. The sample data were obtained between January 2005 and December 2021. Swift/XRT observed each source regularly as well as in non-regular intervals in both photon counting (PC) and window timing (WT) modes. Depending on the exposure time, we combined observation IDs to get a reasonable spectrum in the 0.5–10 keV energy band. The details of the observation log are provided in Table A. We used the online tool “XRT product builder”555https://www.swift.ac.uk/user_objects/ (Evans et al., 2009) to extract the spectra of each source. This product builder performs all necessary processing and calibration and produces the final spectra for the PC and WT modes.
In the present study, we considered 171 XMM-Newton and 134 binned Swift/XRT spectra, a total of 305 observations, for 21 ‘bare’ AGNs.
3 Results and Discussion
We performed our spectral analysis in 0.5 to 10.0 keV energy range, obtained from the XMM-Newton and Swift observations of the selected sources (see Table 1) using XSPEC v12.12.0 (Arnaud, 1996). We initially used the powerlaw model to fit the data in the energy range of 3.0 to 10.0 keV to constrain the primary continuum. Thereafter, the excess counts below 2.0 keV were fitted using another powerlaw component (Walter & Fink, 1993; Nandi et al., 2021). Along with these components, we used Tbabs and zTBabs (Wilms et al., 2000) for Galactic and extra-galactic absorptions. The component TBabs was applied for the Galactic absorption, where the hydrogen column density () was kept frozen. The other absorption component, zTBabs, was utilized for the extra-galactic hydrogen column density (). We kept the zTBabs component free to vary for various epochs of observations. The basic model in XSPEC reads as: TBabs*zTBabs(powerlaw+powerlaw).
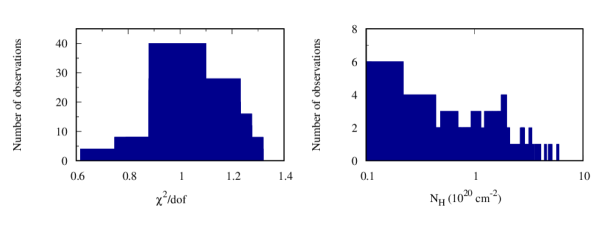
Along with this model, where needed, we used a Gaussian component for the Fe fluorescent emission line near 6.4 keV. Thus, the model in XSPEC reads as: TBabs*zTBabs(powerlaw+powerlaw+zGauss). For IRAS 13224-3809 and Mrk 335, we encountered an absorption feature near 1.8 keV (Jiang et al., 2018) and 0.8 keV, respectively. For that, we used gabs component to the above model, which in XSPEC reads as: TBabs*zTBabs*gabs(powerlaw+powerlaw+zGauss). For each spectral fitting, we considered the final model if the reduced . All the 305 spectra were well fitted with the model and the distribution of normalised with respect to the degrees of freedom (DOF) is shown in the left panel of Figure 2.
We used the following cosmological parameters throughout this work: = 70 km s-1 Mpc -1, = 0.73, = 0.27 (Bennett et al., 2003).
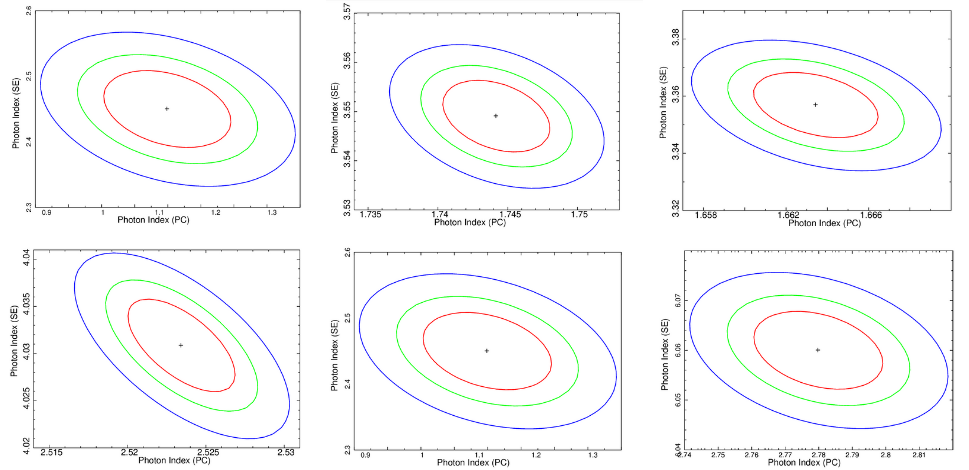
From model fitting, we estimated the extra-galactic hydrogen column densities from zTBabs component for each source with 90% confidence level. We calculated the intrinsic luminosities using clumin command for soft excess () and primary continuum () for the energy range of 0.5–10.0 keV and then normalised them with respect to for each source. To compute the errors for each parameter, we used the ‘error’ command, which estimates error with 90% confidence, available in XSPEC. The uncertainties on the power-law indices were determined using STEPPAR commend in XSPEC. The contours were estimated for 1, 2, and 3 confidence ranges. For our current analysis, the errors are quoted with 90% confidence level or mentioned otherwise.
| Parameters | Pearson Correlation | Spearmann Correlation | Kendall Correlation | |||
|---|---|---|---|---|---|---|
| p | R | p | p | |||
| 0.38 | 0.40 | 0.30 | ||||
| 0.38 | 0.40 | 0.28 | ||||
| 0.27 | 0.35 | 0.25 | ||||
3.1 distribution of selected sample
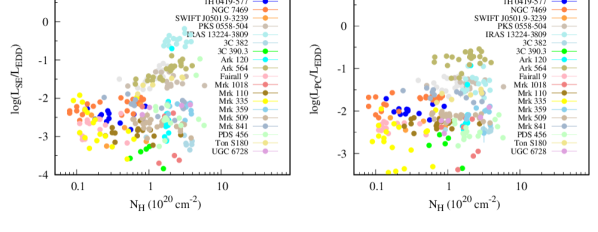
The ‘bare’ AGNs are defined by their little or negligible hydrogen column density along our line of sight (Walton et al., 2013). We computed the intrinsic for the selected 21 sources using the zTBabs model. The sources exhibited variations of ranging within 2 orders of magnitude and are presented in the right column of Figure 2. We found that the hydrogen column density remained less than for all sources. The maximum was observed for PKS 0558-504 having a value of cm-2. The systematic survey revealed that the nearby population has a mean of cm-2, the median of cm-2 having a minimum at cm-2 and a standard deviation () of . In the left panel of Figure 3, we plotted the variation of with respect to . We failed to notice any global correlation between these two parameters. Similar to the vs , we plotted vs in the right panel of Figure 3. We did not observe any significant correlation between these two parameters as well. This is a likely scenario for ‘bare’ AGNs as, by definition, the line of sight hydrogen both ionized and neutral column density around them, is little to none. However, there remains a possibility that the circumnuclear material could have higher column density away from our line of sight (Reeves et al., 2016). It should be noted that the current sample consists of sources that are in the sub-Eddington accretion regime.
3.2 and
We examined the photon indices of the powerlaw components used in the spectral fitting. We found that the photon index of the 3–10 keV primary powerlaw continuum varied from to with a mean of and a median of . The for is . The lower value of is expected to be low as, by definition, the contribution of soft excess appears above the primary continuum below 2 keV. From our survey, most of the ‘bare’ AGN population exhibits a hard powerlaw tail suggesting a hotter Comptonizing region (Sunyaev & Titarchuk, 1980). We employed another powerlaw component to fit the soft-excess below 2 keV. The photon indices of varied in a wide range, starting from and reaching up to . The mean, median, and of are found to be , , and , respectively. We observed higher values of as the index was only used to fit a relatively narrow energy range between keV. It should be noted that the mean and median for are higher than that of . This is expected as the excess emission below 2 keV has a higher photon index and is often referred to as originating from a distinct colder Comptonizing region than the Corona (Mehdipour et al., 2011; Done et al., 2012). In Figure 4, we present the confidence contours for the two power-law indices of six sources from different observations. The bottom-middle panel shows the contours for the extreme value of the last two plots, representing one of the nearly extreme values of and respectively.
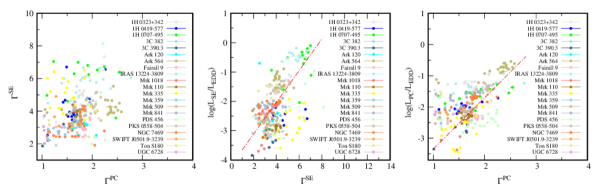
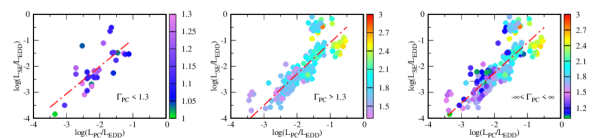
In the left panel of Figure 5, we plotted the against for all the sources. The absence of correlation between these parameters is evident as the Pearson correlation coefficient (PCC) is found to be 0.27 with p-value , tabulated in Table 2. In some cases, we encountered . We carefully identified those observations and found that the majority of them were from Swift/XRT observations with exposure time less than 15 ks (as seen in the observation log). Among these observations, ( of the total data) met this criterion, with ( of the of total data) from Swift/XRT and 2 ( of the of total data) from XMM-Newton. Consequently, the high-energy data points (above keV) for these observations were not well-constrained, leading to high uncertainty in Gamma for the primary continuum.
In addition, we investigated whether the correlation between the luminosities of the primary continuum and soft excess still exists under the criteria . We divided the luminosities into three categories: (i) for , (ii) for , and (iii) for all values and presented the correlations in the left, middle, and right panels of Figure 6, respectively. The correlation was found to persist under these criteria. Therefore, we conclude that the occurrence of is a result of poor data quality due to low exposure time, and this does not affect our final results.
3.3 and
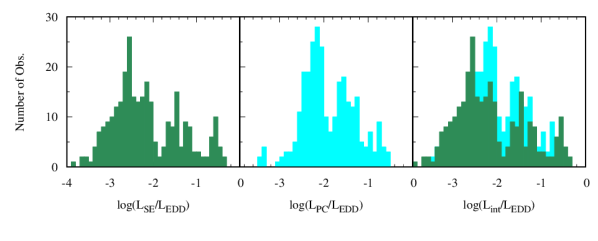
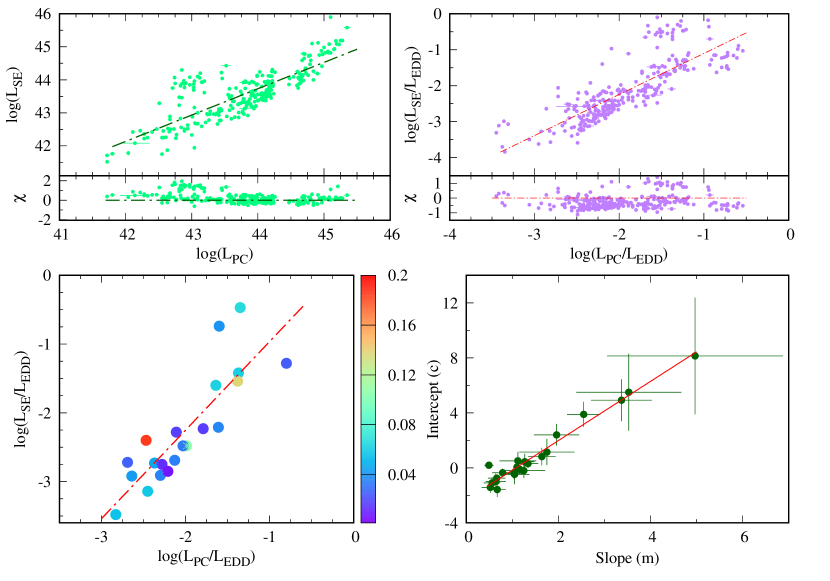
AGNs are considered luminous objects in the observable universe. We surveyed ‘bare’ AGNs in the local universe (), where the luminosity in the 0.5–10 keV energy band is in the range of erg s-1. We calculated the intrinsic luminosities of the primary continuum and soft excess of each spectrum of all sources using the clumin command on the powerlaw component for the energy range of 0.5 to 10.0 keV. The result is plotted in the top left panel of Figure 8. Here, we observe that the mass-dependent intrinsic luminosities of the primary continuum and soft excess are highly correlated (PCC=0.83 with ). Then, we opted for a mass-independent form, , which varied from 43.42 to 47.40 for the sample of our sources. From the spectral analysis of 21 ‘bare’ AGNs, we found that the and varied from -3.45 to -0.53 and -3.46 to -0.05, respectively. We chose and over and because the mass-dependent luminosities may appear due to two reasons: (i) high accretion rate with low black hole mass, and (ii) low accretion rate with high black hole mass. To break this degeneracy, one should normalize the luminosity with respect to mass. Hence, we normalised the luminosity by dividing it with the Eddington luminosity . The normalised luminosity is basically the proxy of the mass accretion rate, which is more fundamental than the luminosity (Jana et al., 2023). We also cross-checked the dependence of normalised luminosity on the mass of our sample of AGNs and did not find any significant correlation among them. For the primary continuum, the mean value of is found to be with median and standard deviation of and , respectively. In the case of the soft excess, the luminosity () varies from -3.46 to -0.05 with a mean value of . The median and the standard deviation of for this energy range are and , respectively. It is clear that all the sources were in the sub-Eddington regime of accretion. Figure 7 represents the number distribution of the normalised intrinsic luminosities for all the observations and their comparison. From that, it could be shown that all observations have sub-Eddington luminosity.
3.4 Soft-excess
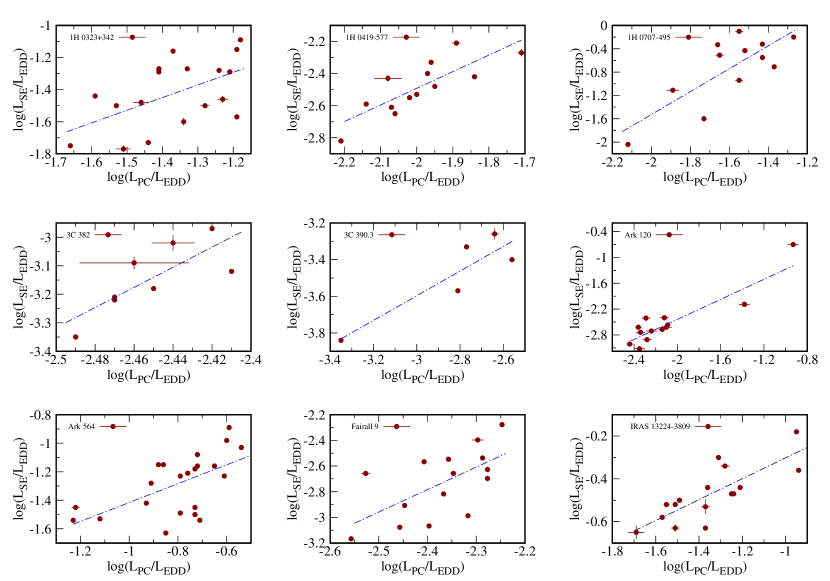
Soft-excess emission is a common feature of most of the Seyfert 1 AGNs. The presence of strong soft-excess was found for all of the sample sources that we surveyed. As we opted for bare AGNs, the soft-excess is free or nearly free from absorption. Figure 3 shows that there are no correlation between the intrinsic luminosities of the primary continuum () and soft-excess () with the extra-galactic hydrogen column density . The luminosities are calculated using clumin task in the powerlaw+powerlaw model for each observation of each source. We found a correlation between these two luminosities for each source. The correlation coefficient is calculated using three different algorithms, Pearson correlation method666https://www.socscistatistics.com/tests/pearson/default2.aspx, Spearman Correlation method777https://www.socscistatistics.com/tests/spearman/default2.aspx and Kendall Correlation method888http://www.wessa.net/rwasp_kendall.wasp and the corresponding results are shown in Table 3. The Pearson correlation coefficient values varied between 0.56 and 0.95, indicating that the luminosities of the primary continuum and soft-excess ( and ) are tightly correlated for most of the sources, whereas two sources (1H 0323+342 and NGC 7469 have the PCC of 0.56 and 0.52, respectivtely) exhibit relatively weaker correlations (see Table 3). The overall correlation between these two luminosities is represented in Figure 8. We calculated the correlation coefficients using three different methods which are presented in Table 3. From the Pearson correlation calculation, we found that the overall correlation coefficient is 0.85 and for the Spearman Correlation method and Kendall Correlation method, the correlation coefficients are and , respectively, with -values of for all cases. For our global sample, the connection between the soft-excess and primary continuum is established. Due to their strong correlation, we can argue that their origin could be the same. We normalised each calculated luminosity using the Eddington luminosity. Once we convert the luminosity into the Eddington unit, the parameter becomes the accretion rate (, which is independent of the mass of the central object. Use of in case of accretion physics, both in AGNs and stellar mass black holes, is profound (Fabian et al., 2009; Done et al., 2012; Netzer, 2019; Mahmoud et al., 2023; Middei et al., 2023). Hence, we can conclude that the normalised luminosities are independent of mass. We constructed a luminosity-luminosity plot incorporating distance (redshift z) to assess any potential dependency on other parameters. Our findings indicate that the average luminosity distribution of the primary continuum and soft-excess, across all sources, does not exhibit a dependence on (see Figure 8). Furthermore, we conducted correlation calculations based on long-term X-ray observations of individual sources, which are presented in the Appendix. Consequently, we deduce that the correlation between the luminosities of the primary continuum and soft excess holds true at both the individual level and the global scale for our source sample (refer to Figure 8).
In essence, we observed that the ratio of primary continuum and soft-excess luminosities remains unaffected by mass, distance, and other parameters associated with the sources. This suggests that the soft excess is not generated by a physical process that relies on these particular parameters.
There are many proposed theories on the origin of ubiquitous soft-excess (Arnaud et al., 1985; Singh et al., 1985; Fabian et al., 2002; Gierliński & Done, 2004). The soft-excess could be generated by the process of reflection (Sobolewska & Done, 2007; Fabian et al., 2009) or due to Comptonization by a warm optically thick region surrounding the accretion disc (Mehdipour et al., 2011) or could be generated from the high disc accretion rate (Done et al., 2012). In the case of Fairall 9, (Lohfink et al., 2012) showed that the origin of the soft-excess is linked with the source that produces the broad iron line. They implied that another source of Comptonization could be responsible for generating the soft-excess. The origin of soft-excess has been investigated by (Fukumura et al., 2016) on the basis of radiative transfer and hydrodynamics around an AGN. They proposed that the soft-excess could be generated by the process of shock heating near the ISCO (Innermost stable circular orbit). However, using a statistical survey of 120 Seyfert 1 AGNs, (Boissay et al., 2016) suggested that the origin of soft-excess could be related to the thermodynamical properties of the Compton cloud and associated medium. Considering timing studies, Fabian et al. (2009) proposed that the soft-excess should be delayed compared to the continuum as the model gauge reflection to be the origin of soft-excess. However, for Ark 120, Nandi et al. (2021) reported that the soft-excess could produce zero, positive, and negative delays depending on the spectral state of the AGN. Thus, contrary to other models, we argue that the corona or Compton cloud itself could produce the soft-excess.
In the case of supermassive black holes, emission from the standard disk (Shakura & Sunyaev, 1973) peaks in the UV. The hot corona reprocesses the soft emission from the disk to produce the power-law continuum (Sunyaev & Titarchuk, 1980). The density and temperature profiles within the Compton cloud or corona are believed to be non-homogeneous Chakrabarti & Titarchuk (1995). According to earlier simulations (Pozdnyakov et al., 1983; Ghosh et al., 2011; Chatterjee et al., 2017; Nandi et al., 2021), the number of scatterings within the corona plays is crucial in determining the spectral index. The photons, which have suffered less, could produce a steeper spectral slope than the continuum. For Ark 120, Nandi et al. (2021) investigated the possible scattering-dependent spectrum in the X-ray regime. In that work, they showed the variation of spectral components with respect to the number of scatterings and found that the spectral slope decreases with the increase in the number of scatterings. The primary continuum (above 3.0 keV) is mostly dominated by the photons where the number of scatterings is . For the soft-excess regime (below 2.0 keV), the dominating contribution of photons comes from those which have suffered scatterings. The correlation between the luminosities could also be obtained by varying the accretion rates. A similar feature for all selected ‘bare’ AGNs could be observed in the present work.
To examine the correlation in individual sources, we employed a linear fit between the luminosities in the scale and the fitted parameters are shown in Table 3. We found that the slope () varied from to with a mean value of . The standard deviation and median of this slope are and , respectively. The intercept () ranges between to with the mean at and median at . The standard deviation of the intercept () for our data-set is . For the overall analysis of all data-sets, we found the luminosity of the primary continuum () is highly correlated with the luminosity of soft-excess (). The parameters for the linear fit of all data points are shown in Figure 8 and the corresponding values of fitted parameters are presented in Table 3. We found that the overall slope () is and intercept () is for all data-sets and corresponding . Thus, we suggest that the relationship between these two parameters is for ‘bare’ AGNs. The global fit indicates that the continuum provides a slightly higher luminosity than the soft-excess over regime. For individual sources, the variations of the slope and intercept are expected as their inclination and accretion state are variable with respect to the observer frame.
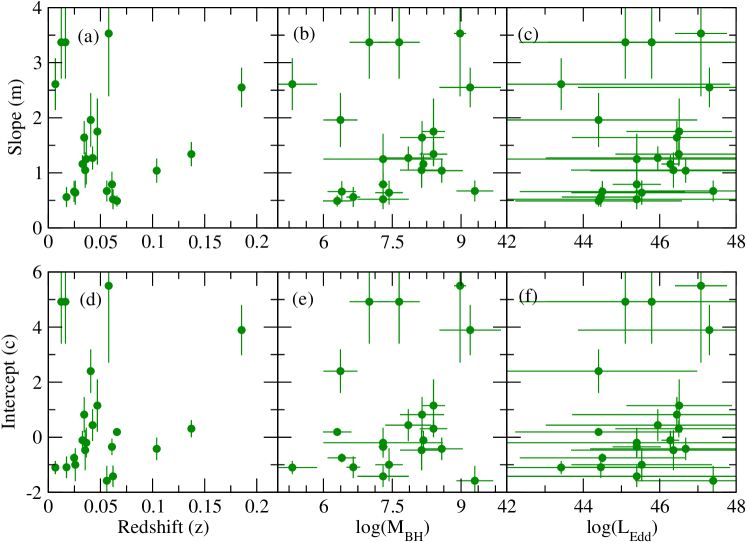
From the linear fit of individual sources, we found that the slope () and intercept () are correlated. The correlation is presented in Figure 8. From this figure, we find that the soft-excess could vanish for a weaker primary continuum. We examined the dependency of ‘’ and ‘’ on the intrinsic parameters, such as redshift, mass, and Eddington luminosity and found that ‘’ and ‘’ are not dependent on these parameters (Figure 9).
| Source | Pearson Correlation | Spearmann Correlation | Kendall Correlation | Linear fit | ||||
|---|---|---|---|---|---|---|---|---|
| p | R | p | p | m | c | |||
| 1H 0323+342 | 0.56 | 0.017 | 0.52 | 0.027 | 0.39 | 0.030 | ||
| 1H 0419–577 | 0.82 | 0.001 | 0.80 | 0.001 | 0.64 | 0.003 | ||
| 1H 0707–495 | 0.78 | 0.005 | 0.60 | 0.043 | 0.43 | 0.062 | ||
| 3C 382 | 0.78 | 0.022 | 0.59 | 0.040 | 0.69 | 0.024 | ||
| 3C 390.3 | 0.90 | 0.037 | 0.59 | 0.043 | 0.60 | 0.220 | ||
| Ark 120 | 0.90 | 0.80 | 0.001 | 0.68 | 0.001 | |||
| Ark 564 | 0.60 | 0.003 | 0.56 | 0.007 | 0.44 | 0.005 | ||
| Fairall 9 | 0.63 | 0.011 | 0.63 | 0.012 | 0.49 | 0.013 | ||
| IRAS 13224–3809 | 0.79 | 0.80 | 0.62 | 0.001 | ||||
| Mrk 1018 | 0.93 | 0.002 | 0.68 | 0.089 | 0.49 | 0.171 | ||
| Mrk 110 | 0.67 | 0.006 | 0.55 | 0.033 | 0.41 | 0.040 | ||
| Mrk 335 | 0.59 | 0.010 | 0.62 | 0.006 | 0.46 | 0.010 | ||
| Mrk 359 | 0.73 | 0.016 | 0.45 | 0.197 | 0.34 | 0.206 | ||
| Mrk 509 | 0.75 | 0.71 | 0.55 | |||||
| Mrk 841 | 0.62 | 0.018 | 0.59 | 0.026 | 0.46 | 0.024 | ||
| PDS 456 | 0.88 | 0.82 | 0.68 | |||||
| PKS 0558–504 | 0.87 | 0.84 | 0.68 | 0.001 | ||||
| SWIFT J0501.9–3239 | 0.95 | 0.013 | 0.90 | 0.037 | 0.80 | 0.086 | ||
| NGC 7469 | 0.52 | 0.010 | 0.46 | 0.026 | 0.35 | 0.023 | ||
| Ton S180 | 0.85 | 0.032 | 0.83 | 0.041 | 0.73 | 0.060 | ||
| UGC 6728 | 0.83 | 0.081 | 0.80 | 0.057 | 0.75 | 0.086 | ||
| Overall | 0.85 | 0.88 | 0.71 | |||||
4 Conclusions
We studied 21 Seyfert 1 AGNs in the energy range of 0.5 to 10.0 keV by using observations spanned over a long duration of time. These sources are previously reported as ‘bare’ AGNs and we find similar characteristics of each source. The following are the significant findings from our presented work.
-
1.
In most cases, the intrinsic luminosities vary a lot. However, these variations are not related to the hydrogen column density along the line of sight. From the spectral analysis of all the observations, we found the mean value of extra-galactic hydrogen column density at with a standard deviation of .
-
2.
The power-law slope of the soft-excess and the power-law slope of the primary continuum are not constant and vary for all sources. From our survey, we found that the mean for the 3–10 keV primary continuum power-law index is with a standard deviation of . For the soft-excess, the mean of the power-law index is with a standard deviation of . Therefore, it indicates that the spectral slope for soft-excess is higher than the spectral slope of the primary continuum .
-
3.
From the analysis of long-term data of 21 ‘bare’ AGNs, we found that the intrinsic luminosity of soft-excess () and the intrinsic luminosity of primary continuum () are widely variable and the variation is different for different sources. The mean value of is found to be with a standard deviation of . Whereas the has a mean value of with a standard deviation of . We found that these two luminosities are correlated for individual sources. For the overall picture, the normalised intrinsic luminosities (normalised by Eddington luminosity) are also tightly correlated. While extending the previous work of (Nandi et al., 2021), we found that the thermodynamical properties of the Compton cloud could attribute to the origin of soft-excess in the ‘bare’ AGNs. On a global scale, we found that the accretion rate drives the luminosity of soft excess as well as the primary continuum.
-
4.
The slope and intercept for the individual sources exhibit a correlation between these two parameters which indicates that the primary continuum will be present whether or not the soft-excess is observed.
In future, high-resolution spectroscopic missions, such as XRISM (Tashiro et al., 2018) and ATHENA (Nandra et al., 2013) would provide detailed line emission in the soft-excess regime. While working in a similar energy range, the large field of view of AXIS (Mushotzky, 2018) would be able to extend the sample size as well as provide crucial information related to the origin of the soft excess. On the other hand, the large effective area and high throughput of Colibrì (Heyl et al., 2019; Caiazzo et al., 2019) could provide serendipitous detection of low luminosity () ‘bare’ AGNs. Additionally, the hard X-ray properties of the soft-excess (Boissay et al., 2016) could be explored by HEX-P (Madsen et al., 2018).
acknowledgments
We would like to express our sincere gratitude to the reviewers for their valuable insights and comprehensive evaluation of our work, greatly contributing to its improved quality and clarity. PN and SN acknowledge support from the Physical Research Laboratory, Ahmedabad, India, funded by the Department of Space, Government of India, for this work. AC, SSH and JH are supported by the Canadian Space Agency (CSA) and the Natural Sciences and Engineering Research Council of Canada (NSERC) through the Discovery Grants and the Canada Research Chairs programs. AJ and HK acknowledge the support of the grant from the Ministry of Science and Technology of Taiwan with the grand numbers MOST 110-2811-M-007-500 and MOST 111-2811-M-007-002. HK acknowledge the support of the grant from the Ministry of Science and Technology of Taiwan with the grand number MOST 110-2112-M-007-020. This research is based on observations obtained with XMM-Newton, an ESA science mission with instruments and contributions directly funded by ESA Member States and NASA. This work made use of XRT data supplied by the UK Swift Science Data Centre at the University of Leicester, UK.
Appendix A Observation log
The details of the XMM-Newton/EPIC-pn and Swift/XRT observations of each source are listed in Table A. We have considered 171 XMM-Newton observations and 134 binned Swift/XRT observations for 21 ‘bare’ AGNs. So, the total number of observations is 305 for this work. The details data reduction procedure is given in Section 2.2.
| Source | XMM-Newton | date | Exposure | Swift/XRT | date | Exposure |
|---|---|---|---|---|---|---|
| observations | (yyyy:mm:dd) | (ks) | observations | (yyyy:mm:dd) | (ks) | |
| 1H 0323+342 | 0764670101 | 2015:08:23 | 80.9 | 00036533001-00036533009 | 2007:07:20-2007:12:28 | 32.5 |
| 0823780201 | 2018:08:14 | 54.2 | 00036533010-00036533012 | 2008:01:04-2008:11:16 | 10.6 | |
| 0823780301 | 2018:08:18 | 49.3 | 00036533013-00036533018 | 2009:07:24-2009:08:08 | 18.5 | |
| 0823780401 | 2018:08:20 | 49.1 | 00090415001-00090415031 | 2010:10:28-2010:11:30 | 91.5 | |
| 0823780501 | 2018:08:24 | 49.6 | 00036533019-00036533027 | 2011:07:06-2011:12:28 | 16.1 | |
| 0823780601 | 2018:09:05 | 51.9 | 00036533028-00036533030 | 2012:01:02-2012:03:03 | 04.9 | |
| 0823780701 | 2018:09:09 | 50.6 | 00036533031-00036533051 | 2013:01:13-2013:10:02 | 62.2 | |
| 00036533052-00036533053 | 2014:12:10-2014:12:12 | 05.8 | ||||
| 00036533054-00036533080 | 2015:08:02-2015:12:24 | 50.1 | ||||
| 00036533081-00036533104 | 2018:07:05-2018:12:13 | 24.2 | ||||
| 00036533105-00036533109 | 2019:10:03-2019:12:21 | 08.4 | ||||
| 1H 0419–577 | 0148000201 | 2002:09:25 | 15.1 | 00037559001-00037559002 | 2008:10:22-2008:11:12 | 16.1 |
| 0148000301 | 2002:12:27 | 18.0 | 00091621001 | 2013:06:17 | 01.1 | |
| 0148000401 | 2003:03:30 | 14.0 | 00081695001-00081695004 | 2015:06:03-2015:06:09 | 04.2 | |
| 0148000501 | 2003:06:25 | 13.2 | 00093031001-00093031002 | 2017:05:28-2017:05:31 | 02.5 | |
| 0148000601 | 2003:09:16 | 13.9 | 00088681001 | 2018:11:13 | 02.0 | |
| 0148000701 | 2003:11:15 | 12.2 | ||||
| 0604720401 | 2010:05:28 | 60.9 | ||||
| 0604720301 | 2010:05:30 | 106.7 | ||||
| 0820360101 | 2018:05:16 | 52.0 | ||||
| 0820360201 | 2018:11:13 | 53.3 | ||||
| 1H 0707–495 | 0148010301 | 2002:10:13 | 80.0 | 00090393001-00090393070 | 2010:04:03-2010:12:31 | 78.9 |
| 0506200301 | 2007:05:14 | 41.0 | 00090393071-00090393104 | 2011:01:04-2011:03:29 | 35.8 | |
| 0506200201 | 2007:05:16 | 10.9 | 00091623001-00091623002 | 2013:05:19-2013:06:19 | 03.2 | |
| 0506200501 | 2007:06:20 | 47.0 | 00080720001-00080720004 | 2014:05:09-2014-06-28 | 04.9 | |
| 0506200401 | 2007:07:06 | 42.9 | 00080720005-00090393105 | 2018:01:01-2018:04:30 | 52.6 | |
| 0511580101 | 2008:01:29 | 123.8 | ||||
| 0511580201 | 2008:01:31 | 123.7 | ||||
| 0511580301 | 2008:02:02 | 122.5 | ||||
| 0511580401 | 2008:02:04 | 121.9 | ||||
| 0653510301 | 2010:09:13 | 116.6 | ||||
| 0653510401 | 2010:09:15 | 128.2 | ||||
| 0653510501 | 2010:09:17 | 127.6 | ||||
| 0653510601 | 2010:09:19 | 129.0 | ||||
| 0554710801 | 2011:01:12 | 89.3 | ||||
| 0853000101 | 2019:10:11 | 60.7 | ||||
| 3C 382 | 0506120101 | 2008:04:28 | 29.4 | 00080216001 | 2013:12:18 | 01.9 |
| 0790600101 | 2016:08:29 | 31.0 | 00081830001-00081830002 | 2016:09:11-2016:10:17 | 03.6 | |
| 0790600201 | 2016:09:11 | 23.0 | 00014251001-00096110004 | 2021:04:09-2021:06:29 | 03.1 | |
| 0790600301 | 2016:09:22 | 28.0 | ||||
| 0790600401 | 2016:10:05 | 23.0 | ||||
| 0790600501 | 2016:10:17 | 24.0 | ||||
| 3C 390.3 | 0203720201 | 2004:10:08 | 70.4 | 00037596001-00037596004 | 2008:05:30-2008:06:13 | 19.5 |
| 0203720301 | 2004:10:17 | 52.8 | 00080221001 | 2013:05:25 | 02.1 | |
| 00080221002-00096111001 | 2021:03:18-2021:05:18 | 03.2 | ||||
| Ark 120 | 0147190101 | 2003:08:24 | 112.1 | 00037593001-00037593003 | 2008:07:24-2008:08:03 | 10.9 |
| 0693781501 | 2013:02:18 | 130.5 | 00091909002-00091909022 | 2014:09:04-2014:10:19 | 22.8 | |
| 0721600201 | 2014:03:18 | 132.7 | 00091909023-00091909044 | 2014:10:22-2014:12:05 | 20.2 | |
| 0721600301 | 2014:03:20 | 131.8 | 00091909045-00091909068 | 2014:12:09-2015:01:26 | 23.5 | |
| 0721600401 | 2014:03:22 | 133.3 | 00091909069-00091909090 | 2015:01:26-2015:03:15 | 21.7 | |
| 0721600501 | 2014:03:24 | 133.3 | 00010379001-00010379048 | 2017:12:07-2018:01:24 | 44.1 | |
| Ark 564 | 0006810101 | 2000:06:17 | 34.5 | 00035062001-00035062003 | 2005:04:19-2005:12:09 | 18.4 |
| 0006810301 | 2001:06:09 | 16.2 | 00033282001-00033282002 | 2014:05:17 | 02.7 | |
| 0206400101 | 2005:01:05 | 101.8 | 00081687001 | 2015:05:22 | 02.5 | |
| 0670130201 | 2011:05:24 | 19.5 | 00092237001-00092237015 | 2016:05:05-2016:12:27 | 13.8 | |
| 0670130301 | 2011:05:30 | 55.9 | 00093158001-00093158017 | 2017:05:04-2017:12:19 | 14.8 | |
| 0670130401 | 2011:06:05 | 63.6 | 00094000001-00094000018 | 2018:05:08-2018:12:22 | 14.7 | |
| 0670130501 | 2011:06:11 | 67.3 | 00095000001-00095000016 | 2019:05:08-2019:12:22 | 14.0 | |
| 0670130601 | 2011:06:17 | 60.9 | 00095653001-00095653017 | 2020:05:08-2020:12:22 | 13.3 | |
| 0670130701 | 2011:06:25 | 64.4 | 00096050001-00096113003 | 2021:04:22-2021:04:30 | 05.7 | |
| 0670130801 | 2011:06:29 | 58.2 | ||||
| 0670130901 | 2011:07:01 | 55.9 | ||||
| 0830540101 | 2018:12:01 | 114.9 | ||||
| 0830540201 | 2018:12:03 | 114.4 | ||||
| Fairall 9 | 0101040201 | 2000:07:05 | 33.0 | 00037595001 | 2008:09:10 | 07.1 |
| 0605800401 | 2009:12:09 | 130.1 | 00037595002-00037595045 | 2013:04:16-2013:12:30 | 45.1 | |
| 0721110101 | 2013:12:19 | 73.0 | 00037595046-00091908098 | 2014:01:01-2014:10:21 | 49.5 | |
| 0721110201 | 2014:01:02 | 51.2 | 00037595052-00037595071 | 2015:02:08-2015:04:23 | 23.0 | |
| 0741330101 | 2014:05:09 | 141.4 | 00094060001-00094060100 | 2018:05:13-2018:08:26 | 55.1 | |
| 00094060101-00094060225 | 2018:08:27-2018:12:31 | 67.5 | ||||
| 00094060226-00011108100 | 2019:01:01-2019:05:20 | 69.9 | ||||
| 00011108101-00011108200 | 2019:05:21-2019:09:07 | 82.1 | ||||
| 00011108201-00095400055 | 2019:09:08-2019:12:31 | 94.8 | ||||
| 00095400056-00037595140 | 2020:01:01-2020:12:28 | 88.8 | ||||
| IRAS 13224–3809 | 0673580101 | 2011:07:19 | 133.1 | 00090394001-00090394049 | 2010:04:03-2010:12:31 | 54.2 |
| 0673580201 | 2011:07:21 | 132.4 | 00090394050-00090394072 | 2011:01:04-2011:03:29 | 23.4 | |
| 0673580301 | 2011:07:25 | 129.4 | 00091635002-00091635004 | 2014:02:18-2014:03:17 | 06.1 | |
| 0673580401 | 2011:07:29 | 134.7 | 00034597001-00034597030 | 2016:07:08-2016:08:18 | 50.0 | |
| 0780560101 | 2016:07:08 | 141.3 | ||||
| 0780561301 | 2016:07:10 | 141.0 | ||||
| 0780561401 | 2016:07:12 | 138.1 | ||||
| 0780561501 | 2016:07:20 | 140.8 | ||||
| 0780561601 | 2016:07:22 | 140.8 | ||||
| 0780561701 | 2016:07:24 | 140.8 | ||||
| 0792180101 | 2016:07:26 | 141.0 | ||||
| 0792180201 | 2016:07:30 | 140.5 | ||||
| 0792180301 | 2016:08:01 | 140.5 | ||||
| 0792180401 | 2016:08:03 | 140.8 | ||||
| 0792180501 | 2016:08:07 | 138.0 | ||||
| 0792180601 | 2016:08:09 | 136.0 | ||||
| Mrk 1018 | 0201090201 | 2005:01:15 | 11.9 | 00035166001 | 2005:08:05 | 05.2 |
| 0554920301 | 2008:08:07 | 17.6 | 00035776001 | 2008:06:11 | 04.7 | |
| 0821240201 | 2018:07:23 | 74.8 | 00080898001-00080898002 | 2016:02:11-2016:02:11 | 06.8 | |
| 0821240301 | 2019:01:04 | 67.7 | 00088207001-00035776058 | 2018:01:06-2018:11:24 | 53.8 | |
| 0864350101 | 2021:02:04 | 65.0 | ||||
| Mrk 110 | 0840220701 | 2019:11:03 | 43.6 | 00037561001-00037561002 | 2010:01:06-2010:01:12 | 13.8 |
| 0840220801 | 2019:11:05 | 43.0 | 00091850001-00091850003 | 2014:04:02-2014:04:09 | 01.1 | |
| 0840220901 | 2019:11:07 | 40.6 | 00037561004 | 2015:03:23 | 01.2 | |
| 0852590101 | 2019:11:17 | 44.5 | 00092396001-00037561009 | 2016:04:24-2016:05:21 | 50.4 | |
| 0852590201 | 2020:04:06 | 48.5 | 00081846001-00093255100 | 2017:01:23-2017:11:29 | 59.2 | |
| 00093255101-00093255193 | 2017:11:29-2017-12-31 | 95.6 | ||||
| 00093255194-00010538012 | 2018:01:01-2018:01:25 | 68.3 | ||||
| 00011136001-00011136061 | 2019:02:20-2019:06:22 | 55.4 | ||||
| 00011136062-00088896002 | 2019:09:02-2019:11:17 | 62.6 | ||||
| 00095040001-00011136158 | 2020:01:12-2020:06:07 | 24.8 | ||||
| 00011136159-00096116002 | 2021:02:21-2021:09:09 | 12.2 | ||||
| Mrk 335 | 0101040101 | 2000:12:25 | 36.9 | 00035755001-00035755025 | 2007:05:17-2007:12:26 | 89.0 |
| 0306870101 | 2006:01:03 | 133.3 | 00035755026-00090006034 | 2008:01:02-2008:12:28 | 77.0 | |
| 0510010701 | 2007:07:10 | 22.6 | 00090006035-00035755040 | 2009:01:05-2010:12:31 | 79.6 | |
| 0600540601 | 2009:06:11 | 132.3 | 00035755042-00035755080 | 2011:01:24-2011:12:30 | 40.5 | |
| 0600540501 | 2009:06:13 | 82.6 | 00035755081-00035755145 | 2012:01:03-2012:12:28 | 92.6 | |
| 0741280201 | 2015:12:30 | 140.4 | 00035755146-00035755217 | 2013:01:05-2013:12:31 | 58.2 | |
| 0780500301 | 2018:07:11 | 114.5 | 00035755218-00033420031 | 2014:01:04-2014:12:30 | 40.2 | |
| 0831790601 | 2019:01:08 | 117.8 | 00033420032-00092239013 | 2015:01:07-2016:12:31 | 71.7 | |
| 0854590401 | 2019:12:27 | 105.9 | 00033420114-00033420202 | 2017:01:08-2018:12:28 | 86.1 | |
| 00033420203-00095118242 | 2019:01:04-2019:12:31 | 95.6 | ||||
| 00095118243-00013544077 | 2020:01:01-2020:12:30 | 52.7 | ||||
| Mrk 359 | 0112600601 | 2000:07:09 | 27.2 | 00045920001-00045920007 | 2012:06:05-2012:08:16 | 13.3 |
| 0655590501 | 2010:07:29 | 64.0 | 00088710001-00088710002 | 2019:01:26-2019:01:28 | 03.6 | |
| 0830550801 | 2019:01:25 | 60.0 | ||||
| 0830550901 | 2019:01:26 | 55.8 | ||||
| 0830551001 | 2019:01:28 | 53.0 | ||||
| 0830551101 | 2019:01:31 | 62.7 | ||||
| 0830551201 | 2019:02:02 | 61.2 | ||||
| Mrk 509 | 0130720101 | 2000:10:25 | 31.6 | 00035469001-00035469003 | 2006:03:18-2006:04:20 | 08.3 |
| 0130720201 | 2001:04:20 | 44.4 | 00035469004 | 2007:03:26 | 03.0 | |
| 0306090201 | 2005:10:18 | 84.9 | 00035469005-00035469023 | 2009:09:04-2009:12:12 | 17.3 | |
| 0306090301 | 2005:10:20 | 47.1 | 00081459001-00035469026 | 2015:04:28-2015:09:08 | 10.6 | |
| 0306090401 | 2006:04:25 | 70.0 | 00092240001-00092240008 | 2016:05:03-2016:11:01 | 07.7 | |
| 0601390201 | 2009:10:15 | 60.9 | 00093157001-00093157241 | 2017:03:17-2017:12:15 | 232.7 | |
| 0601390301 | 2009:10:19 | 63.8 | 00094002001-00094002011 | 2018:04:11-2018:11:09 | 11.2 | |
| 0601390401 | 2009:10:23 | 60.9 | 00095002001-00095002013 | 2019:04:10-2019:11:09 | 11.3 | |
| 0601390501 | 2009:10:29 | 60.9 | 00095655001-00095655012 | 2020:04:10-2020:11:09 | 10.2 | |
| 0601390601 | 2009:11:02 | 62.8 | 00096119001-00096444006 | 2021:06:05-2021:11:07 | 06.5 | |
| 0601390701 | 2009:11:06 | 63.1 | ||||
| 0601390801 | 2009:11:10 | 60.9 | ||||
| 0601390901 | 2009:11:14 | 60.9 | ||||
| 0601391001 | 2009:11:18 | 65.5 | ||||
| 0601391101 | 2009:11:20 | 62.8 | ||||
| Mrk 841 | 0112910201 | 2001:01:13 | 10.1 | 00035468002 | 2007:01:01 | 10.4 |
| 0070740101 | 2001:01:13 | 12.3 | 00081590001 | 2015:07:14 | 01.4 | |
| 0070740301 | 2001:01:14 | 14.8 | 00092241001-00092241008 | 2016:06:18-2016:12:27 | 07.6 | |
| 0205340201 | 2005:01:16 | 72.7 | 00092241009-00093162008 | 2017:01:04-2017:12:29 | 13.6 | |
| 0205340401 | 2005:07:17 | 29.5 | 00093094001-00094003010 | 2018:01:04-2018:12:27 | 15.8 | |
| 0763790501 | 2015:07:14 | 29.5 | 00094003011-00095003010 | 2019:01:03-2019:12:27 | 15.9 | |
| 00095003011-00095656010 | 2020:01:03-2020:12:27 | 15.1 | ||||
| 00095656011-00096445009 | 2021:01:03-2021:12:26 | 18.1 | ||||
| PDS 456 | 0041160101 | 2001:02:26 | 46.5 | 00090078001-00090078015 | 2009:04:17-2009:10:02 | 72.2 |
| 0501580101 | 2007:09:12 | 92.4 | 00090078016-00090078019 | 2010:01:29-2010:03:20 | 25.9 | |
| 0501580201 | 2007:09:14 | 89.7 | 00093145001-00093145047 | 2017:03:23-2017:10:09 | 152.6 | |
| 0721010201 | 2013:08:27 | 111.2 | 00010383001-00010383033 | 2018:08:22-2018:10:06 | 87.9 | |
| 0721010301 | 2013:09:06 | 113.5 | 00037748003-00010383058 | 2019:04:15-2019:09:26 | 56.5 | |
| 0721010401 | 2013:09:15 | 120.5 | 00010383059-00010383103 | 2021:07:01-2021:10:07 | 69.7 | |
| 0721010501 | 2013:09:20 | 112.1 | ||||
| 0721010601 | 2014:02:26 | 140.8 | ||||
| 0780690201 | 2017:03:23 | 82.3 | ||||
| 0780690301 | 2017:03:25 | 89.3 | ||||
| 0830390101 | 2018:09:20 | 86.0 | ||||
| 0830390201 | 2019:09:02 | 83.0 | ||||
| 0830390401 | 2019:09:24 | 94.3 | ||||
| PKS 0558–504 | 0116700301 | 2000:02:07 | 22.5 | 00090020001-00090020025 | 2008:09:07-2008:12:25 | 52.8 |
| 0117710701 | 2000:02:12 | 51.8 | 00090020026-00090020050 | 2009:01:01-2009:06:15 | 47.5 | |
| 0119100201 | 2000:03:01 | 45.4 | 00090020051-00090020081 | 2009:06:22-2009:12:28 | 53.5 | |
| 0125110101 | 2000:05:24 | 57.3 | 00090020082-00090020093 | 2010:01:04-2010:03:30 | 15.2 | |
| 0129360201 | 2000:10:10 | 26.4 | 00080990001 | 2016:11:19 | 06.7 | |
| 0137550201 | 2001:06:26 | 14.8 | ||||
| 0137550601 | 2001:10:19 | 14.8 | ||||
| 0555170201 | 2008:09:07 | 126.9 | ||||
| 0555170301 | 2008:09:09 | 129.0 | ||||
| 0555170401 | 2008:09:11 | 129.2 | ||||
| 0555170501 | 2008:09:13 | 128.6 | ||||
| 0555170601 | 2008:09:15 | 126.7 | ||||
| SWIFT J0501.9–3239 | 0312190701 | 2006:01:28 | 119.1 | 00035234001-00035234002 | 2005:10:29-2005:11:26 | 08.9 |
| 0610180101 | 2010:01:29 | 76.9 | 00040311001-00040311002 | 2011:01:07-2011:01:23 | 02.3 | |
| 0790810101 | 2016:09:24 | 120.8 | 00040311003-00040311004 | 2020:04:03-2020:04:17 | 01.8 | |
| NGC 7469 | 0112170101 | 2000:12:26 | 19.0 | 00035470001-00035470005 | 2006:04:27-2006:08:02 | 08.9 |
| 0112170301 | 2000:12:26 | 24.6 | 00035470006-00035470007 | 2007:04:26-2007:05:17 | 02.2 | |
| 0207090101 | 2004:11:30 | 85.0 | 00035470008-00035470060 | 2013:04:28-2013:06:03 | 32.4 | |
| 0207090201 | 2004:12:03 | 79.1 | 00035470061-00035470121 | 2013:06:03-2013:07:05 | 37.9 | |
| 0760350201 | 2015:06:12 | 90.8 | 00035470122-00035470171 | 2013:07:06-2013:08:01 | 29.3 | |
| 0760350301 | 2015:11:24 | 87.0 | 00035470172-00035470210 | 2013:08:02-2013:08:20 | 25.0 | |
| 0760350401 | 2015:12:15 | 85.9 | 00081531001-00092214049 | 2015:06:12-2015:12:31 | 67.4 | |
| 0760350501 | 2015:12:23 | 90.9 | 00092214050-00092244014 | 2016:01:01-2016:12:19 | 36.5 | |
| 0760350601 | 2015:12:24 | 95.5 | 00093165001-00093165013 | 2017:05:06-2017:12:16 | 12.1 | |
| 0760350701 | 2015:12:26 | 98.0 | 00094006001-00094006016 | 2018:05:02-2018:12:16 | 12.3 | |
| 0760350801 | 2015:12:28 | 101.6 | 00095006001-00095006015 | 2019:05:02-2019:12:16 | 12.7 | |
| 00095670001-00095670040 | 2020:04:27-2020:12:26 | 42.2 | ||||
| Ton S180 | 0110890401 | 2000:12:14 | 31.0 | 00093003001-00093003002 | 2017:05:28-2017:06:03 | 01.3 |
| 0110890701 | 2002:06:30 | 18.4 | 00096062001-00096062002 | 2021:05:04-2021:05:06 | 03.3 | |
| 0764170101 | 2015:07:03 | 141.3 | ||||
| 0790990101 | 2016:06:13 | 32.0 | ||||
| UGC 6728 | 0312191601 | 2006:02:23 | 11.9 | 00081098001 | 2016:07:10 | 06.9 |
| 00088256001 | 2017:10:13 | 07.0 | ||||
| 00013662001 | 2020:09:05 | 01.8 | ||||
| 00013662002-00096132008 | 2021:04:13-2021:10:25 | 02.2 |
Appendix B Individual Source Details
1H 0323+342 is one of the closest (=0.0629) exotic NLS1 AGN that exhibits superluminal motion of its relativistic outflow. The origin of the X-ray emission from this source could be explained as due to interactions between the disc and the Compton cloud (Paliya et al., 2019). From the method of single-epoch spectrum for several broad emission lines, (Landt et al., 2017) estimated its mass as .
1H 0323+342 has been observed with XMM-Newton and Swift/XRT, and the X-ray spectra showed the nature of a bare-AGN, such as soft-excess, low along the line of sight etc. The details of the observation log are given in Table A. The procedures followed in fitting the X-ray data are described in Section 3. Our composite model for fitting the data in 0.5 to 10.0 keV range is:
TBabs*zTBabs*(powerlaw+powerlaw)
The results obtained from our spectral fitting are quoted in Table LABEL:tab:all_obs. From the spectral fitting, we found that the variation of spectral slope of the primary continuum () is in the range of 1.0 to 1.9, whereas for the soft excess, the slope () varies in the range of 3.3 to 5.3. Corresponding luminosity for primary continuum () varies from 43.8 to 44.3 and for soft excess () varies from 43.6 to 44.5. The details of the parameter variations are presented in Table LABEL:tab:all_obs. In Figure 10, we presented the correlation between the normalised intrinsic luminosities of soft-excess and primary continuum , where is the Eddington luminosity (45.40; see Table 1) for this source and the corresponding correlation coefficients are presented in Table 3.
1H 0419–577 is a well-known nearby (z=0.104) Seyfert 1 AGN that has been observed with almost all X-ray observatories. This AGN shows complex X-ray broad-band spectrum (Page et al., 2002; Walton et al., 2010): strong soft-excess below 2 keV, reflection hump above 10 keV and an Fe Kα line near 6 keV (Pal & Dewangan, 2013; Walton et al., 2010). The estimated mass of the SMBH, harboured in its nucleus, is M⊙(O’Neill et al., 2005).
XMM-Newton and Swift/XRT observed 1H 0419–577 in multiple epochs in nearly regular intervals from 2002 to 2018. The details of the observation log are given in Table A. The details of the procedure followed for spectral fitting of the data are described in Section 3. We added a Gaussian component as zGauss with the (powerlaw+powerlaw) model while fitting. The composite model for this source is:
TBabs*zTBabs*(powerlaw+powerlaw+zGauss)
The zGauss component was used to take care of the Fe Kα line near 6.4 keV with z=0.104. We found the Fe Kα line at keV with width = eV. The spectral fitting results are shown in Table LABEL:tab:all_obs. From the spectral analysis, we found that the spectral slope for the primary continuum () varies from 1.0 to 2.3 and the spectral slope for the soft-excess component () varies from 2.6 to 6.7. We also calculated the luminosities corresponding to each spectral component. The luminosity of the primary continuum () varies from 44.5 to 45.0 and for the soft excess, it () varies from 44.1 to 44.9. The details of the parameter variations are presented in Table LABEL:tab:all_obs and the variations of normalised intrinsic luminosities of soft-excess and primary continuum are shown in Figure 10. As the intrinsic luminosities of soft-excess and the primary continuum are correlated to each other, we calculated the correlation coefficients using different methods which are presented in Table 3.
1H 0707–495 is a low redshift (z=0.04) narrow-line Seyfert 1 (NLS1) galaxy, which has extreme variability (Turner et al., 1999; Boller et al., 2002) and spectral shape with a strong soft-excess and relativistic broad iron emission line (Fabian et al., 2009). This was the first AGN where an X-ray reverberation lag was detected (Fabian et al., 2009) and this lag was shown to have a strong Fe line feature in the lag-energy spectrum (Kara et al., 2013). We adopted the black hole mass as M⊙ from (Zhou & Wang, 2005).
1H 0707–495 was observed with XMM-Newton and Swift/XRT multiple times over a period of 20 years (Table A). We analysed these observations using a composite model which reads in XSPEC as,
TBabs*zTBabs*(powerlaw+powerlaw+zGauss).
The details of the spectral fitting procedure are discussed in Section 3. The zGauss component was used for the broad Fe Kα line detected at keV with a line width () of eV for z=0.04. In Table LABEL:tab:all_obs, we represent the spectral fitting results. We found the variation of the spectral slope for primary continuum () from 1.0 to 3.5 and the spectral slope for soft-excess () from 3.5 to 7.0. Corresponding luminosities vary from 42.1 to 43.2 and 42.3 to 44.3 for the primary continuum () and soft-excess (), respectively. The correlation between these two intrinsic luminosities (normalised by Eddington luminosity ) are also plotted in Figure 10 with linear interpolation. Corresponding correlation coefficients, using different methods, are also shown in Table 3.
3C 382 is a nearby (z=0.058) broad-line radio-loud AGN having a supermassive black hole of mass M⊙ (Fausnaugh et al., 2017). In the X-ray regime, this source has a strong soft-excess and (Wozniak et al., 1998; Grandi et al., 2001) showed that the soft-excess can not be explained by extended thermal emission.
3C 382 have been observed with XMM-Newton and Swift/XRT from 2008 to 2021. For the spectral analysis, we used the composite model as,
TBabs*zTBabs*(powerlaw+powerlaw+zGauss).
The component zGauss was used to fit the Fe Kα line at keV with a width of eV for z=0.058. The details of the spectral fitting procedure are discussed in Section 3 and the results obtained from fitting the data with the composite model are presented in Table LABEL:tab:all_obs. From Table LABEL:tab:all_obs, it can be seen that the variations of spectral indices for the primary continuum () and the soft-excess () are from 1.2 to 1.8 and 1.5 to 3.6, respectively. The primary continuum luminosity () is found to vary from 43.5 to 44.7, whereas the soft-excess () varies from 43.7 to 44.4. The correlation between the intrinsic normalised luminosities of the primary continuum () and the soft-excess () is shown in Figure 10 with linear interpolation. The correlation coefficients, calculated from the different methods, are represented in Table 3.
3C 390.3 is a radio-loud Seyfert 1 nearby (z=0.056) AGN (Afanasiev et al., 2015). However, from timing analysis, this source is classified as a radio-quiet Seyfert and it was found that there is no noticeable contribution from the jet to the X-ray emission (Sambruna et al., 2009). In the X-ray regime, detection of soft-excess below 2 keV and narrow Fe lines are reported from XMM-Newton observations of the source (Sambruna et al., 2009). Later, from the modelling of Fe lines and ionized reflection, it is shown that the source is ambiguous in broad-line radio galaxies (Tombesi et al., 2013). The mass of the central black hole is estimated as M⊙ (Sergeev et al., 2011).
For this work, we considered XMM-Newton and Swift/XRT observations of this source. XMM-Newton observed the source twice in 2010 (Table A) and we binned the Swift/XRT observation into three bins (Table A). We used
TBabs*zTBabs*(powerlaw+powerlaw+zGauss)
as the composite model to analyse the X-ray spectrum of this source. Considering the redshift of the source =0.056, the component zGauss was used to take care of the Fe-line at keV with a line width of eV. The detailed procedure of spectral analysis is described in Section 3 and the powerlaw+powerlaw model-fitted results are presented in Table LABEL:tab:all_obs. The power-law index for the primary continuum () varies from 1.0 to 1.6 and the corresponding luminosity () varies from 44.0 to 44.8. Similarly, the power-law index for the soft-excess () varies from 1.9 to 3.9 and the corresponding luminosity () varies from 43.6 to 44.8. The correlation between these two luminosities is shown in Figure=10. Here, we normalised the primary continuum and soft excess luminosities using the Eddington luminosity of this source. We also calculated the correlation coefficients using various methods and presented in Table 3.
Ark 120 is a nearby (z=0.0327) Seyfert 1 AGN, which has a ‘bare’ nucleus (Crenshaw et al., 1999; Vaughan et al., 2004). The results obtained from a detailed study on this source (Nandi et al., 2021) are used in the present work. We considered all X-ray observations of this source from XMM-Newton, Swift/XRT, and Suzaku. The powerlaw+powerlaw model fitted results are presented in Table 3 of (Nandi et al., 2021). We found the power-law index for primary continuum () varies from 1.6 to 2.1 and the variation of corresponding luminosity () is from 43.8 to 45.4. The power-law index for the soft-excess () is found to vary from 2.5 to 4.2 and the corresponding luminosity () varies from 43.2 to 45.6. The variation of these two luminosities are plotted in Figure 10 and the correlation between them is shown by a blue dotted line in the same plot. We calculated the correlations of these two luminosities using different algorithms and the corresponding values of correlation coefficients are given in the Table 3.
Ark 564 is an X-ray bright narrow-line Seyfert 1 AGN located at z=0.0247 with 3 to 10 keV luminosity of erg.s-1 (Turner et al., 2001). This source is a rapid variable source in the X-ray domain with a strong soft excess and a steep spectrum in 0.5 to 10.0 keV band (Turner et al., 1999, 2001). From the analysis of XMM-Newton observations of this source, (Sarma et al., 2015) showed that this high-Eddington NLS1 exhibits a prominent correlation between the spectral slope and flux. We considered the mass of the central black hole of this object as M⊙.
XMM-Newton and Swift/XRT observed Ark 564 multiple times from 2000 to 2018. The details of the observation log are given in Table A. The details of the spectral fitting procedure of the X-ray data are described in Section 3. For the spectral fitting, we used the model which reads in XSPEC as:
TBabs*zTBabs*(powerlaw+powerlaw)
The power-law indices for primary continuum and soft-excess are presented in Table LABEL:tab:all_obs. From the spectral fitting, we found that the power-law index for the primary continuum () varies from 1.0 to 2.6 and the corresponding luminosity () varies from 43.2 to 43.9. The index for the soft-excess () is found to vary from 3.8 to 4.7 and the corresponding luminosity () varies from 42.9 to 43.9. The variation of these two luminosities are plotted in Figure 10 and the correlation is shown by a blue dotted line in the figure. We also calculated correlations between these two luminosities using different algorithms and the corresponding values of correlation coefficients are given in Table 3.
Fairall 9 (Fairall, 1977) is a nearby (z=0.047) Seyfert 1 AGN with a central black hole of mass M⊙ (Peterson et al., 2004). Several X-ray studies suggested that this source has low extinction and is free from warm absorbers around the central region (Emmanoulopoulos et al., 2011). The persistent nature of different spectral components of this source suggests a clear view of the inner flow around its central engine (Lohfink et al., 2016).
Fairall 9 has been observed by almost all X-ray missions and we considered data from the XMM-Newton and Swift/XRT observations of the source for our analysis. From the spectral analysis, we found a strong soft-excess below 2 keV, low Hydrogen column density along the line of sight and Fe Kα line near 6.4 keV. The details of the observations are given in Table A and the spectral analysis procedures followed in our analysis are discussed in Section 3. For the spectral analysis, we used the composite model as,
TBabs*zTBabs*(powerlaw+powerlaw+zGauss)
where, the component zGauss was used for the Fe line at keV with width of eV. The power-law indices obtained from our fitting the data with the powerlaw+powerlaw model are given in Table LABEL:tab:all_obs. We found that the power-law index for the primary continuum is nearly constant at , whereas for soft excess, the index varies from 1.5 to 3.6. We calculated the luminosities of these components and their correlation is plotted in Figure 10. The luminosity of the primary continuum () varies from 43.5 to 44.7, whereas the soft excess luminosity () varies between 43.7 and 44.9. The correlation coefficients of these luminosities, calculated from different methods, are presented in Table 3.
IRAS 13224–3809 is a radio-quiet narrow-line Seyfert 1 AGN, located at , with a central black hole of mass M⊙ (Alston et al., 2019). This is an X-ray bright AGN, considered one of the most variable Seyfert in X-ray band (Boller et al., 2003; Dewangan et al., 2002; Jiang et al., 2018; Pinto et al., 2018). From the X-ray data analysis, it was found that the X-ray source is located at from the central black hole (Emmanoulopoulos et al., 2014).
IRAS 13224–3809 was observed with the XMM-Newton and Swift observatories multiple times from 2010 to 2016. (Alston et al., 2019) used the XMM-Newton data and found a piece of strong evidence for the non-stationary variability in the X-ray band. We used both XMM-Newton and Swift/XRT data (Table A) in this work. For the X-ray spectral analysis, we used the composite model as,
TBabs*zTBabs*(powerlaw+powerlaw)gabs,
where, the component gabs was used for the absorption line at keV with a width of eV, as reported by (Jiang et al., 2018). The detailed spectral analysis is discussed in Section 3 and the powerlaw+powerlaw model fitting to the X-ray spectra are presented in Table LABEL:tab:all_obs. We found that the variation of power-law indices for primary continuum () and soft-excess () are from 1.1 to 2.8 and 4.5 to 6.7, respectively and corresponding luminosities vary from 42.7 to 43.5 for primary continuum () and from 43.2 to 44.1 for soft-excess (). The correlation between and is plotted in Figure 10 and corresponding correlation coefficients from different algorithms are presented in Table 3.
Mrk 1018 is a Seyfert AGN which is mostly popular for its changing-look behaviour. It changed its behaviour from Seyfert 1.9 to Seyfert 1 between 1979 and 1984 (Cohen et al., 1986) and then returned to its previous state in 2015 (McElroy et al., 2016). The AGN is located at a redshift of =0.0424 and the central black hole mass is estimated as (Ezhikode et al., 2017).
Mrk 1018 was observed with XMM-Newton and Swift/XRT at multiple epochs. The details of the observation log are given in Table A. We used the composite model
TBabs*zTBabs*(powerlaw+powerlaw)
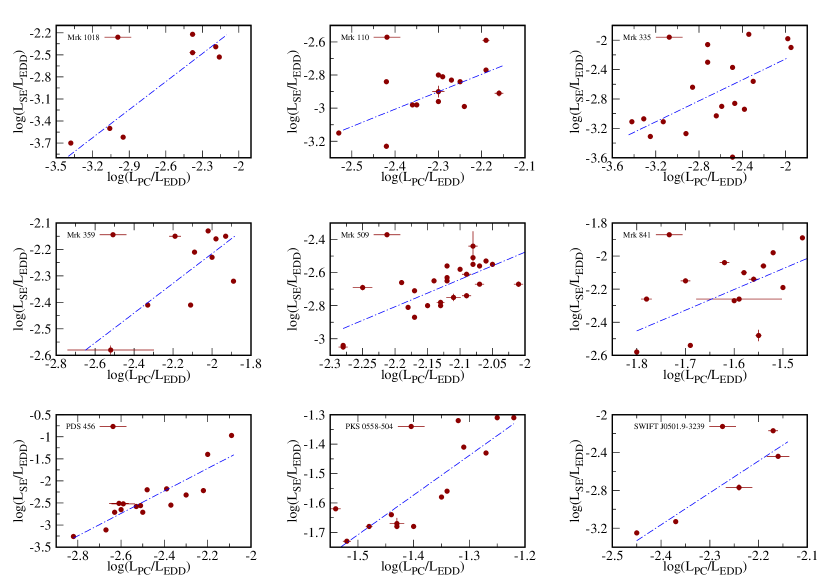
to fit the X-ray spectra of this source. The details of the spectral fitting procedure are described in Section 3 and the corresponding results are shown in Table LABEL:tab:all_obs. We found that the variation of power law indices for the primary continuum and the soft-excess from 1.0 to 1.5 and 2.2 to 3.0 respectively and the corresponding luminosities variation are 42.6 to 43.8 for primary continuum and 42.2 to 43.7 for soft-excess ). In Figure 11, we have presented the correlation between the normalised intrinsic luminosities of soft-excess and primary continuum and the corresponding correlation coefficients are presented in Table 3.
Mrk 110 is an X-ray bright radio-quiet narrow-line Seyfert 1 AGN located at =0.0353 with a central black hole of mass M⊙ (Liu et al., 2017). From the studies of the variabilities of Hydrogen and Helium lines, (Kollatschny, 2004) established the connection between the broad-line region (BLR) and accretion disc. From the X-ray studies, it was found that the soft-excess part (below 2 keV) is nearly absorption-free and moderately broad O VII and Fe Kα emission lines are present in the X-ray spectrum (Porquet et al., 2021).
Mrk 110 have been observed by XMM-Newton in 2019 and 2020 and by Swift/XRT in the period of 2010 to 2021 and nearly continuous from 2014 to 2021 (Table A). We analysed the X-ray spectra from these observations using the composite model:
TBabs*zTBabs*(powerlaw+powerlaw+zGauss)
where, the component zGauss was used to take care of the Fe Kα line which was found at keV with a width of eV. The powerlaw+powerlaw fitted results are presented in Table LABEL:tab:all_obs. The details descriptions of spectral fitting are discussed in Section 3. The power-law indices for the primary continuum and the soft-excess vary from 1.5 to 1.7 and 2.8 to 4.4, respectively. We calculated corresponding luminosities for the primary continuum and soft-excess , which vary from 43.8 to 44.2 and 43.1 to 43.6, respectively. The correlation between these two luminosities are plotted in Figure 11 and the correlation coefficients are quoted in Table 3.
Mrk 335 is a nearby (z=0.026) narrow-line Seyfert 1 AGN with a black hole mass of M⊙ (Grier et al., 2012). This source is popular for its extraordinary variation between high and low flux states in X-ray bands. Initially, it was known to be an X-ray bright source (Halpern, 1982). However, the X-ray intensity suddenly dropped from the brightest stage to the very low flux level in 2007 (Grupe et al., 2007) and after that, the source remained mostly in a low flux state. In this low state, however, the source shows some X-ray flaring activities (Gallo, 2018).
XMM-Newton and Swift/XRT observed Mrk 335 multiple times in the period from 2006 to 2020. The details of the observation log are given in Table A. From X-ray studies, it was found that this source has a bare nucleus with strong soft-excess emission (Longinotti et al., 2008), complex absorption features (Longinotti et al., 2013) and Fe Kα emission line (Keek & Ballantyne, 2016). We used the composite model as,
TBabs*zTBabs*(powerlaw+powerlaw+zGauss)gabs
to fit the overall X-ray spectra of Mrk 335. The components zGauss and gabs were used for the Fe Kα line at keV with a width of eV and an absorption line which was found at keV with a width of eV, respectively. The detailed spectral fitting procedure is described in Section 3 and the results obtained from the spectral fitting of the data with the powerlaw+powerlaw model are quoted in Table LABEL:tab:all_obs. From the spectral fitting, we found that the power-law indices for the primary continuum and soft-excess vary from 0.5 to 2.0 and 3.5 to 6.5, respectively and corresponding luminosities for the primary continuum and soft-excess vary from 42.1 to 43.6 and 41.9 to 43.6, respectively. The variations of normalised intrinsic luminosities ( vs ) are plotted in Figure 11. Corresponding correlation coefficients, calculated from different algorithms, are shown in Table 3.
Mrk 359 is a nearby (0.0174) narrow line Seyfert 1 AGN where the width of the broad emission line was reported to be smaller than 2000 km/s (Elvis et al., 1992). From the X-ray data analysis, (O’Brien et al., 2001) first reported the presence of prominent soft-excess below 2 keV without any significant neutral/warm intrinsic absorption along the line of sight. Besides this, a neutral Fe line of equivalent width eV was also reported via X-ray data analysis. From the X-ray variability study, (Middei et al., 2020) estimated the mass of the central object of this source as M⊙.
Mrk 359 have been observed with XMM-Newton and Swift/XRT multiple times between 2000 to 2019 (Table A). For the spectral analysis of X-ray data from the XMM-Newton and Swift/XRT observations, we used
TBabs*zTBabs*(powerlaw+powerlaw)
as a composite model. We followed the same procedure, as described in Section 3, to fit the data. The result obtained from the spectral fitting is presented in Table LABEL:tab:all_obs. Our spectral fitting indicates that the source was nearly in the same state throughout the observational period. We found that the power-law index for the primary continuum () varies from 1.0 to 1.7 and the corresponding luminosity () varies from 42.1 to 42.8, whereas the power-law index for the soft-excess () varies from 2.2 to 3.4 and the corresponding luminosity () varies from 42.1 to 42.5. The variation of these two luminosities are plotted in Figure 11. We also calculated the correlations of these two luminosities from different algorithms and the corresponding values of correlation coefficients are given in Table 3.
Mrk 509 is a well-studied nearby (z=0.0344) Seyfert 1 AGN which is powered by a central black hole of mass M⊙ (Peterson et al., 2004). The soft-excess emission below 2 keV was first identified by Singh et al. (1985). An iron line was detected in the X-ray spectrum (Morini et al., 1987) which led to a detailed discussion of reflection features by Pounds et al. (1994).
In this work, we used the archival data of Mrk 509 from the XMM-Newton and Swift/XRT observations (Table A). The data extraction procedures are described in Section 2.2 and the procedure for spectral fitting is discussed in Section 3. To fit the overall spectrum, we used the composite model as,
TBabs*zTBabs*(powerlaw+powerlaw+zGauss)
The component zGauss was used for the Fe Kα line at keV with a width of eV. The powerlaw+powerlaw fitted results are presented in Table LABEL:tab:all_obs. From the spectral fitting, we found that the variation of power-law indices for primary continuum and soft-excess vary from 1.0 to 1.8 and 1.7 to 4.3, respectively. Corresponding luminosities for the primary continuum and the soft-excess vary from 44.0 to 44.3 and 43.2 to 43.8, respectively. The variations of normalised intrinsic luminosities ( vs ) are plotted in Figure 11 and the corresponding correlation coefficients, calculated from the different algorithms, are shown in Table 3.
Mrk 841 is a nearby (z=0.00364) Seyfert 1 AGN which is known for its large spectral variability (George et al., 1993). This is the first object where a soft-excess (Arnaud et al., 1985) was observed along Mrk 509. A variable Fe line was reported by (George et al., 1993). From the UV/X-ray observations, (Ross et al., 1992) found that this source is a face-on source with a central black hole of mass M⊙. Recently, Mehdipour et al. (2023) reported a substantial decrement in the soft-excess band compared to its harder counterpart over the last 15 years.
Mrk 841 has been observed 5 times during 3 different periods (January 2001, January 2005 and July 2005) with XMM-Newton and multiple times with Swift/XRT from 2007 to 2021. the details of the observations are given in Table A. We used the composite model as,
TBabs*zTBabs*(powerlaw+powerlaw+zGauss)
to fit the X-ray spectra of this source. The zGauss component was used for the Fe-line at keV with a width of eV. The detailed spectral analysis is discussed in Section 3 and the powerlaw+powerlaw fitting results are presented in Table LABEL:tab:all_obs. We found that the variation of power-law indices for the primary continuum () and the soft-excess () are in the ranges of 1.0 to 2.0 and 2.0 to 4.8, respectively and corresponding luminosities vary in the range of 43.6 to 43.9 for primary continuum () and 42.2 to 43.6 for soft-excess (). The correlations between and are plotted in Figure 11 and the corresponding correlation coefficients from different algorithms are presented in Table 3.
PDS 456 is a radio-quiet AGN at a redshift of z=0.184 with a black hole mass of M⊙ (Nardini et al., 2015). This source is known for its ultra-fast wind with an outflow velocity of (Boissay-Malaquin et al., 2019; Nardini et al., 2015). In the X-ray regime, the first flare was detected (Reeves & Turner, 2000) and later, rapid variability has also been observed in long observations with different X-ray observatories.
In this work, we used XMM-Newton and Swift/XRT observations of PDS 456. The observation details are given in Table A. For the X-ray spectral analysis, we used the composite model as,
TBabs*zTBabs*(powerlaw+powerlaw+zGauss),
where, the component zGauss was used for the Fe line at keV with a width of eV. The spectral analysis procedure followed in this work is discussed in Section 3 and the results obtained from the powerlaw+powerlaw fitting are represented in Table LABEL:tab:all_obs. We found that the variations of power-law indices for the primary continuum () and the soft-excess () are from 1.6 to 2.3 and 2.0 to 7.3, respectively and the corresponding luminosity variations are from 44.6 to 45.2 for the primary continuum () and 44.0 to 46.3 for the soft-excess (). The correlation between and is plotted in Figure 11 and the corresponding correlation coefficients obtained from different algorithms are represented in Table 3.
PKS 0558–504 (z=0.137) is a radio-loud narrow-line Seyfert 1 AGN whose spectrum is similar to that of radio-quiet narrow-line Seyfert 1 galaxies (Komossa et al., 2006). Radio observations (VLA) of the AGN revealed the two-sided radio structure (Doi et al., 2012). Multiwavelength observations constrained the central black hole mass to M⊙ (Gliozzi et al., 2010). From the spectral energy distribution (SED) of PKS 0550-504, it was reported that the SED is mostly dominated by optical-UV photons and the jet emission does not dominate beyond the radio band (Gliozzi et al., 2010).
PKS 0558–504 was observed with XMM-Newton and Swift/XRT multiple times from 2000 to 2016 (see Table A). We analysed these observations using the composite model,
TBabs*zTBabs*(powerlaw+powerlaw)
The details of the spectral fitting procedure are given in Section 3. The spectral analysis results are represented in Table LABEL:tab:all_obs. Here, we found that the variation of the power-law index for primary continuum is in the range of 1.8 to 2.2 and for the soft excess , it varies in the range of 3.43 to 5.17. Corresponding luminosity variations are in the range of 45.0 to 46.0 and 44.0 to 45.8 for primary continuum () and soft-excess (), respectively. The variation of normalised intrinsic luminosities are plotted ( vs ) in Figure 11 and the corresponding correlation coefficients, calculated from the different algorithms, are shown in Table 3.
SWIFT J0501.9–3239 (also known as ESO 362-G18 or MCG 05-13-17) is a nearby (z=0.0124) Seyfert AGN which is popular for its short-timescale spectral variability (Agís-González et al., 2014). It was reported that this source hosts an extremely spinning supermassive black hole with a mass of M⊙ (Agís-González et al., 2014). It was also reported that the X-ray emission region is located within (where ) (Agís-González et al., 2014).
For this work, we used data from the XMM-Newton and Swift/XRT observations of the source. The details of the observations are given in Table A and the data reduction procedure is discussed in Section 2.2. For the spectral fitting, we used the composite model as,
TBabs*zTBabs*(powerlaw+powerlaw+zGauss),
where, the component zGauss was used for the Fe line at keV with a width of eV. The detailed spectral analysis is discussed in Section 3 and the powerlaw+powerlaw fitting results are represented in Table LABEL:tab:all_obs. We found that the variation of power-law indices for the primary continuum () and soft-excess () are in the range of 1.0 to 1.3 and 2.4 to 4.9, respectively and the corresponding luminosity variation are 42.6 to 42.8 for primary continuum () and 41.7 to 42.9 for soft-excess (). The correlations between the luminosities and are plotted in Figure 11 and the corresponding correlation coefficients from different algorithms are represented in Table 3.
NGC 7469 is a well-studied nearby (z=0.0163) Seyfert 1 AGN which is most popular for its variability and excess brightness in X-ray domain (Markowitz & Edelson, 2004). This source shows wavelength-dependent continuum delays of several light days, which indicates the presence of an accretion disk around the central black hole (Collier et al., 1998) and the reverberation mapping results in a black hole mass estimation of M⊙ (Peterson et al., 2004).
As NGC 7469 is a popular source in the X-ray domain, it is observed in almost all X-ray missions. For this work, we considered only the XMM-Newton and Swift/XRT observations. The details of the observations are given in Table A and the data extraction procedure is described in Section 2.2. We used the composite model as,
TBabs*zTBabs*(powerlaw+powerlaw+zGauss),
to fit the X-ray spectra of this source and the fitting procedure are described in Section 2.2. The component zGauss was used to fit the Fe Kα line at keV with a width of eV. The powerlaw+powerlaw fitted results are represented in Table LABEL:tab:all_obs. From the spectral fitting, we found that the power-law indices for the primary continuum and the soft-excess vary from 1.2 to 2.0 and 1.1 to 4.3, respectively and the corresponding luminosities for the primary continuum and soft-excess vary from 43.0 to 44.0 and 42.5 to 43.1, respectively. The variation of the normalised intrinsic luminosities are plotted ( vs ) in Figure 12 and the corresponding correlation coefficients, calculated from the different algorithms, are shown in Table 3.
Ton S180 or Tonantzinta S180 is a local (z=0.062) narrow line Seyfert 1 AGN which is considered one of the prototypes ‘bare’ AGN with no trace of absorption and a featureless and prominent soft-excess (Vaughan et al., 2002). From Suzaku observations, Takahashi et al. (2010) also suggested the presence of an intriguing hard excess in the 15–55 keV range for this source. The X-ray spectrum of this source contains a strong soft-excess (Vaughan et al., 2002), a broad Fe K emission line and hard X-ray emission up to 30 keV (Nardini et al., 2012). From the XMM-Newton observation, Parker et al. (2018) suggested that the X-ray spectrum favoured two Comptonization components with a reflection component from a disc around a black hole of low spin. Turner et al. (2002) estimated the mass of the central black hole as M⊙.
Ton S180 have been observed with XMM-Newton and Swift/XRT in multiple times (Table A). We used the composite model as,
TBabs*zTBabs*(powerlaw+powerlaw+zGauss)
to fit the X-ray spectra of this source. The zGauss component was used for the Fe-line at keV with a width of eV. The detailed spectral analysis is discussed in Section 3 and the powerlaw+powerlaw fitting results are presented in Table LABEL:tab:all_obs. We found that the variation of power-law indices for primary continuum () and soft-excess () are in the ranges of 1.0 to 2.1 and 1.68 to 4.1, respectively and the corresponding luminosity variation are in the ranges of 43.6 to 43.9 for primary continuum () and 43.5 to 43.9 for soft-excess (). The correlation between the luminosities ( and ) is plotted in Figure 12 and the corresponding correlation coefficients from different algorithms are presented in Table 3.
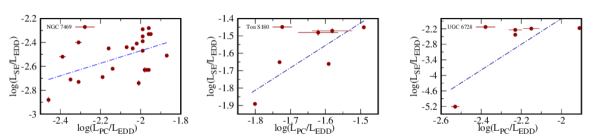
UGC 6728 is a local (z=0.067) Seyfert 1.2 AGN which is yet to be explored. This source has an ultra-hard X-ray tail (14-195 keV) explored by (García-Bernete et al., 2019). We adopted the black hole mass of the central region as M⊙ (Bentz et al., 2016).
XMM-Newton observed UGC 6758 once in 2006 and Swift/XRT observed the AGN multiple times from 2016 to 2021. The observation details are given in Table A and the data reduction procedure is discussed in Section 3. To fit the X-ray spectral data, we used
TBabs*zTBabs*(powerlaw+powerlaw)
as a composite model and the results are presented in Table LABEL:tab:all_obs. The power-law index for the primary continuum () varies from 1.0 to 1.7 and the corresponding luminosity () varies from 43.7 to 44.1. Similarly, the power-law index for soft-excess () varies from 2.8 to 4.6 and the corresponding luminosity () varies from 42.6 to 44.0. The correlation between these two luminosities is shown in Figure 12. Here we used normalised luminosity using the Eddington luminosity of the source. We also calculated the correlation coefficients using various methods and presented them in Table 3.
| 1H 0323+342 | ||||||||
|---|---|---|---|---|---|---|---|---|
| Instrument | MJD | |||||||
| (erg/s) | (erg/s) | |||||||
| XMM-Newton | 57257 | |||||||
| XMM-Newton | 58344 | |||||||
| XMM-Newton | 58348 | |||||||
| XMM-Newton | 58350 | |||||||
| XMM-Newton | 58354 | |||||||
| XMM-Newton | 58366 | |||||||
| XMM-Newton | 58370 | |||||||
| Swift/XRT | 54381 | |||||||
| Swift/XRT | 54627 | |||||||
| Swift/XRT | 55043 | |||||||
| Swift/XRT | 55513 | |||||||
| Swift/XRT | 55835 | |||||||
| Swift/XRT | 55958 | |||||||
| Swift/XRT | 56436 | |||||||
| Swift/XRT | 57002 | |||||||
| Swift/XRT | 57309 | |||||||
| Swift/XRT | 58384 | |||||||
| Swift/XRT | 58798 | |||||||
| 1H 0419-577 | ||||||||
| Instrument | MJD | |||||||
| (erg/s) | (erg/s) | |||||||
| XMM-Newton | 52542 | |||||||
| XMM-Newton | 52635 | |||||||
| XMM-Newton | 52728 | |||||||
| XMM-Newton | 52815 | |||||||
| XMM-Newton | 52898 | |||||||
| XMM-Newton | 53518 | |||||||
| XMM-Newton | 53520 | |||||||
| XMM-Newton | 58254 | |||||||
| XMM-Newton | 58435 | |||||||
| Swift/XRT | 54771 | |||||||
| Swift/XRT | 56460 | |||||||
| Swift/XRT | 57179 | |||||||
| Swift/XRT | 57902 | |||||||
| 1H 0707-495 | ||||||||
| Instrument | MJD | |||||||
| (erg/s) | (erg/s) | |||||||
| XMM-Newton | 52560 | |||||||
| XMM-Newton | 54234 | |||||||
| XMM-Newton | 54236 | |||||||
| XMM-Newton | 54494 | |||||||
| XMM-Newton | 54496 | |||||||
| XMM-Newton | 54498 | |||||||
| XMM-Newton | 54500 | |||||||
| XMM-Newton | 55091 | |||||||
| XMM-Newton | 55458 | |||||||
| Swift/XRT | 55425 | |||||||
| Swift/XRT | 55607 | |||||||
| Swift/XRT | 58178 | |||||||
| 3C 382 | ||||||||
| Instrument | MJD | |||||||
| (erg/s) | (erg/s) | |||||||
| XMM-Newton | 54584 | |||||||
| XMM-Newton | 57629 | |||||||
| XMM-Newton | 57642 | |||||||
| XMM-Newton | 57653 | |||||||
| XMM-Newton | 57653 | |||||||
| XMM-Newton | 57678 | |||||||
| Swift/XRT | 56644 | |||||||
| Swift/XRT | 57660 | |||||||
| Swift/XRT | 59370 | |||||||
| 3C 390.3 | ||||||||
| Instrument | MJD | |||||||
| (erg/s) | (erg/s) | |||||||
| XMM-Newton | 53286 | |||||||
| XMM-Newton | 53295 | |||||||
| Swift/XRT | 54630 | |||||||
| Swift/XRT | 56437 | |||||||
| Swift/XRT | 59321 | |||||||
| Ark 564 | ||||||||
| Instrument | MJD | |||||||
| (erg/s) | (erg/s) | |||||||
| XMM-Newton | 51712 | |||||||
| XMM-Newton | 52069 | |||||||
| XMM-Newton | 53375 | |||||||
| XMM-Newton | 53705 | |||||||
| XMM-Newton | 53711 | |||||||
| XMM-Newton | 53717 | |||||||
| XMM-Newton | 53723 | |||||||
| XMM-Newton | 53729 | |||||||
| XMM-Newton | 53737 | |||||||
| XMM-Newton | 53741 | |||||||
| XMM-Newton | 53743 | |||||||
| XMM-Newton | 53753 | |||||||
| XMM-Newton | 53755 | |||||||
| Swift/XRT | 53596 | |||||||
| Swift/XRT | 56784 | |||||||
| Swift/XRT | 57164 | |||||||
| Swift/XRT | 57631 | |||||||
| Swift/XRT | 57991 | |||||||
| Swift/XRT | 58360 | |||||||
| Swift/XRT | 58725 | |||||||
| Swift/XRT | 59091 | |||||||
| Swift/XRT | 59330 | |||||||
| Fairall 9 | ||||||||
| Instrument | MJD | |||||||
| (erg/s) | (erg/s) | |||||||
| XMM-Newton | 51730 | |||||||
| XMM-Newton | 55174 | |||||||
| XMM-Newton | 56645 | |||||||
| XMM-Newton | 56659 | |||||||
| XMM-Newton | 56786 | |||||||
| Swift/XRT | 54719 | |||||||
| Swift/XRT | 56527 | |||||||
| Swift/XRT | 56804 | |||||||
| Swift/XRT | 57098 | |||||||
| Swift/XRT | 58303 | |||||||
| Swift/XRT | 58420 | |||||||
| Swift/XRT | 58553 | |||||||
| Swift/XRT | 58678 | |||||||
| Swift/XRT | 58791 | |||||||
| Swift/XRT | 58030 | |||||||
| IRAS 13224-3809 | ||||||||
| Instrument | MJD | |||||||
| (erg/s) | (erg/s) | |||||||
| XMM-Newton | 55761 | |||||||
| XMM-Newton | 55767 | |||||||
| XMM-Newton | 55771 | |||||||
| XMM-Newton | 57579 | |||||||
| XMM-Newton | 57581 | |||||||
| XMM-Newton | 57591 | |||||||
| XMM-Newton | 57593 | |||||||
| XMM-Newton | 57595 | |||||||
| XMM-Newton | 57599 | |||||||
| XMM-Newton | 57601 | |||||||
| XMM-Newton | 57603 | |||||||
| XMM-Newton | 57607 | |||||||
| XMM-Newton | 57609 | |||||||
| Swift/XRT | 55425 | |||||||
| Swift/XRT | 55607 | |||||||
| Swift/XRT | 57597 | |||||||
| Mrk 1018 | ||||||||
| Instrument | MJD | |||||||
| (erg/s) | (erg/s) | |||||||
| XMM-Newton | 53385 | |||||||
| XMM-Newton | 54685 | |||||||
| XMM-Newton | 58322 | |||||||
| XMM-Newton | 58487 | |||||||
| Swift/XRT | 53587 | |||||||
| Swift/XRT | 54776 | |||||||
| Swift/XRT | 58285 | |||||||
| Mrk 110 | ||||||||
| Instrument | MJD | |||||||
| (erg/s) | (erg/s) | |||||||
| XMM-Newton | 53320 | |||||||
| XMM-Newton | 58790 | |||||||
| XMM-Newton | 58792 | |||||||
| XMM-Newton | 58794 | |||||||
| XMM-Newton | 58804 | |||||||
| XMM-Newton | 58945 | |||||||
| Swift/XRT | 55932 | |||||||
| Swift/XRT | 56753 | |||||||
| Swift/XRT | 57516 | |||||||
| Swift/XRT | 57849 | |||||||
| Swift/XRT | 58086 | |||||||
| Swift/XRT | 58131 | |||||||
| Swift/XRT | 58595 | |||||||
| Swift/XRT | 58766 | |||||||
| Swift/XRT | 59466 | |||||||
| Mrk 335 | ||||||||
| Instrument | MJD | |||||||
| (erg/s) | (erg/s) | |||||||
| XMM-Newton | 51903 | |||||||
| XMM-Newton | 53795 | |||||||
| XMM-Newton | 54291 | |||||||
| XMM-Newton | 54993 | |||||||
| XMM-Newton | 54995 | |||||||
| XMM-Newton | 57386 | |||||||
| XMM-Newton | 58429 | |||||||
| XMM-Newton | 58491 | |||||||
| XMM-Newton | 58844 | |||||||
| Swift/XRT | 54349 | |||||||
| Swift/XRT | 55148 | |||||||
| Swift/XRT | 55198 | |||||||
| Swift/XRT | 55937 | |||||||
| Swift/XRT | 56477 | |||||||
| Swift/XRT | 56841 | |||||||
| Swift/XRT | 57391 | |||||||
| Swift/XRT | 58120 | |||||||
| Swift/XRT | 58667 | |||||||
| Mrk 359 | ||||||||
| Instrument | MJD | |||||||
| (erg/s) | (erg/s) | |||||||
| XMM-Newton | 51734 | |||||||
| XMM-Newton | 55402 | |||||||
| XMM-Newton | 55406 | |||||||
| XMM-Newton | 58508 | |||||||
| XMM-Newton | 58559 | |||||||
| XMM-Newton | 58561 | |||||||
| XMM-Newton | 58564 | |||||||
| XMM-Newton | 58566 | |||||||
| Swift/XRT | 56119 | |||||||
| Swift/XRT | 58511 | |||||||
| Mrk 509 | ||||||||
| Instrument | MJD | |||||||
| (erg/s) | (erg/s) | |||||||
| XMM-Newton | 51842 | |||||||
| XMM-Newton | 52019 | |||||||
| XMM-Newton | 53659 | |||||||
| XMM-Newton | 53661 | |||||||
| XMM-Newton | 53663 | |||||||
| XMM-Newton | 53850 | |||||||
| XMM-Newton | 55119 | |||||||
| XMM-Newton | 55123 | |||||||
| XMM-Newton | 55127 | |||||||
| XMM-Newton | 55133 | |||||||
| XMM-Newton | 55137 | |||||||
| XMM-Newton | 55141 | |||||||
| XMM-Newton | 55145 | |||||||
| XMM-Newton | 55149 | |||||||
| XMM-Newton | 55153 | |||||||
| XMM-Newton | 55155 | |||||||
| Swift/XRT | 53828 | |||||||
| Swift/XRT | 54185 | |||||||
| Swift/XRT | 55127 | |||||||
| Swift/XRT | 57206 | |||||||
| Swift/XRT | 57454 | |||||||
| Swift/XRT | 57965 | |||||||
| Swift/XRT | 58325 | |||||||
| Swift/XRT | 58689 | |||||||
| Swift/XRT | 58949 | |||||||
| Swift/XRT | 59447 | |||||||
| Mrk 841 | ||||||||
| Instrument | MJD | |||||||
| (erg/s) | (erg/s) | |||||||
| XMM-Newton | 51922 | |||||||
| XMM-Newton | 51923 | |||||||
| XMM-Newton | 51924 | |||||||
| XMM-Newton | 53386 | |||||||
| XMM-Newton | 53568 | |||||||
| XMM-Newton | 57217 | |||||||
| Swift/XRT | 54101 | |||||||
| Swift/XRT | 57223 | |||||||
| Swift/XRT | 57640 | |||||||
| Swift/XRT | 57937 | |||||||
| Swift/XRT | 58299 | |||||||
| Swift/XRT | 58665 | |||||||
| Swift/XRT | 59210 | |||||||
| Swift/XRT | 59402 | |||||||
| PDS 456 | ||||||||
| Instrument | MJD | |||||||
| (erg/s) | (erg/s) | |||||||
| XMM-Newton | 54355 | |||||||
| XMM-Newton | 54357 | |||||||
| XMM-Newton | 56531 | |||||||
| XMM-Newton | 56550 | |||||||
| XMM-Newton | 56555 | |||||||
| XMM-Newton | 56714 | |||||||
| XMM-Newton | 57835 | |||||||
| XMM-Newton | 57837 | |||||||
| XMM-Newton | 58381 | |||||||
| XMM-Newton | 58750 | |||||||
| Swift/XRT | 55022 | |||||||
| Swift/XRT | 55250 | |||||||
| Swift/XRT | 57935 | |||||||
| Swift/XRT | 58374 | |||||||
| Swift/XRT | 58752 | |||||||
| Swift/XRT | 59445 | |||||||
| PKS 0558-504 | ||||||||
| Instrument | MJD | |||||||
| (erg/s) | (erg/s) | |||||||
| XMM-Newton | 51586 | |||||||
| XMM-Newton | 51688 | |||||||
| XMM-Newton | 51827 | |||||||
| XMM-Newton | 52086 | |||||||
| XMM-Newton | 52201 | |||||||
| XMM-Newton | 54718 | |||||||
| XMM-Newton | 54720 | |||||||
| XMM-Newton | 54722 | |||||||
| XMM-Newton | 54726 | |||||||
| Swift/XRT | 54740 | |||||||
| Swift/XRT | 54921 | |||||||
| Swift/XRT | 55105 | |||||||
| Swift/XRT | 55242 | |||||||
| Swift/XRT | 57711 | |||||||
| SWIFT J0501.9-3239 | ||||||||
| Instrument | MJD | |||||||
| (erg/s) | (erg/s) | |||||||
| XMM-Newton | 55225 | |||||||
| XMM-Newton | 57655 | |||||||
| Swift/XRT | 53686 | |||||||
| Swift/XRT | 54476 | |||||||
| Swift/XRT | 57853 | |||||||
| NGC 7469 | ||||||||
| Instrument | MJD | |||||||
| (erg/s) | (erg/s) | |||||||
| XMM-Newton | 51940 | |||||||
| XMM-Newton | 51941 | |||||||
| XMM-Newton | 53339 | |||||||
| XMM-Newton | 53076 | |||||||
| XMM-Newton | 57185 | |||||||
| XMM-Newton | 57350 | |||||||
| XMM-Newton | 57371 | |||||||
| XMM-Newton | 57379 | |||||||
| XMM-Newton | 57380 | |||||||
| XMM-Newton | 57382 | |||||||
| XMM-Newton | 57384 | |||||||
| Swift/XRT | 53899 | |||||||
| Swift/XRT | 54704 | |||||||
| Swift/XRT | 56528 | |||||||
| Swift/XRT | 56462 | |||||||
| Swift/XRT | 56491 | |||||||
| Swift/XRT | 56514 | |||||||
| Swift/XRT | 57286 | |||||||
| Swift/XRT | 57564 | |||||||
| Swift/XRT | 57991 | |||||||
| Swift/XRT | 58359 | |||||||
| Swift/XRT | 58676 | |||||||
| Swift/XRT | 59087 | |||||||
| Ton S180 | ||||||||
| Instrument | MJD | |||||||
| (erg/s) | (erg/s) | |||||||
| XMM-Newton | 51892 | |||||||
| XMM-Newton | 52455 | |||||||
| XMM-Newton | 57206 | |||||||
| XMM-Newton | 57552 | |||||||
| Swift/XRT | 57907 | |||||||
| Swift/XRT | 59339 | |||||||
| UGC 6728 | ||||||||
| Instrument | MJD | |||||||
| (erg/s) | (erg/s) | |||||||
| XMM-Newton | 53789 | |||||||
| Swift/XRT | 57579 | |||||||
| Swift/XRT | 58039 | |||||||
| Swift/XRT | 59097 | |||||||
| Swift/XRT | 59414 | |||||||
References
- Afanasiev et al. (2015) Afanasiev, V. L., Shapovalova, A. I., Popović, L. Č., & Borisov, N. V. 2015, MNRAS, 448, 2879, doi: 10.1093/mnras/stv210
- Agís-González et al. (2014) Agís-González, B., Miniutti, G., Kara, E., et al. 2014, MNRAS, 443, 2862, doi: 10.1093/mnras/stu1358
- Alston et al. (2019) Alston, W. N., Fabian, A. C., Buisson, D. J. K., et al. 2019, MNRAS, 482, 2088, doi: 10.1093/mnras/sty2527
- Arnaud (1996) Arnaud, K. A. 1996, in Astronomical Society of the Pacific Conference Series, Vol. 101, Astronomical Data Analysis Software and Systems V, ed. G. H. Jacoby & J. Barnes, 17
- Arnaud et al. (1985) Arnaud, K. A., Branduardi-Raymont, G., Culhane, J. L., et al. 1985, MNRAS, 217, 105, doi: 10.1093/mnras/217.1.105
- Bechtold et al. (1987) Bechtold, J., Czerny, B., Elvis, M., Fabbiano, G., & Green, R. F. 1987, ApJ, 314, 699, doi: 10.1086/165098
- Bennett et al. (2003) Bennett, C. L., Halpern, M., Hinshaw, G., et al. 2003, ApJS, 148, 1, doi: 10.1086/377253
- Bentz et al. (2016) Bentz, M. C., Batiste, M., Seals, J., et al. 2016, ApJ, 831, 2, doi: 10.3847/0004-637X/831/1/2
- Boissay et al. (2016) Boissay, R., Ricci, C., & Paltani, S. 2016, A&A, 588, A70, doi: 10.1051/0004-6361/201526982
- Boissay-Malaquin et al. (2019) Boissay-Malaquin, R., Danehkar, A., Marshall, H. L., & Nowak, M. A. 2019, ApJ, 873, 29, doi: 10.3847/1538-4357/ab0082
- Boller et al. (2003) Boller, T., Tanaka, Y., Fabian, A., et al. 2003, MNRAS, 343, L89, doi: 10.1046/j.1365-8711.2003.06790.x
- Boller et al. (2002) Boller, T., Fabian, A. C., Sunyaev, R., et al. 2002, MNRAS, 329, L1, doi: 10.1046/j.1365-8711.2002.05040.x
- Burrows et al. (2005) Burrows, D. N., Hill, J. E., Nousek, J. A., et al. 2005, Space Sci. Rev., 120, 165, doi: 10.1007/s11214-005-5097-2
- Caiazzo et al. (2019) Caiazzo, I., Belloni, T., Cackett, E., et al. 2019, Unveiling the secrets of black holes and neutron stars with high-throughput, high-energy resolution X-ray spectroscopy, Zenodo, doi: 10.5281/zenodo.3824441
- Chakrabarti & Titarchuk (1995) Chakrabarti, S., & Titarchuk, L. G. 1995, ApJ, 455, 623, doi: 10.1086/176610
- Chatterjee et al. (2017) Chatterjee, A., Chakrabarti, S. K., & Ghosh, H. 2017, MNRAS, 465, 3902, doi: 10.1093/mnras/stw2975
- Cohen et al. (1986) Cohen, R. D., Rudy, R. J., Puetter, R. C., Ake, T. B., & Foltz, C. B. 1986, ApJ, 311, 135, doi: 10.1086/164758
- Collier et al. (1998) Collier, S. J., Horne, K., Kaspi, S., et al. 1998, ApJ, 500, 162, doi: 10.1086/305720
- Crenshaw et al. (1999) Crenshaw, D. M., Kraemer, S. B., Boggess, A., et al. 1999, ApJ, 516, 750, doi: 10.1086/307144
- Crummy et al. (2006) Crummy, J., Fabian, A. C., Gallo, L., & Ross, R. R. 2006, MNRAS, 365, 1067, doi: 10.1111/j.1365-2966.2005.09844.x
- Czerny & Elvis (1987) Czerny, B., & Elvis, M. 1987, ApJ, 321, 305, doi: 10.1086/165630
- Czerny et al. (2003) Czerny, B., Nikołajuk, M., Różańska, A., et al. 2003, A&A, 412, 317, doi: 10.1051/0004-6361:20031441
- Dewangan et al. (2002) Dewangan, G. C., Boller, T., Singh, K. P., & Leighly, K. M. 2002, A&A, 390, 65, doi: 10.1051/0004-6361:20020689
- Doi et al. (2012) Doi, A., Nagira, H., Kawakatu, N., et al. 2012, ApJ, 760, 41, doi: 10.1088/0004-637X/760/1/41
- Done et al. (2012) Done, C., Davis, S. W., Jin, C., Blaes, O., & Ward, M. 2012, MNRAS, 420, 1848, doi: 10.1111/j.1365-2966.2011.19779.x
- Done et al. (2007) Done, C., Gierliński, M., & Kubota, A. 2007, A&A Rev., 15, 1, doi: 10.1007/s00159-007-0006-1
- Elvis et al. (1992) Elvis, M., Plummer, D., Schachter, J., & Fabbiano, G. 1992, ApJS, 80, 257, doi: 10.1086/191665
- Emmanoulopoulos et al. (2014) Emmanoulopoulos, D., Papadakis, I. E., Dovčiak, M., & McHardy, I. M. 2014, MNRAS, 439, 3931, doi: 10.1093/mnras/stu249
- Emmanoulopoulos et al. (2011) Emmanoulopoulos, D., Papadakis, I. E., McHardy, I. M., et al. 2011, MNRAS, 415, 1895, doi: 10.1111/j.1365-2966.2011.18834.x
- Evans et al. (2009) Evans, P. A., Beardmore, A. P., Page, K. L., et al. 2009, MNRAS, 397, 1177, doi: 10.1111/j.1365-2966.2009.14913.x
- Ezhikode et al. (2017) Ezhikode, S. H., Gandhi, P., Done, C., et al. 2017, MNRAS, 472, 3492, doi: 10.1093/mnras/stx2160
- Fabian et al. (2002) Fabian, A. C., Ballantyne, D. R., Merloni, A., et al. 2002, MNRAS, 331, L35, doi: 10.1046/j.1365-8711.2002.05419.x
- Fabian et al. (2017) Fabian, A. C., Lohfink, A., Belmont, R., Malzac, J., & Coppi, P. 2017, MNRAS, 467, 2566, doi: 10.1093/mnras/stx221
- Fabian et al. (2015) Fabian, A. C., Lohfink, A., Kara, E., et al. 2015, MNRAS, 451, 4375, doi: 10.1093/mnras/stv1218
- Fabian et al. (1989) Fabian, A. C., Rees, M. J., Stella, L., & White, N. E. 1989, MNRAS, 238, 729, doi: 10.1093/mnras/238.3.729
- Fabian et al. (2009) Fabian, A. C., Zoghbi, A., Ross, R. R., et al. 2009, Nature, 459, 540, doi: 10.1038/nature08007
- Fairall (1977) Fairall, A. P. 1977, MNRAS, 180, 391, doi: 10.1093/mnras/180.3.391
- Fausnaugh et al. (2017) Fausnaugh, M. M., Grier, C. J., Bentz, M. C., et al. 2017, ApJ, 840, 97, doi: 10.3847/1538-4357/aa6d52
- Fukumura et al. (2016) Fukumura, K., Hendry, D., Clark, P., Tombesi, F., & Takahashi, M. 2016, ApJ, 827, 31, doi: 10.3847/0004-637X/827/1/31
- Gabriel et al. (2004) Gabriel, C., Denby, M., Fyfe, D. J., et al. 2004, in Astronomical Society of the Pacific Conference Series, Vol. 314, Astronomical Data Analysis Software and Systems (ADASS) XIII, ed. F. Ochsenbein, M. G. Allen, & D. Egret, 759
- Gallo (2018) Gallo, L. 2018, in Revisiting Narrow-Line Seyfert 1 Galaxies and their Place in the Universe, 34. https://arxiv.org/abs/1807.09838
- García & Kallman (2010) García, J., & Kallman, T. R. 2010, ApJ, 718, 695, doi: 10.1088/0004-637X/718/2/695
- García et al. (2014) García, J., Dauser, T., Lohfink, A., et al. 2014, ApJ, 782, 76, doi: 10.1088/0004-637X/782/2/76
- García et al. (2019) García, J. A., Kara, E., Walton, D., et al. 2019, ApJ, 871, 88, doi: 10.3847/1538-4357/aaf739
- García-Bernete et al. (2019) García-Bernete, I., Ramos Almeida, C., Alonso-Herrero, A., et al. 2019, MNRAS, 486, 4917, doi: 10.1093/mnras/stz1003
- George & Fabian (1991) George, I. M., & Fabian, A. C. 1991, MNRAS, 249, 352, doi: 10.1093/mnras/249.2.352
- George et al. (1993) George, I. M., Nandra, K., Fabian, A. C., et al. 1993, MNRAS, 260, 111, doi: 10.1093/mnras/260.1.111
- Ghosh et al. (2011) Ghosh, H., Garain, S. K., Giri, K., & Chakrabarti, S. K. 2011, MNRAS, 416, 959, doi: 10.1111/j.1365-2966.2011.19090.x
- Gierliński & Done (2004) Gierliński, M., & Done, C. 2004, MNRAS, 349, L7, doi: 10.1111/j.1365-2966.2004.07687.x
- Gliozzi et al. (2010) Gliozzi, M., Papadakis, I. E., Grupe, D., et al. 2010, ApJ, 717, 1243, doi: 10.1088/0004-637X/717/2/1243
- Grandi et al. (2001) Grandi, P., Maraschi, L., Urry, C. M., & Matt, G. 2001, ApJ, 556, 35, doi: 10.1086/321546
- Grier et al. (2012) Grier, C. J., Peterson, B. M., Pogge, R. W., et al. 2012, ApJ, 755, 60, doi: 10.1088/0004-637X/755/1/60
- Grupe et al. (2007) Grupe, D., Komossa, S., & Gallo, L. C. 2007, ApJ, 668, L111, doi: 10.1086/523042
- Haardt & Maraschi (1991) Haardt, F., & Maraschi, L. 1991, ApJ, 380, L51, doi: 10.1086/186171
- Haardt & Maraschi (1993) —. 1993, ApJ, 413, 507, doi: 10.1086/173020
- Halpern (1982) Halpern, J. P. 1982, PhD thesis, Harvard University, Massachusetts
- Halpern (1984) —. 1984, ApJ, 281, 90, doi: 10.1086/162077
- Heyl et al. (2019) Heyl, J., Caiazzo, I., Hoffman, K., et al. 2019, in Bulletin of the American Astronomical Society, Vol. 51, 175
- Jana et al. (2020) Jana, A., Chatterjee, A., Kumari, N., et al. 2020, MNRAS, 499, 5396, doi: 10.1093/mnras/staa2552
- Jana et al. (2023) Jana, A., Chatterjee, A., Chang, H.-K., et al. 2023, MNRAS, 524, 4670, doi: 10.1093/mnras/stad2140
- Jansen et al. (2001) Jansen, F., Lumb, D., Altieri, B., et al. 2001, A&A, 365, L1, doi: 10.1051/0004-6361:20000036
- Jiang et al. (2018) Jiang, J., Parker, M. L., Fabian, A. C., et al. 2018, MNRAS, 477, 3711, doi: 10.1093/mnras/sty836
- Kalberla et al. (2005) Kalberla, P. M. W., Burton, W. B., Hartmann, D., et al. 2005, A&A, 440, 775, doi: 10.1051/0004-6361:20041864
- Kara et al. (2013) Kara, E., Fabian, A. C., Cackett, E. M., et al. 2013, MNRAS, 428, 2795, doi: 10.1093/mnras/sts155
- Keek & Ballantyne (2016) Keek, L., & Ballantyne, D. R. 2016, MNRAS, 456, 2722, doi: 10.1093/mnras/stv2882
- Kollatschny (2004) Kollatschny, W. 2004, in Coevolution of Black Holes and Galaxies, ed. L. C. Ho, 32
- Komossa et al. (2006) Komossa, S., Voges, W., Xu, D., et al. 2006, AJ, 132, 531, doi: 10.1086/505043
- Kormendy & Ho (2013) Kormendy, J., & Ho, L. C. 2013, ARA&A, 51, 511, doi: 10.1146/annurev-astro-082708-101811
- Kormendy & Richstone (1995) Kormendy, J., & Richstone, D. 1995, ARA&A, 33, 581, doi: 10.1146/annurev.aa.33.090195.003053
- Kubota & Done (2018) Kubota, A., & Done, C. 2018, MNRAS, 480, 1247, doi: 10.1093/mnras/sty1890
- Landt et al. (2017) Landt, H., Ward, M. J., Baloković, M., et al. 2017, MNRAS, 464, 2565, doi: 10.1093/mnras/stw2447
- Laor (1991) Laor, A. 1991, ApJ, 376, 90, doi: 10.1086/170257
- Leighly (1999) Leighly, K. M. 1999, ApJS, 125, 317, doi: 10.1086/313287
- Liu et al. (2017) Liu, H. T., Feng, H. C., & Bai, J. M. 2017, MNRAS, 466, 3323, doi: 10.1093/mnras/stw3261
- Lohfink et al. (2012) Lohfink, A. M., Reynolds, C. S., Miller, J. M., et al. 2012, ApJ, 758, 67, doi: 10.1088/0004-637X/758/1/67
- Lohfink et al. (2016) Lohfink, A. M., Reynolds, C. S., Pinto, C., et al. 2016, ApJ, 821, 11, doi: 10.3847/0004-637X/821/1/11
- Longinotti et al. (2008) Longinotti, A. L., Nucita, A., Santos-Lleo, M., & Guainazzi, M. 2008, A&A, 484, 311, doi: 10.1051/0004-6361:200809374
- Longinotti et al. (2013) Longinotti, A. L., Krongold, Y., Kriss, G. A., et al. 2013, ApJ, 766, 104, doi: 10.1088/0004-637X/766/2/104
- Madsen et al. (2018) Madsen, K. K., Harrison, F., Broadway, D., et al. 2018, in Society of Photo-Optical Instrumentation Engineers (SPIE) Conference Series, Vol. 10699, Space Telescopes and Instrumentation 2018: Ultraviolet to Gamma Ray, ed. J.-W. A. den Herder, S. Nikzad, & K. Nakazawa, 106996M, doi: 10.1117/12.2314117
- Magdziarz & Zdziarski (1995) Magdziarz, P., & Zdziarski, A. A. 1995, MNRAS, 273, 837, doi: 10.1093/mnras/273.3.837
- Mahmoud et al. (2023) Mahmoud, R. D., Done, C., Porquet, D., & Lobban, A. 2023, MNRAS, 521, 3585, doi: 10.1093/mnras/stac3809
- Markowitz & Edelson (2004) Markowitz, A., & Edelson, R. 2004, ApJ, 617, 939, doi: 10.1086/425559
- Matt et al. (1991) Matt, G., Perola, G. C., & Piro, L. 1991, A&A, 247, 25
- McElroy et al. (2016) McElroy, R. E., Husemann, B., Croom, S. M., et al. 2016, A&A, 593, L8, doi: 10.1051/0004-6361/201629102
- Mehdipour et al. (2023) Mehdipour, M., Kriss, G. A., Kaastra, J. S., Costantini, E., & Mao, J. 2023, ApJ, 952, L5, doi: 10.3847/2041-8213/ace053
- Mehdipour et al. (2011) Mehdipour, M., Branduardi-Raymont, G., Kaastra, J. S., et al. 2011, A&A, 534, A39, doi: 10.1051/0004-6361/201116875
- Middei et al. (2020) Middei, R., Petrucci, P. O., Bianchi, S., et al. 2020, A&A, 640, A99, doi: 10.1051/0004-6361/202038112
- Middei et al. (2023) —. 2023, A&A, 672, A101, doi: 10.1051/0004-6361/202244022
- Middleton et al. (2009) Middleton, M., Done, C., Ward, M., Gierliński, M., & Schurch, N. 2009, MNRAS, 394, 250, doi: 10.1111/j.1365-2966.2008.14255.x
- Miniutti et al. (2009) Miniutti, G., Ponti, G., Greene, J. E., et al. 2009, MNRAS, 394, 443, doi: 10.1111/j.1365-2966.2008.14334.x
- Morini et al. (1987) Morini, M., Lipani, N. A., & Molteni, D. 1987, ApJ, 317, 145, doi: 10.1086/165262
- Murphy & Yaqoob (2009) Murphy, K. D., & Yaqoob, T. 2009, MNRAS, 397, 1549, doi: 10.1111/j.1365-2966.2009.15025.x
- Mushotzky (2018) Mushotzky, R. 2018, AXIS: A Probe Class Next Generation High Angular Resolution X-ray Imaging Satellite, arXiv, doi: 10.48550/ARXIV.1807.02122
- Nandi et al. (2021) Nandi, P., Chatterjee, A., Chakrabarti, S. K., & Dutta, B. G. 2021, MNRAS, 506, 3111, doi: 10.1093/mnras/stab1699
- Nandra et al. (1991) Nandra, K., Pounds, K. A., Stewart, G. C., et al. 1991, MNRAS, 248, 760, doi: 10.1093/mnras/248.4.760
- Nandra et al. (2013) Nandra, K., Barret, D., Barcons, X., et al. 2013, arXiv e-prints, arXiv:1306.2307. https://arxiv.org/abs/1306.2307
- Nardini et al. (2012) Nardini, E., Fabian, A. C., & Walton, D. J. 2012, MNRAS, 423, 3299, doi: 10.1111/j.1365-2966.2012.21123.x
- Nardini et al. (2015) Nardini, E., Reeves, J. N., Gofford, J., et al. 2015, Science, 347, 860, doi: 10.1126/science.1259202
- Netzer (2019) Netzer, H. 2019, MNRAS, 488, 5185, doi: 10.1093/mnras/stz2016
- O’Brien et al. (2001) O’Brien, P. T., Page, K., Reeves, J. N., et al. 2001, MNRAS, 327, L37, doi: 10.1046/j.1365-8711.2001.05008.x
- O’Neill et al. (2005) O’Neill, P. M., Nandra, K., Papadakis, I. E., & Turner, T. J. 2005, MNRAS, 358, 1405, doi: 10.1111/j.1365-2966.2005.08860.x
- Page et al. (2002) Page, K. L., Pounds, K. A., Reeves, J. N., & O’Brien, P. T. 2002, MNRAS, 330, L1, doi: 10.1046/j.1365-8711.2002.05184.x
- Pal & Dewangan (2013) Pal, M., & Dewangan, G. C. 2013, MNRAS, 435, 1287, doi: 10.1093/mnras/stt1372
- Paliya et al. (2019) Paliya, V. S., Parker, M. L., Jiang, J., et al. 2019, ApJ, 872, 169, doi: 10.3847/1538-4357/ab01ce
- Parker et al. (2018) Parker, M. L., Miller, J. M., & Fabian, A. C. 2018, MNRAS, 474, 1538, doi: 10.1093/mnras/stx2861
- Peterson et al. (2004) Peterson, B. M., Ferrarese, L., Gilbert, K. M., et al. 2004, ApJ, 613, 682, doi: 10.1086/423269
- Petrucci et al. (2018) Petrucci, P. O., Ursini, F., De Rosa, A., et al. 2018, A&A, 611, A59, doi: 10.1051/0004-6361/201731580
- Piconcelli et al. (2005) Piconcelli, E., Jimenez-Bailón, E., Guainazzi, M., et al. 2005, A&A, 432, 15, doi: 10.1051/0004-6361:20041621
- Pinto et al. (2018) Pinto, C., Alston, W., Parker, M. L., et al. 2018, MNRAS, 476, 1021, doi: 10.1093/mnras/sty231
- Ponti et al. (2006) Ponti, G., Miniutti, G., Cappi, M., et al. 2006, MNRAS, 368, 903, doi: 10.1111/j.1365-2966.2006.10165.x
- Porquet et al. (2021) Porquet, D., Reeves, J. N., Grosso, N., Braito, V., & Lobban, A. 2021, A&A, 654, A89, doi: 10.1051/0004-6361/202141577
- Pounds et al. (1994) Pounds, K. A., Nandra, K., Fink, H. H., & Makino, F. 1994, MNRAS, 267, 193, doi: 10.1093/mnras/267.1.193
- Pounds et al. (1990) Pounds, K. A., Nandra, K., Stewart, G. C., George, I. M., & Fabian, A. C. 1990, Nature, 344, 132, doi: 10.1038/344132a0
- Pounds et al. (1986) Pounds, K. A., Warwick, R. S., Culhane, J. L., & de Korte, P. A. J. 1986, MNRAS, 218, 685, doi: 10.1093/mnras/218.4.685
- Pozdnyakov et al. (1983) Pozdnyakov, L. A., Sobol, I. M., & Syunyaev, R. A. 1983, Astrophys. Space Phys. Res., 2, 189
- Pravdo et al. (1981) Pravdo, S. H., Nugent, J. J., Nousek, J. A., et al. 1981, ApJ, 251, 501, doi: 10.1086/159489
- Reeves et al. (2016) Reeves, J. N., Porquet, D., Braito, V., et al. 2016, The Astrophysical Journal, 828, 98, doi: 10.3847/0004-637x/828/2/98
- Reeves & Turner (2000) Reeves, J. N., & Turner, M. J. L. 2000, MNRAS, 316, 234, doi: 10.1046/j.1365-8711.2000.03510.x
- Ross & Fabian (2005) Ross, R. R., & Fabian, A. C. 2005, MNRAS, 358, 211, doi: 10.1111/j.1365-2966.2005.08797.x
- Ross et al. (1992) Ross, R. R., Fabian, A. C., & Mineshige, S. 1992, MNRAS, 258, 189, doi: 10.1093/mnras/258.1.189
- Rybicki & Lightman (1979) Rybicki, G. B., & Lightman, A. P. 1979, Radiative processes in astrophysics
- Sambruna et al. (2009) Sambruna, R. M., Reeves, J. N., Braito, V., et al. 2009, ApJ, 700, 1473, doi: 10.1088/0004-637X/700/2/1473
- Sarma et al. (2015) Sarma, R., Tripathi, S., Misra, R., et al. 2015, MNRAS, 448, 1541, doi: 10.1093/mnras/stv005
- Schurch & Done (2008) Schurch, N. J., & Done, C. 2008, MNRAS, 386, L1, doi: 10.1111/j.1745-3933.2007.00395.x
- Sergeev et al. (2011) Sergeev, S. G., Klimanov, S. A., Doroshenko, V. T., et al. 2011, MNRAS, 410, 1877, doi: 10.1111/j.1365-2966.2010.17569.x
- Shakura & Sunyaev (1973) Shakura, N. I., & Sunyaev, R. A. 1973, A&A, 24, 337
- Singh et al. (1985) Singh, K. P., Garmire, G. P., & Nousek, J. 1985, ApJ, 297, 633, doi: 10.1086/163560
- Sobolewska & Done (2007) Sobolewska, M. A., & Done, C. 2007, MNRAS, 374, 150, doi: 10.1111/j.1365-2966.2006.11117.x
- Strüder et al. (2001) Strüder, L., Briel, U., Dennerl, K., et al. 2001, A&A, 365, L18, doi: 10.1051/0004-6361:20000066
- Sunyaev & Titarchuk (1980) Sunyaev, R. A., & Titarchuk, L. G. 1980, A&A, 86, 121
- Takahashi et al. (2010) Takahashi, H., Hayashida, K., & Anabuki, N. 2010, PASJ, 62, 1483, doi: 10.1093/pasj/62.6.1483
- Tashiro et al. (2018) Tashiro, M., Maejima, H., Toda, K., et al. 2018, in Space Telescopes and Instrumentation 2018: Ultraviolet to Gamma Ray, ed. J.-W. A. den Herder, S. Nikzad, & K. Nakazawa, Vol. 10699, International Society for Optics and Photonics (SPIE), 520 – 531, doi: 10.1117/12.2309455
- Tombesi et al. (2013) Tombesi, F., Reeves, J. N., Reynolds, C. S., García, J., & Lohfink, A. 2013, MNRAS, 434, 2707, doi: 10.1093/mnras/stt1213
- Turner et al. (1999) Turner, T. J., George, I. M., Nandra, K., & Turcan, D. 1999, ApJ, 524, 667, doi: 10.1086/307834
- Turner & Miller (2009) Turner, T. J., & Miller, L. 2009, A&A Rev., 17, 47, doi: 10.1007/s00159-009-0017-1
- Turner & Pounds (1989) Turner, T. J., & Pounds, K. A. 1989, MNRAS, 240, 833, doi: 10.1093/mnras/240.4.833
- Turner et al. (2001) Turner, T. J., Romano, P., George, I. M., et al. 2001, ApJ, 561, 131, doi: 10.1086/323232
- Turner et al. (2002) Turner, T. J., Romano, P., Kraemer, S. B., et al. 2002, ApJ, 568, 120, doi: 10.1086/338925
- Vaughan et al. (2002) Vaughan, S., Boller, T., Fabian, A. C., et al. 2002, MNRAS, 337, 247, doi: 10.1046/j.1365-8711.2002.05908.x
- Vaughan et al. (2004) Vaughan, S., Fabian, A. C., Ballantyne, D. R., et al. 2004, MNRAS, 351, 193, doi: 10.1111/j.1365-2966.2004.07769.x
- Walter & Fink (1993) Walter, R., & Fink, H. H. 1993, A&A, 274, 105
- Walton et al. (2013) Walton, D. J., Nardini, E., Fabian, A. C., Gallo, L. C., & Reis, R. C. 2013, MNRAS, 428, 2901, doi: 10.1093/mnras/sts227
- Walton et al. (2010) Walton, D. J., Reis, R. C., & Fabian, A. C. 2010, MNRAS, 408, 601, doi: 10.1111/j.1365-2966.2010.17148.x
- Wilms et al. (2000) Wilms, J., Allen, A., & McCray, R. 2000, ApJ, 542, 914, doi: 10.1086/317016
- Wozniak et al. (1998) Wozniak, P. R., Zdziarski, A. A., Smith, D., Madejski, G. M., & Johnson, W. N. 1998, MNRAS, 299, 449, doi: 10.1046/j.1365-8711.1998.01831.x
- Zhang & Wang (2006) Zhang, E.-P., & Wang, J.-M. 2006, ApJ, 653, 137, doi: 10.1086/506515
- Zhou & Wang (2005) Zhou, X.-L., & Wang, J.-M. 2005, ApJ, 618, L83, doi: 10.1086/427871