ChartDETR: A Multi-shape Detection Network for Visual Chart Recognition
Abstract
Visual chart recognition systems are gaining increasing attention due to the growing demand for automatically identifying table headers and values from chart images. Current methods rely on keypoint detection to estimate data element shapes in charts but suffer from grouping errors in post-processing. To address this issue, we propose ChartDETR, a transformer-based multi-shape detector that localizes keypoints at the corners of regular shapes to reconstruct multiple data elements in a single chart image. Our method predicts all data element shapes at once by introducing query groups in set prediction, eliminating the need for further postprocessing. This property allows ChartDETR to serve as a unified framework capable of representing various chart types without altering the network architecture, effectively detecting data elements of diverse shapes. We evaluated ChartDETR on three datasets, achieving competitive results across all chart types without any additional enhancements. For example, ChartDETR achieved an F1 score of 0.98 on Adobe Synthetic, significantly outperforming the previous best model with a 0.71 F1 score. Additionally, we obtained a new state-of-the-art result of 0.97 on ExcelChart400k. The code will be made publicly available.
Introduction
The continuous development of data perception and the widespread use of the internet have led to a vast amount of data being generated and collected. Charts serve as a universal tool for visualizing this data, offering a concise and intuitive representation of complex datasets that allows users to easily identify trends and patterns. However, chart data is often stored in the form of images. To enable machines to comprehend chart images, it becomes essential to convert them into corresponding table data. This conversion proves to be especially beneficial when combined with large language models (LLM) (Masry et al. 2022; Kantharaj et al. 2022; Liu et al. 2023). By doing so, we enhance our understanding of the chart’s underlying meaning and ultimately improve work efficiency.
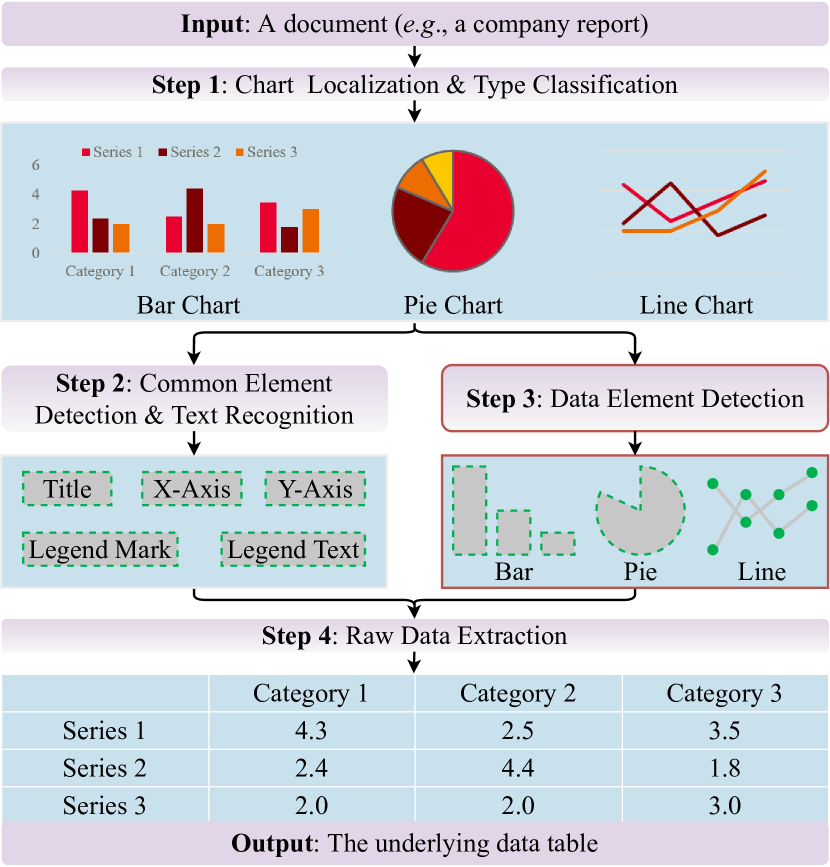
A visual chart recognition system typically consists of multiple steps, as shown in Figure 1. When a document image containing a chart is provided, the system begins by localizing its position and determining its type. It then proceeds with two parallel steps: one to recognize the common chart elements (such as the title, x/y axis, and legend), and another to detect the data elements. Finally, the system combines the common and data elements to retrieve the table data corresponding to the chart.
Detecting data elements is a crucial but less exploited step in visual chart recognition. However, it remains challenging due to several factors. First, different types of chart elements have significantly different shapes. Second, even chart elements of the same type can possess diverse visual appearances. To address these challenges, current methods detect all keypoints in the given chart image. They either use heatmaps to represent different keypoints or utilize visual transformers (Shivasankaran, Hassan, and Singh 2023) to directly predict a fixed number of keypoints. One limitation of keypoint detection is its inability to determine whether different points belong to the same data element. Therefore, a hand-designed grouping process is necessary to fully identify and categorize data elements in any given chart. Since different shapes of charts require different grouping rules, this process inevitably introduces grouping errors.
In this paper, we present ChartDETR, a transformer-based multi-shape detector that localizes the keypoints of multiple data elements in one chart image. It inherits from the DETR that gets rid of the post-processing procedure. Compared with DETR, ChartDETR can better handle more complex shapes by using multiple queries rather than one query for each data element. This is because one query with the multi-head attention focuses on features in a local area (Carion et al. 2020; Zhu et al. 2021), which is not suitable for charts that may span a wide range of an image.
Instead of explicitly figuring out which keypoints belong to the same data element, we introduce groups for queries. Each group of queries will induce a group of keypoints. Suppose there are at most shapes in an image, with each shape requiring keypoints to describe it. ChartDETR predicts a set of keypoints. During training, we match each group of keypoints to one of the ground-truth shapes. Note that not all shapes can be described by a fixed number of keypoints, so should be larger than the number of ground truth keypoints. To enable point-to-point supervision over the predicted keypoints, a simple duplicated keypoint matching is introduced, which interpolates nearest neighbors to ground truth points during training. The sum of the point-wise loss is also used in a bipartite matching between the ground truth shapes and the predicted keypoint groups.
ChartDETR is a simple yet highly effective method for detecting data elements of charts. The proposed approach has the potential to be generalized to detect any regular/irregular object whose shape can be represented by keypoints. We evaluated our approach on three datasets and achieved competitive results across all chart types. For example, on Adobe Synthetic (Davila et al. 2019), ChartDETR achieved an F1 score of 0.98 – significantly better than the previous best model with a 0.71 F1 score. On ExcelChart400k (Luo et al. 2021), we obtained a new state-of-the-art result of 0.97. ChartDETR makes three main contributions to the field of chart recognition:
-
•
Utilizing keypoints, ChartDETR is a unified framework that can represent different types of charts.
-
•
Introducing query groups and set prediction, ChartDETR predicts all data elements in one shot, eliminating the need for post-processing.
-
•
Effective and straightforward, ChartDETR achieves state-of-the-art results for bar, line, and pie charts without whistles and bells.
Related Work
Data Element Detection in Chart

Chart images typically comprise lines and shapes, which appear very different from natural images. Early methods (Balaji, Ramanathan, and Sonathi 2018; Gao, Zhou, and Barner 2012; Poco and Heer 2017; Savva et al. 2011) utilized defined rules to extract the shapes by finding the raw components by color continuity and edge features. However, hand-crafted rules can only work efficiently in constrained settings. For example, ReVision (Savva et al. 2011) may fail to detect small or rarely-occurring bars. Recent works have attempted to detect chart elements using deep neural networks. For bar charts, a natural approach is to use general object detection to detect bounding boxes of bars (Choi et al. 2019; Liu, Klabjan, and NBless 2019). As shown in Figure 2, for pie sectors and lines with knee-points, the shapes cannot be described by bounding boxes but can be represented by keypoints, which help to recover the complete shape. To detect these keypoints for a chart, ChartOCR (Luo et al. 2021) and CHARTER (Shtok et al. 2021) use heatmap-based approaches to detect different keypoints of various shapes. LINEEX (Shivasankaran, Hassan, and Singh 2023) further utilizes a transformer architecture to detect the keypoints. Most of these methods use the bottom-up framework and need sophisticated post-processing methods to group them into different shapes.
Transformer based Detector
Transformer is successfully applied for object detection in natural images. DETR (Carion et al. 2020) is the first transformed-based end-to-end object detector. It is known for not requiring many hand-designed components like anchor design and non-maximum suppression. Many advanced extensions have been developed based on DETR. Deformable-DETR (Zhu et al. 2021) proposed the multi-scale deformable self/cross-attention module to improve the training efficiency. DN-DETR (Li et al. 2022) speeds up DETR training by introducing an auxiliary denoising training task. Then, DINO (Zhang et al. 2022) improved DN-DETR by using a contrastive way for denoising training, a mixed query selection method for anchor initialization, and a look forward twice scheme for box prediction. For the low training efficiency with few positive queries, H-DETR (Jia et al. 2022) adopts a hybrid matching scheme that combines the original one-to-one matching branch with another one-to-many matching during training. Inspired by these DETR-style detectors, we propose ChartDETR for chart images. However, the data elements can have very long and thin shapes, e.g., long bars, and wide lines. A single query cannot account for the whole data element. Therefore, we introduce ”groups” for queries so that groups of queries together induce the keypoints to represent the data elements.
Keypoint Detection for Multiple Instances
Keypoint detection is widely studied for pose estimation, which requires locating multiple critical points of the presented persons from an image. The related techniques can be divided into three categories: the top-down approaches, the bottom-up methods, and the single-stage methods. For multiple instances keypoint detection, the top-down methods (Newell, Yang, and Deng 2016; Sun et al. 2019) first employ an object detector to obtain the bounding box of each person instance and then estimate the single-person pose from the cropped area. The bottom-up methods (Kreiss, Bertoni, and Alahi 2019; Papandreou et al. 2018) detect all the keypoints in an instance-agnostic fashion, then group them into individuals. In the chart image, bounding boxes of different data elements may overlap as shown in Figure 2, which is unsuitable for top-down methods. Therefore, many previous chart recognition methods (Luo et al. 2021; Shtok et al. 2021) utilize the bottom-up pipeline for shape keypoints detection. The two-stage strategy inevitably introduces intermediate errors. PETR (Shi et al. 2022) is a single-stage multi-person pose estimation framework that also adopts a DETR-style framework. For an input image, PETR designs the hierarchical decoders to predict poses with joints for each, which significantly increase the computational complexity. While our ChartDETR has a more clean architecture that predicts all shape keypoints in one shot and groups keypoints by pivot queries.
Methodology
Shape Representation
ChartDETR utilizes keypoints to represent the shape of data elements. This paper considers pie, bar, and line charts.
Pie Chart. A pie chart can be composed of multiple pie sectors. We use the three keypoints for each pie sector to represent its shape: one center point of the circle represents the sector, and the other two endpoints of the arc define the sector’s boundaries.
Bar Chart. In a bar chart, each rectangle represents a particular value or set of values. These rectangles can be arranged horizontally or vertically, depending on the type of chart being used. To represent the shape of each rectangle, we utilize two keypoints typically located at the top-left and bottom-right corners of the rectangle.
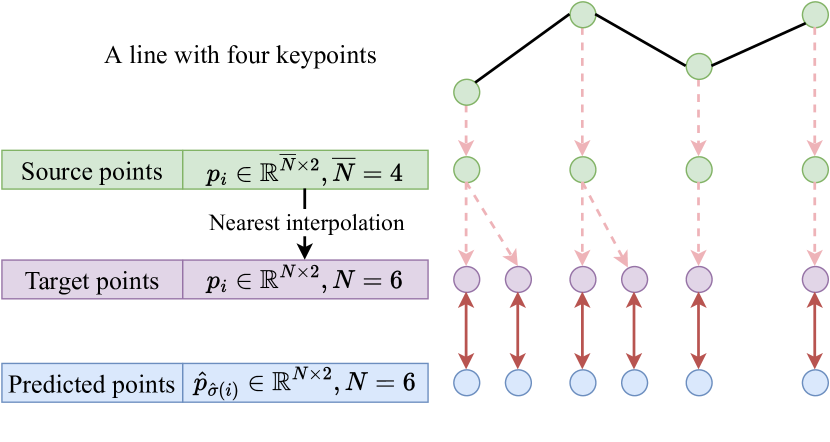
Line Chart. A line chart connects discrete data points with line segments to compose a continuous line. Knee points on this line usually correspond with the source data points. Therefore, we use a set of knee points to represent its shape. As shown in Figure 3, representing a data element in a line chart differs from pies and bars: the number of keypoints for lines varies in different charts. It significantly increases the difficulty of the detection, which usually has a fixed number of outputs. Our ChartDETR will provide a novel way to detect a variable number of keypoints for each instance.

ChartDETR
Model Overview.
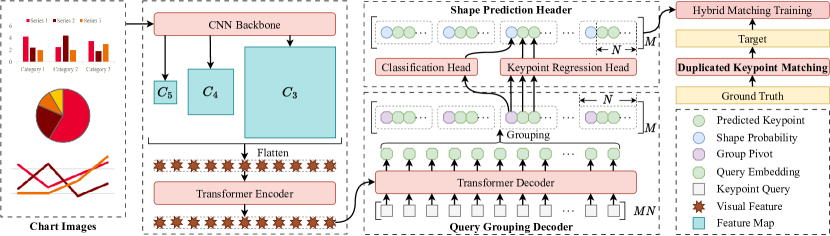
ChartDETR follows the DETR pipeline and the details are described in Figure 4. Given a chart image, ChartDETR first applies the backbone and the transformer encoder to extract the refined visual features. Second, with the refined visual features, a novel query grouping decoder generates keypoint embeddings from a set of initialized keypoint queries and divides them into groups. Last, for each group of keypoint embeddings, the shape prediction header predicts all keypoint positions and the class probability.
We train ChartDETR with the Hungarian algorithm and propose the duplicated keypoint matching to address the problem of a variable number of keypoints in line charts.
Query Grouping Decoder. Different from most object queries, which predict a bounding box from each query, it is difficult to predict all keypoints of a shape from one query because the chart shape (e.g., line chart) may span a wide range. Therefore, our decoder simultaneously predicts all keypoints of shapes and divides them into groups to represent different shapes by a simple way.
Specifically, we initialize the -length keypoint queries , where is the dimension of the query embedding, is the keypoint number of a shape, and is the number of shapes that the model can predict. With the refined visual features from the encoder, the decoder utilizes the self/cross-attention module layer by layer and transforms the keypoint queries into the keypoint query embeddings .
Considering that contains all keypoint embeddings of shapes and each shape has keypoints, we simply divide the sequential embeddings into groups, and the shape of changes into . In the -th group, each keypoint embedding will be fed into the keypoint regression head to predict its position. We choose the first embedding as a pivot to predict whether this keypoint group corresponds to a shape. As a result, the model simultaneously predicts shapes with keypoints for each in just one shot.
Duplicated Keypoint Matching. Our ChartDETR outputs keypoints for each predicted shape. For bars and pies, we can easily compare a pair of shapes between predictions and the ground truth because their shapes have the same number of keypoints, e.g., any one of the bars is represented with its top-left and bottom-right corners wherever it is from the predictions or the ground truth. However, it is difficult to compare a predicted line shape with a ground truth one because the number of line keypoints varies in different line charts. To address this problem, we keep all line shapes with the same number of keypoints in a simple way.
Specifically, we denote the ground truth keypoint set of a line as , where is the number of ground truth keypoints, and each point has a 2D position. We interpolate duplicated points into by using nearest neighbors to get the updated keypoint set , where to ensure that the source keypoints will not be removed. This way, the interpolated keypoint set has the same number of keypoints with the predicted line shapes and thus can serve as the target to supervise the model training in a DETR way. We illustrate this operation in Figure 5 for better understanding.
Network Implementation.
- Backbone: Given an input image , which can be either type of bar, line, or pie chart. We extract multi-scale feature maps from the backbone (e.g., ResNet-50 (He et al. 2016)) and reduce their channels to . We flatten the spatial dimensions of each feature map and concatenate them to construct the multi-scale feature representation .
- Transformer encoder: We follow (Zhu et al. 2021) to build the encoder, which has six layers, and each layer comprises a multi-scale deformable attention module and a feed-forward network. The multi-scale deformable module is designed to attend features to reference points, which is appropriate for the keypoints detection task. The scale-level embedding and the positional embedding are added to identify which feature level each feature token lies in. After that, we can obtain the refined multi-scale visual feature memory .
- Transformer decoder: The decoder also has six layers. Besides a multi-scale deformable self-attention module and a feed-forward network, each decoder layer also includes a multi-scale deformable cross-attention module. To pool more comprehensive content features and fully leverage the refined keypoint information, two improvements are borrowed from DINO (Zhang et al. 2022): (1) the mixed query selection that generates keypoint queries composed by a positional part and a content part; (2) the look forward twice approach that refines the keypoints at each layer based on the predictions from the two previous layers.
- Shape prediction header: Our shape header consists of a classification head including a linear layer and a keypoint regression head composed of a multi-layer perceptron. The classification head takes the embeddings of all group pivots and outputs the confidence through the sigmoid function. The keypoint regression head takes all keypoint embeddings and predicts the offsets w.r.t. the reference points.
Training with Hybrid Shape Matching
DETR uses the one-to-one set matching to force a unique prediction for each ground-truth object. However, the training efficiency may be significantly reduced due to few positive samples. To leverage recent improvements of DETR variants, we apply the hybrid matching scheme (Jia et al. 2022) to train our ChartDETR due to its simplicity and convenience to transfer from bounding box detection to multi-shape detection.
One-to-One Shape Matching. For the queries , we denote the corresponding prediction sets as . Each predicted shape includes a class probability and a keypoint set . Let denote the target shape set. The class label and target keypoint set of each shape are and , respectively. we perform the bipartite matching between and to estimate the optimal assignment by minimizing the matching cost:
| (1) | |||
| (2) |
where is a permutaion of shapes, computes the classification cost and the shape position cost between the target and a prediction with index . We use the focal loss(Lin et al. 2017) as and loss as . With the optimal assignment , we then compute the one-to-one matching loss with the Hungarian algorithm:
| (3) | |||
| (4) |
One-to-Many Shape Matching. Besides the queries for one-to-one matching, we also maintain another group of queries for one-to-many matching, where is the number of predicted shapes for . Let denote the corresponding prediction sets, where each predicted shape has a class probability and a keypoint set . To perform the one-to-many matching, a simple way is to repeat the ground truth for times and get an augmented target . We then estimate the optimal assignment and compute the one-to-many matching loss in a similar way,
| (5) | |||
| (6) |
We parallelly process the one-to-one and one-to-many branches by a masked multi-head self-attention. The total loss is the combination of the above two losses,
| (7) |
| Method | Backbone | Framework | Pie Score | Bar Score |
| Human Pose Estimation Methods | ||||
| HRNet† | HRNet-w32 | Top-down Keypoint Detection | 0.952 | 0.910 |
| HigherHRNet | HRNet-w32 | Bottom-up Keypoint Detection | 0.938 | 0.615 |
| PETR | ResNet-50 | One-stage Keypoint Detection | 0.956 | 0.902 |
| Chart Recognition Methods | ||||
| Revision | – | Rule-based | 0.838 | 0.582 |
| RotationRNN | ResNet-50 | Object Detection | 0.797 | - |
| Faster-RCNN | ResNet-50 | Object Detection | - | 0.802 |
| ChartOCR | Hourglass | Bottom-up Keypoint Detection | 0.918 | 0.919 |
| ChartDETR | ResNet-50 | One-stage Keypoint Detection | 0.963 | 0.904 |
| ChartDETR | HRNet-w32 | One-stage Keypoint Detection | 0.975 | 0.923 |
| : The results of HRNet are based on the ground truth bounding boxes of shape keypoints. | ||||
| Metric | Method | Backbone | Framework | AS | LE | EC | ||||||
|---|---|---|---|---|---|---|---|---|---|---|---|---|
| R | P | F1 | R | P | F1 | R | P | F1 | ||||
| ChartOCR | Hourglass | Bottom-up | 0.76 | 0.72 | 0.71 | 0.71 | 0.90 | 0.78 | 0.85 | 0.98 | 0.90 | |
| LINEEX | Transformer | Bottom-up | 0.91 | 0.54 | 0.64 | 0.86 | 0.84 | 0.83 | 0.84 | 0.80 | 0.78 | |
| ChartDETR | ResNet-50 | One-stage | 0.97 | 0.99 | 0.98 | 0.92 | 0.98 | 0.95 | 0.84 | 0.92 | 0.86 | |
| ChartOCR | Hourglass | Bottom-up | 0.78 | 0.80 | 0.76 | 0.74 | 0.97 | 0.83 | 0.85 | 0.98 | 0.90 | |
| LINEEX | Transformer | Bottom-up | 0.93 | 0.76 | 0.81 | 0.85 | 0.92 | 0.87 | 0.85 | 0.90 | 0.85 | |
| ChartDETR | ResNet-50 | One-stage | 0.97 | 0.99 | 0.98 | 0.93 | 0.98 | 0.95 | 0.85 | 0.95 | 0.88 | |
Experiment
Setup
Datasets.
We employ our method on three types of charts (i.e., bar, line, and pie) and evaluate on Adobe Synthetic (Davila et al. 2019), LINEEX430k (Shivasankaran, Hassan, and Singh 2023), and ExcelChart400k (Luo et al. 2021).
Metrics.
For bar and pie charts, we follow (Luo et al. 2021) to compute the detection score. For a line chart, we follow (Shivasankaran, Hassan, and Singh 2023) to evaluate the line detection results based on the strict and relaxed object keypoints similarities, which are denoted as and , respectively.
Baseline methods.
We compare our ChartDETR with a wide range of methods, including Revision (Savva et al. 2011), RotationRNN and Faster-RCNN (Liu, Klabjan, and NBless 2019), HRNet (Sun et al. 2019), HigherHRNet (Cheng et al. 2020), ChartOCR (Luo et al. 2021), PETR (Shi et al. 2022), and LINEEX (Shivasankaran, Hassan, and Singh 2023).
Implementation. For all experiments, we use ResNet-50 (He et al. 2016) as the backbone if not specially specified. Considering the limited GPU memory, we always keep for one-to-many matching.
Pie Detection
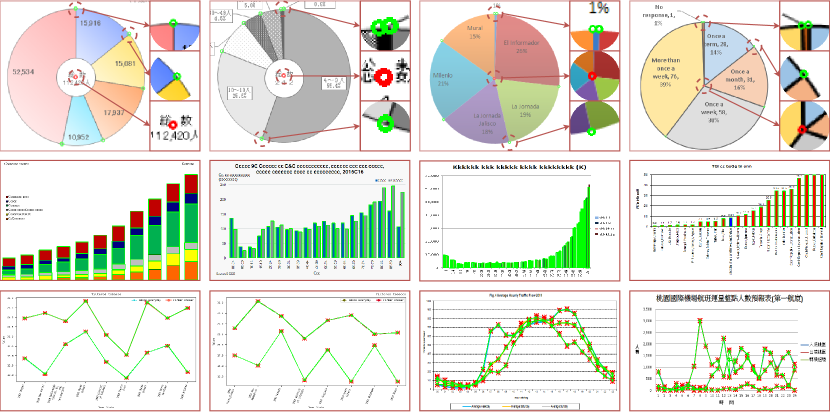
We evaluate our ChartDETR for pie detection on ExcelChart400k and present the experimental results in Table 1. Compared with chart recognition methods, our ChartDETR can directly output a set of pie sectors with three keypoints without extra post-processing. When adopting HRNet as the backbone, ChartDETR achieves a 0.975 score that improves the recent best result (ChartOCR) by 6.2%, obtaining a new state-of-the-art result. Compared with recent human pose estimation methods, ChartDETR-ResNet-50 achieves a 0.963 score higher than PETR, which is also a DETR-like method. We visualize some challenging samples in Figure 6. We see that ChartDETR can effectively predict the invisible center point of the special donut type and two close endpoints of a pie sector that is only 1% of the whole circle.
Bar Detection
We present bar detection results on ExcelChart400k in Table 1. Our ChartDETR-HRNet achieves a 0.923 score, outperforming all other baseline methods. HigherHRNet has a low score because it struggles to distinguish overlapped keypoints between neighbor bars. Both ChartDETR and PETR are the DETR-like framework. When adopting ResNet-50 as the backbone, they have comparable results (0.904: 0.902) and fall behind ChartOCR. The main reason is that ChartOCR utilizes a high-resolution backbone (e.g., Hourglass Net (Newell, Yang, and Deng 2016)), while ChartDETR uses a low-resolution backbone, facing the challenge to predict small bars, as shown in Figure 6. When replacing ResNet-50 with a high-resolution backbone, e.g. HRNet, the performance can be further improved (0.904 0.923).
Line Detection
Line detection is the most challenging among the three chart types due to the irregular and various keypoints distribution. We evaluate our methods for line detection on three different datasets and present the results in Table 2. On Adobe Synthetic and LINEEX430k, our ChartDETR achieves 0.98 F1 and 0.95 F1 for the metric, improving recent best results by 53.1% and 14.4%, respectively. Compared with previous methods, the proposed method has a balanced performance for both and metrics. That demonstrates the predicted keypoints closely surround their target points. On ExcelChart400k, though our ChartDETR achieves 0.86 F1 and 0.88 F1 for and metrics, lowering than the previous best results, it has a comparable recall. It is noted that our method predicts superfluous keypoints. When a line has few knee points and approximates to a straight line, instead of clustering around the knee points, the predicted superfluous points tend to arrange along the line and become false positive samples, which results in low precision. However, compared with these methods, our ChartDETR can directly output a set of lines without extra post-processing. We present visualization results in Figure 6.
Ablation Study
We present ablation experiments to study the influence of several key parameters for line charts in Adobe Synthetic. Different backbones are also investigated for bar detection on ExcelChart400k.
We set by default for the one-to-many matching if not specially specified.
| Default (14) | ||||
|---|---|---|---|---|
| F1 | 0.975 | 0.942 | 0.907 | 0.910 |
| Default (4) | ||||
| F1 | 0.974 | 0.980 | 0.959 | 0.943 |
The Influence of .
To compare the predicted line keypoints with the ground truth that has a variable number of keypoints, we interpolate duplicated keypoints into the ground truth by using the nearest neighbors to get the training target. The default value of is the maximum number of line keypoints for a chart dataset, i.e., 14 for Adobe Synthetic. We conduct experiments to study the influence of in Table 3. The model achieves the best result when setting with the default value. Interpolating more keypoints has no help to improve the model performance.
The Influence of .
is an important hyper-parameter that determines the total number of keypoint queries and how many shapes the model can predict. Recent DETR variants (Zhang et al. 2022; Jia et al. 2022) achieve better results with more queries. We conduct experiments to select a suitable value for in Table 3. We set as the default value, which is the maximum number of shapes per image on Adobe Synthetic. Increasing does not always result in a better performance. The model achieves the best result when .
The Influence of .
During training, we repeat the ground truth times to perform one-to-many matching followed by H-DETR. We study the influence of with different values in Table 4. We set and on Adobe Synthetic according to previous experiments. When , only the one-to-one matching branch participates in the training, which results in a 0.951 score for F1 metric. We observe that the model significantly benefits from the one-to-many matching scheme when . The model achieves the best result when , which is 0.029 higher than the performance of the one-to-one matching only branch. The experimental results demonstrate the hybrid matching scheme also works for line detection.
| 0 | 1 | 2 | 3 | 4 | 5 | |
|---|---|---|---|---|---|---|
| 0.951 | 0.956 | 0.946 | 0.980 | 0.964 | 0.969 |
| Backbone | Bar Score | Backbone | Bar Score |
|---|---|---|---|
| ResNet-50 | 0.904 | ResNet-101 | 0.905 |
| Swin-tiny | 0.917 | Swin-small | 0.918 |
| HRNet-w18 | 0.913 | HRNet-w32 | 0.923 |
Different Backbones. In Section Bar Detection, we show that the model can be improved by replacing ResNet-50 with HRNet. To further study the effect of backbones on ChartDETR, we conduct experiments with different backbones for bar detection in Table 5. The results of ResNet and Swin Transformer (Liu et al. 2021) demonstrate that the depth and scale of backbones have a limited effect on improving performance. The high-resolution network HRNet achieves significant improvements, which demonstrates the main challenge of bar detection is the small and crowded bars.
Conclusion
This paper introduces a novel transformer-based multi-shape detector for chart recognition, i.e., ChartDETR. The proposed method transforms multi-shape detection into a set prediction issue by incorporating query groups and duplicated keypoint matching into a unified framework. This approach enables ChartDETR to effectively detect data elements of various shapes in charts without requiring a change in network architecture. Compared to other methods, ChartDETR is straightforward and eliminates the need for post-processing. Experimental results show the effectiveness of ChartDETR on three types of charts.
References
- Balaji, Ramanathan, and Sonathi (2018) Balaji, A.; Ramanathan, T.; and Sonathi, V. 2018. Chart-text: A fully automated chart image descriptor. arXiv preprint arXiv:1812.10636.
- Carion et al. (2020) Carion, N.; Massa, F.; Synnaeve, G.; Usunier, N.; Kirillov, A.; and Zagoruyko, S. 2020. End-to-end object detection with transformers. In Proceedings of European Conference on Computer Vision (ECCV), 213–229. Springer.
- Cheng et al. (2020) Cheng, B.; Xiao, B.; Wang, J.; Shi, H.; Huang, T. S.; and Zhang, L. 2020. HigherHRNet: Scale-Aware Representation Learning for Bottom-Up Human Pose Estimation. In CVPR.
- Choi et al. (2019) Choi, J.; Jung, S.; Park, D. G.; Choo, J.; and Elmqvist, N. 2019. Visualizing for the non-visual: Enabling the visually impaired to use visualization. In Computer Graphics Forum, volume 38, 249–260. Wiley Online Library.
- Davila et al. (2019) Davila, K.; Kota, B. U.; Setlur, S.; Govindaraju, V.; Tensmeyer, C.; Shekhar, S.; and Chaudhry, R. 2019. ICDAR 2019 competition on harvesting raw tables from infographics (chart-infographics). In Proceedings of International Conference on Document Analysis and Recognition (ICDAR), 1594–1599. IEEE.
- Gao, Zhou, and Barner (2012) Gao, J.; Zhou, Y.; and Barner, K. E. 2012. View: Visual information extraction widget for improving chart images accessibility. In Proceedings of International Conference on Image Processing, 2865–2868. IEEE.
- He et al. (2016) He, K.; Zhang, X.; Ren, S.; and Sun, J. 2016. Deep residual learning for image recognition. In Computer Vision and Pattern Recognition (CVPR), 770–778.
- Jia et al. (2022) Jia, D.; Yuan, Y.; He, H.; Wu, X.; Yu, H.; Lin, W.; Sun, L.; Zhang, C.; and Hu, H. 2022. Detrs with hybrid matching. arXiv preprint arXiv:2207.13080.
- Kantharaj et al. (2022) Kantharaj, S.; Leong, R. T.; Lin, X.; Masry, A.; Thakkar, M.; Hoque, E.; and Joty, S. 2022. Chart-to-Text: A Large-Scale Benchmark for Chart Summarization. In Proceedings of Association for Computational Linguistics (ACL), 4005–4023.
- Kreiss, Bertoni, and Alahi (2019) Kreiss, S.; Bertoni, L.; and Alahi, A. 2019. Pifpaf: Composite fields for human pose estimation. In Computer Vision and Pattern Recognition (CVPR), 11977–11986.
- Li et al. (2022) Li, F.; Zhang, H.; Liu, S.; Guo, J.; Ni, L. M.; and Zhang, L. 2022. Dn-detr: Accelerate detr training by introducing query denoising. In Computer Vision and Pattern Recognition (CVPR), 13619–13627.
- Lin et al. (2017) Lin, T.-Y.; Goyal, P.; Girshick, R.; He, K.; and Dollár, P. 2017. Focal loss for dense object detection. In International Conference on Computer Vision (ICCV), 2980–2988.
- Liu et al. (2023) Liu, F.; Eisenschlos, J.; Piccinno, F.; Krichene, S.; Pang, C.; Lee, K.; Joshi, M.; Chen, W.; Collier, N.; and Altun, Y. 2023. DePlot: One-shot visual language reasoning by plot-to-table translation. In Findings of the Association for Computational Linguistics: ACL 2023, 10381–10399.
- Liu, Klabjan, and NBless (2019) Liu, X.; Klabjan, D.; and NBless, P. 2019. Data extraction from charts via single deep neural network. arXiv preprint arXiv:1906.11906.
- Liu et al. (2021) Liu, Z.; Lin, Y.; Cao, Y.; Hu, H.; Wei, Y.; Zhang, Z.; Lin, S.; and Guo, B. 2021. Swin transformer: Hierarchical vision transformer using shifted windows. In International Conference on Computer Vision (ICCV), 10012–10022.
- Luo et al. (2021) Luo, J.; Li, Z.; Wang, J.; and Lin, C.-Y. 2021. Chartocr: Data extraction from charts images via a deep hybrid framework. In Winter Conference on Applications of Computer Vision, 1917–1925.
- Masry et al. (2022) Masry, A.; Long, D.; Tan, J. Q.; Joty, S.; and Hoque, E. 2022. ChartQA: A Benchmark for Question Answering about Charts with Visual and Logical Reasoning. In Findings of the Association for Computational Linguistics (ACL Findings), 2263–2279.
- Newell, Yang, and Deng (2016) Newell, A.; Yang, K.; and Deng, J. 2016. Stacked hourglass networks for human pose estimation. In European Conference on Computer Vision (ECCV), 483–499. Springer.
- Papandreou et al. (2018) Papandreou, G.; Zhu, T.; Chen, L.-C.; Gidaris, S.; Tompson, J.; and Murphy, K. 2018. Personlab: Person pose estimation and instance segmentation with a bottom-up, part-based, geometric embedding model. In European conference on computer vision (ECCV), 269–286.
- Poco and Heer (2017) Poco, J.; and Heer, J. 2017. Reverse-engineering visualizations: Recovering visual encodings from chart images. In Computer graphics forum, volume 36, 353–363. Wiley Online Library.
- Savva et al. (2011) Savva, M.; Kong, N.; Chhajta, A.; Fei-Fei, L.; Agrawala, M.; and Heer, J. 2011. Revision: Automated classification, analysis and redesign of chart images. In The Symposium on User Interface Software and Technology, 393–402.
- Shi et al. (2022) Shi, D.; Wei, X.; Li, L.; Ren, Y.; and Tan, W. 2022. End-to-end multi-person pose estimation with transformers. In Computer Vision and Pattern Recognition (CVPR), 11069–11078.
- Shivasankaran, Hassan, and Singh (2023) Shivasankaran, V.; Hassan, M. Y.; and Singh, M. 2023. LineEX: Data Extraction from Scientific Line Charts. In Winter Conference on Applications of Computer Vision (WACV), 6202–6210. IEEE.
- Shtok et al. (2021) Shtok, J.; Harary, S.; Azulai, O.; Goldfarb, A. R.; Arbelle, A.; and Karlinsky, L. 2021. CHARTER: heatmap-based multi-type chart data extraction. arXiv preprint arXiv:2111.14103.
- Sun et al. (2019) Sun, K.; Xiao, B.; Liu, D.; and Wang, J. 2019. Deep high-resolution representation learning for human pose estimation. In Computer Vision and Pattern Recognition (CVPR), 5693–5703.
- Zhang et al. (2022) Zhang, H.; Li, F.; Liu, S.; Zhang, L.; Su, H.; Zhu, J.; Ni, L. M.; and Shum, H.-Y. 2022. Dino: Detr with improved denoising anchor boxes for end-to-end object detection. In International Conference on Learning Representations.
- Zhu et al. (2021) Zhu, X.; Su, W.; Lu, L.; Li, B.; Wang, X.; and Dai, J. 2021. Deformable detr: Deformable transformers for end-to-end object detection. In International Conference on Learning Representations (ICLR).