Anharmonic Strong-Coupling Effects at the Origin of the Charge Density Wave in CsV3Sb5
Abstract
The formation of charge density waves (CDW) is a long-standing open problem particularly in dimensions higher than one Peierls (1955); Varma and Simons (1983); Eiter et al. (2013). Various observations in the vanadium antimonides discovered recently Ortiz et al. (2019, 2020), such as the missing Kohn anomaly in the acoustic phonons Li et al. (2021); Xie et al. (2022) or the latent heat at the transition K Ortiz et al. (2019); Ni et al. (2021), further underpin this notion. Here, we study the Kagome metal CsV3Sb5 using polarized inelastic light scattering. The electronic energy gap as derived from the redistribution of the continuum is much larger than expected from mean-field theory and reaches values above 20 for . The phonon has a discontinuity at and a precursor starting 20 K above . Density functional theory qualitatively reproduces the redistribution of the electronic continuum at the CDW transition and the phonon energies of the pristine and distorted structures. The linewidths of all and phonon lines including those emerging below were analyzed in terms of anharmonic symmetric decay Klemens (1966) revealing strong phonon-phonon coupling. In addition, we observe two CDW amplitude modes (AMs): one in symmetry and one in symmetry. The temperature dependence of both modes deviates from the prediction of mean-field theory. The AM displays an asymmetric Fano-type lineshape, suggestive of strong electron-phonon coupling. The asymmetric AM, along with the discontinuity of the phonon, the large phonon-phonon coupling parameters and the large gap ratio, indicate the importance of anharmonic strong phonon-phonon and electron-phonon coupling Varma and Simons (1983) for the CDW formation in CsV3Sb5 .
I Introduction
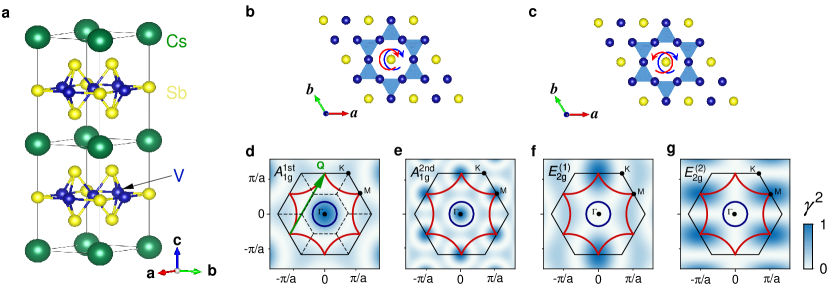
Lattices of magnetic ions having regular triangular coordination are characterized by multiple ordering phenomena including ferromagnetism, frustrated antiferromagnetism, density waves and superconductivity (SC). These lattices attracted a lot of attention not only for the magnetism but also for the specific band structure being characterized by a Dirac dispersion and Weyl nodes induced by spin-orbit coupling. As a typical example, the vanadium-antimony compound class V3Sb5 ( K, Rb, Cs) forming a Kagome lattice with hexagons and triangles alternating was discovered recently Ortiz et al. (2019, 2020, 2021); Yin et al. (2021). The V-Sb Kagome layers are separated by Sb honeycomb-like layers and alkali monolayers as shown in Fig. 1 a. At low temperature, charge density waves (CDW) and SC may occur. The focus here is placed on the CDW transition forming a superlattice at in the 100-kelvin range which may be driven by an unconventional mechanism beyond electron-phonon interaction. Rather, the proximity to a Van Hove singularity close to the Fermi surface is considered responsible for the instability Li et al. (2021).
Obviously, the ordering vector Q connects two M points (see the green arrow in Fig. 1 d) in agreement with the electronic structure predicted theoretically Zhao et al. (2021a) and observed by angle-resolved photoemission spectroscopy (ARPES) Kang et al. (2022) and scanning tunneling spectroscopy (STS) Zhao et al. (2021b). Yet, the meaning of the observed energy scales is still controversial. ARPES Wang et al. (2021a) and STS Jiang et al. (2021); Liang et al. (2021) find a gap at 20 meV and thus just one-fourth of the scale observed by infrared spectroscopy Zhou et al. (2021); Uykur et al. (2021). More recent ARPES measurements disclose that the small gap may originate from massive Dirac points Nakayama et al. (2021), and a larger CDW gap may open at the points Nakayama et al. (2021); Luo et al. (2022) and corresponds to a ratio far beyond the weak coupling prediction of 3.53. Complementary to spectroscopic methods thermodynamic studies indicate a divergence in the heat capacity being more compatible with a first-order rather than a second-order transition as usually expected for a CDW Ortiz et al. (2020).
There are various experimental methods that can be used to attack this issue. One may look for anomalies close to the ordering vector Q in the acoustic phonon branches using either neutron Xie et al. (2022) or inelastic x-ray scattering Li et al. (2021). This search has been unsuccessful so far, and the conclusion reached is that either k-dependent electron-phonon coupling or electron-electron interaction is the origin of CDW ordering. Alternatively, optical phonons displaying renormalization effects at Wulferding et al. (2022); Wu et al. (2022); Liu et al. (2022) or Fano-type line shapes may indicate strong electron-phonon coupling. In addition to phonons, oscillations of both the amplitude and the phase of the order parameter are expected for a CDW system Lee et al. (1993). For symmetry reasons, Raman scattering and time resolved techniques project the amplitude mode (AM) directly thus tracking the CDW phase transition Grasset et al. (2019); Chen et al. (2017); Lavagnini et al. (2010); Wu et al. (2022); Liu et al. (2022). In weak-coupling systems, the AMs are expected to have a symmetric Lorentzian line-shape Lavagnini et al. (2010); Grasset et al. (2019) with increasing width upon approaching from below. It is not clear which effect on the AM may be expected if the coupling increases substantially. Finally, the CDW electronic gap is accessible by light scattering.
In this paper, we address the open questions as to the states involving the formation of CDW order, including the size and momentum dependence of the electronic gap, the renormalization of phonons, and the evolution of collective modes, by investigating the temperature and polarization dependent inelastic light scattering response in CsV3Sb5 . In particular, in contrast to the AMs found in most of other well-known CDW materials, we found the AM to be asymmetric in CsV3Sb5 , exhibiting a strong Fano resonance between the conduction electrons and the AM. These results along with the strong anharmonic decay of the two prominent Raman-active phonons and most of the CDW-induced phonons highlight the importance of a cooperation between strong phonon-phonon and electron-phonon coupling in the formation of CDW in CsV3Sb5 .
II Results
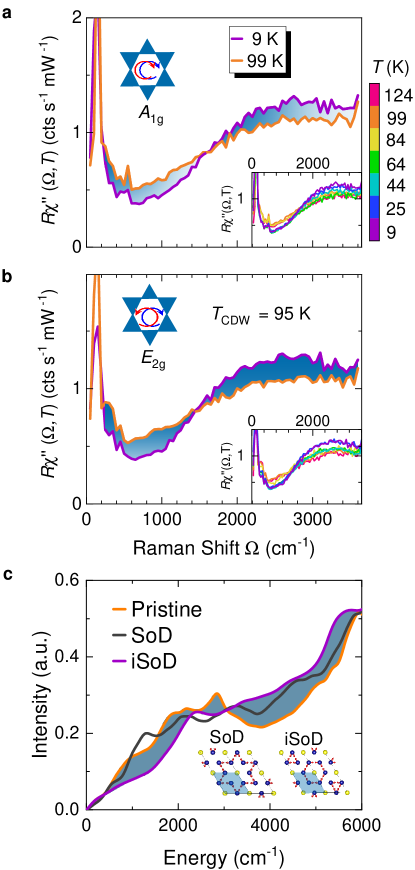
Figure 2 shows the Raman spectra of CsV3Sb5 above and below for and symmetry in the range from 50 to 3600 cm-1 . There is a redistribution of spectral weight from below to above the intersection points at approximately 1 400 and 1 540 cm-1 in the and the spectra, respectively. The redistribution of the spectral weight is well reproduced for different laser excitations (see Supplementary Materials C for details). The gradual redistribution of spectral weight is a signature of the opening of an energy gap in the electronic excitation spectrum of a CDW system Eiter et al. (2013). Upon warming, the amplitude of the redistribution decreases and disappears completely above as shown in the insets of Fig. 2 a and b. The gap energy is estimated to be close to the intersection points at 87.5 - 96.2 meV yielding a gap ratio of , similar to the results of IR spectroscopy and recent ARPES measurements Zhou et al. (2021); Uykur et al. (2021); Nakayama et al. (2021); Luo et al. (2022). As opposed to the IR results, we do neither observe a significant temperature dependence of the intersection points nor the peak energies.
The CDW gap is qualitatively reproduced by the DFT simulations as presented in Fig. 2 c. The electronic response of CsV3Sb5 is approximated for pristine-, SoD- and iSoD-distorted-lattices (see the insets of Fig. 2 c) using the joint density of states (see Methods and Supplementary Materials G for more details). Compared to the response in the pristine-lattice, a reduction in spectral weight is found in the iSoD distorted lattice below 2000 cm-1 , which can barely be seen in the SoD lattice. This result, together with the electronic Raman spectra, suggests an iSoD distortion in CsV3Sb5 to have minimum energy. The mismatch in energy between DFT calculations and the experiments may be reconciled by considering a renormalization factor of approximately 1.5.
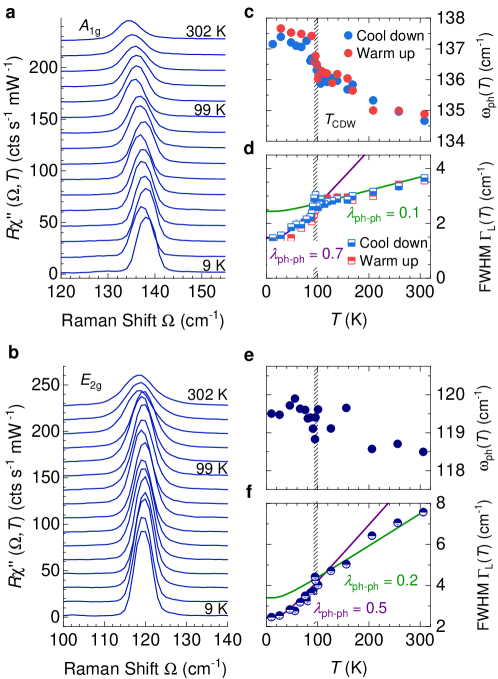
Two prominent Raman-active phonon lines are observed saturating at 137.5 cm-1 and 119.5 cm-1 in the zero-temperature limit for and symmetry, respectively, as shown in Fig. 3. They have previously been identified by Raman scattering Chen et al. (2021); Wulferding et al. (2022); Wu et al. (2022); Liu et al. (2022).
Both the and the phonons show significant renormalization effects at (see Fig. 3 ). Upon cooling, the phonon has a precursor starting 20 K above , changes discontinuously at and saturates below (see Fig. 3 c). This discontinuity, a frequency hardening of approximately 0.5% is replicated in DFT simulations (Details can be found in Table II. of Supplementary Materials G).
Although the energies observed upon cooling and heating do not exactly coincide the hysteresis cannot be considered significant. Thus there is no support for a first-order phase transition from the phonon. The energy of the line does not exhibit significant changes across (see Fig. 3 e). A weak dip exactly at may exist but our resolution is not sufficient to have enough confidence. In either symmetry, the line width exhibits a kink at and decreases faster below than above (see Fig. 3 d and f). There may be a weak enhancement of the line width right at the transition.
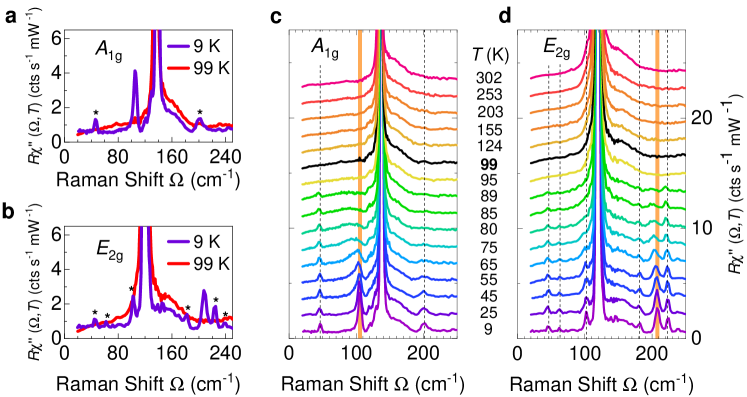
The weak additional lines observed below are indicated by black asterisks and orange diamonds in Fig. 4 a and b. In the zero-temperature limit the three lines are located at 43.0 cm-1 , 105.4 cm-1 and 200.0 cm-1 . The six lines appear at 43.2 cm-1 , 60.0 cm-1 , 101.0 cm-1 , 180.0 cm-1 , 208.2 cm-1 and 224.0 cm-1 . The lines at 43.0 cm-1 and 105.4 cm-1 are also found in pump-probe experiments Ratcliff et al. (2021); Wang et al. (2021b). These new emerging lines are observed at nearly the same energies for different laser excitations (see Supplementary Materials D for details). Details of the temperature dependent positions and FWHMs of these lines can be found in Supplementary Materials E.
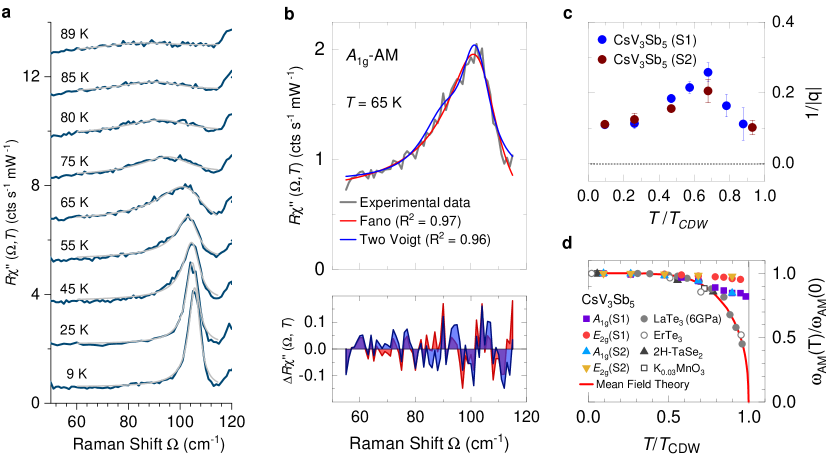
The lines marked by asterisks have weak and conventional temperature dependences and soften by less than 2 % between the low-temperature limit and (see Fig. 4 c and d). The lines at 105 cm-1 and 208 cm-1 labeled with orange diamonds shift to lower energies by 17 and 10 cm-1 , respectively, upon approaching , corresponding approximately to 15 % and 5 % relative shift. These two lines are identified as CDW AM in CsV3Sb5 . The line broadens by approximately an order of magnitude close to and assumes a rather asymmetric shape in the range 40-80 K (see Fig. 5 a).
III Discussion
III.1 Excitations across the gap
The electronic Raman spectra (cf. Fig. 2) are consistent with a very large energy gap in excess of 80 meV. The ratio / = 21-23, is almost 6 times the weak coupling mean field value of 3.53. This observation may be attributed to fluctuating short range CDW order Grüner (1994); Joshi et al. (2019) which suppresses the observed transition below the mean-field value or to strong anharmonic electron-phonon coupling Varma and Simons (1983). We carefully checked the electronic spectra above but could not find indications of fluctuations (see Supplementary Materials F for details) what favors strong coupling.
The anisotropy of the gap is substantial and manifests itself in the spectra as a broad intensity distribution and a small but significant difference in the intersection energies. It is not clear why the intensity amplitude (difference between spectra above and below ) in symmetry is similarly strong as in symmetry although only the spectra project the points where a gap is expected. Given the complicated band structure of CsV3Sb5 , it is possible that higher-order contributions to the vertex lend more weight to the regions than the lowest order vertex (compare Fig. 1 d and e). Alternatively, the band folding induced by the periodic distortion Kang et al. (2022) could explain the relatively large amplitude (see the folded Brillouin zone in Fig. 1 d).
III.2 New phonon lines below
The additional phonon lines below result from the lowering of the lattice symmetry as spelled out by Wu et al. Wu et al. (2022) and Liu et al. Liu et al. (2022) . The lattice distortion folds the phonon dispersion by a wave vector Q that links the nesting points (M points in CsV3Sb5 ) as seen in Fig. 1 d. Here, the phonons at the zone boundary are folded to the point and become Raman active Samnakay et al. (2015); Albertini et al. (2016). If one considers a SoD or an iSoD distortion (see the insets of Fig. 2 c) that are expected for CsV3Sb5 (Christensen et al. (2021); Liang et al. (2021); Li et al. (2021)), the V atoms move from 3 (1/2, 0, 1/2) to 12 (, , 1/2), and one expects eight additional Raman active modes (two in , four in and two in ). This figure matches the number of the new phonons in our measurements (asterisks only). Furthermore, most of the zone-folded modes quantitatively match the frequencies obtained in the DFT simulations when considering the iSoD distortion Liu et al. (2022). Thus, the simulations of the phonon energies match the energy argument from the electronic spectra. The new lines have similarly large phonon-phonon coupling constants as the strong lines appearing above and below (see Fig. 3 d and f and Tab. I in the Supplementary Materials E), indicating strong phonon-phonon coupling.
III.3 Amplitude modes
The lines at 105 cm-1 and 208 cm-1 in and symmetry, respectively, have significantly stronger temperature dependences than the other lines appearing below , and are identified as AMs. Yet, the variation is much weaker than predicted by mean-field theory (see Fig. 5 d) and observed for the tritellurides, e.g. Lavagnini et al. (2010); Eiter et al. (2013). There may be various reasons for the deviations: (i) Impurities lead to a saturation of the AM frequency at approximately the impurity scattering rate Devereaux (1993). Here, this would imply a rather disordered system with an electronic mean free path of only a few lattice constants. (ii) An effect of strong electron-phonon coupling seems more likely, although enhanced coupling does not necessarily entail a deviation from mean-field theory. Since Ginsburg-Landau theory Wu et al. (2022) is applicable only close to the transition, where no data are available, the study of an extended temperature range below may be deceptive. In addition, the AM is not directly related to the gap, where single-particle (STS, ARPES) and two-particle (IR, Raman) results may return significantly different results. (iii) Strong phonon-phonon coupling and, consequently, higher order contributions from the phonons are not unlikely since the coupling of all modes below is substantial (see Fig. 3 d and f as well as Table I in Supplementary Materials E). This effect may enhance /kB substantially and induce deviations from the mean-field temperature dependence of the AMs Varma and Simons (1983). Thus, phonon-phonon coupling may contribute to the CDW formation here.
Particularly, the line at 105 cm-1 exhibits anomalies in the line width and shape being incompatible with phonons. Right below the line width is as large as 50 cm-1 ( More details can be found in Supplementary Materials E). Previously the asymmetry has been interpreted in terms of two superimposed lines having individual temperature dependences Wu et al. (2022). We did not observe a double structure at low temperature but rather a narrow line having a width (FWHM) of approximately 6 cm-1 at 8 K. We tested both hypotheses and find the Fano line to reproduce the data significantly better in the entire temperature range (see Fig. 5 b, more details can be found in Supplementary Materials H). Here, the AM line with energy and linewidth is fitted using the usual Fano function applicable for ,
| (1) |
to extract the asymmetry parameter . We found that of the AM becomes maximal at 68 K where the putative transition from to stacking is expected Stahl et al. (2022) (see Fig. 5 c).
The Fano line of the AM is unique in CsV3Sb5 and has not been observed in other well-known CDW materials, such as ErTe3 Eiter et al. (2013), LaTe3 Lavagnini et al. (2010), 2H-TaSe2 Hill et al. (2019), and K0.3MoO3 Travaglini et al. (1983), where all AMs have a symmetric Lorentzian line-shape (See Supplementary Materials I). The asymmetric AM, along with the missing soft mode behaviour in the acoustic branches Li et al. (2021); Xie et al. (2022) and the large /kB ratio argue against the weak coupling picture. Thus, strong coupling involving phonon-phonon and electron-phonon interaction is presumably the driving force behind the formation of the CDW in CsV3Sb5 . In this case, the conduction electrons strongly couple with the involved phonons, and may further interact with the AM inducing the Fano line shape. The decrease of the towards zero temperature is presumably a result of the CDW gap opening below 1500 cm-1 , evidenced by the reduction of scattering intensity below some 1500 cm-1 . In addition, we derive signatures of strong phonon-phonon coupling from the anharmonic decay of the Raman-active optical modes giving another boost to the CDW formation Varma and Simons (1983).
IV Conclusions
We performed a polarization- and temperature-dependent Raman scattering study of the Kagome metal CsV3Sb5 . The electronic continua in both the and symmetry exhibit a spectral-weight redistribution below the charge-density-wave transition temperature, K, in agreement with DFT simulations. This redistribution indicates an energy gap of cm-1 (185 meV) corresponding to of approximately 22. The DFT results favour an iSoD distortion for . In the low-energy part of the spectra several phonons pop out below in addition to the two modes in and symmetry Raman active at all temperatures. The additional lines are related to the lattice distortion due to the CDW transition. Intriguingly, we identified two CDW amplitude modes having energies of cm-1 and cm-1 in the low-temperature limit. The AM couples strongly to a continuum as indicated by the Fano-type line shape displaying the strongest asymmetry at the putative cross-over temperature of approximately 60 K between to ordering Stahl et al. (2022). The mode’s temperature dependence is weaker than predicted by mean field theory. This discrepancy may result from either impurities Devereaux (1993) or strong coupling Varma and Simons (1983). Since the crystals are well-ordered we consider the strong-coupling scenario including anharmonic phonon-phonon and electron-phonon coupling Varma and Simons (1983) more likely. This interpretation is consistent with the large electronic gap and the asymmetric AM. Thus, the co-operation of strong electron-phonon and phonon-phonon coupling may be more likely a route to the CDW transition in CsV3Sb5 than, e.g., nesting.
Methods
Samples: Single crystals of CsV3Sb5 were grown from liquid Cs (purity 99.98 %), V powder (purity 99.9 %) and Sb shot (purity 99.999 %) via a modified self-flux method Ni et al. (2021). The mixture was put into an alumina crucible and sealed in a quartz ampoule under argon atmosphere. The mixture was heated at 600 C for 24 h and soaked at 1000 C for 24 h, and subsequently cooled at 2 C/h. Finally, the single crystals were separated from the flux by an exfoliation method. Apart from sealing and heat treatment procedures, all other preparation procedures were carried out in an argon-filled glove box. The crystals have a hexagonal morphology with a typical size of mm3 and are stable in the air. The sample used for the Raman experiments has a of 95 K, characterized by resistivity and in-plane magnetic susceptibility (see Supplementary Materials A for details).
Light scattering: The inelastic light scattering experiments were preformed in pseudo-backscattering geometry. The samples were mounted on the cold finger of a 4He flow cryostat immediately after cleaving. For excitation, a solid-state and an Ar+ laser emitting at 575 nm, 514 nm, and 476 nm were used. The inelastic spectra were divided by the Bose factor yielding where is the imaginary part of Raman response function, is an experimental constant, and is the dynamical structure factor Devereaux and Hackl (2007). Typical phonon lines are describe by Lorentzians. If the width is close to the spectral resolution or below a Voigt function (convolution of a Lorentzian and a Gaussian) has to be used.
For projecting the and symmetries and polarization configurations were used, respectively. In terms of perpendicular linear polarizations and , and are given by and , respectively. The configurations with respect to the Kagome plane are shown in Fig. 1 b and c. For electronic Raman scattering the form factors are important and highlight parts of the Brillouin zone. The form factors or Raman vertices may be expressed in terms of the band curvature or crystal harmonics Devereaux and Hackl (2007). The first- and second-order crystal harmonics of symmetry and the first order crystal harmonics of symmetry and the position of the Fermi pockets of CsV3Sb5 are shown in Fig. 1 d-f and illustrate the sensitivity of the experiment (The vertices derived from the crystal harmonics functions can be found in Supplementary Materials B. For details see Ref. Djurdjić Mijin et al. (2021)).
DFT simulations: DFT calculations were performed using VASP Kresse G (1993) with plane wave augmented (PAW) pseudopotentials and a 300 eV energy cutoff. In all calculations the pristine, SoD, and iSoD states were considered independently as 22 distortions. Lattice constants were calculated with pristine structures and kept fixed in CDW states. Minimum energy CDW states were found around 1.5 lattice distortion from the pristine structure. Structural and electronic calculations were performed on each of the three states. A 17179 KPOINT grid was used for electronic calculations. The electronic response in the main text was approximated using the joint density of states with the following equation:
| (2) |
where
| (3) |
In this equation, and are band indexes, is the Raman vertex at momentum and band , is the spectral weight at momentum and energy , is the Raman shift energy, is the Fermi-Dirac function, is the band dispersion, is the energy broadening. A broadening of 0.02 eV was used in the results in the main text. In the calculations, the Raman vertex is fixed at a value of 1. Thus, selection rules are ignored for the time being.
Phonon calculations were performed using the Phonopy code package Togo et al. (2023); Togo (2023). A 334 K-mesh was utilized for the calculations. Our primary focus here is on the energy of the phonon. In the pristine state, we observed a good agreement between the calculated phonons and those observed experimentally. Based on success by previous studies Tan et al. (2021), for calculations comparing the pristine and CDW states, we employed DFT-3 to stabilize the phonon frequencies in the distorted phases, resulting in an overall frequency shift towards higher energy while maintaining reliable relative positions. Electron phonon coupling to the and was calculated using the frozen phonon method and found to be negligible.
Acknowledgments
We thank R.-Z. Huang for fruitful discussions. This work is supported by the Deutsche Forschungsgemeinschaft (DFG) through the coordinated programme TRR80 (Projekt-ID 107745057) and projects HA2071/12-1 and -3. L.P. and R.H. were partially supported by the Bavaria-California Technology Center (BaCaTeC) under grant number A3 [2022-2]. G.H. would like to thank the Alexander von Humboldt Foundation for a research fellowship. The work in China was supported by grants from the National Key Research and Development Projects of China (2022YFA1204104), the Chinese Academy of Sciences (ZDBS-SSW-WHC001 and XDB33030000),and the National Natural Science Foundation of China (61888102). Theory work at SLAC National Accelerator (EFC, TPD) was supported by the U.S. Department of Energy, Office of Basic Energy Sciences, Division of Materials Sciences and Engineering, under Contract No. DE-AC02-76SF00515. The computational results utilized the resources of the National Energy Research Scientific Computing Center (NERSC) supported by the U.S. Department of Energy, Office of Science, under Contract No. DE-AC02-05CH11231.
Author contributions
R.H. and G.H. conceived the project.
G.H., L. P., D. L. and R.S. performed the Raman measurements. G.H., L.P., E.C., T.P.D., and R.H. analysed the Raman data. Z.Z., H.-T.Y. and H.-J.G.
synthesised and characterised the samples. E.C., B.M. and T.P.D. performed
DFT calculations. G.H., L.P., E.C. and R.H. wrote the manuscript with comments
from all the authors.
Competing interests
The authors declare no competing interests.
References
- Peierls (1955) R. E. Peierls, Quantum Theory of Solids (Oxford: Clarendon Press, 1955) pp. 108–12.
- Varma and Simons (1983) C. M. Varma and A. L. Simons, Phys. Rev. Lett. 51, 138 (1983).
- Eiter et al. (2013) H.-M. Eiter, M. Lavagnini, R. Hackl, E. A. Nowadnick, A. F. Kemper, T. P. Devereaux, J.-H. Chu, J. G. Analytis, I. R. Fisher, and L. Degiorgi, Proc. Natl. Acad. Sci. 110, 64 (2013).
- Ortiz et al. (2019) B. R. Ortiz, L. C. Gomes, J. R. Morey, M. Winiarski, M. Bordelon, J. S. Mangum, I. W. H. Oswald, J. A. Rodriguez-Rivera, J. R. Neilson, S. D. Wilson, E. Ertekin, T. M. McQueen, and E. S. Toberer, Phys. Rev. Mater. 3, 094407 (2019).
- Ortiz et al. (2020) B. R. Ortiz, S. M. L. Teicher, Y. Hu, J. L. Zuo, P. M. Sarte, E. C. Schueller, A. M. M. Abeykoon, M. J. Krogstad, S. Rosenkranz, R. Osborn, R. Seshadri, L. Balents, J. He, and S. D. Wilson, Phys. Rev. Lett. 125, 247002 (2020).
- Li et al. (2021) H. Li, T. T. Zhang, T. Yilmaz, Y. Y. Pai, C. E. Marvinney, A. Said, Q. W. Yin, C. S. Gong, Z. J. Tu, E. Vescovo, C. S. Nelson, R. G. Moore, S. Murakami, H. C. Lei, H. N. Lee, B. J. Lawrie, and H. Miao, Phys. Rev. X 11, 031050 (2021).
- Xie et al. (2022) Y. Xie, Y. Li, P. Bourges, A. Ivanov, Z. Ye, J.-X. Yin, M. Z. Hasan, A. Luo, Y. Yao, Z. Wang, G. Xu, and P. Dai, Phys. Rev. B 105, L140501 (2022).
- Ni et al. (2021) S. Ni, S. Ma, Y. Zhang, J. Yuan, H. Yang, Z. Lu, N. Wang, J. Sun, Z. Zhao, D. Li, S. Liu, H. Zhang, H. Chen, K. Jin, J. Cheng, L. Yu, F. Zhou, X. Dong, J. Hu, H.-J. Gao, and Z. Zhao, Chin. Phys. Lett. 38, 057403 (2021).
- Klemens (1966) P. G. Klemens, Phys. Rev. 148, 845 (1966).
- Ortiz et al. (2021) B. R. Ortiz, P. M. Sarte, E. M. Kenney, M. J. Graf, S. M. L. Teicher, R. Seshadri, and S. D. Wilson, Phys. Rev. Mater. 5, 034801 (2021).
- Yin et al. (2021) Q. Yin, Z. Tu, C. Gong, Y. Fu, S. Yan, and H. Lei, Chin. Phys. Lett. 38, 037403 (2021).
- Zhao et al. (2021a) J. Zhao, W. Wu, Y. Wang, and S. A. Yang, Phys. Rev. B 103, L241117 (2021a).
- Kang et al. (2022) M. Kang, S. Fang, J.-K. Kim, B. R. Ortiz, S. H. Ryu, J. Kim, J. Yoo, G. Sangiovanni, D. Di Sante, B.-G. Park, C. Jozwiak, A. Bostwick, E. Rotenberg, E. Kaxiras, S. D. Wilson, J.-H. Park, and R. Comin, Nature Phys. 18, 301 (2022).
- Zhao et al. (2021b) H. Zhao, H. Li, B. R. Ortiz, S. M. L. Teicher, T. Park, M. Ye, Z. Wang, L. Balents, S. D. Wilson, and I. Zeljkovic, Nature 599, 216 (2021b).
- Wang et al. (2021a) Z. G. Wang, S. Ma, Y. H. Zhang, H. T. Yang, Z. Zhao, Y. Ou, Y. Zhu, S. L. Ni, Z. Y. W. Lu, H. Chen, K. Jiang, L. Yu, Y. Zhang, X. L. Dong, J. P. Hu, H. J. Gao, and Z. X. Zhao, arXiv:2104.05556 (2021a).
- Jiang et al. (2021) Y.-X. Jiang, J.-X. Yin, M. M. Denner, N. Shumiya, B. R. Ortiz, G. Xu, Z. Guguchia, J. He, M. S. Hossain, X. Liu, J. Ruff, L. Kautzsch, S. S. Zhang, G. Chang, I. Belopolski, Q. Zhang, T. A. Cochran, D. Multer, M. Litskevich, Z.-J. Cheng, X. P. Yang, Z. Wang, R. Thomale, T. Neupert, S. D. Wilson, and M. Z. Hasan, Nature Mater. 20, 1353 (2021).
- Liang et al. (2021) Z. Liang, X. Hou, F. Zhang, W. Ma, P. Wu, Z. Zhang, F. Yu, J.-J. Ying, K. Jiang, L. Shan, Z. Wang, and X.-H. Chen, Phys. Rev. X 11, 031026 (2021).
- Zhou et al. (2021) X. Zhou, Y. Li, X. Fan, J. Hao, Y. Dai, Z. Wang, Y. Yao, and H.-H. Wen, Phys. Rev. B 104, L041101 (2021).
- Uykur et al. (2021) E. Uykur, B. R. Ortiz, O. Iakutkina, M. Wenzel, S. D. Wilson, M. Dressel, and A. A. Tsirlin, Phys. Rev. B 104, 045130 (2021).
- Nakayama et al. (2021) K. Nakayama, Y. Li, T. Kato, M. Liu, Z. Wang, T. Takahashi, Y. Yao, and T. Sato, Phys. Rev. B 104, L161112 (2021).
- Luo et al. (2022) H. Luo, Q. Gao, H. Liu, Y. Gu, D. Wu, C. Yi, J. Jia, S. Wu, X. Luo, Y. Xu, L. Zhao, Q. Wang, H. Mao, G. Liu, Z. Zhu, Y. Shi, K. Jiang, J. Hu, Z. Xu, and X. J. Zhou, Nature Commun. 13, 273 (2022).
- Wulferding et al. (2022) D. Wulferding, S. Lee, Y. Choi, Q. Yin, Z. Tu, C. Gong, H. Lei, S. Yousuf, J. Song, H. Lee, T. Park, and K.-Y. Choi, Phys. Rev. Res. 4, 023215 (2022).
- Wu et al. (2022) S. Wu, B. R. Ortiz, H. Tan, S. D. Wilson, B. Yan, T. Birol, and G. Blumberg, Phys. Rev. B 105, 155106 (2022).
- Liu et al. (2022) G. Liu, X. Ma, K. He, Q. Li, H. Tan, Y. Liu, J. Xu, W. Tang, K. Watanabe, T. Taniguchi, L. Gao, Y. Dai, H.-H. Wen, B. Yan, and X. Xi, Nature Commun. 13, 3461 (2022).
- Lee et al. (1993) P. Lee, T. Rice, and P. Anderson, Solid State Communi. 88, 1001 (1993).
- Grasset et al. (2019) R. Grasset, Y. Gallais, A. Sacuto, M. Cazayous, S. Mañas Valero, E. Coronado, and M.-A. Méasson, Phys. Rev. Lett. 122, 127001 (2019).
- Chen et al. (2017) R. Y. Chen, S. J. Zhang, M. Y. Zhang, T. Dong, and N. L. Wang, Phys. Rev. Lett. 118, 107402 (2017).
- Lavagnini et al. (2010) M. Lavagnini, H.-M. Eiter, L. Tassini, B. Muschler, R. Hackl, R. Monnier, J.-H. Chu, I. R. Fisher, and L. Degiorgi, Phys. Rev. B 81, 081101 (2010).
- Chen et al. (2021) X. Chen, X. Zhan, X. Wang, J. Deng, X.-B. Liu, X. Chen, J.-G. Guo, and X. Chen, Chin. Phys. Lett. 38, 057402 (2021).
- Ratcliff et al. (2021) N. Ratcliff, L. Hallett, B. R. Ortiz, S. D. Wilson, and J. W. Harter, Phys. Rev. Mater. 5, L111801 (2021).
- Wang et al. (2021b) Z. X. Wang, Q. Wu, Q. W. Yin, C. S. Gong, Z. J. Tu, T. Lin, Q. M. Liu, L. Y. Shi, S. J. Zhang, D. Wu, H. C. Lei, T. Dong, and N. L. Wang, Phys. Rev. B 104, 165110 (2021b).
- Grüner (1994) G. Grüner, Density Waves in Solids (Perseus, Cambridge, MA, 1994).
- Joshi et al. (2019) J. Joshi, H. M. Hill, S. Chowdhury, C. D. Malliakas, F. Tavazza, U. Chatterjee, A. R. Hight Walker, and P. M. Vora, Phys. Rev. B 99, 245144 (2019).
- Samnakay et al. (2015) R. Samnakay, D. Wickramaratne, T. R. Pope, R. K. Lake, T. T. Salguero, and A. A. Balandin, Nano Lett. 15, 2965 (2015).
- Albertini et al. (2016) O. R. Albertini, R. Zhao, R. L. McCann, S. Feng, M. Terrones, J. K. Freericks, J. A. Robinson, and A. Y. Liu, Phys. Rev. B 93, 214109 (2016).
- Christensen et al. (2021) M. H. Christensen, T. Birol, B. M. Andersen, and R. M. Fernandes, Phys. Rev. B 104, 214513 (2021).
- Devereaux (1993) T. P. Devereaux, Phys. Rev. B 47, 5230 (1993).
- Stahl et al. (2022) Q. Stahl, D. Chen, T. Ritschel, C. Shekhar, E. Sadrollahi, M. C. Rahn, O. Ivashko, M. v. Zimmermann, C. Felser, and J. Geck, Phys. Rev. B 105, 195136 (2022).
- Hill et al. (2019) H. M. Hill, S. Chowdhury, J. R. Simpson, A. F. Rigosi, D. B. Newell, H. Berger, F. Tavazza, and A. R. Hight Walker, Phys. Rev. B 99, 174110 (2019).
- Travaglini et al. (1983) G. Travaglini, I. Mörke, and P. Wachter, Solid State Commun. 45, 289 (1983).
- Devereaux and Hackl (2007) T. P. Devereaux and R. Hackl, Rev. Mod. Phys. 79, 175 (2007).
- Djurdjić Mijin et al. (2021) S. Djurdjić Mijin, A. Baum, J. Bekaert, A. Šolajić, J. Pešić, Y. Liu, G. He, M. V. Milošević, C. Petrovic, Z. V. Popović, R. Hackl, and N. Lazarević, Phys. Rev. B 103, 245133 (2021).
- Kresse G (1993) H. J. Kresse G, Phys. Rev. B 47, 558 (1993).
- Togo et al. (2023) A. Togo, L. Chaput, T. Tadano, and I. Tanaka, J. Phys. Condens. Matter 35, 353001 (2023).
- Togo (2023) A. Togo, J. Phys. Soc. Jpn. 92, 012001 (2023).
- Tan et al. (2021) H. Tan, Y. Liu, Z. Wang, and B. Yan, Phys. Rev. Lett. 127, 046401 (2021).
- Yumigeta et al. (2022) K. Yumigeta, Y. Attarde, J. Kopaczek, M. Y. Sayyad, Y. Shen, M. Blei, S. T. Rajaei Moosavy, Y. Qin, R. Sailus, and S. Tongay, APL Mater. 10, 111112 (2022).