Aspects of the microscopic structure of curcumin solutions with water-dimethylsulfoxide solvent. Molecular dynamics computer simulation study
Abstract
We explore some aspects of the microscopic structure of curcumin solutions with water-dimethylsulfoxide solvent of variable composition. Molecular dynamics computer simulations at isobaric-isothermal conditions are used for this purpose. The model consists of the OPLS-UA type model for the enol conformer of curcumin (J. Mol. Liq., 223, 707, 2016), the OPLS model for the dimethylsulfoxide (DMSO) and the SPC/E water model. Radial distributions for the centers of mass of curcumin molecules are evaluated and the corresponding running coordination numbers are analyzed. The disaggregation of curcumin clusters upon increasing the DMSO content in water-DMSO solvent is elucidated. Changes of the distribution of water and DMSO species around curcumin molecules are investigated. A qualitative comparison of our findings with the results of other authors is performed. A possibility to relate predictions of the model with the experimental observations in terms of the so-called critical water aggregation percentage is discussed.
Key words: curcumin, united atom model, molecular dynamics, water, dimethylsulfoxide, clusters
Abstract
Àñïåêòè ìiêðîñêîïiчíî¿ ñòðóêòóðè êóðêóìiíó ó âîäíî-äèìåòèëñóëüôîêñèäíîìó ðîçчèííèêó. Äîñëiäæåííÿ êîìï’þòåðíèì ìîäåëþâàííÿì ìåòîäîì ìîëåêóëÿðíî¿ äèíàìiêè.
Ìè äîñëiäæóєìî äåÿêi àñïåêòè ìiêðîñêîïiчíî¿ ñòðóêòóðè êóðêóìiíó ó âîäíî-äèìåòèëñóëüôîêñèäíîìó ðîçчèííèêó ðiçíî¿ êîìïîçèöi¿. Äëÿ öüîãî ïðîâåäåíî êîìï’þòåðíå ìîäåëþâàííÿ ìåòîäîì ìîëåêóëÿðíî¿ äèíàìiêè ïðè ïîñòiéíié òåìïåðàòóði òà òèñêó. Ñèñòåìà ñêëàäàєòüñÿ ç OPLS-UA ìîäåëi äëÿ åíîëüíîãî êîíôîðìåðà êóðêóìiíó (J. Mol. Liq., 223, 707, 2016), OPLS ìîäåëi äëÿ äèìåòèëñóëüôîêñèäó (DMSO) i SPC/E ìîäåëi âîäè. Ðîçðàõîâàíî ðàäiàëüíi ðîçïîäiëè öåíòðiâ ìàñ ìîëåêóë êóðêóìiíó òà ïðîàíàëiçîâàíî âiäïîâiäíi äî íèõ áiæóчi êîîðäèíàöiéíi чèñëà. Ç’ÿñîâàíî âïëèâ çáiëüøåííÿ êîíöåíòðàöi¿ DMSO ó ðîçчèííèêó âîäà-DMSO íà äåçàãðåãàöiþ êëàñòåðiâ êóðêóìiíó. Äîñëiäæåíî çìiíè ðîçïîäiëó ìîëåêóë âîäè òà DMSO íàâêîëî ìîëåêóë êóðêóìiíó. Âèêîíàíî ÿêiñíå ïîðiâíÿííÿ íàøèõ âèñëiäiâ ç ðåçóëüòàòàìè iíøèõ àâòîðiâ. Îáãîâîðåíî ìîæëèâiñòü âçàєìîçâ’ÿçêó ðåçóëüòàòiâ ìîäåëi ç åêñïåðèìåíòàëüíèìè äàíèìè â òåðìiíàõ òàê çâàíîãî êðèòèчíîãî âiäñîòêà àãðåãàöi¿ âîäè.
Ключовi слова: êóðêóìií, ìîäåëü îá’єäíàíèõ àòîìiâ, ìîëåêóëÿðíà äèíàìiêà, âîäà, äèìåòèëñóëüôîêñèä, êëàñòåðè
1 Introduction
This manuscript has been prepared as a tribute to Prof. Taras Bryk, distinguished Ukrainian scientist in the field of statistical physics, computer simulations of water, aqueous solutions and interfaces, on behalf of his 60th birthday. Dr. T. Bryk has made several important contributions along different lines of research in the theory of liquids. One part of his past and recent studies, see e.g., [1, 2, 3, 4, 5], is methodologically related to the objectives of the present work, specifically to molecular dynamics computer simulations of water and complex solutions.
In this short communication, we are interested in liquid solutions containing a small amount of curcumin solutes. In general terms, it is an ample scientific problem of interest for computer modelling and applications that require systematic investigations. We would like to report here only some very fresh results, yielding certain basic insights within this kind of research. There remains much room for further studies.
Curcumin is of much interest due to pharmacological aspects of its application, see e.g. [6, 7, 8, 9, 10]. However, this bioactive hydrophobic polyphenol belongs to the group of poorly water soluble drugs. Thus, its delivery to the targets for therapeutic purposes is problematic [11]. In some cases, solvent blends have been used to develop liquid formulations [12, 13] with enhanced solubility of curcumin solutes and improved delivery properties. In contrast to water solvent, curcumin is quite soluble in organic solvents such as the DMSO, ethanol and methanol, for example. Therefore, for exploratory purposes, in this study we use the solvent consisting of two species, namely of water and DMSO with variable composition. DMSO is the aprotic polar solvent of much interest for biological applications on its own [14].
From the theoretical perspective, the system in question is extremely complex. In order to uncover the fundamental issues and provide hints for experimental studies, the quantum chemistry methods and molecular dynamics computer simulations have been applied for curcumin solutions. Due to various simplifying assumptions intrinsic within theoretical modelling and focus on solely specific issues of the problem, a comparison of the results with experimental predictions remains elusive [15].
Quite recent studies of curcumin solutions by using computer simulation techniques [16, 17, 18, 19, 20, 21, 22, 23, 24] in the majority of cases restrict to pure water as solvent. Much less attention has been paid to the performance of curcumin in non-aqueous solvents. Moreover, the simulations in many cases restricted to the models of a single curcumin molecule in the “sea” of solvent species. Thus, a competition between the effects of solute-solute and solute-solvent interactions has been left out of attention. Commonly, the modelling of the curcumin molecule force field comes out from the quantum chemical (QC) calculations within the B3LYP method using different versions of Gaussian software [19, 20, 25, 26].
Recently, Ilnytskyi et al. developed a simpler, OPLS-united atom (UA) model for the curcumin molecule [27] using the OPLS data basis [28]. The model for a single molecule was tested in vacuum and in water medium using classical molecular dynamics simulations [27]. Next, for the sake of comparisons, the model was tested in methanol and in DMSO apart of water, by using molecular dynamics simulations [29]. A qualitative agreement for the specific trends of behaviour of the systems in question with the modelling of other authors was obtained. Further, in the most recent work from this laboratory [30], we focused in systems with a larger number of curcumin molecules (, , , , and ) in water, in close similarity to the studies of other authors [20, 25, 26]. At this stage, our predictions for the microscopic structure yielding self-assembly of curcumin solutes into clusters are discussed versus the results of [20] concerned with the similar computational setup.
In order to specify the principal objective of the present work, we would like to make a few comments pertinent to the expected behaviour of the systems under study. As documented in [20] from the analysis provided in [31], the hydrophobic nature of the phenyl rings of curcumin along with hydrogen bond formation ability of the side groups is proposed to be the reasons for the aggregation in water. It is difficult to discern the observed trends as separate contributions from the direct interaction between phenyl rings, determined by the model, and/or from the cooperative effect of aqueous medium. Definitely, water solvent promotes hydrophobic association of curcumin molecules and leads to the formation of clusters. Intuitively, to get a more homogeneous solution at the microscopic scale, or say to mitigate the undesired clustering, one should substitute a certain amount of water molecules by organic co-solvent species. We used here the DMSO molecules with this aim. The DMSO co-solvent is miscible with water. Amphiphilic character of the DMSO molecule is due to two methyl groups in its chemical structure. Affinity of these groups to the elements of the curcumin molecule contributes to the solubility of curcumin in pure DMSO [12, 13]. However, these groups “dislike” water species. On the other hand, the oxygen atom of DMSO molecule can form hydrogen bonds with either of water hydrogens. Thus, the amphiphilicity of DMSO results in the hydrophobic effect in water-DMSO mixture at a low DMSO content in water [32]. This effect is more pronounced in water-DMSO mixture compared to mixtures of water with simple alcohols [33]. In summary, in qualitative terms, one would expect that clusters of curcumin molecules will self-destroy or disaggregate upon adding the DMSO species to water. Apparently, the principal mechanism of declusterization would come from the permeation of DMSO molecules into loosely packed curcumin clusters and of solvation of curcumin clusters and monomers by DMSO, that both lead to less and less attractive effective interaction, or equivalently of the less attractive potential of the mean force between the curcumin molecules. However, this effective interaction depends on the distance and on orientation of curcumin molecules. We intend to analyze these trends in terms of distance dependent descriptors for the phenyl groups of curcumin molecules and of some atom-atom pair distribution functions.
This kind of behaviour was elucidated very recently in [26] for curcumin dissolved in water-ethanol mixtures and characterized in terms of useful, although rather crude property, referred to as the critical water aggregation percentage, i.e., the limit percentage in which curcumin monomers are predominant rather than their self-aggregated state. This percentage was abbreviated as CWAP. The authors performed concise spectroscopic analysis of curcumin solutions with water-ethanol solvent using chemometric software to capture the CWAP and discuss various related issues. These observations guide us to explore the existence of CWAP and its evaluation for curcumin in water-DMSO solvent by using analysis of the microscopic structure upon changing the solvent composition. Unfortunately, we have not found experimental data in this respect for the solutions that involve the DMSO species.
2 Model and simulation details
Molecular dynamics computer simulations of curcumin molecules in water-DMSO solvent with variable composition have been performed in the isothermal-isobaric (NPT) ensemble at a temperature of K and at bar. The GROMACS simulation software [34] version 5.1.4 was used.
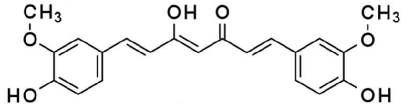
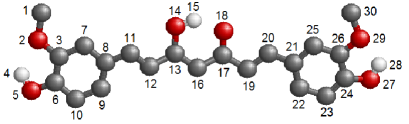
The model for curcumin molecule was constructed in the previous studies from this laboratory by using the OPLS-united atom (UA) force field [27]. Water and DMSO are described in the framework of SPC-E model [35] and the OPLS-UA (as in [29]), respectively. This combination of the model for three constituents of the solution had been already tested by considering a single curcumin molecule in water, methanol and DMSO [29]. Similarly to our previous works, we restrict attention to the enol tautomer of curcumin. This structure is dominant in solids and in various solvents [36, 37]. The chemical structure of the molecule is given in figure 1. The “ball-and-stick” schematic representation of the molecule had been already presented in [27, 29, 30]. Still, for the sake of convenience of the reader, we show it here again in figure 2.
All the parameters of the force field for curcumin are given in the supporting information file to [27]. All bonds in the curcumin model as well as for DMSO, are considered as rigid and accounted for via constraints, using the LINCS algorithm implemented in GROMACS.
Technical details of the simulation procedure are the same as in [29, 30]. The geometric combination rules were applied to determine the parameters for the cross interactions (rule 3 of GROMACS software). To evaluate Coulomb interactions contributions, the particle mesh Ewald procedure was used (fourth-order spline interpolation and grid spacing for the fast Fourier transform equal to ). The cut-off distance both for Coulomb and Lennard-Jones interactions was chosen equal to nm. The van der Waals tail correction terms to the energy and pressure were taken into account.
For each system, a periodic cubic simulation box was set up with molecules, . Principal results coming from our calculations concern the systems containing twelve curcumin molecules, = . In the series of runs we explored the effects of the composition changes of the solvent. Only the final result for the CWAP is given for the twice bigger number of curcumin molecules, = , as well.
The initial configuration of particles was prepared by placing first the molecules randomly in the simulation box. Next, and molecules were added into the box. Each of the systems underwent the energy minimization to remove a possible overlap of atoms in the starting configuration. This was done by applying the steepest descent algorithm. After the minimization procedure, we performed equilibration of each system with the time duration ps at K and bar using a small time step fs. The Berendsen thermostat with the time constant of ps and isotropic Berendsen barostat with the time constant of ps were applied. The compressibility parameter was taken equal to bar-1 in all simulations.
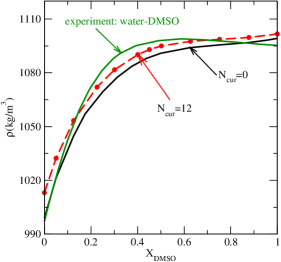
After equilibration, the production runs were performed. We used the V-rescale thermostat with the time constant of and Parrinello-Rahman barostat with the time constant of ps, implemented in the GROMACS software, to perform production runs. The time step in production runs was chosen to be . The results were collected from the production run of ns. For the sake of convenience of the reader, in figure 3, we show the composition dependence of density for water-DMSO mixture coming from the models of water and of DMSO used in the present study. The experimental curve is shown as well. Finally, the nominal density (independent of the cluster existence) of the systems with 12 curcumin molecules and 3988 solvent molecules on composition, resulting from the NPT simulations is given a the dashed curve. A set of circles corresponds to all the systems with different composition under study.
We would like to finish this section by a set of comments concerning the choice of the solvent model. For purposes of the present study, it would be desirable to apply the most precise model for water-DMSO mixture that captures the hydrophobic effect and accurately describes the deviation of various mixing properties from ideality in the entire interval of compositions. In spite of the efforts of many groups, an overall agreement between the computer simulation results and experimental data is not entirely satisfactory at the level of non-polarizable water-DMSO models. Detailed analyses of the state of the art was discussed in our recent contributions [32, 38]. The DMSO and curcumin modelling both are from the OPLS-UA database. It is known that the DMSO OPLS-UA model combined with the SPC/E water is reasonably good for the description of energetic aspects of mixing of solvent species between themselves, cf. figure 3 of [38]. However, this combination of models is not very accurate for the geometric aspects of mixing, say for the excess mixing volume, and does not permit to capture the hydrophobic effect in terms of e.g., apparent molar volumes of species [32]. In summary, it is desirable to employ a more sophisticated model for the mixed solvent, possibly including the TIP4P-type water model and a more sophisticated DMSO description, in future studies of the problem.
3 Results and discussion
3.1 Composition trends of dis-assembly of curcumin particles in water-DMSO solvent. Overall insights
We begin with the description of the radial distribution of the center of mass (COM) of curcumin species in the solvent of variable composition. From the left-hand panel of figure 4, we learn that curcumin molecules self-assembly into a cluster or clusters, in close similarity to the pure water solvent case in [30], if the solvent contains a small fraction of DMSO molecules, because the radial distributions shown in this panel decay to zero at a certain interparticle separation.
We apply the geometric definition for a cluster. Namely, taking into account the behaviour of the radial distribution of curcumin molecules in pure water explored by us recently [30], we choose here the “cut-off” COM-COM distance nm, as a criterion for the cluster definition. Hence, all the curcumin molecules satisfying this geometric criterion during the production run are counted as belonging to a cluster.
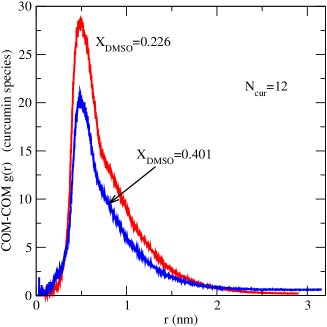
The radial distributions for the systems in question are characterized by a single, not very sharp, maximum, at around nm and small shoulder around nm. In pure water solvent, with the same number of solute molecules, although this shoulder is not observed. The height of the maximum decreases, if the number of the DMSO molecules in the solvent increases or equivalently the number of water molecules decreases. The width of the upper part of the radial distribution apparently does not change upon increasing the DMSO amount in the solvent. However, the shoulder develops and the width of the radial distribution in its lower part increases when increases from to (). One may interpret this behaviour in terms of the changes of the internal structure of a cluster. It attains a certain internal structure and becomes slightly more “diffuse” because the DMSO molecules permeate the cluster.
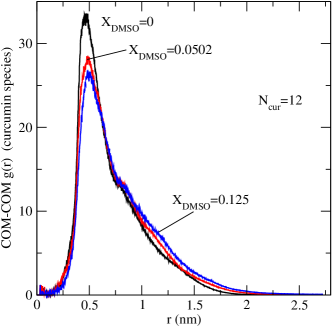
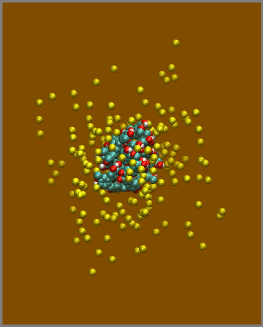
Moreover, it can be seen from the typical snapshot in the right-hand panel of figure 4, for , that certain fraction of the DMSO molecules fills the periphery of the cluster or in other words solvates it. Other DMSO molecules are quite uniformly distributed within water. This and the following plots for snapshots were prepared by using the VMD software [40].
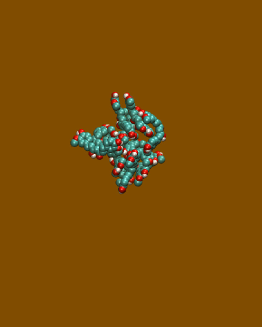
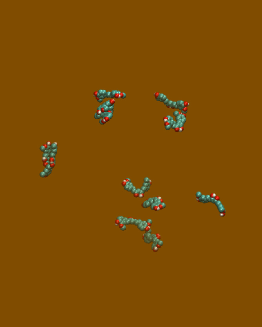
Upon further increase of the DMSO amount in the solvent, figure 5, we observe that at a lower concentration, , the cluster is well defined, cf. the radial distribution function in panel a and the snapshot in panel b. A few monomers may detach from the cluster, as it follows from the snapshot. Still, the radial distribution tends to zero at distances larger than 2.5 nm. At a higher DMSO concentration, , the structure of curcumin species is very different in comparison with the previous case. The radial distribution changes the asymptotic behaviour (top panel of figure 5), it tends to a constant, less than unity, describing a more homogeneous distribution. Still, as it follows from the snapshots in figure 5, the curcumins exhibit microheterogeneity. Some of the curcumin monomers show trends for pairing into dimers.
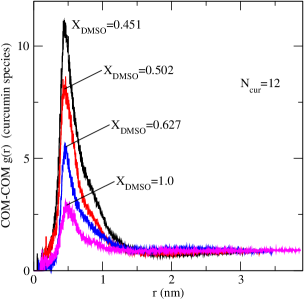
If the solvent is characterized by even higher concentration of DMSO species, the first and only maximum of the radial distribution is observed, figure 6. The height of the maximum decreases with increasing . Moreover, the maximum becomes narrower. Apparently, the shape of the COM-COM radial distribution without minimum after the first maximum and any oscillations is due to a very low curcumin concentration. The distribution of curcumin species is uniform after the first maximum.
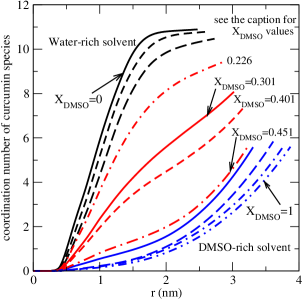
Trends of possible aggregation of curcumin molecules into a cluster in the entire composition interval can be conveniently followed by the evolution of the running coordination number for the COM of curcumin molecules. It is defined as follows,
| (3.1) |
where is the length of the edge of the simulation box. The corresponding curves are given in figure 7. Saturation of the curves to the value, , at a low indicates aggregation of curcumin species into a cluster. On the other hand, at high values of , the coordination number monotonously grows. In terms of this indicator, a change of the shape of the curves occurs in the interval between and . This interval corresponds to the maximum deviation of the pure solvent properties from ideality, see e.g., [32, 38]. The solvent composition with corresponds to one DMSO per two H2O molecules approximately.
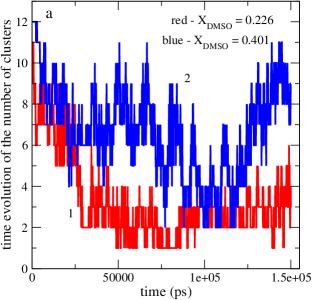
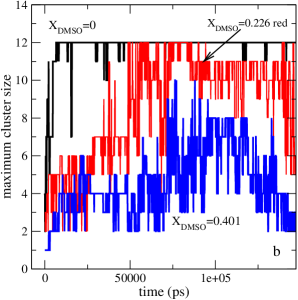
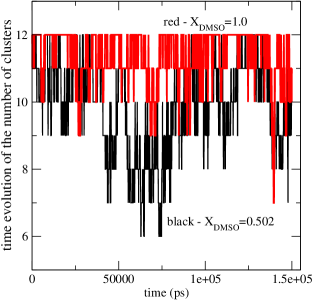
The coordination number of curcumin species provides a quite general but not profound insight into their aggregation. A more detailed knowledge can be extracted from the trajectories by exploring temporal changes of the number of clusters during the system evolution. The time evolution of the number of clusters in the composition interval of out interest is described in panel a of figure 8. We observe that at a lower content of DMSO in the solvent, , the system evolves such that during the final stage of the trajectory the number of clusters predominantly fluctuates in the interval between two and four. Hence, the trimers and larger clusters exist under a chosen DMSO concentration. By contrast, at a higher DMSO fraction, , the number of clusters on the final stage of the production run is larger. At this DMSO concentration, the dimers and possibly trimers prevail. Additional insights follow from the evolution of the maximum cluster size, panel b of figure 8. In pure water, the formation of a single cluster with twelve curcumin molecules is statistically the most frequent event. In the presence of DMSO species in the solvent, the maximum cluster of curcumin particles may consist of several entities, from to , if . At a higher DMSO content, , the maximum cluster size evidences the presence of dimers, trimers and tetramers at the end of the trajectory. At even higher fraction of the DMSO species and in pure DMSO solvent, figure 9, the number of clusters is higher than in the previous cases in figure 8, showing a rather uniform distribution of curcumin molecules in the system, although with appreciable fluctuations. Probably, longer runs are necessary to get better statistical trends.
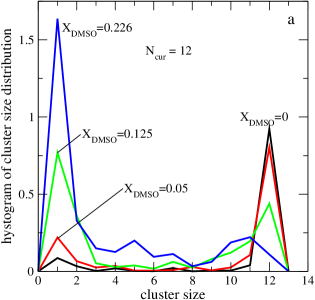
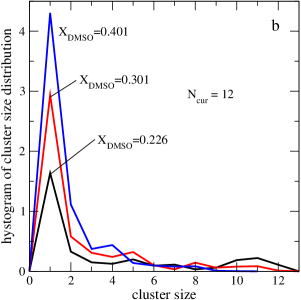
In order to describe the size distribution of clusters formed upon changes of the solvent composition, we collected statistics of cluster size within the production run and constructed a set of histograms following from the entire trajectories. The corresponding curves are given in two panels of figure 10. The following trends are worth mentioning. A large cluster formation is dominant only at a very low DMSO content in the solvent. Already at , the frequency of the appearance of monomers is slightly higher than the probability of the formation of a large curcumin cluster. At a higher fraction of DMSO species in the solvent, , the frequency of monomers becomes higher than the appearance of clusters of several curcumin molecules. Still, these clusters are observed (panel a of figure 10). At even higher values for the DMSO fraction (panel b of figure 10), monomers prevail whereas the formation of clusters becomes much less frequent. Actually, only dimers are frequent in comparison to larger -mers. Disaggregation of curcumin clusters upon increasing DMSO fraction in the solvent results in structural changes in the solute particles distribution and within the curcumin molecules surrounding, say in solute-solvent distribution. Some observations concerned with these issues are illustrated in the following figures.
3.2 Trends of microscopic structure upon disaggregation of curcumin clusters
Changes of the internal structure of clusters during their disaggregation in water-DMSO solvent are illustrated in figure 11. Namely, the radial distributions of phenyl rings (left-left, LR-LR, and left-right, LR-RR) of a curcumin molecule w.r.t. each other are shown.
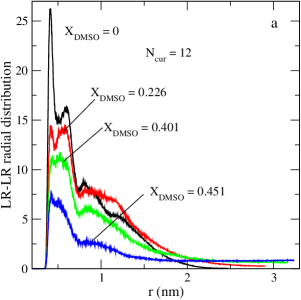
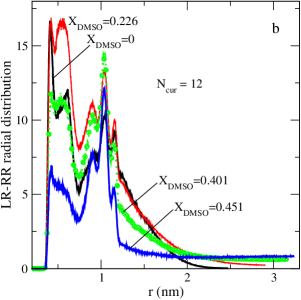
The parallel orientation of the left-hand rings predominates at low fraction of DMSO species in water, i.e., when a rather big curcumin cluster is formed (panel a of figure 11). Substitution of a certain amount of water by the DMSO species results in a quite drastic decay of the magnitude and extent of this type of correlations. Thus, the orientation order of this type is strongly diminished, when the DMSO fraction in the solvent blend increases. The distribution becomes rather uniform even at not very big distances between curcumin molecules.
On the other hand, the anti-parallel orientation observed in water and in water-DMSO solvent behaves differently (panel b of figure 11). Interpretation of the curves in this panel is not straightforward, because they involve an intramolecular contribution. We already know that the intramolecular LR-RR structure of a single curcumin molecule in water and in DMSO is characterized by the distances 0.89 nm, 1.05 nm and 1.16 nm, cf. figure 5 in each of the [27, 29], respectively. It is shown that the characteristic distance 1.05 nm is the most probable. All three characteristic distances are seen in all the curves given in panel b of figure 11.
However, additional features are as follows. The closest “contact” value apparently does not change much, if the DMSO content increases from to . In the latter case, it is even enhanced compared to . Additional maximum at a low LR-RR separation may indicate the shift of a ring with respect to the reference ring leading to parallel-displaced configuration in the composition interval around . At higher DMSO fractions, this behaviour practically disappears. In general terms, an increase of the DMSO fraction results in a lower probability to find anti-parallel orientation of phenyl rings. The features corresponding to the intramolecular structure in fact are much less sensitive to the solvent composition changes. In addition, diminishing values of the distribution function in the interval of distances between 0.4 nm and 1 nm may indicate the presence of the solvent separated phenyl rings as a result of disaggregation of clusters of curcumin species. At , the distribution of rings at separation above 1.2 nm becomes almost uniform.
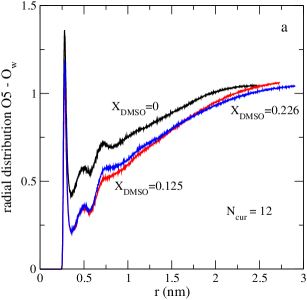
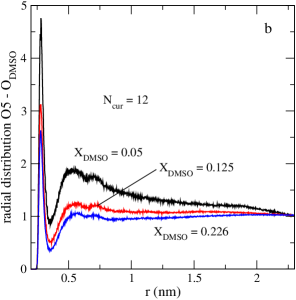
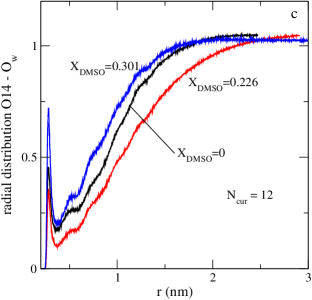
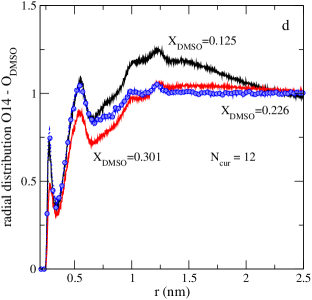
disaggregation of curcumin clusters upon increasing the DMSO fraction results in the changes of the curcumin molecules-solvent interface. The water species at prefer to avoid curcumin molecules as it follows from panels a and c of figure 12. Similar trends preserve, if the fraction of DMSO increases to . If a very small amount of water is substituted by DMSO in the solvent (panel b, ), all these DMSO molecules permeate the curcumin cluster and/or surround the O5 exposed oxygen of curcumin molecule. This result seems to confirm a combined and local (because it refers to O5 oxygen peripheric site) hydrophobic effect when both the curcumin and DMSO molecules avoid contacts with water species. The O–O distribution is not shown for economy of space. At a higher DMSO fraction, see the red and blue lines in panel b, the balance of interactions becomes different. There exists competition between DMSO preference for curcumin and mixing trends of DMSO with water. Consequently, some of the DMSO molecules “dissolve” in curcumin (see the first maximum at nm) whereas the others are almost uniformly distributed at larger distances. Concerning the distribution of the DMSO oxygens with respect to the central fragment of a curcumin molecule (panel d of figure 12), we see that the DMSO species fill the space around O14 in absence of Ow (cf. panels c and d), at a larger separation the distribution is rather uniform, unless the curcumin cluster is present (like in the case at in panel d).
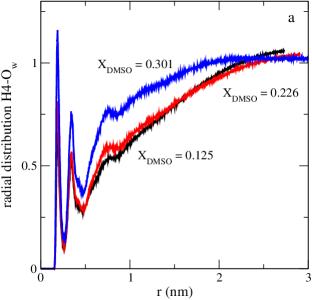
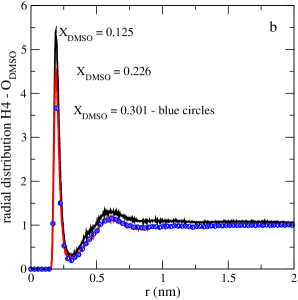
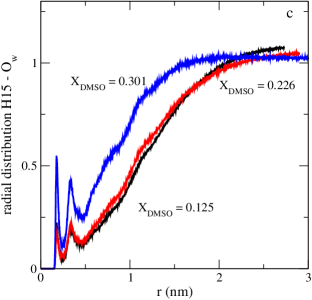
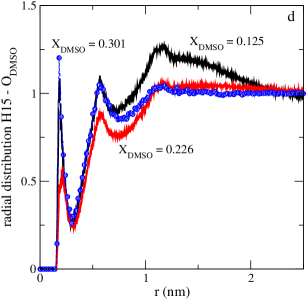
In figure 13, we present similar distributions of water, Ow, and DMSO, O oxygens, although around H4 and H15 hydrogen atoms of a curcumin molecule. The probability of finding water oxygen close to H4 is low (panel a). It slightly increases if the DMSO fraction in the solvent increases. By contrast, the probability for H4-O contact is quite high, possibly even with the formation of hydrogen bond (cf. panel a and panel b). From panel c of this figure 13, we learn that water molecules can hardly approach H15 hydrogen of the curcumin. In fact, the depletion region of this distribution becomes less pronounced upon increasing the DMSO fraction in the solvent, i.e., when the curcumin clusters disaggregate. From panel d of the figure, one can conclude that trends for DMSO permeation into curcumin clusters, namely to become close to H15, are weak. Rather, the DMSO species prefer to locate on the surface of cluster entities (at ) or to distribute uniformly at a distance above nm. In general, we observe that the distribution of both solvent species, water and DMSO, is rather heterogeneous either over the curcumin cluster surface or in the solvation shell of curcumin monomers.
3.3 On the relation with experimental observations
It is known that curcumin is soluble in various solvents [12, 13, 24]. In particular, in ethanol its solubility is of mg/ml. On the other hand, its solubility on DMSO is more than twice higher, mg/ml. The CWAP for curcumin in water-ethanol solvent is at volume/volume , [26]. However, these authors have performed analysis of the aggregation behaviour for the curcumin solution at a single dye concentration. Moreover, it has been observed that the tautomeric equilibrium may interfere into the aggregation of curcumin species upon changing the solvent composition.
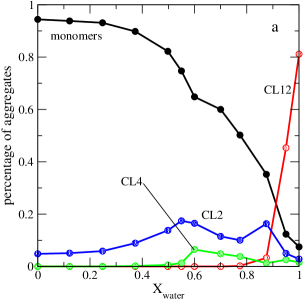
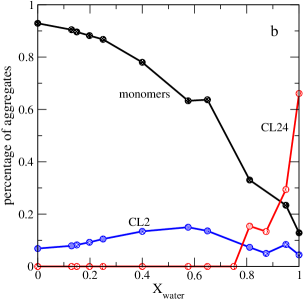
We normalized our data for the histogram distribution of cluster sizes and converted the composition scale into the number fraction of water rather than the DMSO. Then, the results for the system with curcumin molecules look as shown in panel a of figure 14. We observe that the fraction of curcumin monomers overcomes the fraction of clusters with molecules at (from the crossing of red and black lines in each panel). This fraction rapidly decays indicating that the smaller clusters are present in the system. However, the fraction of even quite small clusters composed of curcumin molecules is very small and exhibits a discontinuous jump down to almost zero, if water concentration decreases around . Thus, the the curcumin molecules are predominantly in their monomer form in an ample interval, apparently at . If a more concentrated solution of curcumin in water-DMSO solvent (twice higher) is considered, the fractions of monomers, dimers and of a cluster with curcumin molecules behave as it is shown in panel b of figure 14. If we analyze the trends of behaviour of the coordination numbers, the transition interval between monomers and clusters is expected to occur in the interval between and of water contents, in terms of . Actually, one should consider larger systems to establish more precisely, if the running coordination number saturates to the number of curcumin molecules. Still another possibility is to establish this interval from the behaviour of the self-diffusion coefficient of curcumin species in the solutions. If the cluster motif dominates, the diffusion is expected to be very low. By contrast, at a higher DMSO contents (or quite low water fraction), when the monomer fraction dominates, one would expect quite reasonable diffusion of curcumin species.
Anyway, apparently there exists correlation between the solubility of curcumin in a solvent blend and the location of the CWAP.
4 Summary and conclusions
At this stage of the project, we applied a quite simple modelling of curcumin solutions in water-DMSO solvent of variable composition. Molecular dynamics computer simulations were performed at room temperature and ambient pressure. Our principal findings follow from the analyses of solely the microscopic structure of the system while changing the solvent composition. More specifically, we focused on the disaggregation of curcumin clusters upon substituting a certain amount of water molecules of the solvent by the DMSO species. We described the conditions at which curcumin monomers dominate the structure of solution rather than their clusters. Our finding follow from the COM-COM distribution of curcumin species and a set of auxiliary descriptors. However, a more refined picture for the mechanism of degradation of clusters is necessary. Namely, it would be desirable to complement the present investigation by the description of hydrogen bonding network between different species, its time evolution and the corresponding life times for different solvent compositions. Usually, as documented in the literature, geometric and energetic criteria for H-bond existence can be applied. These types of criteria formally can be developed or mapped to the level of clusters. This non-trivial task requires additional efforts, however. Moreover, we expect that the degradation of clusters can be described in terms of various dynamic properties, e.g., of different auto-correlation functions. Then, more comprehensive insights into the relation between experimental spectroscopic observations and theoretical predictions can be obtained. Description of thermodynamic repercussions, including changes of miscibility and solvation phenomena, should be studied for systems in question as well.
A more sophisticated modelling of the curcumin solutes (in various aspects, e.g., by taking into account the tautomeric equilibrium, stability or instability of the molecule) and of solvent species is undoubtedly necessary. Intuitively, similar trends of behaviour, as we observe in the present work, should be expected for curcumin solutions in water-simple alcohols solvent blends. Then, additional insights into the dependence of behaviour of curcumin solutions on the nature of co-solvent would be reached. These issues are under study in our laboratory.
Acknowledgements
O.P. is grateful to M. Aguilar for technical support of this work at the Institute of Chemistry of UNAM. Fruitful discussions with Dr. Manuel Soriano at the Institute of Chemistry of UNAM during the early stage of this project are gratefully acknowledged. T.P. acknowledges allocation of computer time at the cluster of the Institute for Condensed Matter Physics of NAS of Ukraine and the Ukrainian National Grid.
References
- [1] Bryk T., Haymet A. D. J., Mol. Simul., 2004, 30, 131, doi:10.1080/0892702031000152172.
- [2] Smith E. I., Bryk T., Haymet A. D. J., J. Chem. Phys., 2005, 123, 034706, doi:10.1063/1.1953578.
- [3] Bryk T., Haymet A. D. J., J. Chem. Phys., 2020, 117, 10258, doi:10.1063/1.1519538.
- [4] Druchok M., Bryk T., Holovko M., J. Mol. Liq., 2005, 120, 11, doi:10.1016/j.molliq.2004.07.071.
- [5] Holovko M., Druchok M., Bryk T., J. Chem. Phys., 2005, 123, 154505, doi:10.1063/1.2064582.
- [6] Ghosh S., Banerjee S., Sil P. C., Food Chem. Toxicol., 2015, 83, 111, doi:10.1016/j.fct.2015.05.022.
- [7] Kumar G., Mittal S., Sak K., Tuli H. S., Life Sci., 2016, 148, 313, doi:10.1016/j.lfs.2016.02.022.
- [8] Luthra P. M., Lal N., Eur. J. Med. Chem., 2016, 109, 23, doi:10.1016/j.ejmech.2015.11.049.
-
[9]
Mehanny M., Hathout R. M., Geneidi A. S., Mansour S., J. Controlled Release, 2016, 225, 1,
doi:10.1016/j.jconrel.2016.01.018. - [10] Ngo S. T., Li M. S., Mol. Simul., 2013, 39, 279, doi:10.1080/08927022.2012.718769.
-
[11]
Ucisik M. H., Kupcu S., Schuster B., Sleytr U. B., J. Nanobiotechnol., 2013, 11, 37,
doi:10.1186/1477-3155-11-37. - [12] Lv R., Zhang X., Xing R., Shi W., Zhao H., Li W., Jouyban A., Acree W. E., J. Chem. Thermodyn., 2022, 167, 106718, doi:10.1016/j.jct.2021.106718.
- [13] Cui Z., Yao L., Ye j., Wang Z., Hu Y., J. Mol. Liq., 2021, 338, 116795, doi:10.1016/j.molliq.2021.116795.
- [14] Yu Z. W., Quinn P. J., Biosci. Rep., 1994, 14, 259, doi:10.1007/BF01199051.
- [15] Wright J. S., J. Mol. Struct. THEOCHEM, 2002, 591, 207, doi:10.1016/S0166-1280(02)00242-7.
- [16] Ngo S. T., Li M. S., J. Phys. Chem. B, 2012, 116, 10165, doi:10.1021/jp302506a.
- [17] Varghese M. K., Molecular Dynamics Simulations of Some Nucleic Acids and their Complexes, Ph.D. Thesis, Mahatma Gandhi University, Kottayam, Kerala, India, 2009.
- [18] Wallace S. J., Kee T. W., Huang D. M., J. Phys. Chem. B, 2013, 117, 12375, doi:10.1021/jp406125x.
- [19] Samanta S., Roccatano D., J. Phys. Chem. B, 2013, 117, 3250, doi:10.1021/jp309476u.
- [20] Hazra M. K., Roy S., Bagchi B., J. Chem. Phys., 2014, 141, 18C501, doi:10.1063/1.4895539.
- [21] Sreenivasan S., Alameen M., Krishnakumar S., Vetrivel U., Int. J. Pharm. Pharm. Sci., 2014, 6, 234.
- [22] Yadav I. S., Nandekar P. P., Shrivastava S., Sangamwar A., Chaudhury A., Agarwal S. M., Gene, 2014, 539, 82, doi:10.1016/j.gene.2014.01.056.
- [23] Parameswari A. R., Rajalakshmi G., Kumaradhas P., Chem. Biol. Interact., 2015, 225, 21, doi:10.1016/j.cbi.2014.09.011.
- [24] Priyadarsini K. I., J. Photochem. Photobiol., C, 2009, 10, 81, doi:10.1016/j.jphotochemrev.2009.05.001.
- [25] Bonab M. I., Sardroodi J. J., Ebrahimzadehv A. R., Mehrnejad F., J. Comput. Theor. Nanosci., 2015, 12, 2077, doi:10.1166/jctn.2015.3988.
- [26] Dias Pereira C. I., de Freitas C. F., Lazarotto Braga T., Braga G., Sonchini Goncalves T., Tessaro A. L., Draton Mikcha J. M., Hioka N., Caetano W., Dyes Pigm., 2022, 197, 109887, doi:10.1016/j.dyepig.2021.109887.
- [27] Ilnytskyi J., Patsahan T., Pizio O., J. Mol. Liq., 2016, 223, 707, doi:10.1016/j.molliq.2016.08.098.
- [28] Jorgensen W. L., Maxwell D. S., Tirado-Rives J., J. Am. Chem. Soc., 1996, 118, 11225, doi:10.1021/ja9621760.
- [29] Patsahan T., Ilnytskyi J., Pizio O., Condens. Matter Phys., 2017, 20, 23003, doi:10.5488/CMP.20.23003.
- [30] Patsahan T., Pizio O., Condens. Matter Phys., 2022, 25, 23201, doi:10.5488/CMP.25.23201.
-
[31]
Hamaguchi T., Ono K., Yamada M., CNS Neurosci. Ther., 2010, 16, 285,
doi:10.1111/j.1755-5949.2010.00147.x. - [32] Aguilar M., Dominguez H., Pizio O., Condens. Matter Phys., 2022, 25, 33202, doi:10.5488/CMP.25.33202.
- [33] Cruz Sanchez M., Aguilar M., Pizio O., Condens. Matter Phys., 2020, 23, 34601, doi:10.5488/CMP.23.34601.
- [34] Van der Spoel D., Lindahl E., Hess B., Groenhof G., Mark A. E., Berendsen H. J. C., J. Comput. Chem., 2005, 26, 1701, doi:10.1002/jcc.20291.
- [35] Berendsen H. J. C., Grigera J. R., Straatsma T. P., J. Phys. Chem., 1987, 91, 6269, doi:10.1021/j100308a038.
- [36] Slabber C. A., Grimmer C. D., Robinson R. S., J. Nat. Prod., 2016, 79, 2726, doi:10.1021/acs.jnatprod.6b00726.
- [37] Kolev T. M., Velcheva E. A., Stamboliyska B. A., Spiteller M., Int. J. Quantum Chem., 2005, 102, 1069, doi:10.1002/qua.20469.
- [38] Gujt J., Cazares Vargas E., Pusztai L., Pizio O., J. Mol. Liq., 2017, 228, 71, doi:10.1016/j.molliq.2016.09.024.
- [39] Egorov G. I., Makarov D. M., Russ. J. Phys. Chem. A, 2009, 83, 693, doi:10.1134/S003602440905001X.
- [40] Humphrey W., Dalke A., Schulten K., J. Mol. Graphics, 1996, 14, 33, doi:10.1016/0263-7855(96)00018-5.
Ukrainian \adddialect\l@ukrainian0 \l@ukrainian
Àñïåêòè ìiêðîñêîïiчíî¿ ñòðóêòóðè êóðêóìiíó ó âîäíî-äèìåòèëñóëüôîêñèäíîìó ðîçчèííèêó. Äîñëiäæåííÿ êîìï’þòåðíèì ìîäåëþâàííÿì ìåòîäîì ìîëåêóëÿðíî¿ äèíàìiêè. Ò. Ïàöàãàí, Î. Ïiçiî
Iíñòèòóò ôiçèêè êîíäåíñîâàíèõ ñèñòåì Íàöiîíàëüíî¿ àêàäåìi¿ íàóê Óêðà¿íè
79011, ì. Ëüâiâ, âóë. Ñâєíöiöüêîãî, 1, Óêðà¿íà
Iíñòèòóò ïðèêëàäíî¿ ìàòåìàòèêè òà ôóíäàìåíòàëüíèõ íàóê, Íàöiîíàëüíèé óíiâåðñèòåò ‘‘Ëüâiâñüêà ïîëiòåõíiêà’’, Óêðà¿íà, 79013, Ëüâiâ, âóë. Ñ. Áàíäåðè, 12
Iíñòèòóò õiìi¿, Íàöiîíàëüíèé àâòîíîìíèé óíiâåðñèòåò Ìåõiêî,
Circuito Exterior, 04510, Ìåõiêî, Ìåêñèêà