SN 2022joj: A Potential Double Detonation with a Thin Helium shell
Abstract
We present photometric and spectroscopic data for SN 2022joj, a nearby peculiar Type Ia supernova (SN Ia) with a fast decline rate ( mag). SN 2022joj shows exceedingly red colors, with a value of approximately mag during its initial stages, beginning from days before maximum brightness. As it evolves the flux shifts towards the blue end of the spectrum, approaching mag around maximum light. Furthermore, at maximum light and beyond, the photometry is consistent with that of typical SNe Ia. This unusual behavior extends to its spectral characteristics, which initially displayed a red spectrum and later evolved to exhibit greater consistency with typical SNe Ia. We consider two potential explanations for this behavior: double detonation from a helium shell on a sub-Chandrasekhar-mass white dwarf and Chandrasekhar-mass models with a shallow distribution of . The shallow nickel models could not reproduce the red colors in the early light curves. Spectroscopically, we find strong agreement between SN 2022joj and double-detonation models with white dwarf masses around 1 and thin He-shell between 0.01 and 0.02 . Moreover, the early red colors are explained by line-blanketing absorption from iron-peak elements created by the double detonation scenario in similar mass ranges. However, the nebular spectra composition in SN 2022joj deviates from expectations for double detonation, as we observe strong [Fe III] emission instead of [Ca II] lines as anticipated from double detonation models. More detailed modeling, e.g., including viewing angle effects, is required to test if double detonation models can explain the nebular spectra.
2212-
1 Introduction
Type Ia supernovae (SNe Ia) play a pivotal role in measuring cosmological distances and were instrumental in revealing the acceleration of the universe (Riess et al., 1998; Perlmutter et al., 1999). Furthermore, they are responsible for synthesizing the majority of the iron-group elements (titanium through zinc) found throughout the universe (Iwamoto et al., 1999). Although extensively researched, their progenitor systems continue to be elusive: the nature of the companion star (degenerate Iben & Tutukov 1984; Webbink 1984 or not Whelan & Iben 1973) and the explosion mechanism (surface detonation Bildsten et al. 2007 or core ignited deflagration transitioning to a detonation Khokhlov 1991; Woosley & Weaver 1994) are all subject to debate.
Studies have explored various explosion mechanisms for WDs including a helium detonation on the surface of a sub-Chandrasekhar mass WD. In this scenario, a sub-Chandrasekhar mass WD accumulates He from a helium star (or He WD or C/O WD, which have helium surface layers). This accumulation has the potential to trigger an ignition at the base of the He shell. This has been suggested to be the cause of some faint and fast evolving transients such as Ca-rich transients (Perets et al., 2010). The surface explosion may also drive a shock into the core causing a subsequent detonation (also known as double detonation; Bildsten et al., 2007; Fink et al., 2010; Sim et al., 2012; Shen & Bildsten, 2014). Observables can vary significantly depending on the thickness of the He shell.
One predicted signature from a surface detonation of a thick helium shell ( 0.05 ) is the production of a significant amount of , resulting in extreme UV line blanketing (Kromer et al., 2010; Sim et al., 2012; Polin et al., 2019). However, it was also shown by Sim et al. (2010); Shen et al. (2018a); Townsley et al. (2019); Boos et al. (2021); Shen et al. (2021b) that double detonation models approaching the limiting case of a bare CO WD detonation are capable of roughly reproducing observations of SNe Ia. This is attributed to thin shell detonations mostly producing intermediate mass elements, instead of , and thus have less of an effect on the observables from the underlying core ashes.
In this paper, we discuss the peculiar SNe Ia 2022joj. This object is unique due to the strong reddening in the early spectra and light curves pointing towards a double detonation candidate. This paper is arranged as follows. In §2, we discuss the discovery and observations. In §3, we discuss reddening, light curve and spectral analysis. In §4, we compare the light curves and spectra with double detonation models and variations of distributions. Finally, in §5, we discuss the possible progenitor system and conclude in §6.
2 Discovery and Observations
2.1 Discovery
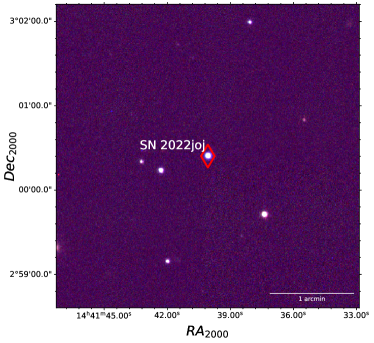
SN 2022joj was discovered by the Zwicky Transient Facility (ZTF; Sánchez-Sáez et al., 2021) on 2022 May 8.3 UT, using the ZTF survey at the Palomar Observatory with a discovery magnitude of 19.1 in the filter (Fremling, 2022). The last non-detection of the same object was on 2022 May 2.34 UT, with a magnitude of 20.25 (Fremling, 2022). An explosion time of 2459705.64 JD (or May 6, 2022) was estimated from a power-law fits with an index of 2 to the light curve in the band from time ranging between May 8 and May 14, 2022. SN 2022joj is located at right ascension and declination shown in Figure 1 and discussed in more detail in Section 5.2.
The Milky Way extinction value mag was adopted from the Schlafly & Finkbeiner (2011) calibration of the Schlegel et al. (1998) dust maps. Newsome et al. (2022) reported a classification on behalf of the Global Supernova Project based on a spectrum acquired on May 11, 2022, at 11.28 UT, using FLOYDS on Las Cumbres Observatory’s (LCO; Brown et al., 2013) Faulkes Telescope North. SN 2022joj was classified as a Type I SN due to its lack of hydrogen, despite its uncertainty due to its spectral peculiarity. These distinctive features include suppression in the blue between 3000 to 5000 and the faint presence of O I.
2.2 Photometry
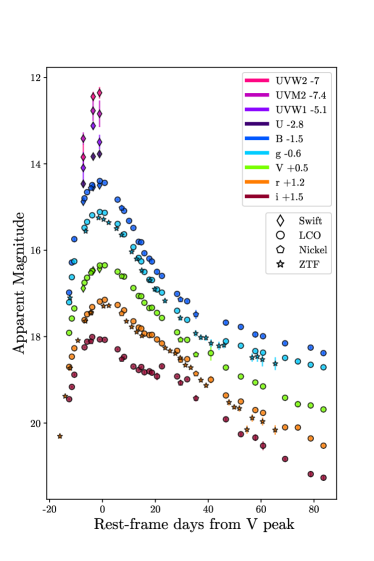
Following the discovery of SN 2022joj, the Global Supernova Project triggered follow up observations and acquired photometry in the BVgri filters using the 1-m telescopes from the LCO global network of telescopes. The data were reduced using lcogtsnpipe (Valenti et al., 2016). The method utilized during the reduction was PSF-fitting photometry. The BV zero points were calculated from the AAVSO Photometric All-Sky Survey (APASS) standard catalogue (Henden et al., 2009), whereas the gri zeropoints were calculated from the Sloan magnitudes of field stars (Albareti et al., 2017). Additional optical photometry was retrieved from the publicly available ZTF survey111https://alerce.online/object/ZTF22aajijjf. In addition, imaging of SN 2022joj was obtained in bands with the 1 m Nickel telescope at Lick Observatory. The images were calibrated using bias and sky flat-field frames following standard procedures. PSF photometry was performed, and photometry was calibrated relative to Pan-STARRS photometric standards (Flewelling et al., 2020). The full light curve is presented in Figure 2. The filters are calibrated to Vega (Bessel, 1990), whereas the are calibrated in the AB magnitude system (Fukugita et al., 1996).
SN 2022joj was observed with the Ultraviolet Optical Telescope (UVOT; Roming et al. 2005) on board the Neil Gehrels Swift Observatory (Gehrels et al., 2004) for 4 epochs, from 2022 May 17.4 until 2022 May 22.7 (–1.0 days from B-band maximum). We performed aperture photometry using a 5-radius circular region with uvotsource within HEAsoft v6.26,222We used the calibration database (CALDB) version 20201008. following the standard guidelines from Brown et al. (2009). By visual inspection, we did not discern any contamination coming from the host galaxy, therefore we deemed unnecessary to perform any template subtraction. We did not detect SN 2022joj in the UV-W1 and UV-M2 filters during the first epoch, suggesting strong obscuration of the bluer part of the SED at early phases, like shown by the classification spectrum.
| Filter | |||
|---|---|---|---|
| B | 2459722.3 | 1.4 | |
| g | 2459722.47 | 1.3 | |
| V | 2459723.8 | 0.85 | |
| r | 2459725.63 | 0.75 | |
| i | 2459721.94 | 0.77 |
2.3 Spectra
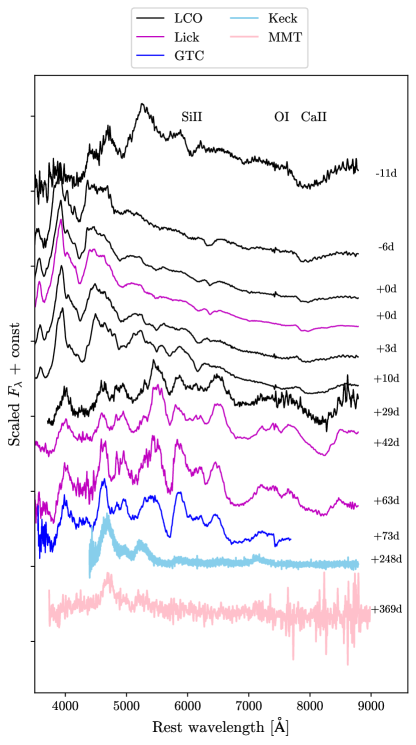
The full spectroscopic data set is shown in Figure 3. A follow-up sequence was initiated from the Global Supernova Project using the FLOYDS spectrographs mounted on the 2m Faulkes Telescope North in Haleakalā, Hawai’i, as well as the Faulkes Telescope South in Siding Spring, Australia. The data were reduced as detailed in Valenti et al. (2013). The redshift was determined by comparing the characteristics of the observed Type Ia supernova using Supernova Identification (SNID) fitting algorithm at maximum light (Blondin & Tonry, 2007). The best match at maximum light was found with SN 2000cx, resulting in a redshift of . The redshift error is related to the width of the correlation peak and the rlap parameter, which is used to quantify the reliability of a given correlation between the input and a template spectrum (Blondin & Tonry, 2007). To get a sense of the dispersion of matches obtained from SNID, we examined the results of 76 potential candidates. Among them, 46 were identified as “good” matches, and those were selected to conduct a statistical analysis. We found the mean redshift to be 0.0225 with a standard deviation of 0.0057. This range is consistent with the best match at maximum light and therefore chosen. All spectra were corrected for Milky Way reddening, mag, as discussed in Section 2.1. We assume the host extinction to be negligible (see Section 5.2).
Multiple optical spectra were obtained from the Kast spectrograph at Lick Observatory, on 2022 May 22, June 29 and July 24. One additional spectrum was obtained from the Gran Telescopio Canarias (GTC), at the Observatorio del Roque de Los Muchachos in La Palma on 2022 August 3, taken with the Optical System for Imaging and low-Intermediate-Resolution Integrated Spectroscopy (OSIRIS). The reduction process was performed using version 1.11.0 of PypeIt (Prochaska et al., 2020)333https://github.com/pypeit/PypeIt. We secured a nebular spectrum from Keck+DEIMOS on 2023 January 17. PypeIt was used for the reduction of this latter. A second nebular spectrum was obtained with MMT+Binospec (Fabricant et al., 2019) on 2023 May 26. This was reduced automatically by the Binospec IDL pipeline (Kansky et al., 2019). Near infrared data (NIR) from Keck taken on 2022 May 14, using the Near-Infrared Echellette Spectrometer (NIRES; Wilson et al., 2004) on the Keck II telescope. The spectrum was reduced using the Spextool software package (Cushing et al., 2004). We also acquired data from Keck Infrared Transient Survey (KITS) collaboration on 2022 June 7 also from NIRES. These findings are visually represented in Figure 3, where the bottom plot showcases the NIRES data, and the top figure displays the optical and nebular data in ascending order.
3 Analysis
3.1 Light Curves and Colors
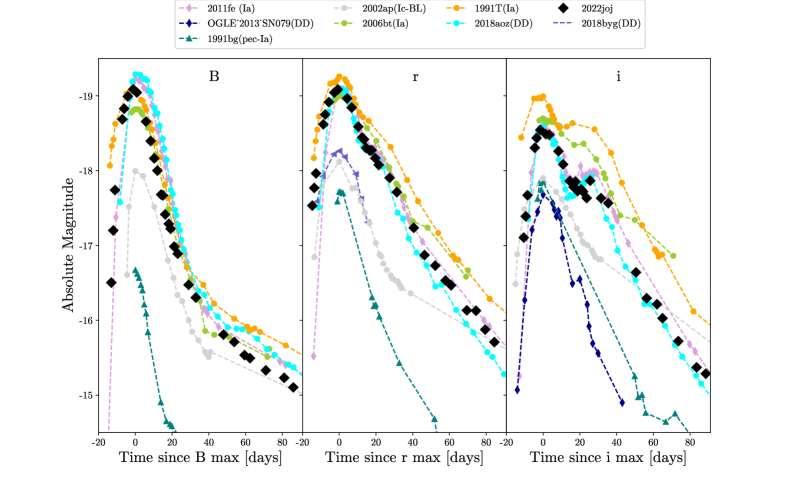
In order to better understand SN 2022joj’s evolution over time, we present a comprehensive comparative light curve analysis (Figure 4). The comparison encompasses the standard Type Ia, subluminous Type Ia examples like SN 1991bg (Filippenko & Richmond M., 1992) and SN 2002es (Ganeshalingam et al., 2012), as well as potential double detonation candidates including SN 2016hnk (Galbany et al., 2019), OGLE 2013 SN 079 (Inserra et al., 2015), SN 2016dsg (Dong et al., 2022), SN 2018aoz (Ni et al., 2022), SN 2018byg (De et al., 2019), and SN 2019eix (Padilla Gonzalez et al., 2023). Additionally, it showcases an atypical broad-line Type Ia, SN 2002bo (O’Brien et al., 2021) and draws a comparison to an energetic Broad-Line Type Ic, SN 2002ap (Mazzali et al., 2002). Note that all SNe are Milky Way and host extinction corrected.
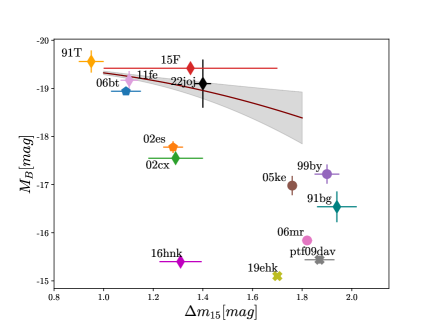
Figure 4 illustrates that SN 2022joj exhibits a similar peak absolute magnitude compared to both the standard SN Type Ia and the double detonation with a thin He-shell candidate, SN 2018aoz. Note that the peak luminosity has high uncertainties of 1 mag, due to the uncertainty of the redshift (and potential unaccounted reddening from host). Additionally, from Figure 5, it is evident that the light curve’s width is typical of SNe Ia behavior. SN 2022joj follows the Phillips relation that links the brightness and decline rate of Type Ia supernovae (Phillips, 1993). Moreover, we observe that the decline rate is swifter than that of SN 2018aoz, indicating a possible less massive progenitor. These diverse observations could also be angle dependent, as discussed in Section 4.
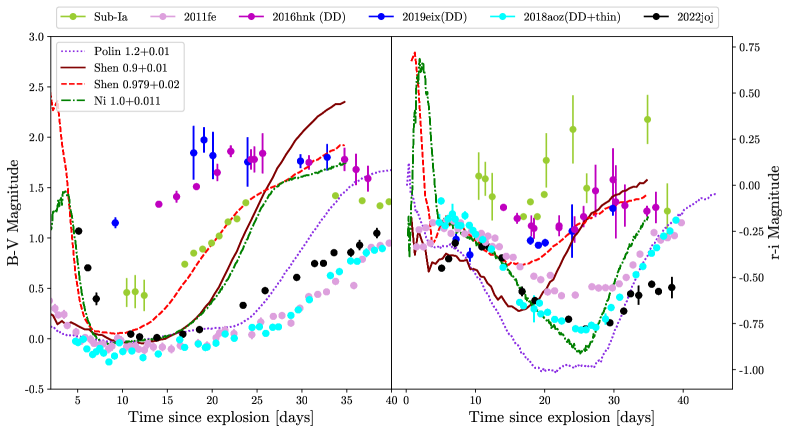
The lightcurves of SN 2022joj, as shown in Figure 4, reveal a subtle secondary maximum in the i band, a characteristic often observed in sub-luminous SNe. This behavior is attributed to their cooler supernova photospheres (Foley et al., 2009; Kasen, 2006), which offer valuable information about the temperature of supernovae. In Figure 8, we compare the color evolution of SN 2022joj with that of typical and atypical SNe Ia, as well as double detonation candidates and models.
3.2 Spectral Analysis
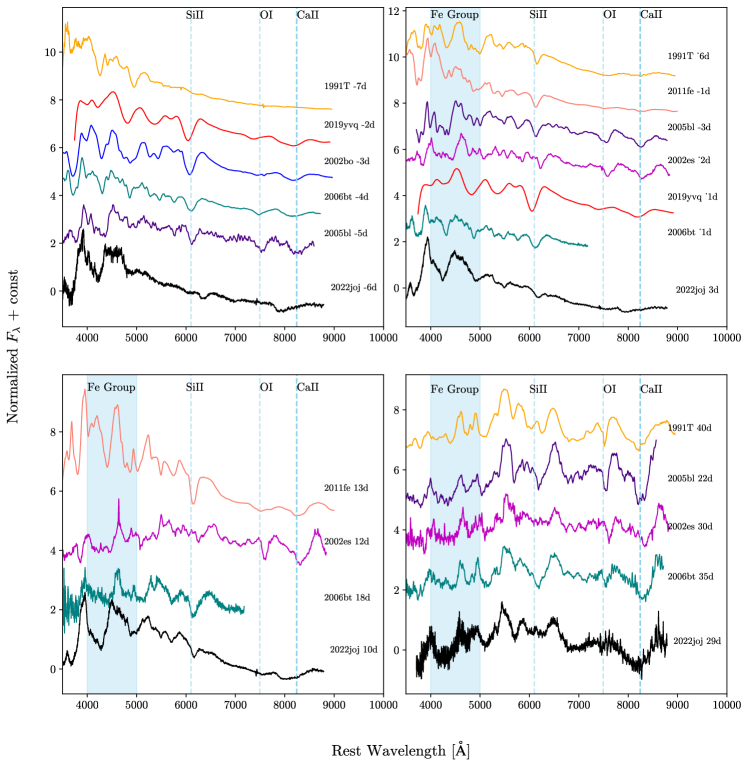
The spectra of SN 2022joj were analyzed in comparison to several distinctive objects, primarily due to its remarkable features apparent in its initial phase. The most prominent of these features was the suppression of the blue wavelengths (Å), setting it apart from other objects as shown in Figure 6. As SN 2022joj evolved, it began to resemble a standard Type Ia. However some features commonly observed in a typical SN Ia, such as the Si II 6355 feature, were not prominent in SN 2022joj. Additionally, we also observe an absorption minimum of the Ca II triplet at a much higher velocity than the other objects throughout its evolution as shown in Figure 6.
SN 2022joj exhibits characteristics “similar” to those of sub-luminous SNe Ia approximately 5 days before reaching maximum brightness (minus the deep Si II 6355 feature and the lack of O I 7777), as evidenced by the presence of Ti II in the range. This could be evidence of a double detonation of a He-shell, since Ti is predicted to be synthesized in the high-velocity outer layers of the ejecta (Fink et al., 2010; Jiang et al., 2017) along with the high velocities of Ca II triplet, resulting from the detonation of the He shell (Fink et al., 2010; Kromer et al., 2010; Moore et al., 2013). Additionally, SN 2022joj appears to have a weak Si II 6355 and unlike the double detonation models, it appears to have a strong C II 6580 as shown in Figure 9. Similarly, in the early epochs, SN 2005bl established a presence of C II, suggesting an overall low burning efficiency with a significant amount of leftover unburned material (Taubenberger et al., 2008). However, Blondin et al. (2018) attributed this feature to absorption by the Mg II 6347 doublet absorption in their sub-Chandrasekhar model.
At around maximum brightness, SN 2022joj continues to resemble sub-luminous SNe Ia spectroscopically. We also notice that the Si II 6355 feature dominates over the C II 6580 feature previously seen. Moreover, SN 2022joj shares a striking resemblance with peculiar SN 2006bt, as both share similarities with those of low-luminosity SNe Ia. Roughly two weeks to a month after maximum light, the Si II 6355 feature remains significantly weaker in SN 2022joj than in SN 2011fe. At the one-month mark after maximum light, SN 2022joj bears a strong resemblance to the sub-luminous SN 2005bl, which displays a broad absorption trough between wavelengths of to Å, resulting from a blend of Fe-group elements dominated by Ti II (Filippenko & Richmond M., 1992; Mazzali et al., 1997).
4 Modeling
We compared SN 2022joj with double detonation models from the existing literature due to its initial spectral peculiarities and color characteristics. We conducted photometric and spectroscopic analyses, comparing SN 2022joj with a variety of models, including those proposed by Kromer et al. (2010), Polin et al. (2019), Shen et al. (2021b), and Ni et al. (2022). In particular, Kromer et al. (2010) investigated the observable properties of double detonation models, which were simulated using 2D radiative transport code ARTIS. These models were initialized with estimated values of temperature, central density of the CO core, and temperature and density at the base of the He layer. An initial He detonation was ignited at a single point at the base of the He shell, eventually creating a shock wave that propagated and converged into the core. The He shell masses in these models, which had previously been considered by Fink et al. (2010), ranged from 0.0035 to 0.0126 and WD masses spanning .
Polin et al. (2019) investigated the explosions of white dwarfs with He shell masses of 0.01, 0.05, and 0.08 and WD masses ranging from 0.6 to 1.2 . Thicker shell models were found to exhibit early time flux excess, redder colors, and higher line blanketing in the UV through the blue regime of the spectrum. To create these 1D models, the authors employed the Eulerian hydrodynamics code Castro. Once the SN ejecta reached homologous expansion, synthetic spectra and light curves were generated using the multi-dimensional time-dependent radiation transport code SEDONA.
The models presented in Boos et al. (2021) and Shen et al. (2021b) utilized two-dimensional sub-Chandrasekhar-mass double detonation models as initial parameters, which were then input into the reactive hydrodynamics code FLASH. To initiate the explosion in each model, a hotspot was placed along the helium shell symmetry axis. This resulted in the helium detonating around the surface to the south pole, generating a shock wave that propagated into the core and ultimately triggered a carbon-core detonation. The explosion parameters in these models varied, with core masses ranging from 0.82 to 1.09 and shell masses between 0.011 and 0.1 . The shell masses were not comprised solely of , but rather were mixed with , , and .
Similar to Polin et al. (2019), Ni et al. (2022) He-shell double detonation 1D models, hydrodynamics, and nucleosynthesis simulations were conducted using Castro and the radiative transfer calculations were conducted using Sedona. The parameter space covered for core masses ranged from 1.0 to 1.1 and the shell masses ranged from 0.01 to 0.012 .
4.1 Light curve model analysis
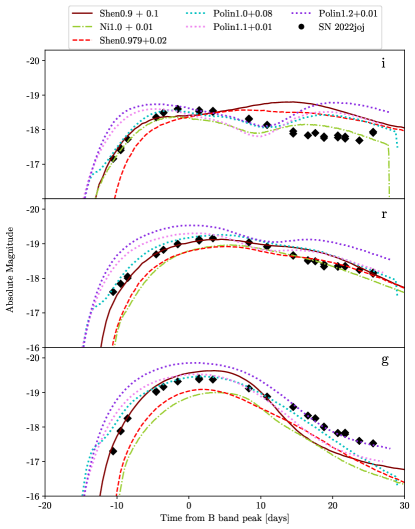
In Figure 7, we plot SN 2022joj light curves in the , , and bands against various double detonation models with thin and thick He shells. We note that the SN 2022joj light curve width and magnitude aligns with several of them, including Shen 0.9+0.1 and Polin 1.0+0.08. However, it is important to note that SN 2022joj has a large uncertainty in its absolute magnitude due to its distance uncertainty. Moreover, models assume local thermal equilibrium (LTE) after maximum leading to additional discrepancies, specifically a too-fast decline in B band magnitude compared to more realistic non-LTE models (Shen et al., 2021b). Additionally, it is interesting to see WD masses in that mass range, since C/O white dwarfs at formation are thought to be limited to a maximum mass of (Dominguez et al., 1999; Girardi et al., 2002; Catalán et al., 2008). The nature of such a massive progenitor is an open question.
One possibility is that it grew by stable surface burning (H or He to C and/or O; Wolf et al., 2013), though how the progenitor could go from stable burning to a helium shell detonation is unclear. A common channel found in binary population synthesis involves stable helium mass transfer from a helium star on a thermal timescale, growing the C/O white dwarf by a couple of tenths of a solar mass. The helium star then evolves into another C/O white dwarf, and their merger can lead to a double detonation event (Ruiter et al., 2013). Another channel could be a hypothesized hybrid C-O-Ne white dwarf (Chen et al., 2014), sometimes invoked as the progenitors of SNe Iax (Meng & Podsiadlowski, 2014). However, the Polin et al. (2019) and Shen et al. (2021b) models did not use C-O-Ne progenitors.
SN 2022joj stands out due to its extreme redness in the early stages. However, as it evolves, it appears to become more similar to a typical Ia such as SN 2011fe. We explored the possibility of a double detonation involving a thin He-shell as shown by Shen et al. (2018a), Townsley et al. (2019), Boos et al. (2021), Shen et al. (2021b), Ni et al. (2022), and Collins et al. (2022) that such events can reproduce typical SN Ia features. In Figure 8, we plot color evolution of SN 2022joj along with double detonation models. Our analysis indicate that SN 2022joj is much redder at early epochs than SN 2011fe. Notably, the Ni 1.0 + 0.01 (referring to a 1.0 WD mass with a helium shell of 0.01 ) and Shen 0.0979+0.02 models, accurately predict the colors of SN 2022joj, despite showing a redder trend slightly earlier than depicted in the observations. However, this can be attributed to the uncertain explosion time of SN 2022joj.
4.2 Spectra model analysis
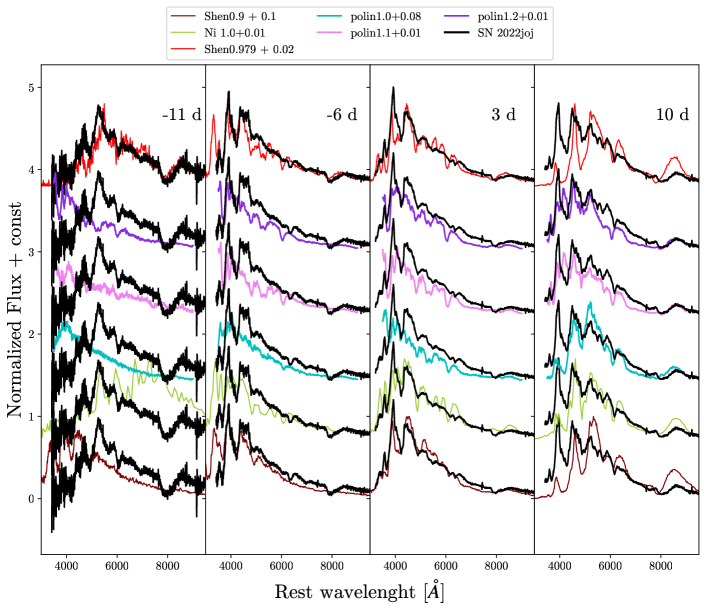
Figure 9 illustrates the spectral profiles of SN 2022joj both before and after reaching maximum brightness, juxtaposed with thin and thick He-shell double detonation models mentioned in the literature. Shen’s 0.9+0.1 and 0.979+0.02 models exhibit striking similarities in spectra with SN 2022joj, including Ti II absorption, a shallow Si II feature, and a lack of O I absorption features ranging from six days before maximum light to maximum light. However, discrepancies after maximum light can be attributed to the models assuming LTE, resulting in lower temperatures and more singly ionized Fe-group material (Shen et al., 2021a). According to Shen et al. (2021b), the Ti II absorption is due to the lower temperatures caused by both the more radially extended distribution of Ti and the lower flux along these lines of sight. Moreover, Shen 0.979+0.02 effectively reproduces the early spectrum at days before maximum light.
Nevertheless, despite Shen’s models considering He mixing in the shell with C, the C II 6580 feature at days before maximum light is not reproduced by their models. This discrepancy might suggest that SN 2022joj contains a significantly higher amount of C in the shell compared to what the models have predicted. By replicating the primary characteristics that distinguish SN 2022joj from typical SN Ia, this model is successful in demonstrating its uniqueness. The differences in the observables of Shen et al. (2021b) to the other models can be attributed to the fact that it was a 2D simulator which can account for various viewing angles. We found that the best viewing angle (, defied as ) that matches SN 2022joj is at for the 0.9+0.1 model and for the 0.979+0.02 model. Notably, is observed in the southern hemisphere where the carbon-core detonation is ignited, while is observed from the northern hemisphere, where the He is ignited. It is important to note that these chosen matches have drastically different shell thicknesses (at opposite lines of sight), which demonstrates the importance of the multidimensional aspect of the double detonation model. Overall, we find that Shen 0.979+0.02 model best matches SN 2022joj spectral peculiarities.
4.3 Nickel Distribution Analysis
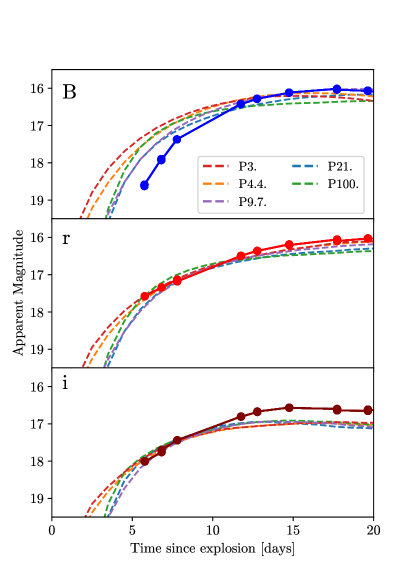
Due to the peculiar colors and brightness illustrated in the light curves, we investigate the effects on various nickel distributions. Magee et al. (2018), found that for a given density, models with extending through the ejecta were brighter and bluer at earlier times than models in which was concentrated. Their models were calculated using TURTLS, a radiative transfer code where the density profile is altered. For each density profile, a series of distributions was used, which decrease towards larger radii as shown in equation 1. The scale parameter s controls how quickly the ejecta transitions from -rich to -poor, where a larger s represents a sharper transition between the two regions. These scaling parameters ranged from 3 to 100 and the masses from 0.4 to 0.8 , covering the expected range for typical SNe Ia (Magee et al., 2020).
| (1) |
In Figure 10, we plotted the best fit models for each scaling parameter with the minimum . From the figure we notice that the lower the scaling parameter the broader and brighter the early light curve is, due to the being farther out than those with a larger scaling parameter (where most of the is close to the core). SN 2022joj has a best fit when the scaling parameter is 9.7. Although the light curves are a decent fit, the band is highly overestimated, indicating that shallower distributions predict bluer colors at the early phases, which is the opposite for SN 2022joj. Therefore, a shallower cannot explain the early colors seen in SN 2022joj.
4.4 NIR analysis
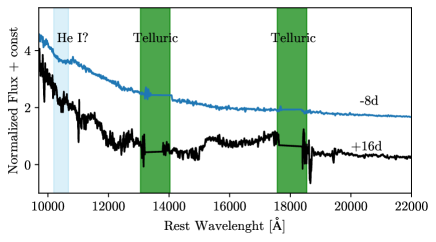
Recent simulations have indicated the presence of unburned helium in both single and double detonations in the outer ejecta (Fink et al., 2010; Shen et al., 2010; Kromer et al., 2010; Sim et al., 2012; Polin et al., 2019; Collins et al., 2022). However, the studies could not fully address the question of whether helium spectral features should form in the models owing to approximations used in the atomic physics in both studies. In Dessart & Hillier (2015), involving non-LTE simulations, it was found that the spectral lines from unburned helium, specifically the He I 10830 line, can be observed in the single detonation. The He I 10830 line exhibits a P-cygni profile and can be visible up to 5 days after the explosion. However, the light curves projected by their model are over 2 magnitudes dimmer than SN 2022joj. This is because the models were formulated for single detonation events, which results in fainter observables.
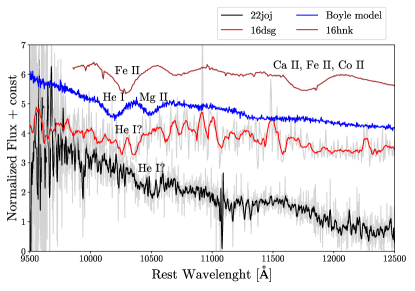
Nonetheless, the He I 10830 line has been explored by Boyle et al. (2017) who found that this line could be observed around maximum light and afterwards. In Figure 11, we show the NIR spectra of SN 2022joj, along with SN 2016dsg (Dong et al., 2022), SN 2016hnk (Galbany et al., 2019), and the high-mass model of Boyle at 26 days after explosion (+7d after maximum light). The purpose of this is to illustrate whether there exists unburned He for these double detonation candidates (SN 2022joj, along with SN 2016dsg, SN 2016hnk). In SN 2016dsg, it is suspected that the He line lies somewhere between 9700-10500 (Dong et al., 2022). On the other hand, for SN 2016hnk, the absorption feature between 9700-10500 is identified as Fe II. Although SN 2022joj seems to be somewhat featureless, there does seem to be a dip around this range that could possibly correspond to the He I feature. This velocity feature appears to be at a lower velocity compared to the model; however, this observation could be influenced by potential Mg II blending. However, a study by Collins et al. (2023), simulated full non-local thermodynamic equilibrium radiative transfer models for a double detonation explosion model. At early epochs (5 days after explosion) they found that the He I 10830 was blended with Mg II 10927. However, this feature separates to form a secondary feature while becoming weaker over time. Therefore, we would expect that this feature found in SN 2022joj would have been separated according to Collins et al. (2023) models.
We also plotted the high-mass models from Boyle et al. (2017) based on a progenitor with a CO core mass of 1.025 , and a helium shell mass of 0.055 . The simulation resulted in 0.03 of unburned helium remaining after the explosion and is plotted in Figure 11. It is not surprising that the He I feature in the simulations from Boyle et al. (2017) is stronger than that in SN 2022joj. This difference can be attributed to their models, which assumed a He-shell of 0.05 , while the best simulations for SN 2022joj assumed a He-shell of 0.02 .
4.5 Nebular model analysis
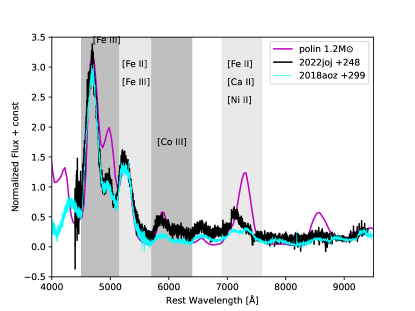
The nebular spectrum is a powerful probe of the internal structure of SNe, including geometric asymmetries in the ejecta. Polin et al. (2021) used the 1D hydrodynamic model SedoNeb which calculates the emissivities of each atomic transition by solving for the temperature, ionization state, and NLTE level populations. They used the Sedona models from Polin et al. (2019) as their input. The 1D models indicate that the prevailing patterns are primarily influenced by the occurrence and arrangement of and . In particular, they found that low-mass double detonation models with only a small mass fraction of Ca produce nebular spectra that cool primarily through forbidden [Ca II] emission. The more massive progenitors produce spectra with strong Fe lines (4500–5600 Å). However, even their brightest double detonation model overproduces [Ca II] 7291, 7323 emission when compared to SNe Ia.
In Figure 12 we show a comparison between SN 2022joj, SN 2018aoz (a double detonation with a thin He-shell candidate), and the modeled double detonation spectra at 150 days after maximum light. Due to the presence of a shallow [Ca II] feature in SN 2022joj, we performed a comparison with the shallowest [Ca II] from the nebular models presented in Polin et al. (2021). It was revealed that these models predict a significantly stronger [Ca II] feature than what was observed for both SN 2022joj and SN 2018aoz as shown in Figure 12. Notably, previous spectroscopic analyses had shown a decent match with Polin 1.2+0.01. Therefore, it was surprising to see the disagreement in the nebular phase. These uncertainties could be attributed to atomic data uncertainties and limitations in the 1D simulations; especially since double detonations observations can be highly viewing angle dependent (Shen et al., 2021b).
5 Discussion
5.1 Implications for SN origins
SN 2022joj appears to obey the Phillips relationship that shows the correlation between brightness of the supernova and the rate of decline (Phillips, 1993). Additionally, SN 2022joj shows peculiarity in its colors and classification spectra. SNe Ia typically show a very blue continuum at these early phases. In SN 2022joj the colors exhibit an exceptional reddening 11 days prior to reaching maximum light, indicating the presence of a layer that absorbs blue light during these initial stages.
When a WD undergoes a double detonation with a thin helium shell, the outer He layer burns to intermediate mass elements, which can produce strong UV line blanketing and cause a suppression in the blue side of the spectrum (Fink et al., 2010; Shen et al., 2010; Kromer et al., 2010; Sim et al., 2012; Polin et al., 2019; Boos et al., 2021; Collins et al., 2022). We compared the light curves, spectra, and colors of these models to SN 2022joj. It is important to note that LTE models after maximum light are much redder than non-LTE due to low temperatures. Therefore, we observe a mismatch in colors and spectra after maximum light, but we include them for completeness Shen et al. (2021a). The modeled spectra (especially at maximum light) agree nicely with our data. We found Shen 0.979+0.02 model to predict reddening at early phases despite having a thin helium shell, it was also the best match spectroscopically to SN 2022joj.
The light curve models do a decent job predicting the luminosity of SN 2022joj in particular Shen 0.9+0.1, although the best spectra model match Shen 0.979+0.02 underpredicts it. Therefore, it is interesting to see that the best light curve model comes from a thick helium shell rather than a thin one like the spectra models. However, part of this discrepancy could be attributed to the uncertainty in the distance to SN 2022joj. From Figure 8, we see that the color evolution of double detonation models, in particular the models by Ni 1.0+0.01 and Shen 0.971+0.02, predict extreme reddening at early epochs, consistent with SN 2022joj. The reddening does seem to happen a few days earlier than in SN 2022joj, but this can also be attributed to uncertainties in the explosion time of SN 2022joj. Overall, the double detonation models do a good job at predicting the spectra and colors before and at maximum light. After maximum light the colors from the models deviate from data. Again, it is important to note that such deviations are in line with expectations, given the underlying assumption of LTE and incorporate models for completeness.
Mixing during a subsonic explosion can yield iron-group elements in the outer shell of the WD that could explain the reddening observed at the early epochs. This was predicted by some Chandrasekhar-mass explosion models, where a white dwarf initially deflagrates subsonically before transitioning into a detonation (Reinecke et al., 2002). Simulations have shown that when deflagrations occur off-center and are asymmetric, they can generate clusters of Fe-peak elements on the surface, which become visible only from certain favorable viewing perspectives (Maeda et al., 2010; Seitenzahl et al., 2013). We compared various distributions to SN 2022joj, but found that shallower predict bluer colors and broader early light curves.
5.2 Remote Location
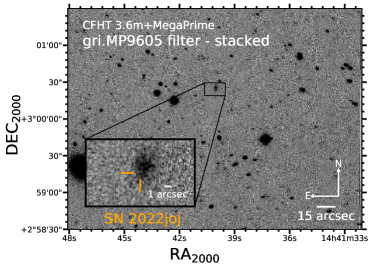
At first glance, SN 2022joj appears to be hostless with no nearby galaxy as shown in Figure 1. We were able to retrieve deep images444The images were obtained from the Canadian Astronomy Data Centre (https://www.cadc-ccda.hia-iha.nrc-cnrc.gc.ca/en/) secured by the Canada France Hawaii Telescope (CFHT), using MegaPrime and their broad single gri filter. The field was observed 6 times over 2 epochs (2017, May 19 and 2021, April 17), and we stacked them in order to achieve a deeper image. The result is shown in Figure 13, where a spacially resolved host galaxy is clearly detected. The host appears to be detected in the Pan-STARRS Legacy Survey, which report a Kron magnitude of 20.8 mag in the -band. This apparent magnitude corresponds to an absolute magnitude of -14.3 mag, based on our estimate distance of SN 2022joj (105.2 Mpc), indicating a small dwarf galaxy (Sabatini et al., 2003).
Interestingly, a few double detonation candidates have been found far from their host galaxies — this is considerable given that there is only a handful of double detonation candidates in literature. Notable examples include OGLE-2013-SN-079 (Inserra et al., 2015), SN 2018byg (De et al., 2019), and SN 2016dsg (Dong et al., 2022). SNe with significant displacements have also been detected in numerous Ca-strong transients. One explanation for these Ca-rich transients (theorized to be single detonations of WDs) is that they originate from high-velocity, kicked systems, and explode at considerable distances from their original location within the host galaxy prior to their occurrences (Lyman et al., 2014).
Some alternative progenitor system with a double detonation include: a hot subdwarf B (sdB) binary with a WD companion (Geier et al., 2013; Kupfer et al., 2022), a WD in a dynamically unstable system where the secondary is a either He WD or a hybrid between He/CO (Guillochon et al., 2010; Pakmor et al., 2013), and a potential outcome is a dynamically driven double degenerate double-detonation () where the companion WD survives explosion and is flung away (Shen et al., 2018b), and a WD accreting mass from a He star (Neunteufel et al., 2016; Polin et al., 2019).
6 Conclusions
We presented photometric and spectroscopic data of SN 2022joj, a peculiar SN Ia. We tested models with shallow nickel distributions and found that they tend to match the brightness of the supernova, but show longer early rise times and brighter early B band flux, contrary to SN 2022joj’s behavior. The double detonation models, in particular models with a thin He-shell, were able to explain the light curve properties of SN 2022joj. Notably, the thin He-shell model offers a more accurate explanation for the spectroscopic features and color evolution observed, in contrast to the thick He-shell model. The double detonation scenario is an attractive explosion mechanism, as it is able to explain the peculiarities of these early observations, especially the early reddening as shown in Figure 8. Nebular and near-infrared spectra also reveal clues for the progenitor of SN 2022joj. However, neither of the spectra disclose whether SN 2022joj truly is a double detonation. In the NIR spectra, it is unclear if there is any unburned He left from the explosion or whether there may be a possible blend between He I and Mg II. The nebular spectra, on the other hand, pose more of a mystery. Based on the Polin et al. (2021) nebular spectra models of double detonations with a thin He-shell, it is expected that the [Ca II] emission feature should be much stronger than observed in SN 2022joj. Moreover, SN 2018aoz does not show a strong [Ca II] either despite being a double detonation candidate. Further modeling is required to test if the double detonation models can explain these objects at all phases, especially nebular observations.
| JD | epoch | B | V | g | r | i |
|---|---|---|---|---|---|---|
| 2459711 | -11 | 18.62 (0.05) | 17.52 (0.04) | 17.92 (0.03) | 17.58 (0.03) | 18.0 (0.03) |
| 2459712 | -10 | 17.90 (0.03) | 17.16 (0.02) | 17.35 (0.01) | 17.34 (0.02) | 17.76 (0.04) |
| 2459713 | -9 | 17.37 (0.04) | 16.94 (0.04) | 16.97 (0.03) | 17.13 (0.03) | 17.44 (0.05) |
| 2459717 | -5 | 16.42 (0.01) | 16.35 (0.01) | 16.19 (0.01) | 16.49 (0.01) | 16.8 (0.01) |
| 2459718 | -4 | 16.28 (0.01) | 16.23 (0.02) | 16.06 (0.01) | 16.36 (0.01) | 16.68 (0.01) |
| 2459720 | -2 | 16.12 (0.01) | 16.08 (0.02) | 15.91 (0.01) | 16.19 (0.01) | 16.56 (0.01) |
| 2459723 | 1 | 16.02 (0.02) | 15.96 (0.02) | 15.81 (0.01) | 16.06 (0.01) | 16.6 (0.02) |
| 2459725 | 3 | 16.07 (0.02) | 15.95 (0.02) | 15.85 (0.01) | 16.03 (0.01) | 16.65 (0.02) |
| 2459730 | 8 | 16.47 (0.02) | 16.1 (0.02) | 16.11 (0.01) | 16.15 (0.01) | 16.86 (0.03) |
| 2459733 | 11 | 16.72 (0.02) | 16.21 (0.02) | 16.35 (0.01) | 16.27 (0.01) | 17.02 (0.02) |
| 2459735 | 12 | 16.95 (0.03) | ||||
| 2459736 | 14 | 17.11 (0.02) | 16.46 (0.02) | 16.64 (0.01) | 16.53 (0.01) | 17.28 (0.02) |
| 2459738 | 16 | 17.44 (0.02) | 16.65 (0.02) | 16.89 (0.01) | 16.68 (0.01) | |
| 2459739 | 16 | 17.33 (0.02) | ||||
| 2459740 | 17 | 17.46 (0.03) | 16.66 (0.02) | 16.97 (0.01) | 16.69 (0.01) | 17.26 (0.03) |
| 2459741 | 18 | 17.69 (0.05) | 16.81 (0.03) | 17.21 (0.02) | 16.85 (0.03) | 17.36 (0.05) |
| 2459743 | 20 | 17.85 (0.04) | 16.91 (0.04) | 17.4 (0.03) | 16.83 (0.02) | 17.39 (0.04) |
| 2459744 | 21 | 17.85 (0.06) | 16.92 (0.04) | 17.39 (0.03) | 16.85 (0.03) | 17.36 (0.06) |
| 2459746 | 23 | 18.09 (0.07) | 17.06 (0.06) | 17.62 (0.04) | 16.94 (0.04) | 17.48 (0.12) |
| 2459748 | 25 | 18.23 (0.03) | 17.16 (0.02) | 17.7 (0.01) | 17.06 (0.07) | 17.26 (0.04) |
| 2459753 | 31 | 18.63 (0.03) | 17.49 (0.02) | 18.13 (0.01) | 17.23 (0.01) | 17.47 (0.02) |
| 2459757 | 35 | 18.81 (0.05) | 17.71 (0.03) | 18.35 (0.03) | 17.4 (0.02) | 17.57 (0.03) |
| 2459767 | 44 | 17.98 (0.17) | 17.88 (0.09) | |||
| 2459772 | 50 | 19.41 (0.09) | 18.3 (0.05) | 18.8 (0.05) | 18.23 (0.05) | 18.56 (0.07) |
| 2459778 | 56 | 19.4 (0.04) | 18.48 (0.04) | 18.91 (0.03) | 18.41 (0.03) | 18.78 (0.06) |
| 2459784 | 62 | 19.62 (0.07) | 18.68 (0.03) | 19.04 (0.03) | 18.56 (0.03) | 18.9 (0.08) |
| 2459787 | 65 | 19.63 (0.03) | 18.74 (0.04) | 19.08 (0.02) | 18.63 (0.02) | 18.99 (0.11) |
| 2459796 | 73 | 19.82 (0.05) | 19.07 (0.04) | 19.19 (0.03) | 18.99 (0.03) | 19.35 (0.05) |
| 2459801 | 78 | 19.17 (0.11) | 19.3 (0.08) | 19.08 (0.08) | ||
| 2459805 | 83 | 19.91 (0.04) | ||||
| 2459806 | 83 | 19.22 (0.04) | 19.36 (0.03) | 19.22 (0.05) | 19.78 (0.1) | |
| 2459810 | 88 | 19.97 (0.04) | 19.31 (0.04) | 19.45 (0.02) | 19.39 (0.03) | |
| 2459811 | 88 | 19.42 (0.04) | 19.84 (0.07) |
| JD | epoch | UV-W2 | UV-M2 | UV-W1 | U | B | V |
|---|---|---|---|---|---|---|---|
| 2459716.88 | -5.42 | ||||||
| 2459720.56 | -1.74 | ||||||
| 2459720.96 | -1.34 | ||||||
| 2459723.25 | 0.95 |
References
- Albareti et al. (2017) Albareti, F., Allende Prieto, C., & Almeida, A. 2017, doi: 10.3847/1538-4365/aa8992
- Astropy Collaboration et al. (2013) Astropy Collaboration, Robitaille, T. P., Tollerud, E. J., et al. 2013, A&A, 558, A33, doi: 10.1051/0004-6361/201322068
- Astropy Collaboration et al. (2018) Astropy Collaboration, Price-Whelan, A. M., Sipőcz, B. M., et al. 2018, AJ, 156, 123, doi: 10.3847/1538-3881/aabc4f
- Bertin & Arnouts (1996) Bertin, E., & Arnouts, S. 1996, A&AS, 117, 393, doi: 10.1051/aas:1996164
- Bessel (1990) Bessel, M. S. 1990, A&AS, 83, 357
- Bildsten et al. (2007) Bildsten, L., Shen, K. J., Weinberg, N. N., & Nelemans, G. 2007, doi: 10.1086/519489
- Blondin et al. (2018) Blondin, S., Dessart, L., & Hillier, D. J. 2018, MNRAS, 474, 3931, doi: 10.1093/mnras/stx3058
- Blondin & Tonry (2007) Blondin, S., & Tonry, J. L. 2007, ApJ, 666, 1024, doi: 10.1086/520494
- Boos et al. (2021) Boos, S. J., Townsley, D. M., Shen, K. J., Caldwell, S., & Miles, B. J. 2021, ApJ, 919, 126, doi: 10.3847/1538-4357/ac07a2
- Boyle et al. (2017) Boyle, A., Sim, S. A., Hachinger, S., & Kerzendorf, W. 2017, A&A, 599, A46, doi: 10.1051/0004-6361/201629712
- Brown et al. (2013) Brown, T., M., Baliber, N., & Bianco, F. 2013, doi: https://doi.org/10.1086/673168
- Brown et al. (2009) Brown, P. J., Holland, S. T., Immler, S., et al. 2009, AJ, 137, 4517, doi: 10.1088/0004-6256/137/5/4517
- Catalán et al. (2008) Catalán, S., Isern, J., García-Berro, E., & Ribas, I. 2008, MNRAS, 387, 1693, doi: 10.1111/j.1365-2966.2008.13356.x
- Chen et al. (2014) Chen, M. C., Herwig, F., Denissenkov, P. A., & Paxton, B. 2014, MNRAS, 440, 1274, doi: 10.1093/mnras/stu108
- Collins et al. (2022) Collins, C. E., Gronow, S., Sim, S. A., & Röpke, F. K. 2022, 517, 5289, doi: 10.1093/mnras/stac2665
- Collins et al. (2023) Collins, C. E., Sim, S. A., Shingles, L. J., et al. 2023, Monthly Notices of the Royal Astronomical Society, 524, 4447, doi: 10.1093/mnras/stad2170
- Coulter et al. (2022) Coulter, D. A., Jones, D. O., McGill, P., et al. 2022, YSE-PZ: An Open-source Target and Observation Management System, v0.3.0, Zenodo, Zenodo, doi: 10.5281/zenodo.7278430
- Coulter et al. (2023) —. 2023, PASP, 135, 064501, doi: 10.1088/1538-3873/acd662
- Cushing et al. (2004) Cushing, M. C., Vacca, W. D., & Rayner, J. T. 2004, PASP, 116, 362, doi: 10.1086/382907
- De et al. (2019) De, K., Kasliwal, M. M., Polin, A., et al. 2019, The Astrophysical Journal Letters, 873, L18, doi: 10.3847/2041-8213/ab0aec
- Dessart & Hillier (2015) Dessart, L., & Hillier, D. J. 2015, MNRAS, 447, 1370, doi: 10.1093/mnras/stu2520
- Dominguez et al. (1999) Dominguez, I., Chieffi, A., Limongi, M., & Straniero, O. 1999, ApJ, 524, 226, doi: 10.1086/307787
- Dong et al. (2022) Dong, Y., Valenti, S., Polin, A., et al. 2022, ApJ, 934, 102, doi: 10.3847/1538-4357/ac75eb
- Fabricant et al. (2019) Fabricant, D., Fata, R., Epps, H., et al. 2019, PASP, 131, 075004, doi: 10.1088/1538-3873/ab1d78
- Ferland et al. (2013) Ferland, G. J., Porter, R. L., van Hoof, P. A. M., et al. 2013, Rev. Mexicana Astron. Astrofis., 49, 137. https://arxiv.org/abs/1302.4485
- Filippenko & Richmond M. (1992) Filippenko, A., & Richmond M., W. 1992, 104, 1543
- Fink et al. (2010) Fink, M., Röpke, F. K., Hillebrandt, W., et al. 2010, A&A, 514, A53, doi: 10.1051/0004-6361/200913892
- Flewelling et al. (2020) Flewelling, H. A., Magnier, E. A., Chambers, K. C., et al. 2020, ApJS, 251, 7, doi: 10.3847/1538-4365/abb82d
- Foley et al. (2009) Foley, R. J., Narayan, G., Challis, P. J., et al. 2009, 708, 1748, doi: 10.1088/0004-637x/708/2/1748
- Fremling (2022) Fremling, C. 2022, Transient Name Server Discovery Report, 2022-1220, 1
- Fukugita et al. (1996) Fukugita, M., Ichikawa, T., Gunn, J. E., et al. 1996, AJ, 111, 1748, doi: 10.1086/117915
- Galbany et al. (2019) Galbany, L., Ashall, C., Höflich, P., et al. 2019, A&A, 630, A76, doi: 10.1051/0004-6361/201935537
- Ganeshalingam et al. (2012) Ganeshalingam, M., Li, W., Filippenko, A. V., et al. 2012, ApJ, 751, 142, doi: 10.1088/0004-637X/751/2/142
- Gehrels et al. (2004) Gehrels, N., Chincarini, G., & Giommi, P. 2004, ApJ, 611, doi: 10.1086/422091
- Geier et al. (2013) Geier, S., Marsh, T. R., Wang, B., et al. 2013, A&A, 554, A54, doi: 10.1051/0004-6361/201321395
- Girardi et al. (2002) Girardi, L., Bertelli, G., Bressan, A., et al. 2002, A&A, 391, 195, doi: 10.1051/0004-6361:20020612
- Guillochon et al. (2010) Guillochon, J., Dan, M., Ramirez-Ruiz, E., & Rosswog, S. 2010, The Astrophysical Journal Letters, 709, L64, doi: 10.1088/2041-8205/709/1/L64
- Henden et al. (2009) Henden, A. A., Welch, D. L., Terrell, D., & Levine, S. E. 2009, in American Astronomical Society Meeting Abstracts, Vol. 214, American Astronomical Society Meeting Abstracts #214, 407.02
- Iben & Tutukov (1984) Iben, I., J., & Tutukov, A. V. 1984, ApJS, 54, 335, doi: 10.1086/190932
- Inserra et al. (2015) Inserra, C., Sim, S. A., Wyrzykowski, L., et al. 2015, ApJ, 799, L2, doi: 10.1088/2041-8205/799/1/L2
- Iwamoto et al. (1999) Iwamoto, K., Brachwitz, F., Nomoto, K., et al. 1999, ApJS, 125, 439, doi: 10.1086/313278
- Jiang et al. (2017) Jiang, J.-A., Doi, M., Maeda, K., et al. 2017, Nature, 550, 80, doi: 10.1038/nature23908
- Kansky et al. (2019) Kansky, J., Chilingarian, I., Fabricant, D., et al. 2019, PASP, 131, 075005, doi: 10.1088/1538-3873/ab1ceb
- Kasen (2006) Kasen, D. 2006, ApJ, 649, 939, doi: 10.1086/506588
- Khokhlov (1991) Khokhlov, A. M. 1991, A&A, 245, 114
- Kromer et al. (2010) Kromer, M., Sim, S. A., Fink, M., et al. 2010, ApJ, 719, 1067, doi: 10.1088/0004-637X/719/2/1067
- Kupfer et al. (2022) Kupfer, T., Bauer, E. B., van Roestel, J., et al. 2022, ApJ, 925, L12, doi: 10.3847/2041-8213/ac48f1
- Lyman et al. (2014) Lyman, J. D., Levan, A. J., Church, R. P., Davies, M. B., & Tanvir, N. R. 2014, Monthly Notices of the Royal Astronomical Society, 444, 2157, doi: 10.1093/mnras/stu1574
- Maeda et al. (2010) Maeda, K., Röpke, F., Fink, M., et al. 2010, The Astrophysical Journal, 712, 624, doi: 10.1088/0004-637X/712/1/624
- Magee et al. (2020) Magee, M. R., Maguire, K., Kotak, R., et al. 2020, A&A, 634, A37, doi: 10.1051/0004-6361/201936684
- Magee et al. (2018) Magee, M. R., Sim, S. A., Kotak, R., & Kerzendorf, W. E. 2018, A&A, 614, A115, doi: 10.1051/0004-6361/201832675
- Mazzali et al. (1997) Mazzali, P., Chugai, N., Turatto, M., et al. 1997, 284, 151
- Mazzali et al. (2002) Mazzali, P. A., Deng, J., Maeda, K., et al. 2002, ApJ, 572, L61, doi: 10.1086/341504
- Meng & Podsiadlowski (2014) Meng, X., & Podsiadlowski, P. 2014, ApJ, 789, L45, doi: 10.1088/2041-8205/789/2/L45
- Moore et al. (2013) Moore, K., Townsley, D. M., & Bildsten, L. 2013, The Astrophysical Journal, 776, 97, doi: 10.1088/0004-637X/776/2/97
- Neunteufel et al. (2016) Neunteufel, P., Yoon, S. C., & Langer, N. 2016, A&A, 589, A43, doi: 10.1051/0004-6361/201527845
- Newsome et al. (2022) Newsome, M., Li, W., Burke, J., et al. 2022, Transient Name Server Classification Report, 2022-1274, 1
- Ni et al. (2022) Ni, Y. Q., Moon, D.-S., Drout, M. R., et al. 2022, Nature Astronomy, 6, 568, doi: 10.1038/s41550-022-01603-4
- O’Brien et al. (2021) O’Brien, J. T., Kerzendorf, W. E., Fullard, A., et al. 2021, ApJ, 916, L14, doi: 10.3847/2041-8213/ac1173
- Padilla Gonzalez et al. (2023) Padilla Gonzalez, E., Howell, D. A., Burke, J., et al. 2023, The Astrophysical Journal, 953, 25, doi: 10.3847/1538-4357/acdd6a
- Pakmor et al. (2013) Pakmor, R., Kromer, M., Taubenberger, S., & Springel, V. 2013, ApJ, 770, L8, doi: 10.1088/2041-8205/770/1/L8
- Perets et al. (2010) Perets, H., Gal-Yam, A., & Mazzali, P. 2010, doi: https://doi.org/10.1038/nature09056
- Perlmutter et al. (1999) Perlmutter, S., Aldering, G., Goldhaber, G., et al. 1999, ApJ, 517, 565, doi: 10.1086/307221
- Phillips (1993) Phillips, M. M. 1993, The Astrophysical Journal, 413, doi: 10.1086/186970
- Polin et al. (2019) Polin, A., Nugent, P., & Kasen, D. 2019, ApJ, 873, 84, doi: 10.3847/1538-4357/aafb6a
- Polin et al. (2021) Polin, A., Nugent, P., & Kasen, D. 2021, The Astrophysical Journal, 906, 65, doi: 10.3847/1538-4357/abcccc
- Prochaska et al. (2020) Prochaska, J. X., Hennawi, J. F., Westfall, K. B., et al. 2020, Journal of Open Source Software, 5, 2308, doi: 10.21105/joss.02308
- Reinecke et al. (2002) Reinecke, M., Hillebrandt, W., & Niemeyer, J. C. 2002, A&A, 391, 1167, doi: 10.1051/0004-6361:20020885
- Riess et al. (1998) Riess, A. G., Filippenko, A. V., Challis, P., et al. 1998, AJ, 116, 1009, doi: 10.1086/300499
- Roming et al. (2005) Roming, P., W., Kennedy, T., E., & Mason, K., M. 2005, SSRv, 120, doi: 10.1007/s11214-005-5095-4
- Ruiter et al. (2013) Ruiter, A. J., Sim, S. A., Pakmor, R., et al. 2013, MNRAS, 429, 1425, doi: 10.1093/mnras/sts423
- Sabatini et al. (2003) Sabatini, S., Roberts, S., & Davies, J. 2003 (Dordrecht: Springer Netherlands), 97–106, doi: 10.1007/978-94-010-0107-6_13
- Sánchez-Sáez et al. (2021) Sánchez-Sáez, P., Reyes, I., Valenzuela, C., et al. 2021, AJ, 161, 141, doi: 10.3847/1538-3881/abd5c1
- Schlafly & Finkbeiner (2011) Schlafly, E. F., & Finkbeiner, D. P. 2011, The Astrophysical Journal, 737, 103, doi: 10.1088/0004-637X/737/2/103
- Schlegel et al. (1998) Schlegel, D. J., Finkbeiner, D. P., & Davis, M. 1998, The Astrophysical Journal, 500, 525, doi: 10.1086/305772
- Seitenzahl et al. (2013) Seitenzahl, I. R., Ciaraldi-Schoolmann, F., Röpke, F. K., et al. 2013, MNRAS, 429, 1156, doi: 10.1093/mnras/sts402
- Shen & Bildsten (2014) Shen, K., J., & Bildsten, L. 2014, doi: 10.1088/0004-637X/785/1/61
- Shen et al. (2018a) Shen, K., J., Kasen, D., & Miles, B., J. 2018a, doi: 10.3847/1538-4357/aaa8de
- Shen et al. (2010) Shen, K., J., Kasen, D., & Weinberg, N., N. 2010, ApJS, 715, 767, doi: 10.1088/0004-637X/715/2/767
- Shen et al. (2021a) Shen, K. J., Blondin, S., Kasen, D., et al. 2021a, ApJ, 909, L18, doi: 10.3847/2041-8213/abe69b
- Shen et al. (2021b) Shen, K. J., Boos, S. J., Townsley, D. M., & Kasen, D. 2021b, ApJ, 922, 68, doi: 10.3847/1538-4357/ac2304
- Shen et al. (2018b) Shen, K. J., Boubert, D., Gänsicke, B. T., et al. 2018b, ApJ, 865, 15, doi: 10.3847/1538-4357/aad55b
- Sim et al. (2012) Sim, S., A., Fink, M., & Kromer, M. 2012, MNRAS, 420, 3003, doi: 10.1111/j.1365-2966.2011.20162.x
- Sim et al. (2010) Sim, S. A., Röpke, F. K., Hillebrandt, W., et al. 2010, doi: 10.1088/2041-8205/714/1/L52
- Taubenberger et al. (2008) Taubenberger, S., Hachinger, S., Pignata, G., et al. 2008, MNRAS, 385, 75, doi: 10.1111/j.1365-2966.2008.12843.x
- Townsley et al. (2019) Townsley, D. M., Miles, B. J., Shen, K. J., & Kasen, D. 2019, ApJ, 878, L38, doi: 10.3847/2041-8213/ab27cd
- Valenti et al. (2016) Valenti, S., Howell, D., A., & Stritzinger, M., L. 2016, doi: doi:10.1093/mnras/stw870
- Valenti et al. (2013) Valenti, S., Yuan, F., & Taubenberger, S. 2013, doi: doi:10.1093/mnras/stt1983
- Webbink (1984) Webbink, R. F. 1984, ApJ, 277, 355, doi: 10.1086/161701
- Whelan & Iben (1973) Whelan, J., & Iben, Icko, J. 1973, ApJ, 186, 1007, doi: 10.1086/152565
- Wilson et al. (2004) Wilson, J. C., Henderson, C. P., Herter, T. L., et al. 2004, in Society of Photo-Optical Instrumentation Engineers (SPIE) Conference Series, Vol. 5492, Ground-based Instrumentation for Astronomy, ed. A. F. M. Moorwood & M. Iye, 1295–1305, doi: 10.1117/12.550925
- Wolf et al. (2013) Wolf, W. M., Bildsten, L., Brooks, J., & Paxton, B. 2013, The Astrophysical Journal, 777, 136, doi: 10.1088/0004-637X/777/2/136
- Woosley & Weaver (1994) Woosley, S. E., & Weaver, T. A. 1994, ApJ, 423, 371, doi: 10.1086/173813